GIS and Emergency Management in Indian Ocean Earthquake/Tsunami Disaster - An ESRI White Paper May 2006
←
→
Page content transcription
If your browser does not render page correctly, please read the page content below
GIS and Emergency Management in
Indian Ocean Earthquake/Tsunami Disaster
                                An ESRI ® White Paper • May 2006

  ESRI 380 New York St., Redlands, CA 92373-8100, USA • TEL 909-793-2853 • FAX 909-793-5953 • E-MAIL info@esri.com • WEB www.esri.com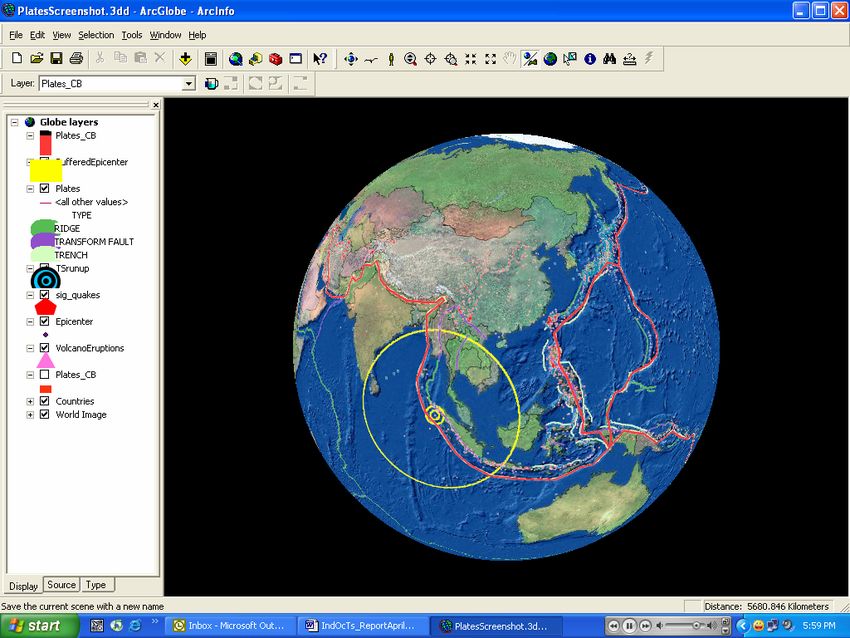
Copyright © 2006 ESRI
All rights reserved.
Printed in the United States of America.

The information contained in this document is the exclusive property of ESRI. This work is protected under United States
copyright law and other international copyright treaties and conventions. No part of this work may be reproduced or
transmitted in any form or by any means, electronic or mechanical, including photocopying and recording, or by any
information storage or retrieval system, except as expressly permitted in writing by ESRI. All requests should be sent to
Attention: Contracts and Legal Services Manager, ESRI, 380 New York Street, Redlands, CA 92373-8100, USA.

The information contained in this document is subject to change without notice.

                              U.S. GOVERNMENT RESTRICTED/LIMITED RIGHTS
Any software, documentation, and/or data delivered hereunder is subject to the terms of the License Agreement. In no event
shall the U.S. Government acquire greater than RESTRICTED/LIMITED RIGHTS. At a minimum, use, duplication, or
disclosure by the U.S. Government is subject to restrictions as set forth in FAR §52.227-14 Alternates I, II, and III (JUN
1987); FAR §52.227-19 (JUN 1987) and/or FAR §12.211/12.212 (Commercial Technical Data/Computer Software); and
DFARS §252.227-7015 (NOV 1995) (Technical Data) and/or DFARS §227.7202 (Computer Software), as applicable.
Contractor/Manufacturer is ESRI, 380 New York Street, Redlands, CA 92373-8100, USA.

ESRI, the ESRI globe logo, ArcGIS, ArcView, Maplex, ArcIMS, ArcGlobe, ArcMap, ArcWeb, MapObjects, ArcObjects,
ArcSDE, Geography Network, www.geographynetwork.com, ArcExplorer, ArcCatalog, ArcInfo, www.esri.com, and
@esri.com are trademarks, registered trademarks, or service marks of ESRI in the United States, the European Community,
or certain other jurisdictions. Other companies and products mentioned herein are trademarks or registered trademarks of
their respective trademark owners.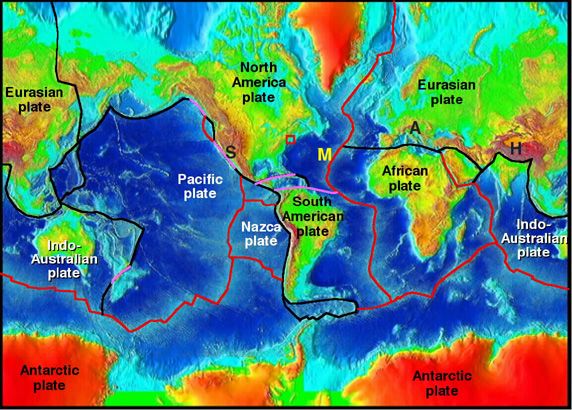
J-9543

         GIS and Emergency Management
         in Indian Ocean Earthquake/
         Tsunami Disaster
         An ESRI White Paper

         Contents                                                                                                   Page

         Executive Summary ..............................................................................             1

         Introduction...........................................................................................      3

         Objectives .............................................................................................     4

         Tsunami Hazard ....................................................................................          5
            What Is Tsunami Hazard?...............................................................                    5
            What Is the Mechanism behind an Earthquake That
             Triggers a Tsunami? .....................................................................                7
            Which Areas Are at Risk?...............................................................                   8

         Managing Disasters............................................................................... 10
           What Can Be Done?........................................................................ 10

         Technology Used in Emergency Management .....................................                               11
            Technology Used in Rescue and Recovery ....................................                              11
            Is There Sufficient Financial Aid to Deploy Technology?.............                                     13
            Organizations and Their Technology Implementations..................                                     14
            Barriers and Issues in Technology Deployment .............................                               20
            Possible Technology Implementations for the Region ...................                                   22

         Lessons Learned.................................................................................... 25

         Conclusion ............................................................................................ 28

         Appendixes

         Appendix A........................................................................................... 29
         Appendix B ........................................................................................... 31
         Appendix C ........................................................................................... 33

         ESRI White Paper                                                                                                 i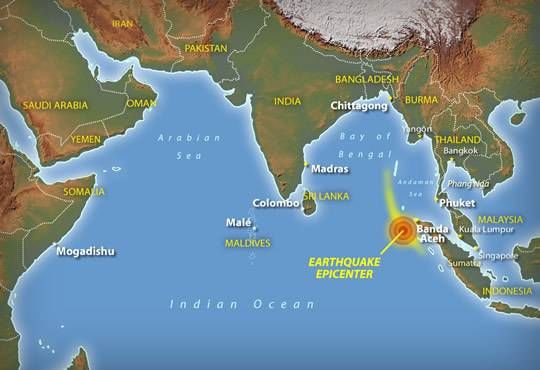
GIS and Emergency Management in Indian Ocean Earthquake/Tsunami Disaster
J-9543
Contents Page
Appendix D........................................................................................... 34
Appendix E ........................................................................................... 35
List of Figures
Figure 1—Indian Ocean and the Epicenter of the
Earthquake on December 26, 2004..................................................... 3
Figure 2—Wave Height Rising as It Approaches the Shore ................ 6
Figure 3—Three Types of Plate Boundaries—Transform,
Convergent, and Divergent ................................................................. 7
Figure 4—Global Topography and Plate Tectonics ............................. 8
Figure 5—Disaster Management Cycle: Predisaster,
During, and Postdisaster Phases ......................................................... 10
Figure 6—MapAction and Its Technology Usage Diagram ................. 23
Figure 7—The Commandmap Project Enables Advanced
Technology to Be Used in Emergency Management ......................... 24
Figure A-1—The Relief Activity Map for the Indian Ocean
Earthquake/Tsunami Disaster ............................................................. 30
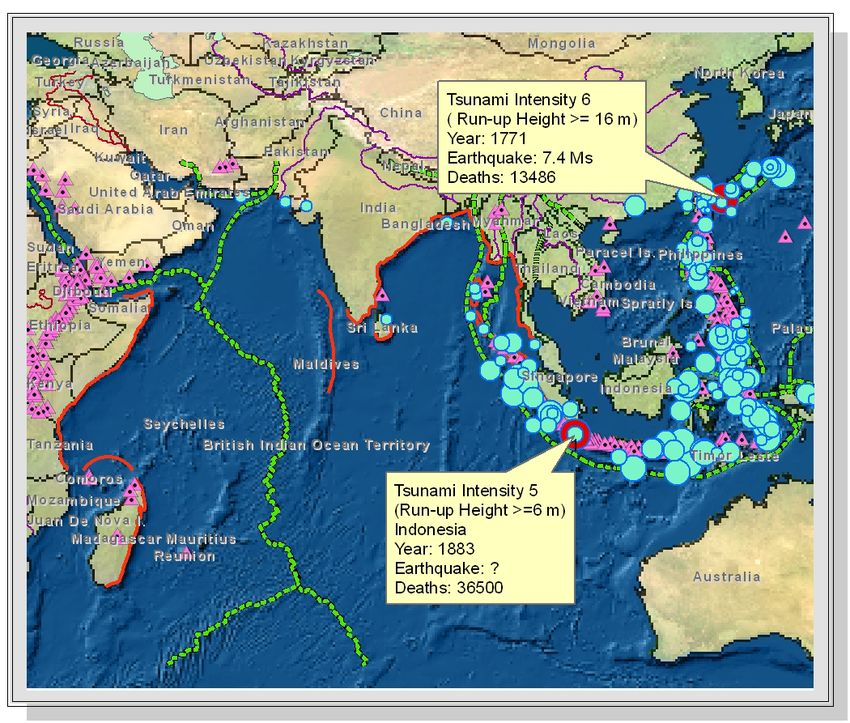
Figure B-1—Tsunami Intensity Map for the Indian Ocean
and Surrounding Areas (Years 416–2004) ......................................... 32
Figure C-1—Poster Designed for Information at a Glance .................. 33
Figure D-1—The Screen Shot of the Map Project That
Shows the Plate Boundaries, Epicenter, and Significant
Earthquakes......................................................................................... 34
List of Tables
Table 1—Casualty Statistics. ................................................................ 3
Table 2—Tsunami Disaster Effects on the Earth's Surface,
Infrastructure, and Agriculture............................................................ 6
Table 3—The Deadliest Tsunamis 1400 BC–2004 AD ....................... 9
Table 4—Summary of Technology Usage in Disaster Area ................ 12
Table 5—Aid Types and Amounts ....................................................... 13
Table 6—Active International and Local NGOs in the Disaster
Region. ................................................................................................ 15
May 2006 ii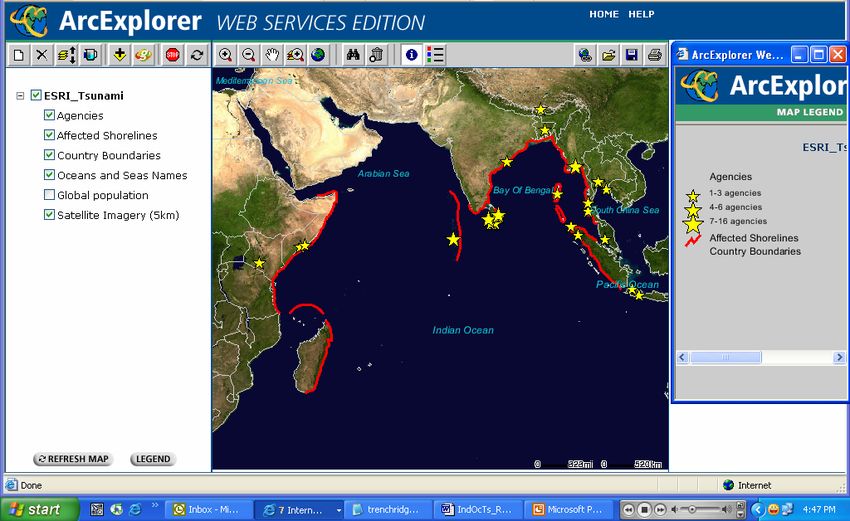
J-9543

                     GIS and Emergency Management
                     in Indian Ocean Earthquake/
                     Tsunami Disaster
 Executive Summary   This white paper addresses the utility of geographic information system
                     (GIS) technology in support of the Indian Ocean tsunami relief efforts.
                     ESRI, the world leader in GIS technology, continues to respond and
                     support efforts of humanitarian aid and assistance associated with this
                     event.
                     Through the course of response and recovery, ESRI served as a facilitator of information.
                     First, it provided contact through its worldwide network of distributors in support of a
                     multitude of GIS users who responded in rescue and rehabilitation missions. In addition,
                     ESRI expanded its Web server, providing technical information, data, and pertinent map
                     products.

                     Geospatial information remains a key element in disaster management. Investments in
                     planning and preparedness affect the ability of agencies and aid organizations to respond,
                     especially when time is critical. The enormity and the reach of the tsunami event
                     illustrate the challenges of data acquisition, integration, and sharing across jurisdictions
                     and varying data systems. Interoperability remains a vital issue that was amplified by
                     social and political differences. In spite of best efforts, the full potential of GIS was not
                     realized in this event, and ESRI will continue to develop solutions for quick deployment
                     and adaptation under emergency conditions.

                     This paper describes the event, responses, and attempts to underscore the challenges of
                     data sharing in a dynamic environment. In this case, lessons learned can make a
                     difference when lives literally hang in the balance.

                     The Indian Ocean earthquake/tsunami disaster once more reinforced the global
                     vulnerability to hazards. This complex, dynamic, and multidisciplinary event allowed the
                     assessment of the technological approaches for disasters. Within these approaches, GIS
                     is one of the high-end technologies that can help save lives and property. To better
                     address its role, ESRI wanted to know how GIS is being used for humanitarian efforts in
                     response to this disaster. Hence, this paper attempts to identify how GIS technology
                     supported rescue and recovery efforts as well as continues to support rehabilitation
                     efforts.

                     Since this disaster affected many countries and the world's economy, it can be deduced
                     that the problems encountered were diverse. One main problem was that the technology
                     level differed dramatically from country to country. Some countries made relatively
                     good use of GIS, but some could not. Other problems were lack of data, data sharing,
                     communication, and standardization. These problems also created duplication of data.
                     Moreover, accessing data and up-to-date information was difficult and slow. Political
                     obstacles in the government structure and lack of collaboration between agencies
                     worsened the situation.

                     The hardware used was mainly computers, laptops, mobile phones, global positioning
                     system (GPS) units, and tabular forms. The GIS software used was ESRI® ArcGIS® 9

                     ESRI White Paper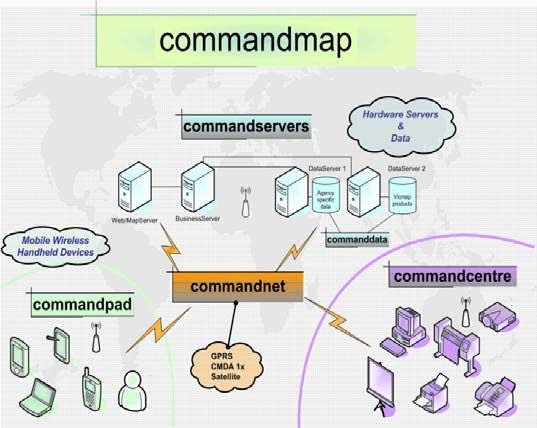
GIS and Emergency Management in Indian Ocean Earthquake/Tsunami Disaster
J-9543
and ArcView® 3.x and products from MapInfo® and ERDAS®. In particular, Maplex™
and the Military Analyst extension for ArcGIS 9 were used. Topography, census, roads,
utilities, bathymetry, elevation, geology, land cover, landmarks, hydrology,
administrative boundaries, tidal datum, and orthophoto are examples of data types
utilized. Ground control points (GCP) were collected for new geodetic investigations.
LandScan (population data), Shuttle Radar Topography Mission (SRTM), Digital Terrain
Elevation Data (DTED) Levels 1 and 2, QuickBird™, IKONOS®, and SPOT® were
utilized for remote-sensing (RS) analysis. Interactive maps (ArcIMS®, Manifold, DM
Solutions), static maps, and Eroom® and Groove technology as well as information
sharing were some of the uses of the Internet. This list of hardware, software, data, and
Internet usage was compiled using questionnaires and Internet sources and shows the
extent of GIS usage. GIS has many advantages, but it was not utilized as it could have
been in the disaster region.
The lessons learned from a GIS perspective are
The database should be ready beforehand.
The imagery database should be kept up to date.
The GIS technology usage level should be more advanced to make better use of its
capabilities.
Country-based sociopolitical issues should be handled with care when implementing
actions, especially for the recovery phase.
Government, private, and local agencies accompanied by international agencies
should collaborate closely for emergency actions and employ GIS.
International, national, and local agencies should go beyond investing in crucial life
support and invest in GIS.
ESRI should consider some developments for emergency situations such as
A special emergency installation package
Merging different versions of the software
Common workspace environment
A special emergency installation package would be supportive due to the problems
encountered during field use of the software. Quick installation and a tutorial on using
the Data Interoperability extension would enable relief workers to start working more
rapidly. The emergency package could also include a business partner's products such as
GPS units. Another important issue is the system integration between different versions
of the software. A workspace environment in which GIS data sharing and
communication is possible would also be useful. This will create solutions for the
problems experienced in this disaster as well as future ones.
In conclusion, it is important to be prepared and mitigate the disaster before it occurs.
Decision makers should take into account the current situation and work closely with
scientists to implement the required policies. Since disasters have no boundaries,
international collaboration and enhancement of technology usage should be the first
steps. As for ESRI, showing the best practices of GIS utilization and promoting its usage
are key issues.
May 2006 2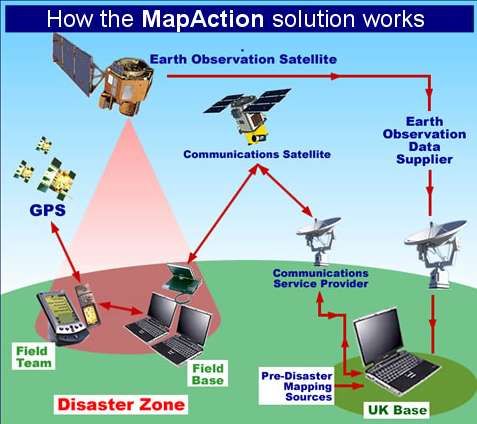
GIS and Emergency Management in Indian Ocean Earthquake/Tsunami Disaster
J-9543

         Introduction   On December 26, 2004, at 00:58:53 UTC, a magnitude 9 earthquake hit the Sumatra
                        Andaman islands in the Indian Ocean (figure 1). The earthquake caused a secondary
                        hazard, a tsunami, which amplified tremendously the casualties and property loss. The
                        waves reached 18 meters in height and extended 8,000 kilometers from the quake's
                        epicenter.

                        Tsunami is a Japanese word for harbor waves and refers to the natural phenomenon of a
                        series of waves generated when water in a lake or sea is rapidly displaced on a massive
                        scale. Earthquakes, landslides, volcanic eruptions, and the impact of extraterrestrial
                        bodies such as meteorites can generate tsunamis, which can rapidly and violently
                        inundate coastlines, causing devastating property damage, injuries, and loss of life. 1

                                                                       Figure 1

                                 Indian Ocean and the Epicenter of the Earthquake on December 26, 2004

                        The Indian Ocean earthquake/tsunami was one of the biggest catastrophes in history. The
                        areas most affected were Indonesia, Malaysia, Sri Lanka, India, and Thailand,
                        respectively. Following are disaster-related statistics as of November 2005. 2

                                                                     Table 1

                                                             Deaths = 186,983
                                                            Missing = 42,883
                                                           Homeless = 1.7 million

                                               Casualty Statistics

                        As of February 24, 2005, the worldwide insurance company Munich Re estimates the
                        overall economic loss at more than $10 billion * and the insured loss at approximately

                        1
                          Tsunami (http://en.wikipedia.org/wiki/Tsunami).
                        2
                          UN Office of the Special Envoy for Tsunami Recovery (www.tsunamispecialenvoy.org).
                        *
                          All dollar amounts are U.S. dollars unless noted otherwise.

                        ESRI White Paper                                                                          3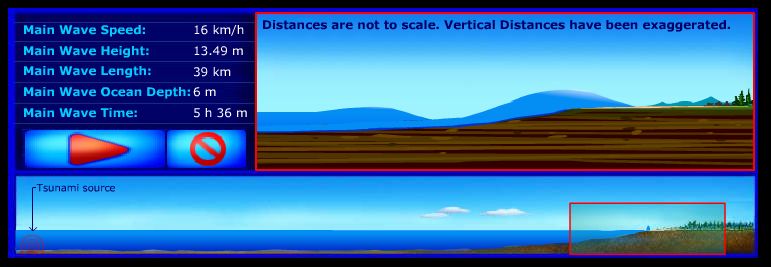
GIS and Emergency Management in Indian Ocean Earthquake/Tsunami Disaster
                                                                                                                      J-9543

                            $1–2 billion. International donors acted quickly with a great amount of donations. Of
                            the $10 billion appeal, 70 percent have already been raised. Furthermore, a total of
                            $6.4 billion in government aid, $1.7 billion in private aid, and $1.7 billion in loans has
                            been donated to the affected countries. 3 Such a large amount of donations coupled with
                            a complex situation made it imperative that monies be distributed equitably according to
                            need.

                            With the high death toll and large amount of donations received, effective disaster
                            management has been crucial. To deal with this issue, not only basic activities (such as
                            providing lifesaving supplies) but also technological solutions should be used. In these
                            circumstances, GIS technology has become more important than before to disaster
                            management issues. The ability to provide answers to vital questions, such as where the
                            most affected areas are and how they can be reached, saves time in an emergency
                            situation.

                            In the first few weeks following the disaster, the technological data provided from all
                            over the world for the disaster area was sparse and unorganized. Many organizations
                            wasted valuable time in duplicating preliminary and critical data such as damage maps.
                            Because of a lack of coordination, some of the information released that could have
                            supported other organizations in solving a problem was not used. The need to produce
                            new data was significant. All these problems underscore the need for information
                            management. Emergency management requires both static and dynamic information in
                            different stages of an emergency. Ideally, GIS in its best practices should be used in both
                            phases. This paper addresses GIS usage in humanitarian efforts and focuses on both
                            stages of emergency management—response and recovery.

            Objectives      The objectives of this white paper include the following:

                            1.     Identify how GIS technology has supported rescue and recovery efforts as well as
                                   continues to support rehabilitation efforts.

                            2.     Identify where these implementations of technology are occurring.

                            3.     Provide a report on each deployment that includes

                                   a.    The organizations or agencies deploying the technology, denoting a contact
                                         person whenever possible

                                   b.    The mission they are supporting and the tasks they are attempting to complete
                                         i. Identify the key mapping products used to support the mission.

                                   c.    The technology that is being used
                                         i. Software
                                         ii. Hardware
                                         iii. Data
                                         iv. Web services

                                   d.    Screen shots and photographs if available

                            4.     Identify barriers and issues in technology deployments.

                            3
                                Reuters, January 11, 2005.

                            May 2006                                                                                      4
GIS and Emergency Management in Indian Ocean Earthquake/Tsunami Disaster
J-9543
5. Describe and expand upon issues/problems and barriers that were pervasive or
common within the overall affected areas.
6. Describe what GIS data and products were important to the rescue and recovery
efforts.
7. Describe GIS data and products not available that would have been useful.
8. Describe how technology could assist in preventing catastrophic loss of life and
property for this region of the world.
The following were used to gather information:
Internet
Questionnaires
Conference calls
ESRI network
ESRI data relating to the disaster
The collected information enabled the creation of the following products:
A poster map that shows the disaster area with relief organization locations
An online, interactive map with the same information (using ArcIMS)
A tsunami intensity map for the Indian Ocean and surrounding area
An ArcGlobe™ map project showing the plate boundaries for tsunami risk areas
Text files
GIS data
Tsunami Hazard
What Is Tsunami Tsunamis are large, long water waves caused by underwater earthquakes, submarine
Hazard? volcanic eruptions, or the impact of extraterrestrial bodies such as meteorites or
landslides. As a tsunami approaches the shoreline, the enormous amount of energy that
has been stored in the long wavelength is transferred to wave height with terrible
consequences (figure 2). In particular, gulfs, bays, and estuaries are some of the most
vulnerable coastlines. The shape of these inlets creates a funnel-shaped tsunami that
amplifies into a big wall of water weighing billions of tons that crashes inland with
enormous power. 4 The term run-up refers to the height of the tsunami measured above
mean sea level. Additionally, tsunamis are generally not only a single wave but a series
of waves. The first one to reach the coastline is the highest. The series of waves creates
more damage than a single one. Hence, the structures and people able to escape the first
wave are at risk from following waves.
4
Kovach, R., and McGuire, B. 2003. Guide to Global Hazards.
ESRI White Paper 5GIS and Emergency Management in Indian Ocean Earthquake/Tsunami Disaster
J-9543
Figure 2
Wave Height Rising as It Approaches the Shore
In figure 2, close to the tsunami source, the wavelength is longer and the height is lower
compared to the wave properties closer to the shoreline. The energy released causes
great wave heights. When a wave reaches the shore, it destroys everything in its path.
Besides the number of deaths, missing people, and affected population, the effects of a
tsunami can also be measured in surface, infrastructure, and agriculture damage.
Table 2
Type of Effects on Effects on Effects on
Disaster the Earth's Surface Infrastructure Agriculture
Seaquakes Floods Destruction of, or damage Localized damage of
or tsunamis to, buildings, bridges, crops
Salinization and roads, irrigation, and
sedimentation in drainage systems Destruction of coastal
coastal strips plantations
Contamination of Changes in
water and water reproductive cycles of
table coastal fauna and
damage to fishing
Tsunami Disaster Effects on the Earth's Surface, Infrastructure, and Agriculture
On December 26, 2004, all the effects in the table shown above took place. In general,
the environmental damages are
Gouged beaches
Crushed coral reefs
Thousands of hectares of mangrove trees decimated
Altered coastlines from Thailand to Somalia
Rice paddies and vegetation flooded with salty water
The United Nations Environmental Programme's (UNEP) environmental rapid
assessments have identified gaps in the Asian tsunami disaster report including
The lack of vulnerability mapping and comprehensive risk assessment
Minimal field assessments to date mainly restricted to areas of high population
density
The historic lack of environmental baseline data
May 2006 6GIS and Emergency Management in Indian Ocean Earthquake/Tsunami Disaster
J-9543
The lack of environmental quality assessments and data on toxic and hazardous
wastes that may be mixed with other debris
The lack of environmental guidelines in national disaster plans (if they exist)
In Thailand, 80 percent of the coral reefs were destroyed. In Indonesia, Thailand,
Maldives, and other countries, mangrove trees were decimated. Damage to these trees,
however, is less serious than other types because mangroves have the ability to recover
quickly. All the rice paddies and other vegetation/agriculture were flooded with salty
water and will need two to three rainy seasons to wash away the salt.
What Is the Not all earthquakes create tsunamis. And earthquakes are not the only cause of tsunamis.
Mechanism behind Submarine volcanic eruptions, meteorological events, or landslides can also trigger
tsunamis.
an Earthquake That
Triggers a Tsunami? To better understand earthquakes that can create tsunamis, the processes involved should
be adequately identified. Humans live outside the thinner layer—the crust—of the
lithosphere, which could be likened to the shell of an egg. As with an egg, the earth's
"shell" is only a small portion of the earth, and natural processes experienced on the crust
have their origins far below the surface. At greater depths, the earth's temperature,
density, and pressure increase. Between 100 and 2,900 kilometers deep, the heat induces
convective currents. These currents can and do move the upper crust—the thin layer that
is hard and rigid. Ridges are formed by plates of floating crust moving away from each
other, and new crust forms as a result of the action. Trenches are formed when the plates
collide or slide against each other. Three different plate boundaries could be defined
according to their movements—transform, convergent, and divergent (figure 3). Plate
boundaries are the highly active areas of earthquakes. In particular, convergent plate
boundaries could cause tsunamis because of their ability to create sudden, high vertical
movements at the seafloor. This movement will displace the water covering the seafloor
vertically and horizontally and create tsunamis. As the water mass attempts to regain its
balance, all of its boundaries (ocean, sea, or lake) will be affected at different levels.
Figure 3
Three Types of Plate Boundaries—Transform, Convergent, and Divergent
The December 26, 2004, earthquake had several characteristics that contributed to the
creation of the tsunami and magnified the catastrophe. First, it had a large magnitude
ESRI White Paper 7GIS and Emergency Management in Indian Ocean Earthquake/Tsunami Disaster
J-9543
(moment magnitude = 9.0), which is the largest earthquake recorded worldwide in
40 years. Second, the plate boundary was convergent. Third, it occurred off the coast in
deeper water. Fourth, the earthquake had a shallow focus (generally, 0–70 kilometer
depth is defined as shallow). Finally, the lateral displacement caused large vertical
displacement (maximum 20 meters), and the total length of the rupture was more than
1,200 kilometers. The devastating megathrust earthquake of December 26, 2004,
occurred on the interface of the India and Burma plates and was caused by the release of
stresses that developed as the India plate subducted the overriding Burma plate. In the
region of the earthquake, the India plate moved toward the northeast at the rate of about
8 cm/year relative to the Burma plate. As it continues to move, it results in an oblique
convergence at the Sunda trench. The oblique motion creates convergence and normal
faulting. 5
Which Areas Are Simply put, all convergent plate boundaries have the potential to generate tsunamis
at Risk? because they are able to create large-magnitude earthquakes and cause large, vertical
movements of the seafloor. Figure 4 shows the plates and plate boundaries around the
world. Red lines represent divergent boundaries, black lines represent convergent
boundaries/subduction zones, and purple lines represent transform boundaries.
Figure 4
Global Topography and Plate Tectonics
From this figure, it can be concluded that the Pacific and Atlantic oceans, Mediterranean
Sea, and Indian Ocean are capable of generating tsunamis. For the other regions, it might
seem that they are relatively safe, but on the other hand, tsunamis can travel long
distances and still affect shores that are far from them. These are called teletsunamis and
originate from a distant source, generally more than 1,000 km away.
Some of the deadliest tsunamis have originated from the Mediterranean and China seas,
Indian Ocean, Japan Sea, and the waters off northern Chile. Over the last 1,200 years,
more than 70 tsunamis have taken in excess of 100,000 lives in Japan (table 3). Though
the deadliest tsunamis originated in these regions, many other regions, such as the United
States, have suffered from economic damage.
5
Earthquakes, USGS (www.usgs.gov).
May 2006 8GIS and Emergency Management in Indian Ocean Earthquake/Tsunami Disaster
J-9543
Table 3
Deadliest Tsunamis in History
Fatalities Year Magnitude Principal Areas
226,000 2004 9.0 Indian Ocean
100,000 1410 BC Crete-Santorini, Ancient Greece
60,000 1755 8.5 Portugal, Morocco
40,000 1782 7.0 South China Sea
36,500 1883 Krakatau, Indonesia
30,000 1707 8.4 Tokaido-Nankaido, Japan
26,360 1896 7.6 Sanriku, Japan
25,674 1868 8.5 Northern Chile
15,030 1792 6.4 Kyushu Island, Japan
13,486 1771 7.4 Ryukyu Trench, Japan
6
The Deadliest Tsunamis 1400 BC–2004 AD
In the United States, California, Oregon, Washington, and especially Alaska and Hawaii
are the states that had damage and casualties from tsunamis. One of the most devastating
tsunamis that struck Hawaii was in 1946, where run-up heights were 10–17 meters. It
left 159 people dead and caused $26 million in damage. In 1952 in the USSR, an
earthquake of M = 9 caused $1 million in damage to Hawaii; and in 1957, the Aleutian
Islands earthquake (M = 9.1) caused $5 million in damage. In 1960, the Chilean
earthquake (M = 9.5) affected the coastlines of the United States from the teletsunami. It
left 61 people dead and caused $23 million in damage. Another important teletsunami
was generated in the Gulf of Alaska in 1964 from an earthquake of M = 9.2. The damage
totaled $84 million. In California, 13 people were killed and $10 million in damage was
caused.
Overall, approximately 28 tsunamis with run-up heights greater than one meter have
occurred along the U.S. west coast since 1812. On the average, there are two tsunamis
per year somewhere in the world that cause damage near their source. And in the Pacific
region, tsunamis happen every 15 years according to the National Oceanic and
Atmospheric Administration (NOAA).
Apart from the North America Pacific plate margin, the North America-Caribbean plate
boundary also has high risk of tsunamis. There is a high risk in northern Puerto Rico and
the Virgin Islands as well, with active plate boundary faults creating the potential for
submarine landslides. This region is particularly at risk, since its population has been
growing fast. A tsunami would affect 35.5 million people, 4 million of whom are U.S.
citizens. 7
Potential Tsunami Megatsunamis are giant waves that could have run-up heights reaching 90 meters. They
Hazard in the Atlantic could be a result of the collapse of ocean island volcanoes or segments of the continental
shelf or asteroid impacts with the sea. In tsunami research, much attention is given to the
Ocean La Palma Cumbre Vieja volcano because it could generate a megatsunami. It is located
6
Tsunami (http://www.infoplease.com/spot/tsunami.html).
7
Ten Brink, U., Danforth, W., Polloni, C., Andrews, B., Llanes, P., Smith, S., Parker, E., and Uozumi, T.
2004. "New Seafloor Map of the Puerto Rico Trench Helps Assess Earthquake and Tsunami Hazards." Eos,
Vol. 85, No. 37, September 14, 2004. 349–354.
ESRI White Paper 9GIS and Emergency Management in Indian Ocean Earthquake/Tsunami Disaster
J-9543
off the northwest coast of Africa in the Canary Islands belonging to Spain. In 1949, an
eruption displaced as much as 200 cubic kilometers of rock, which slid four meters
seaward before grinding to a halt. The ground deformation monitoring suggested that the
mass is creeping one centimeter each year. Because of this information, it is believed
that it will collapse soon along with a volcanic eruption, but the time of eruption cannot
be estimated. The results of such an event would be devastating. The waves could reach
from 10–25 meters high on the eastern shores of the Americas and western coasts of
Europe.
Managing Disasters
What Can Be Done? Through hazard mitigation, lives and property can be saved and environmental damage
can be reduced. Hazard mitigation has physical, engineering, and social aspects. The
physical aspect involves the observation and collection of data and modeling. 8 Physical
models attempt to predict the likelihood and outcome of a hazard; for example, they can
be used to predict weather, hurricanes, and volcanic eruptions and forecast flood stage
levels. Engineering, for example, is applied in designing and building structures to resist
earthquakes. Social considerations include land-use planning, scientific predictions,
analyzing risk, and the cost-benefit analysis. The stated goal of hazard mitigation is to
reduce by 50 percent the number of people affected by disasters by the year 2015.
Disaster can be defined as the onset of an extreme event causing profound damage or
loss as perceived by the afflicted people. 9 Disaster management involves three phases—
predisaster, during the disaster, and postdisaster. The predisaster phase consists of risk
identification, mitigation, and preparedness. During the disaster, emergency response
takes place, and in the postdisaster phase, rehabilitation and reconstruction are applied.
The actions create a cycle in time (figure 5).
Figure 5
Disaster Management Cycle: Predisaster,
During, and Postdisaster Phases
In the predisaster phase to identify risk, hazard, risk, and vulnerability assessments are
performed. Hazard can be defined as an interaction between humans and an extreme
natural event with respect to cultural perceptions and value systems. 10 The term risk
includes probability and could, therefore, be defined as the actual exposure of something
of human value to a hazard and is often regarded as the combination of probability and
8
See note 4 above.
9
Risk, Hazard and Disaster (http://homepages.uc.edu/~huffwd/Volcanic_HazardRisk/Gravley.pdf).
10
See note 8 above.
May 2006 10GIS and Emergency Management in Indian Ocean Earthquake/Tsunami Disaster
J-9543
loss. 11 These assessments help identify the characteristics of a hazard such as its
frequency, magnitude, and location. Elements at risk are the population and assets
exposed in a vulnerability assessment. Since risk is identified using vulnerability and
probability of hazard, therefore
Risk = Hazard x Vulnerability
The result of the risk assessment provides a function of hazard probability and
vulnerability. Hazard monitoring and forecasting use GIS, mapping, and scenario
building. At the end of this phase, risk is identified and mitigated. Land-use planning
and building codes related to the risk can be updated and enforced in the community.
The public could be educated about risks and trained in prevention. In emergency
preparedness, early warning systems, communication systems, networks of emergency
responders, shelter facilities, and evacuation plan are key elements.
During the disaster phase, existing early warning systems could be used. In emergency
response, humanitarian assistance, cleanup, temporary repairs, restoration of services, and
damage assessment are the basic steps. After this phase, rehabilitation and reconstruction
activities take place. Damaged critical infrastructure is reconstructed; budget and
macroeconomic management issues are addressed; revitalization of affected sectors
begins; and tourism, exports, and agriculture are managed.
Disasters or hazards are not limited to tsunamis. Others include earthquakes, volcanic
eruptions, drought, famine, epidemics, floods, landslides, storms, hurricanes, avalanches,
and fires. The list could be extended to include technological and man-made hazards
such as pollution and land contamination. Any of these hazards could be controlled and
mitigated by effective disaster management.
Technology Used in
Emergency
Management
Technology Used in Following the earthquake/tsunami disaster, months of response and relief work have
Rescue and Recovery passed. The ongoing humanitarian aid includes rehabilitation and reconstruction. Since
the event encompassed such an immense area, the rehabilitation and reconstruction phase
will be a long-term issue; months and even years will be invested. Emergency response
to the area was relatively quick. What's more, the amount of donations gathered from all
over the world for the relief activities was outstanding. Hundreds of international
nongovernmental organizations (NGOs) rushed to the area. Local NGOs, government
agencies, universities, and the public and private sectors are all working side by side to
provide disaster relief.
In general, these activities can be distinguished into three areas:
Social activities (relief work, food, shelter, etc.)
Scientific activities that could support social activities
Scientific activities that support research
The technology applied in these activities differs in context. For example, a better
tsunami animation of the event would not be beneficial to relief workers. On the other
hand, a detailed map of the damage area would be more functional.
11
See note 8 above.
ESRI White Paper 11GIS and Emergency Management in Indian Ocean Earthquake/Tsunami Disaster
J-9543
For relief work, computers, laptops, mobile phones (including satellite phones), GPS, and
the Internet were used. The military and governments also used heavy equipment and
technology (helicopters, planes, etc.) to clean up debris, find people, and identify usable
routes. Scientific activities that supported the relief work employed computers, laptops,
GPS, and the Internet. Moreover, scientists and relief workers were better able to
implement GIS and RS. Preliminary usage included satellite imagery, which enabled
mapping of damaged areas, and basic infrastructure data. Finally, scientific activities for
research utilized high-end technology, software, and hardware. Examples of these
activities are the simulations created by several university members. The following table
shows the technology summary gathered from an e-mail questionnaire that was sent out
to ESRI contacts who worked in the field (table 4).
Table 4
Hardware Computers, Laptops, Mobile Phones, GPS, Tabular Forms
Software ArcView, ArcGIS 9 (Military Analyst and Maplex extensions),
MapInfo, ERDAS
Data Used Topography, Census, Roads, Utilities, Bathymetry, Elevation,
Geology, Land Cover, Landmarks, Hydrology, Administrative
Boundaries, Tidal Datum, Orthophoto, GCP, LandScan (population),
SRTM, DTED Levels 1 and 2, QuickBird, IKONOS, SPOT
Internet Usage Interactive Maps (ArcIMS, Manifold, DM Solutions), Static Maps,
Information Sharing for Coordination, Eroom and Groove
Technology
Summary of Technology Usage in Disaster Area
Current relief work taking place in the disaster area is categorized as follows:
Coordination and Support Services
Agriculture and Fisheries
Education
Food
Health
Infrastructure and Rehabilitation
Protections/Human Rights Rule of Law
Shelter/Nonfood Items
Water
Sanitation
Livelihood
These areas are being covered by 200–300 international and local NGOs in the field and
also by government and private sector workers. These NGOs have been responding to
categories listed above. Since the phase has changed from response to recovery and
rehabilitation, some of the projects include a draft master plan for reconstruction of
Banda Aceh presented by the Indonesian government that is a mapping exercise for
recovery and rehabilitation from the UN Office for the Coordination of Humanitarian
Affairs (UN OCHA). For these activities and the response phase, relief workers used
GIS technology.
In Sri Lanka, Urban Development Authority has been active from the beginning of the
emergency. Using computers donated from the United States Agency for International
Development (USAID) and laptops from IBM, GPS was employed to follow up on
internally displaced people (IDP) (many GPS units were donated through Trimble and
May 2006 12GIS and Emergency Management in Indian Ocean Earthquake/Tsunami Disaster
J-9543
ESRI). Mobile phones and the Internet are also being used. ESRI (ArcView), MapInfo,
and ERDAS software are the main source software used. Internet mapping technology
based on ArcIMS was also implemented. IKONOS and SPOT were used for imagery
data. Russian 1:50,000-scale topography and shapefiles, along with census information,
were the main vector data used.
The United Nations Joint Logistics Centre (UNJLC), Vietnam Veterans of America
Foundation (VVAF), United Nations Humanitarian Information Centre (UN HIC),
Indonesia National Cartographic Section, Survey Service, national government disaster
management efforts, and combined military collaborated in using GIS in Sri Lanka and
Indonesia. The software used is ArcGIS 9 with the Military Analyst and Maplex
extensions. Data was obtained from the UN, U.S. government (USG), commercial
providers, and governments of Indonesia and Sri Lanka. It includes
DTED 2
Roads in 1:50,000 and 1:100,000 scale
Bathymetric surveys
New geodetic survey to establish GCPs to reregister all map products
In Thailand, a collaboration of the UN, Swedish Defence, Swedish government, and
Swedish International Development Cooperation Agency used GIS technology. The data
used is census (1:50,000), topography, and elevation that was obtained from the Internet,
Swedish Land Survey, Swedish Defence, ESRI (Thailand) Co. Ltd., and Land Survey
Thailand. Also, Swedish Rescue Services Agency (SRSA) collaborated with the UN,
Norway and Denmark governments, ESRI (Thailand), and Ministry of Natural
Resources and Environment for Thailand. They collected GIS data and used the
following for 3D modeling and analysis:
Orthophotos
Landmarks
Roads
Hydrology
Administrative borders
Satellite images
Is There Sufficient For the first time in emergency response history, the financial aid was sufficient; it
Financial Aid to reached $9.8 billion in total. The financial aid provided could be categorized into three
areas: government, private, and loans. More than 19 countries provided donations as
Deploy Technology? well as government and private aid. The United States, Japan, Britain, Australia, the
Netherlands, and Germany were the leading contributors. The World Bank, Asian
Development Bank (ADB), and International Monetary Fund (IMF) loaned $1.7 billion.
Most of the aid came from government funds—$6.4 billion—with some pledged and
some provided or in process. Private aid was also a large amount—around $1.7 billion in
total (table 5). Additionally, Bangladesh provided heavy vehicles; Pakistan provided
military staff; and Afghanistan provided medics. India was able to donate $600 million.
Table 5
Government Aid Private Aid Loan
Country (in U.S. dollars) (in U.S. dollars) (in U.S. dollars)
United States $350 million $200 million
Japan $500 million
ESRI White Paper 13GIS and Emergency Management in Indian Ocean Earthquake/Tsunami Disaster
J-9543
Government Aid Private Aid Loan
Country (in U.S. dollars) (in U.S. dollars) (in U.S. dollars)
Norway $183 million $30 million
Britain $96 million $466 million
Italy $95 million $20 million
Sweden $80 million $75 million
Denmark $75 million
Spain $68 million
France $66 million $90 million
Canada $343 million $75 million
China $83 million
South Korea $50 million $13 million
North Korea $150 thousand
Australia $764 million $77 million
Netherlands $343 million $35 million
Russia $10 million
Germany $647 million $586 million
Qatar $25 million
World Bank $250 million
European Union $2 billion
ADB $500 million
IMF $1 billion
India $600 million
Bangladesh Heavy vehicles
Pakistan Military staff
Afghanistan Medics
Total $6.4 billion $1.7 billion $1.7 billion
Aid Types and Amounts
Organizations and The Internet was the main source of information for GIS technology usage in the area.
Their Technology Additionally, a questionnaire, phone calls, the ESRI international distributor network, and
ESRI Tsunami Disaster Support Web site were other essential sources of information.
Implementations The following table lists the international and local NGOs that are active in the region.
Each has different goals and sometimes parallel objectives in their organizations
(table 6). This list is the database from which data for the poster and the ArcIMS map
was derived. Organizations were randomly selected, and most used GIS technology for
their accomplishments. Information and data from different sources were also used.
May 2006 14GIS and Emergency Management in Indian Ocean Earthquake/Tsunami Disaster
J-9543
Table 6
No. Organization Name Main Focus
1 UNJLC UNJLC was created to complement and coordinate the logistics capabilities of
cooperating humanitarian agencies during large-scale and complex emergencies.
2 WFP When a natural or man-made disaster strikes anywhere in the world and an official
request is made for United Nations World Food Programme (UN WFP) food aid, the
agency draws up an Emergency Operation (EMOP).
3 USAID USAID's Office of Foreign Disaster Assistance (OFDA) is deploying a regional
Disaster Assistance Response Team (DART) that includes USAID/OFDA regional
advisors, water and sanitation experts, field officers, and information officers.
USAID/DART members are located in Sri Lanka, India, Indonesia, and Thailand
and coordinates the USG humanitarian response to the earthquake and tsunami
emergency.
4 CARE CARE has operated in each of the affected countries for decades and has significant
capacity to provide immediate lifesaving humanitarian assistance, placing special
emphasis on working with women. CARE members are responding directly or in
concert with government teams and local partners in each country as the situation
requires. Their focus is to ensure that the most vulnerable people are helped.
5 Red Cross Red Cross disaster relief focuses on meeting the emergency disaster-caused needs of
individuals and families. When a disaster threatens or strikes, Red Cross provides
shelter, food, and health and mental health services, which address basic human
needs. In addition, it helps individuals and families to independently resume their
normal daily activities. This may include a referral or a way to pay for what is
needed most: groceries, new clothes, rent, emergency home repairs, transportation,
household items, medicines, and occupational tools.
6 UNESCO United Nations Education, Scientific and Cultural Organization (UNESCO) focuses
on four priority areas: (1) advocacy and technical support for education on disaster
prevention and for sustainable development, (2) policy advice on inclusive education
to meet the needs of schoolchildren physically affected by the tsunami,
(3) psychosocial and pedagogical training for teachers and educational professionals,
and (4) community-based educational rehabilitation. UNESCO also provides
posttsunami recovery and reconstruction in the organization's other areas of
expertise, namely natural science, communication, and culture.
7 Sarvodaya This organization focuses beyond the rebuilding of homes, roads, and rail tracks. It
values reestablishing social welfare services, such as health and education, or
restarting commercial activities to support daily life.
8 UNICEF United Nations Children's Fund (UNICEF) relief assistance includes providing
clean, safe water and basic sanitation; emergency immunization to prevent fatal
childhood diseases; feeding malnourished children and pregnant women; care for
children who have endured traumatic events; shelter and protection for orphans and
separated children; and education kits and temporary classrooms to get children back
to school.
9 Oxfam Oxfam's humanitarian work is not limited to crisis response but covers a full range
of activities including advocacy, prevention, preparedness, direct response, and
rehabilitation. The organization works in situations created by war, drought, floods,
earthquakes, and famine.
ESRI White Paper 15GIS and Emergency Management in Indian Ocean Earthquake/Tsunami Disaster
J-9543
No. Organization Name Main Focus
10 WHO Human survival and health are the cross-cutting objectives and the measures of
success of all humanitarian endeavors. The World Health Organization (WHO) goal
is to reduce avoidable loss of life, burden of disease, and disability in emergencies
and postcrisis transitions.
11 World Vision World Vision is an international partnership of Christians whose mission is to follow
International the Lord and Savior Jesus Christ in working with the poor and oppressed to promote
human transformation, seek justice, and bear witness to the good news of the
kingdom of God.
12 Save the Children Save the Children is a leading nonprofit humanitarian relief and development
organization working in more than 40 countries throughout the developing world
and the United States. Its mission is to create lasting, positive change in the lives of
children in need.
13 Islamic Relief In addition to responding to disasters and emergencies, Islamic Relief promotes
Worldwide sustainable economic and social development by working with local communities—
regardless of race, religion, or gender. Islamic Relief works in four main sectors:
emergency relief, development, orphans, and war.
14 Action Against Action Against Hunger's mission is to save lives by combating hunger, malnutrition,
Hunger physical suffering, and the associated distress that endanger the lives of children,
women, and men in emergency situations of war, conflict, and natural disaster.
15 GOAL GOAL is an international humanitarian agency dedicated to the alleviation of
suffering among the poorest of the poor. It was founded by its current chief
executive John O'Shea in 1977, when he invited four friends to join him in an effort
to help those in greatest need worldwide.
16 BAPS Care BAPS Care International's mission is to serve needy individuals, families, and
International communities throughout the world, with a focus on India.
17 Direct Relief Direct Relief International works to improve the health and lives of people in
International developing countries and those people victimized by disaster or war. It supports
locally run facilities, hospitals, and programs that provide health services with
essential material resources—medicines, vitamins and nutritional supplements,
supplies, and equipment. It receives most of these products through donations and
ensures that they are provided in the most secure, efficient manner possible.
18 Habitat for Humanity Habitat for Humanity International is a nonprofit, nondenominational Christian
International housing organization. It welcomes all people to join in building simple, decent,
affordable houses in partnership with those who lack adequate shelter.
19 AmeriCares AmeriCares is a nonprofit disaster relief and humanitarian aid organization
providing immediate response to emergency medical needs, as well as supporting
long-term humanitarian assistance programs, for all people around the world,
regardless of race, creed, or political persuasion. AmeriCares solicits donations of
medicines, medical supplies, and other relief materials from U.S. and international
manufacturers and delivers them quickly and efficiently to indigenous health care
and welfare professionals around the world.
20 American Jewish American Jewish World Service sponsors programs of relief, rescue, and renewal
World Service and helps Israel address its most urgent social challenges. It is committed to the idea
that all Jews are responsible for one another.
May 2006 16GIS and Emergency Management in Indian Ocean Earthquake/Tsunami Disaster
J-9543
No. Organization Name Main Focus
21 Mercy Corps Mercy Corps provides emergency relief services to assist people afflicted by conflict
or disaster. Additionally, it develops sustainable communities that meet the needs of
children and families. Integrated strategies include agriculture, economic
development, health, housing and infrastructure, and strengthening local
organizations. It promotes civil society initiatives in all its programs to encourage
citizen participation, accountability, nonviolent conflict management, and the rule of
law.
Active International and Local NGOs in the Disaster Region
Of the organizations listed above, Mercy Corps focused on good technical support and
highlighted the importance of information technology in its relief efforts. Hence, its
mission was to help NGOs be more effective in the area by using GIS in their relief work.
GIS and Remote- NOAA collaborates with various federal-international agencies to model data, interpret
Sensing Data/ the models, and create hazard analysis tools. It uses data such as
Information Providers Elevation
and Coordinating Census
Agencies Imagery
Geology
Land cover
Tidal datum models
The data sources were from federal, state, and local authorities. Like the U.S. Geological
Survey (USGS), NOAA also uses ArcIMS technology for publishing dynamic maps on
the Internet. It provides a tsunami events database via its Web site and includes layers
such as tsunami events/run-ups accompanied by significant earthquakes for a region,
hydrology, elevation, and population data.
Pacific Disaster Center (PDC) provided geospatial data processing and distribution. It
has obtained and processed high-resolution satellite imagery from National Geospatial-
Intelligence Agency (NGA); coordinating processing with USGS Earth Resources
Observation System (EROS) Data Center, Mercy Corps, and other organizations. It also
launched Indian Ocean Tsunami Geospatial Information Service, based on ArcIMS, and
the corresponding Internet-based Map Viewer. ESRI provided consultative services to
support high-volume/high-availability site requirements. It also provided online access to
the GIS data via the Internet map service, viewer, and FTP site at Maui High
Performance Computing Center (MHPCC), which enabled support of U.S. government
interagencies and the international communities of interest. PDC has been one of the
most important information providers for this event. Its Internet mapping Web site,
based on ArcIMS and ArcMap™, includes earthquakes and their detailed information
along with the probable damage areas for the United States, Landsat-derived damage
areas, hospitals, and tsunami inundation zones.
SERTIT provides rapid mapping service and also specializes in crisis remote-sensing
applications. It is supported by the European Space Agency (ESA) and was contracted in
January 2004 by the French space agency, CNES, for three years to produce added-value
Earth Observation (EO)-derived products within the framework of the international
charter Space and Major Catastrophes.
UN has many divisions, but for disaster management, it can be divided into four basic
branches: OCHA, the United Nations High Commission for Refugees (UNHCR),
ESRI White Paper 17GIS and Emergency Management in Indian Ocean Earthquake/Tsunami Disaster
J-9543
UNWFP, and UNICEF. The International Search and Rescue Advisory Group
(INSARAG) and the Search and Rescue Team (SAR) work closely with these branches
and mostly provide guidelines. OCHA has the Disaster Response Branch (DRB) and the
UN Disaster Assessment and Coordination has On-Site Operations Coordination Center
(OSOCC). UNWFP Emergency Preparedness and Response Unit (ODAP) has provided
damage and population density maps with casualties information. Based on SRTM-3
digital elevation data from the National Aeronautics and Space Administration (NASA)
and USGS EROS, Nicobar Islands coastal flooding tsunami hazard map was provided by
Open University. For this map, the coastline data was obtained from NGA. Office of the
Geographer and Global Issues, Bureau of Intelligence and Research, of the U.S.
Department of State (DOS) provided political boundaries, roads, and airports of the
region. The LandScan dataset is a worldwide population database compiled on a 30" by
30" latitude-longitude grid provided by Oak Ridge National Laboratory and ESRI, which
was widely used. ArcWebSM Services provided a map, dynamically created with ESRI
ArcGIS Server, which demonstrated the functionality of on-demand map publishing for
Indonesia.
Remote-sensing imagery was also provided through several agencies and private
companies for the relief work. Some of them are UNOSAT, USGS, MDA Federal Inc.,
GeoNetwork, and DigitalGlobe.
UNOSAT (a UN Institute for Training and Research [UNITAR] project) provides
imagery for the areas where UN is active and to the officers who are working with UN as
well as the local authorities working for territory planning and monitoring purposes. It
supports activities such as disaster management, risk prevention, peacekeeping
operations, postconflict reconstruction, environmental rehabilitation, and social and
economic development.
USGS has provided Shuttle Radar Topography Mission DTED and Landsat® 7 satellite
imagery. It has contributed to the relief work by providing images from Landsat 7 in
addition to other image-derived products for damage area maps. SRTM DTED (Level 2)
was used by VVAF and UN for analysis. USGS also has other satellite imagery products
commercially available that can be used in relief work.
MDA Federal Inc. (formerly Earth Satellite Corporation) has donated more than
15 million square kilometers of imagery from its global NaturalVue 2000™ imagery
dataset in support of tsunami disaster recovery and reconstruction efforts. Imagery
datasets have been provided to UN OCHA and DOS for their organizations' use. They
have also joined ESRI in creating an Indian Ocean Disaster Geospatial One-Stop portal to
make a variety of resources available to anyone who needs them. These resources
include many types of geographic data, map services, information about GIS projects in
the region, lists of volunteers, and more.
GeoNetwork—Food and Agriculture Organization (FAO) of the United Nations—has
endorsed this Web site where users can search for or share geographically referenced
thematic information among different UN agencies, NGOs, and other institutions. The
products are damage area data, agroclimatic information, population density data, and
elevation data and imagery (SPOT 5, Landsat ETM, etc.).
DigitalGlobe has provided 60-centimeter QuickBird images, which are the highest-
resolution, commercial satellite images. Companies and agencies such as PDC and
ImageCat have used this imagery, which was collected in March 2002, for comparison.
May 2006 18GIS and Emergency Management in Indian Ocean Earthquake/Tsunami Disaster
J-9543
Using the GIS- and RS-provided or available data, other organizations have implemented
interactive maps on the Internet for the region. One of them was created by Cornell
University and the Earthquake Engineering Research Centers Program of the National
Science Foundation through the Multidisciplinary Center for Earthquake Engineering
Research. International Water Management Institute provided the vector GIS data for the
country of Sri Lanka for this Web site. The software used for creating this interactive
Web site was based on Manifold IMS software technology. It includes flooded areas,
transportation lines, political districts, hospitals, and topography of Sri Lanka.
USGS used ArcIMS technology to publish interactive maps in the first hours of the
disaster. The online data includes transportation, disaster resources, hydrology,
orthoimagery, imagery, elevation, and land cover. UNEP and its World Conservation
Monitoring Centre (WCMC) endorsed tsunami information interactive map services
using ArcIMS technology, which include infrastructure, sensitive areas, species,
background information, socioeconomic data, and response activities in their dynamic
map. This site provides information to help emergency responders coordinate more
effectively. UNEP makes recommendations on how to reduce vulnerability to future
coastal hazards. It also provides reports, maps, and graphics, including multimedia
documents, on its Web site.
DM Solutions Group, a Web mapping solutions company from Canada, collaborated with
University of Ottawa to build a Tsunami Disaster Mapping Portal that included political,
infrastructure, satellite imagery, and tsunami wave height data layers.
Coordination-related information providers aim to reduce suffering and save lives.
Through technology, it is possible to help aid agencies reach people in need as quickly as
possible. Up-to-date information will answer questions such as
Where are the hospitals, airports, schools, and so on? How many are there?
How far is the airport?
Where are the best places to establish refugee camps/command centers?
What is the extent of the damaged area?
To answer such questions, GIS technology is key. Knowing this, many local and
international agencies have focused on providing necessary GIS data. In Indonesia, NGO
Bakornas provides relief activity locations and information on relief work through the
Internet. UN HIC under UN OCHA provides services to the humanitarian community
working in Indonesia (Sumatra), Sri Lanka, and the surrounding countries. In Sumatra,
UN HIC coordinates with a number of partners including UNJLC, the United Kingdom's
(UK) Department for International Development (DFID), USAID's OFDA, and the
humanitarian aid department of the European Commission. It provides products,
coordination tools, maps, Web site and services, technical support, survey design, and
data archiving. It has been the main source of the decision-making process in Sumatra
and contributed to a common framework for information management within the
humanitarian community. It has provided many maps, showing information such as food
sector activity, internally displaced people, camps for health and education, as well as
geographic maps showing population, streets, and locations of the NGOs. Preliminary
vector data was obtained from Australian maps.
UNJLC's mission is to optimize and complement the logistic capabilities of cooperating
agencies within a well-defined crisis area for the benefit of the ongoing humanitarian
operation. In this capacity, it has been providing the routing, infrastructure, and air
operations.
ESRI White Paper 19You can also read