Cortical excitability controls the strength of mental imagery - eLife
←
→
Page content transcription
If your browser does not render page correctly, please read the page content below
RESEARCH ARTICLE

                                   Cortical excitability controls the strength
                                   of mental imagery
                                   Rebecca Keogh1†*, Johanna Bergmann1,2,3†, Joel Pearson1
                                   1
                                    School of Psychology, University of New South Wales, Sydney, Australia;
                                   2
                                    Department of Neurophysiology, Max Planck Institute for Brain Research,
                                   Frankfurt, Germany; 3Brain Imaging Center Frankfurt, Goethe-University Frankfurt,
                                   Frankfurt, Germany

                                   Abstract Mental imagery provides an essential simulation tool for remembering the past and
                                   planning the future, with its strength affecting both cognition and mental health. Research
                                   suggests that neural activity spanning prefrontal, parietal, temporal, and visual areas supports the
                                   generation of mental images. Exactly how this network controls the strength of visual imagery
                                   remains unknown. Here, brain imaging and transcranial magnetic phosphene data show that lower
                                   resting activity and excitability levels in early visual cortex (V1-V3) predict stronger sensory
                                   imagery. Further, electrically decreasing visual cortex excitability using tDCS increases imagery
                                   strength, demonstrating a causative role of visual cortex excitability in controlling visual imagery.
                                   Together, these data suggest a neurophysiological mechanism of cortical excitability involved in
                                   controlling the strength of mental images.

                                   Introduction
                                   Visual imagery - the ability to ‘see with the mind’s eye’ - is ubiquitous in daily life for many people;
*For correspondence:               however, the strength and vividness with which people are able to imagine varies substantially from
rebeccalkeogh@gmail.com            one individual to another. Due to its highly personal nature, the study of visual imagery has histori-
†
 These authors contributed         cally relied on self-report measures and had long been relegated to the shadows of scientific inquiry.
equally to this work               However, with the advent of fMRI and new analysis techniques like decoding, as well as new advan-
                                   ces in behavioral and psychophysical experiments, this is quickly changing (Pearson, 2014;
Competing interests: The
                                   Pearson, 2019).
authors declare that no
                                       To date, much of the research in the field of visual imagery has focused on the similarities
competing interests exist.
                                   between visual imagery and perception, due to a long-ranging debate around whether visual imag-
Funding: See page 25               ery can be depictive and/or pictorial, referred to as the ‘imagery debate’ (Pearson and Kosslyn,
Received: 16 July 2019             2015a). Research has shown that a large network of occipital, parietal, and frontal areas are involved
Accepted: 09 April 2020            when imagining (Pearson et al., 2015b; Dijkstra et al., 2019), with recent studies providing evi-
Published: 05 May 2020             dence that visual imagery content is tied to early visual cortex, indicating that imagery-related proc-
                                   essing overlaps with that of perception. For example, research using fMRI has demonstrated that
Reviewing editor: Thorsten
Kahnt, Northwestern University,
                                   BOLD activity in early visual cortex increases when individuals imagine, and the content of visual
United States                      imagery can be decoded from early visual cortex, as well as being cross-decoded from perception
                                   (Albers et al., 2013; Thirion et al., 2006; Cui et al., 2007). Additionally, recent work has shown that
   Copyright Keogh et al. This
                                   trial-by-trial self-rated vividness of visual imagery during an imagery task correlated with the neural
article is distributed under the
                                   overlap between perception and imagery (Dijkstra et al., 2017). Brain stimulation research has simi-
terms of the Creative Commons
Attribution License, which         larly investigated whether the early visual cortex is involved during visual imagery with findings dem-
permits unrestricted use and       onstrating that, like motor imagery, visual cortex excitability increases during imagery
redistribution provided that the   (Cattaneo et al., 2011; Sparing et al., 2002).
original author and source are         It is now well accepted that visual imagery can indeed be pictorial/depictive in nature and
credited.                          involves representations in low-level visual cortex (Pearson and Kosslyn, 2015a). However, there

Keogh et al. eLife 2020;9:e50232. DOI: https://doi.org/10.7554/eLife.50232                                                          1 of 33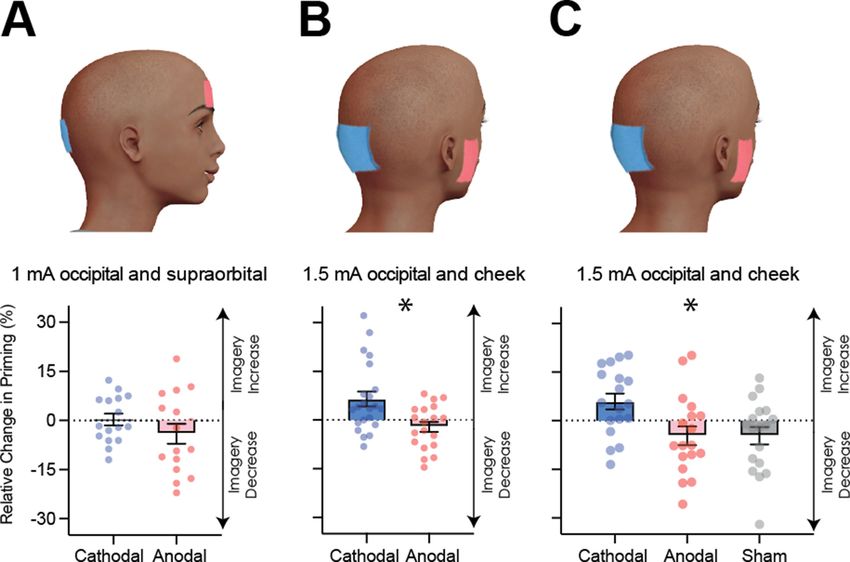
Research article                                                                                                   Neuroscience

                                   are also large individual differences in the reported vividness of imagery across the general popula-
                                   tion. Some report imagery so vivid it is akin to seeing the image, while others report no experience
                                   of visual imagery at all, a new special population referred to as aphantasia (Zeman et al., 2015).
                                   These large individual differences exist in both subjective reports (Galton, 1883), and in objective
                                   measures of imagery strength (Keogh and Pearson, 2018). Little research has investigated exactly
                                   what drives these large individual differences. One study reported that the vividness of visual imag-
                                   ery correlates positively with BOLD activity changes in visual cortex during an imagery task
                                   (Cui et al., 2007). Another study found a correlation between imagery vividness and the similarity of
                                   BOLD responses for perception and imagery in early visual cortex (Lee et al., 2012). A recent study
                                   found that trial-by-trial differences in imagery vividness were also related to the similarity of BOLD
                                   responses between imagery and perception (Dijkstra et al., 2017).
                                       Taken together, these studies suggest that visual cortex is linked to the subjective vividness of
                                   visual imagery. However, they do not provide information about why some individuals are better at
                                   recruiting the early visual cortex to create stronger more vivid images. Work in synesthesia and
                                   migraines has found evidence that the neural excitability of early visual cortex relates to the experi-
                                   ence of involuntary forms of visual imagery (Terhune et al., 2015a; Terhune et al., 2011;
                                   Gunaydin et al., 2006). Specifically, these previous studies have shown that individuals who experi-
                                   ence grapheme-colour synesthesia, or auras prior to the onset of migraines, have heightened visual
                                   cortical excitability measured by TMS phosphene thresholds (Terhune et al., 2015a; Terhune et al.,
                                   2011; Gunaydin et al., 2006). It is known that the excitability of visual cortex varies substantially
                                   across individuals, and as such may be a candidate for driving some of the observed interindividual
                                   differences in visual imagery strength.
                                       Here, we investigated whether cortical excitability might also be linked to the individual differen-
                                   ces that exist in the strength of voluntarily produced visual imagery. We used a multi-method
                                   approach (fMRI, TMS, and tDCS, see Materials and methods for measures of cortical excitability) to
                                   assess the potential contributions of resting levels of cortical excitability in the visual imagery net-
                                   work as a critical physiological precondition, which influences the strength of visual imagery.

                                   Measuring visual imagery strength
                                   To measure mental imagery strength, we utilized the binocular rivalry imagery paradigm (see Fig-
                                   ure 1), which has been shown to reliably measure the sensory strength of mental imagery through
                                   its impact on subsequent binocular rivalry perception (Pearson, 2014). Previous work has demon-
                                   strated that when someone imagines a pattern or is shown a weak perceptual version of a pattern,
                                   they are more likely to see that image in a subsequent brief binocular rivalry display (see
                                   Pearson et al., 2015b for review of methods). Longer periods of imagery generation, or weak per-
                                   ceptual presentation, increase the probability of perceptual priming of subsequent rivalry. For this
                                   reason, the degree of imagery priming has been taken as a measure of the sensory strength of men-
                                   tal imagery. Importantly, this measure of imagery is directly sensory; while it is related to subjective
                                   reports of imagery vividness, it is not a direct proxy for subjective reports of imagery vividness, and
                                   findings regarding their relationship across individuals have been mixed (see Figure 1—figure sup-
                                   plement 1A and Pearson et al., 2011; Bergmann et al., 2016a). This measure of imagery strength
                                   has been shown to be both retinotopic location and spatial orientation specific (Bergmann et al.,
                                   2016a; Pearson et al., 2008a), is reliable when assessed over days or weeks (see Figure 1—figure
                                   supplement 2 and Bergmann et al., 2016a), is contingent on the imagery generation period (there-
                                   fore not due to any rivalry control) and can be dissociated from visual attention (Pearson et al.,
                                   2008a). This measure of imagery is advantageous in that it allows us to avoid the prior limitations of
                                   subjective introspections and reports.

                                   Results
                                   Visual cortex and visual imagery strength
                                   Correlations between visual cortex excitability and visual imagery strength:
                                   exploratory fMRI analysis
                                   First an exploratory analysis was run to see if there was any relationship between cortex physiology
                                   and imagery strength. To do this, we looked at fMRI data and assessed a sample of 31 participants

Keogh et al. eLife 2020;9:e50232. DOI: https://doi.org/10.7554/eLife.50232                                                          2 of 33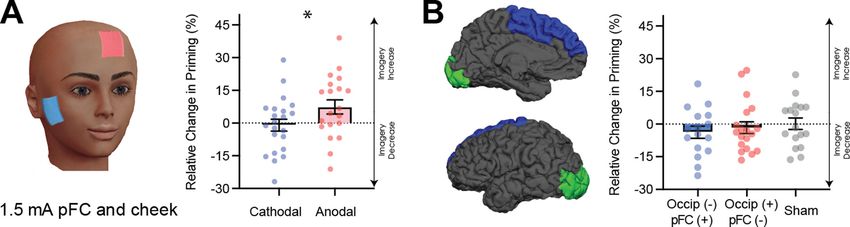
Research article                                                                                                               Neuroscience

                                   Figure 1. Timeline of the basic imagery experiment. Participants were cued to imagine a red-horizontal or a
                                   green-vertical Gabor patch for 6–7 s by the letter R or G (respectively). Following this, they were presented with a
                                   brief binocular rivalry display (750 ms) and asked to indicate which image was dominant. In the behavioral
                                   experiments with the brain-imaging sample and in three of the tDCS experiments, a rating of subjective vividness
                                   of the imagery also preceded the binocular rivalry display.
                                   The online version of this article includes the following figure supplement(s) for figure 1:
                                   Figure supplement 1. Imagery vividness results.
                                   Figure supplement 2. Re-test reliability for imagery strength (A) and Phosphene Thresholds (B).

                                   resting-state fMRI data (these participants form part of a sample that has previously been reported
                                   on in Bergmann et al., 2016a; Bergmann et al., 2016b); however, these previous analyses were
                                   structural rather than functional). We related this data set to each individual’s imagery strength
                                   determined using the binocular rivalry method (% primed, see Figure 1). Using a whole-brain sur-
                                   face-based group analysis (see Methods), we found that the normalized mean fMRI intensity of clus-
                                   ters in the visual cortex showed a negative relationship with imagery strength, while frontal cortex
                                   clusters showed positive relationships (multiple comparison-corrected; see Figure 2, left column;
                                   and Supplementary file 1 Supplementary Table S1 –S3). This pattern of results was also present in a
                                   second set of resting-state fMRI data that was acquired from the sample (see Figure 2, right col-
                                   umn). We also assessed the relationship between retinotopically defined early visual cortices V1-V3
                                   and the adjacent occipito-parietal areas (defined by the Desikan–Killiany atlas). We found significant
                                   negative correlations with normalized mean fMRI intensity levels in V1-V3 and lateral occipital cortex
                                   and imagery strength (See Figure 2—figure supplement 1).

                                   Correlations between visual cortex excitability and visual imagery strength:
                                   TMS
                                   To further substantiate our observations and circumvent other potential confounds that might influ-
                                   ence the fMRI data (see appendices for discussion of these limitations), we next utilized a different
                                   methodology that measures cortical excitability: transcranial magnetically induced phosph enes. A
                                   new sample of 32 participants performed an automated phosphene threshold (PT) procedure using
                                   transcranial magnetic stimulation (TMS) over early visual cortex. Visual phosphenes are weak halluci-
                                   nations caused by TMS applied to visual cortex. The magnetic strength needed to induce a phos-
                                   phene is a reliable and non-invasive method to measure cortical excitability (see Materials and

Keogh et al. eLife 2020;9:e50232. DOI: https://doi.org/10.7554/eLife.50232                                                                       3 of 33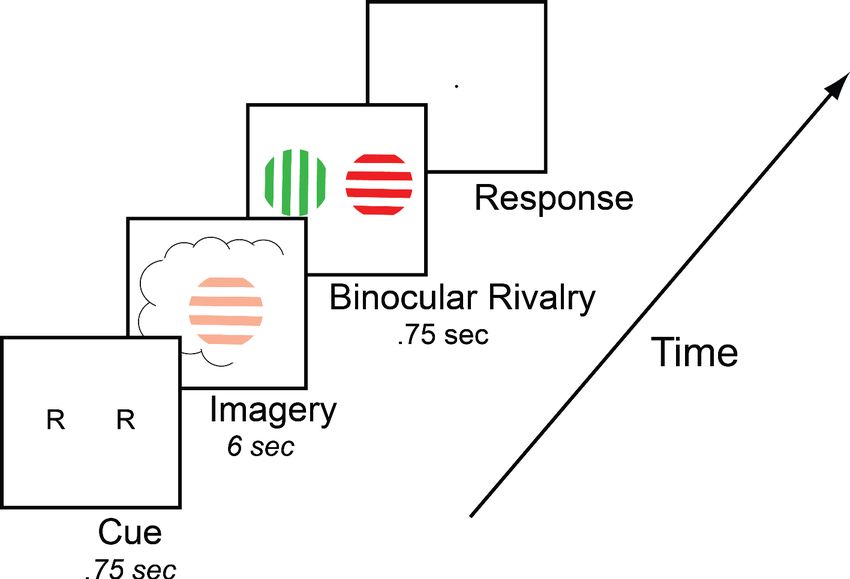
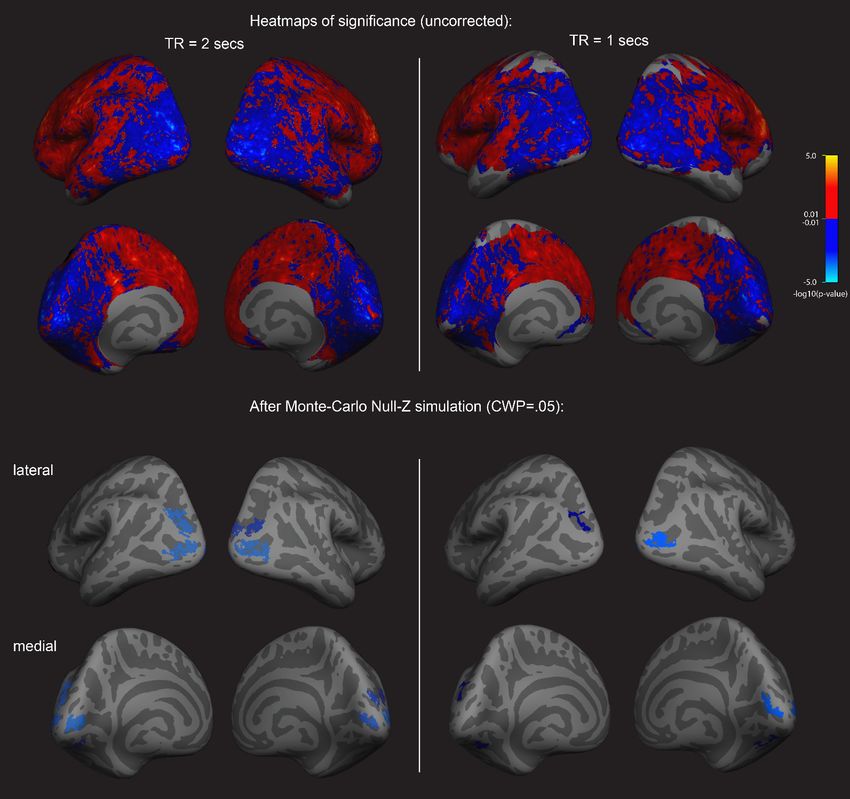
Research article                                                                                                                  Neuroscience

Figure 2. Surface-based whole brain analysis of data from two different fMRI resting-state measurements: negative associations with imagery strength
in the occipital cortex. Two columns on the left: results of the main resting-state fMRI data set with a TR of 2 s (TR2). Two columns on the right: results
of an additional resting-state fMRI data set with a TR of 1 s (TR1); in those participants with which both measurements were conducted, about half were
done on the same day. In the other half, the two measurements were conducted on different days. The two upper rows show the uncorrected (positive
and negative) relationships with imagery as heatmaps. The two lower rows show the corrected clusters that had a negative association with individual
imagery strength at a cluster-wise probability threshold (CWP) of p0.05). Despite this, the clusters from the two different measurements in the surface-based group analysis show striking similarities; while the clusters
in the TR1 measurement are smaller and sparser, their location in early visual and lateral occipital cortex are strongly overlapping with those found in
the TR2 measurement. Further analyses showed that these similarities were not driven by the group that completed the measurements on the same day
(analysis not shown).
The online version of this article includes the following source data and figure supplement(s) for figure 2:
Figure supplement 1. Retinotopic ROI anslysis of resting-state fMRI data and it’s realtionship with imagery strength.
Figure supplement 1—source data 1. fMRI resting state correlation data.
Figure supplement 2. Surface-based brain analysis of data from two different fMRI resting-state measurements and imagery: positive associations with
imagery strength in the frontal cortex.
Figure supplement 3. Visual cortex relationships with imagery strength and the number of EPI volumes discarded at the beginning of the run.

Keogh et al. eLife 2020;9:e50232. DOI: https://doi.org/10.7554/eLife.50232                                                                          4 of 33
Research article                                                                                                                  Neuroscience

                                   methods section for explanation of phosphene thresholds and cortex excitability). In line with the
                                   normalized mean fMRI intensity data, we found a significant negative correlation between imagery
                                   strength and visual cortex excitability (data shows inverse phosphene threshold (100-PT) for ease of
                                   visualizing data as PT’s are negatively correlated with cortical excitability: r = 0.43, p=0.0127;
                                   Figure 3A). In other words, individuals with lower visual cortex excitability exhibited stronger imag-
                                   ery. Importantly, we also tested the phosphene threshold retest reliability for our paradigm over 2
                                   days and found it was a very reliable measure (rs = 0.75, p
Research article Neuroscience
Figure 4. Visual cortex stimulation data. (A) Effect of visual cortex stimulation on imagery strength at 1mA. The top image shows the tDCS montage,
with the active electrode over Oz and the reference electrode on the supraorbital area. The bottom image shows the effect of cathodal (decreases
excitability, blue dots represent each participant’s data) and anodal (increases excitability, red dots represent each individual participant’s data)
stimulation averaged across all tDCS stimulation blocks (D1, D2, P1, and P2). (B) Effect of visual cortex stimulation on imagery strength at 1.5mA. Top:
the tDCS montage with the active electrode over Oz and the reference electrode on the right cheek. Bottom: the effect of cathodal (blue dots,
decrease excitability) and anodal (red dots, increase excitability) stimulation averaged across all blocks during and after tDCS stimulation (D1, D2, P1,
and P2). Each data point represents a single participant. Imagery strength increases in the cathodal stimulation condition (blue), when neural excitability
is reduced. (C) Effect of visual cortex stimulation on imagery strength at 1.5mA. Top: the tDCS montage with the active electrode over Oz and the
reference electrode on the right cheek. Bottom: The left bar shows the relative change in imagery strength for cathodal stimulation (blue bar, blue dots
represent individual participants data), the middle bar shows the relative change in imagery strength for anodal stimulation (red bar, red dots represent
individual participants data), while the right bar shows the change in imagery strength for sham stimulation (grey bar, grey dots represent individual
participants data). All error bars show ± SEMs and stars (*) indicate a significant effect of tDCS polarity.
The online version of this article includes the following source data and figure supplement(s) for figure 4:
Source data 1. 1mA occipital tDCS data.
Source data 2. 1.5mA occipital tDCS data.
Source data 3. 1.5mA occipital and sham tDCS data.
Source data 4. 1.5mA occipital TMS + tDCS data.
Figure supplement 1. Raw tDCS imagery strength and difference scores as a function of block for experiments 1, 2 and 4.
Figure supplement 2. Raw tDCS imagery strength and difference scores as a function of block for experiments 3 and 5.
Figure supplement 3. tDCS modulation of phosphene thresholds.
On each day, participants completed six blocks of the imagery task, two before tDCS, two during
tDCS and two post-tDCS (see Figure 4—figure supplement 1A for experimental timeline). To
assess the effect of tDCS on imagery strength, we calculated the percent change in priming for each
participant from baseline (on each day, see Materials and methods for percent change calculation
details) such that positive numbers indicate increases in imagery strength and negative ones indicate
decreases.
Figure 4A shows relative imagery priming percent change scores averaged across all stimulation
blocks with 1mA of tDCS stimulation (data per block can be seen in Figure 4—figure supplement
1C). Linear mixed-effects analysis were computed for all following tDCS experiments. This analysis
was run with a 2 (tDCS polarity: cathodal and anodal), x 4 (block: D1, D2, P1, P2 – see Figure 4—fig-
ure supplement 1A for timeline and Figure 4—figure supplement 1C for data for each block) x 2
Keogh et al. eLife 2020;9:e50232. DOI: https://doi.org/10.7554/eLife.50232 6 of 33Research article Neuroscience
(order of stimulation: cathodal on the first or second day) design. When fitting a linear mixed model,
the effect of tDCS polarity was not significant (c2(1)=2.99, p=0.084).
The non-significant results from the first tDCS experiment may be due to the stimulation intensity
of 1 mA being too low to produce any effect - many tDCS studies use an intensity ranging from 1.5-
2mA (for example see Jacobson et al., 2012). To investigate whether the lack of a significant result
with 1mA was due to the low stimulation intensity, we ran a second tDCS study with a higher inten-
sity of 1.5mA (see Materials and methods) and both cathodal (blue bars and dots) and anodal (red
bars and dots) stimulation conditions. Additionally, to ensure we were not also stimulating the pre-
frontal cortex, the supraorbital placement of the reference electrode was moved to the cheek
(Figure 4B). A linear mixed-effects analysis was run with a 2 (tDCS polarity: cathodal and anodal), x
4 (block: D1, D2, P1, P2 – see Figure 4—figure supplement 1A for timeline and Figure 4—figure
supplement 1E for data for each block) x 2 (order of stimulation: cathodal on the first or second
day) design. The effect of tDCS polarity was significant c2(1)=15.85, p=6.86e 05. The changes were
in line with the correlational data for resting levels of visual cortex excitability and activity (see Fig-
ures 2 and 3), such that imagery strength increased when visual cortex excitability was decreased
(cathodal stimulation, see Figure 4B), while the opposite was true of increasing visual cortex excit-
ability (anodal stimulation).
It is likely that the change from 1mA to 1.5mA allowed us to observe the modulatory effects of
tDCS; however, it also might be that the change in montage had an influence (i.e. location of refer-
ence electrode). Further, it may be the case that there are either fatigue or practice effects on this
visual imagery task, that is perhaps participants just get better/worse on this task due to doing multi-
ple sessions. For this reason, a third experiment was run to assess the effects of fatigue/practice and
the change of reference location. This study was identical to the above study with the inclusion of a
sham condition where the tDCS machine shut off after 30 s of stimulation. A linear mixed-effects
analysis was run with a 3 (tDCS polarity: cathodal, anodal and sham), x 4 (block: D1, D2, P1, P2 – see
Figure 4—figure supplement 2A for timeline and Figure 4—figure supplement 2C for data for
each block) x 3 (order of stimulation: cathodal on first, second or third day) design. The effect of
tDCS polarity was again significant c2(2)=21.66, p=1.98e 05. These data indicate that cathodal stim-
ulation results in increased imagery strength (see Figure 4C), and this is unlikely to be a practice
effect, as sham stimulation results in decreases in imagery strength. Additionally, previous work
using the same binocular rivalry paradigm has demonstrated no increases in visual imagery strength
after multiple days of training (Pearson et al., 2011). Taken together, these data suggest that cath-
odal stimulation leads to increases in imagery strength due to decreased visual cortex excitability,
and these changes cannot be explained as a learning effect due to performing multiple sessions of
the imagery task.
Although other studies have provided evidence that tDCS does change the excitability of the
visual cortex (see Antal et al., 2003 for example), we wanted to ensure that our specific stimulation
paradigm was indeed modulating visual cortex excitability. We ran a separate control study compar-
ing TMS-phosphene thresholds before and after the same tDCS paradigm (1.5mA, active electrode
on Oz and reference on the cheek, see Figure 4B, all subjects received both anodal and cathodal
stimulations across separate days; see Materials and methods for further details). If our cathodal
stimulation is decreasing visual cortex excitability, greater TMS power output would be required to
elicit phosphenes post-cathodal stimulation, whereas post-anodal stimulation we would predict the
opposite effect. A linear mixed-effects analysis was run with a 2 (tDCS polarity: cathodal and anodal),
x 2 (block: Pre tDCS and Post tDCS) x 2 (order of stimulation: cathodal on the first or second day)
design. We found that phosphene thresholds measured immediately after anodal stimulation
decreased, whereas after cathodal stimulation phosphene thresholds increased (significant effect of
tDCS polarity (c2(1)=4.32, p=0.038, see Figure 4—figure supplement 3)). These findings show that
our stimulation paradigm changes cortical excitability in the expected direction, that is cathodal
stimulation decreases cortical excitability, whereas anodal stimulation increases activity.
Summary of visual cortex excitability and visual imagery strength
In two separate experiments, we found that resting levels of early visual cortex excitability/activity
negatively predicted visual imagery strength (fMRI and TMS, Figures 2 and 3). We were also able to
causally alter visual imagery strength in two separate tDCS experiments. Specifically, decreasing
Keogh et al. eLife 2020;9:e50232. DOI: https://doi.org/10.7554/eLife.50232 7 of 33Research article Neuroscience
visual cortex excitability (using cathodal stimulation 1.5mA) increased imagery strength (see
Figure 4B and C).
Our data suggest that visual cortex excitability plays a causal role in modulating imagery strength,
but how exactly does excitability influence imagery strength? One hypothesis is that hyperexcitability
might act as a source of noise in visual cortex that limits the availability or sensitivity of neuronal
response to top-down imagery signals, resulting in weaker image-simulations. This hypothesis is sup-
ported by behavioral work showing that both imagery and visual working memory can be disrupted
by the passive presence of uniform bottom-up afferent visual stimulation (Keogh and Pearson,
2011; Keogh and Pearson, 2014), known to increase neural depolarization in primary visual cortex
(Kinoshita and Komatsu, 2001). However, the strength of the top-down imagery-signals arriving at
visual cortex should also play a role in governing imagery strength, as activity in a brain network
including prefrontal areas supports mental image generation (Pearson et al., 2015b). Therefore, we
next assessed the role that prefrontal cortex activity plays in shaping visual imagery strength.
Correlations between frontal cortex excitability and imagery strength
As mentioned previously, the exploratory, multiple comparison-corrected whole-brain surface-based
analysis of the mean fMRI intensity levels at rest revealed relationships with clusters in both visual
and frontal cortex (see Figure 2 and Figure 2—figure supplement 2 and Supplementary Table S2).
Most of the significantly positive frontal clusters were located in superior frontal cortex. Additionally,
using a ROI-based approach, normalized mean fMRI intensity levels in two frontal areas also showed
positive relationships with imagery strength: superior frontal cortex (r = 0.41, p=0.022) and area par-
sopercularis (r = 0.38, p=0.033; ROIs defined by the Desikan–Killiany atlas). However, these relation-
ships did not survive multiple comparison correction (both p>0.05).
Manipulating prefrontal cortex excitability using tDCS
To explore the theoretical role of frontal cortex in imagery generation and maintenance further, we
next sought to evaluate the effect of modulating neural excitability in prefrontal cortex using tDCS
during image generation. The active electrode was placed between F3 and Fz (left frontal cortex),
and the reference electrode on the right cheek (Figure 5A for montage). Participants completed
both cathodal and anodal conditions (1.5mA) over 2 separate days. A linear mixed-effects analysis
Figure 5. Data for prefrontal cortex stimulation. (A) Effect of left prefrontal (pFC) cortex stimulation on imagery strength at 1.5mA. The left image shows
the tDCS montage, with the active electrode between Fz and F3 and the reference electrode on the right cheek. The right image shows the effect of
cathodal (decrease excitability, blue dots represent each participant’s difference score) and anodal (increase excitability, red dots represent each
individual participant’s difference score) stimulation averaged across all blocks during and after tDCS stimulation (D1, D2, P1, and P2). Imagery strength
can be seen to increase with anodal stimulation. (B) Effect of joint electrical stimulation of prefrontal cortex and visual cortex. The left image shows
brain areas targeted in the final tDCS study. Data shows non-significant effects of cathodal occipital + anodal pFC stimulation (blue bars, blue dots
represent individual participants data), anodal occipital + cathodal pFC stimulation (red bars, red dots represents individual participants data) and sham
stimulation (grey bars grey dots represent individual participants data). All error bars show ± SEMs and stars (*) indicate a significant effect of tDCS
polarity.
The online version of this article includes the following source data for figure 5:
Source data 1. 1.5mA Prefrontal tDCS data.
Source data 2. 1.5mA combined tDCS data.
Keogh et al. eLife 2020;9:e50232. DOI: https://doi.org/10.7554/eLife.50232 8 of 33Research article Neuroscience
was run with a 2 (tDCS polarity: cathodal and anodal), x 4 (block: D1, D2, P1, P2 – see Figure 4—fig-
ure supplement 1A for timeline and Figure 4—figure supplement 1G for data for each block) x 2
(order of stimulation: cathodal on the first or second day) design. The effect of tDCS polarity was sig-
nificant (c2(1)=6.86, p=0.009, see Figure 5A). Interestingly, in contrast to the visual cortex, where
decreasing excitability led to stronger imagery, we found the opposite pattern for frontal areas (see
Figure 5A).
Taken together, these fMRI and tDCS data provide evidence that the cortical excitability of pre-
frontal cortex also plays a role in governing the sensory strength of visual imagery.
The joint role of visual and frontal cortex activity in visual imagery
strength: fMRI
Beyond the individual roles of prefrontal and visual cortex in forming mental images, evidence sug-
gests that both areas can act together as part of an imagery network (Østby et al., 2012;
Schlegel et al., 2013). Hence, we combined the whole-brain normalized mean fMRI intensity scores
from the two areas (frontal and visual) and related their ratio to imagery strength. We found that the
ratio of V1 to superior frontal activity predicted the strength of visual imagery (Spearman rank:
rs = 0.53, p=0.002). This effect also held when controlling for the Euklidean distance between the
two areas (partial Spearman rank: rs = 0.54, p=0.002). Hence, participants with both comparatively
lower levels of visual cortex normalized mean intensity and higher frontal levels had stronger
imagery.
To assess the possibility that cortical connectivity might be driving this fronto-occipital excitability
relationship, we analyzed the individual functional connectivity of the same two areas for each partic-
ipant, that is, the degree to which the BOLD signals in each area correlate over time. The functional
connectivity did not significantly predict imagery strength (r = 0.24, p=0.19). This suggests that the
combination of highly active frontal areas and low visual cortex excitability might present an optimal
precondition for strong imagery creation, irrespective of the temporal coupling of their activity.
The joint role of visual and frontal cortex activity in visual imagery
strength: tDCS
To further investigate the possibility that optimal imagery strength occurs with a combination of low
levels of excitability in visual cortex and high levels in prefrontal cortex, a new tDCS experiment was
run where both prefrontal and visual cortex were simultaneously stimulated during imagery genera-
tion using the same blocked design as in all previous tDCS experiments (1.5mA). There were 3 con-
ditions in this study, the first condition aimed to increase prefrontal (anodal) and decrease visual
cortex (cathodal) excitability (blue dots in Figure 5B), the second condition decreased prefrontal
(cathodal) and increased visual cortex (anodal) excitability (red dots in Figure 5B), and the third con-
dition was a sham condition where the tDCS machine shut off after 30 s (grey dots in Figure 5B). A
linear mixed-effects analysis was run with a 3 (tDCS polarity: cathodal, anodal and sham), x 4 (block:
D1, D2, P1, P2 – see Figure 4—figure supplement 2A for timeline and Figure 4—figure supple-
ment 2E for data for each block) x 3 (order of stimulation: cathodal on first, second or third day)
design. However, the effect of tDCS polarity was not significant (tDCS c2(2)=2.70, p=0.26), see
Figure 5B).
Summary of cortical excitabilities effect on imagery strength
In summary, visual cortex excitability reliably correlated negatively with the strength of visual imag-
ery using both fMRI and TMS as measurement tools (Figures 2 and 3). Modulating visual cortex
excitability also altered the strength of visual imagery (Figure 4B & C, see Table 1 for a summary of
all tDCS experiments). Specifically decreasing visual cortex excitability led to increased visual imag-
ery strength. There was also evidence that altering prefrontal cortex excitability modulates visual
imagery strength, but in the opposite pattern to visual cortex – increasing prefrontal cortex excitabil-
ity led to increased imagery strength (see Figure 5A). However, combining stimulation of the frontal
and occipital cortex had no reliable effect on modulating visual imagery strength.
Keogh et al. eLife 2020;9:e50232. DOI: https://doi.org/10.7554/eLife.50232 9 of 33Research article Neuroscience
Table 1. Summary of montage, intensity, duration, and significance of each tDCS experiment.
Experiment # Montage (EEG Coordinates) Intensity + duration Notes Significant
1 Active: Inion (Oz) 1 mA Tested effect on imagery strength
Occipital Reference: Supraorbital (Fpz) 15 min
2 Active: Inion (Oz) 1.5 mA Tested effect on imagery strength [
Occipital Reference: Right Cheek 15 min
3 Active: Inion (Oz) 1.5 mA Tested effect on imagery strength (additional sham condition) [
Occipital Reference: Right Cheek 15 min
4 Active: Between F3-Fz 1.5 mA Tested effect on imagery strength [
Prefrontal Reference: Right Cheek 15 min
5 Active: Inion (Oz) 1.5 mA Tested effect on imagery strength
Occipital + Prefrontal Active: Between F3-Fz 15 min
Additional control Active: Inion (Oz) 1.5 mA Tested effect on phosphene threshold [
Occipital Reference: Right Cheek 15 min
Discussion
Perhaps as far back as Plato, but overtly since the 1880s philosophers, scientists and the general
populace have wondered why the human imagination differs so profoundly from one individual to
the next. This question has recently gained fresh notability and attention with the introduction and
classification of the term aphantasia to describe individuals who self-report no visual imagery at all
(Zeman et al., 2015; Keogh and Pearson, 2018). Here, we provide evidence that pre-existing levels
of neural excitability and spontaneous resting activity in visual cortex can influence the strength of
mental representations as measured using the binocular rivalry paradigm. Our data indicate that par-
ticipants with lower excitability in visual cortex have stronger sensory imagery. Furthermore, we pro-
vide causative evidence, using tDCS over visual cortex, that altering neural excitability in these areas
can modulate imagery strength. Prefrontal cortex excitability also played a role in controlling the
strength of visual imagery, however, in the opposite direction to visual cortex excitability.
It should be noted that while previous work has demonstrated that this measure of imagery
strength can be separated from feature-based attention (Pearson et al., 2008a), we cannot explicitly
rule out the possibility that tDCS was improving other cognitive mechanisms that are involved in this
task such as sustained or selective attention. Visual imagery has also been shown to have multiple
features such as strength, vividness, capacity and precision (Keogh and Pearson, 2017;
Pearson et al., 2011; Bergmann et al., 2016a) . Here, we found that the strength of imagery was
improved by cathodal stimulation of the early visual cortex and anodal of the prefrontal cortex. How-
ever, there was no evidence of visual or prefrontal cortex stimulation in altering the vividness of
visual imagery, despite imagery strength correlating with these ‘online’ vividness measures. Addi-
tionally, our current studies also only used imagery of red and green Gabor patches, which have fea-
tures particularly suited to early visual cortex and likely recruit this region during imagery. More
complex imagery, such as imagery of faces, may rely less on representations in early visual cortex
and more so on representations and excitability further upstream of the cortex, such as the fusiform
face area in the case of face imagery. Future research should assess what qualities of visual imagery
are, and are not, altered by stimulation of early visual cortex, and prefrontal cortex to further eluci-
date the neural mechanisms underlying individual differences in visual imagery. It may be the case
that all forms of visual imagery are improved by prefrontal cortex stimulation, due to an increase in
the strength of top-down signals, whereas only images that require activation of low-level sensory
features, such as color or orientation, will be influenced by the excitability of early visual cortex.
Another limitation to our study is that although the majority of participants in our tDCS experi-
ments showed the same pattern of results (larger increases in imagery strength in the cathodal vs
anodal condition for occipital stimulation, and vice versa for prefrontal), there were some partici-
pants who showed the opposite pattern. It is important to note that while tDCS has been shown to
modulate visual cortex excitability in numerous studies as well as our control experiment, there are
large interindividual differences in the amount of the modulation that occurs for each individual
(Chew et al., 2015; López-Alonso et al., 2014) and sometimes the direction of these excitability
changes (Strube et al., 2016). Recent research suggests that cortical morphology (Filmer et al.,
Keogh et al. eLife 2020;9:e50232. DOI: https://doi.org/10.7554/eLife.50232 10 of 33Research article Neuroscience
2019a; Laakso et al., 2019; Laakso et al., 2015), proportion of neuro-modulators (Filmer et al.,
2019b) and brain state (Bergmann, 2018) can all influence how well tDCS is able to modulate brain
activity and behaviour.
Over the last 30 years, empirical work has demonstrated many commonalities between imagery
and visual perception (see Pearson et al., 2015b; Dijkstra et al., 2019 for a review). However, the
two experiences have clear phenomenological differences between them. Our findings suggest a
possible dissociation between mental imagery and visual perception in regards to cortical excitabil-
ity’s role in shaping externally versus internally driven visual representations. Previous work has dem-
onstrated that perceptual sensitivity is associated with higher levels of visual cortex excitability
(Ding et al., 2016; Antal et al., 2001; Kraft et al., 2010; Reinhart et al., 2016), whereas our results
suggest the opposite for mental imagery; stronger imagery is associated with lower visual excitabil-
ity. Interestingly, some studies of visual perception have found that reducing visual cortex excitability
can improve performance on more complex perceptual tasks, such as discrimination and object
tracking (Antal et al., 2004a; Waterston and Pack, 2010). It may be the case that, although both
perception and imagery recruit visual cortex, the optimal visual cortex conditions for task perfor-
mance vary as a function of task demands. Considering these results in terms of differences in sig-
nal-to-noise ratios (Miniussi et al., 2013) may help to explain the contrasting findings in perceptual
tasks, as well as the results from our current imagery experiments.
Neural activity can be thought of as a combination of signal related activity and neural noise. The
signal is often defined as the number, or proportion of neurons that code for a specific stimulus,
with higher firing rates resulting in a stronger signal. Noise can be thought of as the activity of all
other non-signal related neural activity. A higher signal-to-noise ratio will generally result in better
performance on behavioral tasks. Increasing cortical excitability can potentially be a source of noise,
through increasing the likelihood of all neurons in the stimulation region to fire, whereas decreasing
cortical excitability reduces the likelihood of neurons to fire, reducing neural noise.
In very basic detection tasks, an injection of noise into the visual cortex may result in better detec-
tion by pushing a subthreshold signal over a given threshold, leading to a higher proportion of signal
relative to noise. Conversely, in a discrimination task where two or more potential outcomes exist, it
may be the case that adding random noise to the signal will enhance both (anticipatory) stimulus-
related representations in a non-selective manner. Decreasing cortical excitability, on the other
hand, reduces the likelihood of neurons to fire, which will decrease both anticipatory signals and
neural noise, potentially resulting in better performance as only one of the two representations reach
supra-threshold.
Decreasing visual cortex excitability during imagery may make it harder to induce an action
potential in visual cortex neurons, through lowering membrane potentials. However, this also
reduces random noise, which may result in a better signal-to-noise ratio and as such stronger imag-
ery. Another possibility is that when tasks rely more heavily on top-down signals, such as in an imag-
ery task, reduction in sensory noise might allow for better communication among neurons in the
visual cortex. Furthermore, it is also possible that tDCS stimulation has a tendency to selectively
reduce non-imagery related signals: tDCS appears to have a larger impact on the more superficial
cortical layers than on the deeper cortical layers, as the superficial layers are closer to the current
source (Komarov et al., 2019). Interestingly, recent research suggests that imagery-related signals
are predominantly found in deep cortical layers (Bergmann et al., 2019). As a consequence, tDCS
may attenuate signals in the mid- and superficial layers more than those in the deep layers, thereby
causing a relative advantage of deep-layer imagery-related signals over the ones arising in the other
layers.
The findings that visual cortex excitability is negatively related to imagery strength could hence
be explained by hyperexcitability acting as a source of noise, which, when reduced, leads to less
neural noise in the visual cortex resulting in a higher signal-to-noise ratio and thus stronger imagery.
A signal-to-noise ratio explanation also aligns well with our findings related to prefrontal cortex
excitability. Greater excitability of frontal cortex may allow for amplification of the top-down signal,
either through boosting firing, or shaping of neuronal population activity. Increased top-down sig-
nals might also allow for a greater inhibition of non-signal related neural noise further down the cor-
tical hierarchy, resulting in a higher signal-to-noise ratio in the visual cortex.
This signal-to-noise hypothesis of visual imagery is in line with findings from related research. A
study on grapheme-color synesthesia found that - contradictory to our results - synesthetes had
Keogh et al. eLife 2020;9:e50232. DOI: https://doi.org/10.7554/eLife.50232 11 of 33Research article Neuroscience
enhanced resting-state visual cortex excitability (measured using phosphene thresholds). However,
they also found that synesthetic experience could be enhanced by reducing visual excitability via
tDCS (Terhune et al., 2015a). These seemingly contradictory results were thought to be due to two
different mechanisms. The authors suggested that a hyperexcitable visual cortex during brain devel-
opment may be what leads to individuals developing synesthesia in the first place; in adulthood,
however, decreasing visual cortex excitability might lead to increased signal-to-noise in the visual
cortex, thereby enhancing the synesthetic experience (Terhune et al., 2015a). In addition to this,
other research indicates that the expectation of a visual stimulus leads to a stimulus template in
visual cortex, with reduced activity in V1 and improved stimulus decoding by pattern classifiers
(Kok et al., 2013). Similarly, reduced early visual cortex activity increases the likelihood of visual hal-
lucinations in a subsequent detection task (Pajani et al., 2015). The convergence of these data
appears to indicate that ‘background’ neural noise in sensory cortices may play an important role in
modulating the strength of mental representations.
Despite much evidence for the involvement of the prefrontal cortex and visual cortex working in
concert during visual imagery, we found that while manipulating either prefrontal or visual cortex
excitability in isolation could induce increases in imagery strength, simultaneous stimulation of visual
and prefrontal cortices had no effect on visual imagery. One possible explanation for these results is
that modulating activity in two regions of the brain is too much of a change and has an overall dis-
ruptive effect on imagery formation. However, neither of the stimulation conditions resulted in signif-
icant reductions as compared to sham stimulation, making this explanation unlikely.
There also exists large variability in prefrontal cortex anatomy and tDCS effectiveness, with recent
research showing that the thickness of left prefrontal cortex correlated with behavioral changes from
anodal (but not cathodal) stimulation (Filmer et al., 2019a). It might be that these large variations
play a role in our null findings; however, we did find that isolated stimulation to prefrontal cortex
modulated imagery strength, making this another unlikely explanation of these null results. A plausi-
ble explanation may be that during simultaneous stimulation of visual and prefrontal cortex, other
regions were modulated as well, inducing the null effect (Bikson et al., 2010), or that this montage
leads to smaller current densities and changes in excitability in both visual and prefrontal cortex. For
example, a previous study found evidence that the distance between electrodes alters the stimula-
tion effects when other stimulation parameters are kept consistent (Moliadze et al., 2010). It might
be the case that due to the spacing of the electrodes the current density may have been reduced, as
the reference electrode was further from the active electrode as compared to our studies with signif-
icant results (Supraorbital vs cheek in significant studies). Our first study also resulted in non-signifi-
cant results, which may be due to a lower intensity of stimulation (1mA vs 1.5mA in significant
studies). However, this may also have been driven in part by the placement of the reference elec-
trode. It seems possible that in our case, the montage we used to stimulate prefrontal and occipital
cortex simultaneously may not have been sufficient to alter cortical excitability in these two regions,
resulting in no significant changes in visual imagery strength.
Our findings do conflict with some previous research on visual imagery. For example, one study
found that applying 1 Hz TMS to area BA 17 (primary visual cortex), slowed responses in a task
where individuals had to imagine stripes (or were perceptually shown stripes) and answer questions
about these images (Kosslyn, 1999). Although these chronometry type experiments are very com-
mon in early visual imagery research and were important in advancing the field as a whole, they do
not provide any information about the quality or sensory representational nature of the images held
in mind. Slower reaction times on both the perception and imagery task may be due to a general
slowing of cognitive performance or visual scanning, rather than reflecting any change in the quality
of the visual images created in the mind. Previous work has also found positive correlations between
BOLD activity in the visual cortex and the vividness of visual imagery questionnaire (Cui et al., 2007;
Amedi et al., 2005). Additionally, some TMS studies have found that during visual imagery, visual
cortex excitability increases (Cattaneo et al., 2011; Sparing et al., 2002). These findings at first may
seem incompatible with our results; however, these studies measure event-related neural changes,
rather than comparing changes in task performance due to modulation of neural activity, or assess-
ing how the resting levels of visual cortex activity influence task performance. It may very well be the
case that on average in our tasks neural activity increases with imagery, and perhaps those with the
lowest levels of resting activity have the largest changes in neural activity. For example, to calculate
BOLD changes a baseline of ‘resting-state’ activity is used. It may be that participants with initially
Keogh et al. eLife 2020;9:e50232. DOI: https://doi.org/10.7554/eLife.50232 12 of 33Research article Neuroscience
low visual cortex excitability are able to increase visual cortex activity more-so than those with
higher levels, and this could potentially explain the larger BOLD changes for individuals with stron-
ger visual imagery.
It is possible that the observed effects of cortical excitability may be driven by individual differen-
ces in inhibitory and excitatory neurotransmitter concentrations. Numerous studies have investigated
what neurotransmitters modulate cortical excitability with GABA and Glutamate being implicated in
controlling inhibition and excitability, respectively. While the relationship between GABA and corti-
cal excitability/activity is more ambiguous (Terhune et al., 2015b; Boillat et al., 2020), the concen-
tration of glutamate in the early visual cortex has been shown to correlate positively with visual
cortex excitability (measured by phosphene thresholds) in both normal and synesthetic participants
(Terhune et al., 2015b). There is also evidence for a strong link between BOLD-fMRI activity and
glutamate concentration: using a combined fMRI-MRS approach where BOLD-fMRI activity and glu-
tamate signals were recorded simultaneously, researchers found that the time courses of fMRI-BOLD
activity and Glutamate concentration were strongly correlated (Ip et al., 2017). Evidence of such a
relationship at a between-subject level is missing but seems plausible. If this is the case, then the
observed relationships of our neural measures and visual imagery may (at least partly) be due to indi-
vidual differences in the concentration of glutamate in visual cortex: a lower level of glutamate in the
visual cortex might result in less excitatory neuronal noise, thereby increasing the signal-to-noise
ratio of top-down signals that govern the generation of internal images in the visual cortex.
A plethora of imagery research has demonstrated evoked and content specific BOLD responses
in early and later visual cortex when individuals form a mental image (for reviews of this work see:
Pearson et al., 2015b; Dijkstra et al., 2019). Here, however, we took a different approach by exam-
ining the individual variation in brain physiology that might form the preconditions for strong or
weak imagery. This endeavor required a non-event related design. Interestingly, such non-event
related designs utilizing inter-individual differences are now commonly used to mechanistically link
human cognition and brain function or anatomy (Kanai and Rees, 2011). Our results add to this
growing body of research, which demonstrates that pre-existing brain activity parameters can funda-
mentally influence mental performance.
Our observations may also have clinical applications: In many mental disorders, imagery can
become uncontrollable and traumatic. On the other hand, mental imagery can also be harnessed
specifically to treat these disorders (Pearson et al., 2015b). Interestingly, disorders that involve
visual hallucinations such as schizophrenia and Parkinson’s disease are both associated with stronger
and/or more vivid mental imagery (Shine et al., 2015; Sack et al., 2005). It has recently been sug-
gested that the balance between top-down and bottom-up information processing may be a crucial
factor in the development of psychosis, with psychosis prone individuals displaying a shift in informa-
tion processing towards top-down influences over bottom-up sensory input (Teufel et al., 2015).
Our data indicate that it may be possible to treat symptomatic visual mental content by reducing its
strength via non-intrusively manipulating cortical excitability. Alternatively, we may be able to ‘surgi-
cally’ boost mental image simulations specifically during imagery-based treatments, resulting in bet-
ter treatment outcomes. Further research on longer lasting stimulation protocols, and the individual
differences in response to brain stimulation is needed to assess its therapeutic potential.
In conclusion our data demonstrates that visual cortical excitability, as well as prefrontal excitabil-
ity, appears to play a role in governing the strength of an individual’s visual imagery strength provid-
ing a potential explanation for the large variation in visual imagery that exists within the general
population and providing a promising new tool for altering the strength of visual imagery.
Materials and methods
Study design
The first study with fMRI was exploratory, to assess whether resting levels of BOLD might predict
visual imagery. We followed this with a correlational TMS study and aimed to collect phosphene
thresholds from 30 to 35 participants, which would give us power of around 80–85% for a moderate
correlation (in line with the fMRI correlations of r = ~. 45). All tDCS experiments were designed as
repeated measures studies (with the aim of all participants completing all conditions in the study).
We aimed to collect data from 15 to 20 participants, as most tDCS studies examining effects on
Keogh et al. eLife 2020;9:e50232. DOI: https://doi.org/10.7554/eLife.50232 13 of 33Research article Neuroscience
cognition have found significant effects with this range of participants (see for examples: Javadi and
Cheng, 2013; Strobach et al., 2015; Manuel et al., 2014; Javadi et al., 2012). Data collection
stopped once we had at least 15 participants in each group who had completed 2 days of testing,
no more participants were recruited beyond this point; however, participants were not cancelled if
we reached 15 (e.g. if we had collected 15 participants for both days but still had 2 more partici-
pants who had completed 1 day of testing, we still ran them through the study – resulting in 17
participants).
Participants
All MRI participants were right-handed and had normal or corrected-to-normal vision, with no history
of psychiatric or neurological disorders. All tDCS and TMS participants had normal or corrected-to-
normal vision, with no history of psychiatric or neurological disorders, as well as no history of
migraines and/or severe or frequent headaches. All MRI research was carried out in Germany at the
Max Planck Institute for Brain Research and all brain stimulation research (tDCS and TMS) was car-
ried out in Australia at the University of New South Wales. Written informed consent was obtained
from all participants and the ethics committee of the Max Planck Society approved the MRI study
and the ethics committee of the University of New South Wales approved the tDCS and TMS
studies.
Exclusion criteria for the tDCS experiments
There were a number of strict exclusion criteria chosen a priori for the tDCS experiments due to the
technical psychophysics and brain stimulation experiments involved here. These are based on previ-
ous work using the binocular rivalry paradigm, which is a sensitive measure of visual imagery
strength when participants complete the task correctly. Due to the nature of the task, it is important
to include catch trials/exclusion criteria to assess whether participants are correctly and reliably com-
pleting the task. These values are based on exclusion criteria we have used in previous experiments
using this paradigm.
Brain imaging sample
Thirty-two individuals (age range: 18–36 years, median: 25.5; 13 males) participated in the fMRI rest-
ing-state and retinotopic mapping measurements and in the behavioral experiment. These individu-
als had been part of previous studies (Bergmann et al., 2016a; Bergmann et al., 2016b). Of the
original imagery study (Bergmann et al., 2016a), which included 34 participants, 1 participant had
not done the fMRI resting-state measurement (but this individual participated in the additional fMRI
resting-state measurement, see further below). The other participant was excluded because of
reporting several migraine attacks shortly prior to the measurement. Migraine is known to affect
fMRI BOLD activity and cortical excitability (Coppola and Schoenen, 2012; Welch, 2005). One par-
ticipant was excluded from data analysis because of misunderstanding the task instructions in the
behavioral imagery task (this participant had already been excluded in the original study). The data
analysis was done with the remaining 31 individuals. To look at the reliability of the observed rela-
tionships, we also analysed the data of an additional fMRI resting-state measurement (with different
sequence parameters, see further below). This sample also included 31 individuals (age range: 22–36
years). Of these, 30 had also participated in the original resting-state measurement. Hence, there
were two participants of which only one resting-state measurement was available, respectively: for
one participant, only the fMRI measurement with TR = 2 s had been done, and for the other one,
only the fMRI measurement with TR = 1 s. Participants were reimbursed for their time at a rate of
15e per hour. Written informed consent was obtained from all participants and the ethics committee
of the Max Planck Society approved the study.
TMS samples
All participants in both the TMS and tDCS studies had normal or corrected to normal vision, no his-
tory of any neurological or mental health issues or disorders, no history of epilepsy or seizures them-
selves or their immediate family, no history of migraines and no metal implants in the head or neck
region. We aimed to collect phosphene thresholds from 30 to 35 participants, which would give us
power of around 80–85% for a moderate correlation (in line with the MRI correlations). A total of 37
Keogh et al. eLife 2020;9:e50232. DOI: https://doi.org/10.7554/eLife.50232 14 of 33Research article Neuroscience
participants participated in this study for money ($30 per hour) or course credit, five participants
were excluded due to an inability to produce reliable phosphenes (see Table 2 and exclusion crite-
ria). Of the remaining thirty-two participants 15 were female, age range: 18–30). Written informed
consent was obtained from all participants and the ethics committee of the University of New South
Wales approved the study.
TDCS samples
For all tDCS experiments, we aimed to collect data from 15 to 20 participants, as most tDCS studies
examining effects on cognition have found significant effects with this range of participants (see for
examples: Javadi and Cheng, 2013; Strobach et al., 2015; Manuel et al., 2014; Javadi et al.,
2012). A priori we chose a cut-off of 33% of trials being mixed as an exclusion criterion (see Table 2
for explanations of all exclusion criteria and Table 3 for tally of all exlcuded participants). The reason
for this is that mixed trials are not included in our analysis, and as such a large number of mixed trials
vastly decrease the number of analyzable trials. Participants whose imagery scores were lower than
40% were also excluded, as it is difficult to tell if these data should be defined as strong or weak
imagery, or due to a participant just not completing the task correctly. This measure of imagery
strength is predicated on how the energy of a stimulus impacts on binocular rivalry. Very weak per-
ceptual stimuli prime binocular rivalry up unto a certain point. At this tipping point, as the image
becomes stronger, it begins to suppress binocular rivalry (Brascamp et al., 2007). For this reason,
when priming is low this indicates suppression that may either mean the participant’s visual imagery
is so strong it is suppressing binocular rivalry, or the participant is not completing the task correctly.
For the first tDCS experiment (1mA, Occipital and Supraorbital), a total of 21 subjects partici-
pated for money or course credit. Five participants were excluded from our analysis, as the number
of usable trials was small due to too many reported mixed rivalry percepts (more than a third of tri-
als, N = 3) and two were excluded due to low priming scores (see Table 1 for exclusion criteria). Of
the remaining 16 participants, 7 were female, and the age range was 18–32.
For the second tDCS experiment (1.5mA, Occipital and Cheek), a total of 37 subjects participated
for course credit. Due to a faulty tDCS cable, many of these participants had the tDCS machine shut
off/exceeded voltage on the first day of testing (N = 9, see Table 2 for exclusion criteria) and they
did not come back for the second day of testing. Of the 30 participants who did not exceed voltage
in the first day two were excluded due to low priming and two had a high number of mixed trials
(see Table 1 for exclusion criteria). Of the remaining 26, nine participants only had one day of testing
data available due to the machine exceeding voltage on the second day of testing, two participants
had one day of testing removed due to low priming on one of the 2 days, age range 18–26.
For the third tDCS experiment (1.5mA, Occipital and Cheek + Sham), a total of 28 subjects partic-
ipated for course credit or payment ($40 per hour). Two participants were excluded due to technical
issues with the computer on the first day of testing, one participant was excluded for pressing the
incorrect buttons during the task/due to misunderstanding of the task, one participant was excluded
due to removing the tDCS during the testing session, one participant was removed for a high num-
ber of mixed trials and one for high mock priming (see Table 1 for exclusion criteria). Of the remain-
ing 22 participants, the age range was 18–23. Of these participants 4 only completed 2 of the 3 days
of testing due to attrition (N = 3) and machine malfunction/exceeded voltage (N = 1). Another 4 par-
ticipants also only completed one day of testing due to attrition (N = 3) and machine malfunction
(N = 1).
For the fourth tDCS experiment (1.5mA, left prefrontal and cheek), 31 participants participated in
the study for course credit. Due to a faulty tDCS cable, for many of these participants the tDCS
machine shut off/exceeded voltage on the first day of testing (N = 4), and as such, they did not com-
plete the study. Two participants’ data was removed due to very high mock priming, indicating
either a misunderstanding of the task or demand characteristics and one was removed due to very
low priming (see Table 1 for exclusion criteria). Of the remaining 24 participants, seven had one
day’s worth of data due to the tDCS machine shutting off/exceeding voltage (N = 3) or attrition
(N = 2), or having very low imagery priming on one of the days (N = 2), age range was 18–25 years.
For the fifth tDCS experiment (1.5mA, left prefrontal and occipital cortex + sham), 28 participants
participated in the study for course credit or payment (AUD $40 per hour). Three participants were
excluded due to very low priming, one participant was excluded due to technical issues with the
tDCS machine (exceeding impedance/voltage on the first day) and five participants were excluded
Keogh et al. eLife 2020;9:e50232. DOI: https://doi.org/10.7554/eLife.50232 15 of 33You can also read


