Long-range aerosol transport and impacts on size-resolved aerosol composition in Metro Manila, Philippines
←
→
Page content transcription
If your browser does not render page correctly, please read the page content below
Atmos. Chem. Phys., 20, 2387–2405, 2020
https://doi.org/10.5194/acp-20-2387-2020
© Author(s) 2020. This work is distributed under
the Creative Commons Attribution 4.0 License.

Long-range aerosol transport and impacts on size-resolved aerosol
composition in Metro Manila, Philippines
Rachel A. Braun1 , Mojtaba Azadi Aghdam1 , Paola Angela Bañaga2,3 , Grace Betito3 , Maria Obiminda Cambaliza2,3 ,
Melliza Templonuevo Cruz2,4 , Genevieve Rose Lorenzo2 , Alexander B. MacDonald1 , James Bernard Simpas2,3 ,
Connor Stahl1 , and Armin Sorooshian1,5
1 Department    of Chemical and Environmental Engineering, University of Arizona, Tucson, AZ, USA
2 Manila   Observatory, Loyola Heights, Quezon City 1108, Philippines
3 Department of Physics, School of Science and Engineering, Ateneo de Manila University,

Loyola Heights, Quezon City 1108, Philippines
4 Institute of Environmental Science and Meteorology, University of the Philippines, Diliman, Quezon City 1101, Philippines
5 Department of Hydrology and Atmospheric Sciences, University of Arizona, Tucson, AZ, USA

Correspondence: Armin Sorooshian (armin@email.arizona.edu)

Received: 7 May 2019 – Discussion started: 30 August 2019
Revised: 24 January 2020 – Accepted: 29 January 2020 – Published: 28 February 2020

Abstract. This study analyzes long-range transport of            water-soluble organic acids, while the events impacted by
aerosol and aerosol chemical characteristics based on in-        long-range transport from continental East Asia showed high
stances of high- and low-aerosol-loading events determined       percent contributions from shorter-chain dicarboxylic acids
via ground-based size-resolved aerosol measurements col-         (i.e., oxalate) that are often representative of photochemical
lected at the Manila Observatory in Metro Manila, Philip-        and aqueous processing in the atmosphere. The low-aerosol-
pines, from July to October 2018. Multiple data sources, in-     loading event was subject to a larger precipitation accumula-
cluding models, remote sensing, and in situ measurements,        tion than the high-aerosol events, indicative of wet scaveng-
are used to analyze the impacts of long-range aerosol trans-     ing as an aerosol sink in the study region. This low-aerosol
port on Metro Manila and the conditions at the local and         event was characterized by a larger relative contribution from
synoptic scales facilitating this transport. Through the use     supermicrometer aerosols and had a higher percent contribu-
of case studies, evidence of long-range transport of biomass     tion from longer-chain dicarboxylic acids (i.e., maleate) to
burning aerosol and continental emissions is identified in       the water-soluble organic aerosol fraction, indicating the im-
Metro Manila. Long-range transport of biomass burning            portance of both primary aerosol emissions and local emis-
aerosol from the Maritime Continent, bolstered by south-         sions.
westerly flow and permitted by low rainfall, was identified
through model results and the presence of biomass burning
tracers (e.g., K, Rb) in the ground-based measurements. The
impacts of emissions transported from continental East Asia      1   Introduction
on the aerosol characteristics in Metro Manila are also iden-
tified; for one of the events analyzed, this transport was fa-   Better understanding of long-range transport of aerosol is
cilitated by the nearby passage of a typhoon. Changes in the     critical for determining the fate of atmospheric emissions and
aerosol size distributions, water-soluble chemical composi-      improving models of atmospheric aerosol. Nutrients (e.g.,
tion, and contributions of various organic aerosol species       Duce et al., 1991; Artaxo et al., 1994), bacteria (e.g., Bo-
to the total water-soluble organic aerosol were examined         vallius et al., 1978; Maki et al., 2019), and pollutants (e.g.,
for the different cases. The events impacted by biomass          Nordø, 1976; Lyons et al., 1978; Lindqvist et al., 1991) can
burning transport had the overall highest concentration of       be transported through the atmosphere over large distances
                                                                 across the globe. Atmospheric aerosol can undergo phys-

Published by Copernicus Publications on behalf of the European Geosciences Union.
2388                                                                      R. A. Braun et al.: Long-range aerosol transport

iochemical changes through photochemical and aqueous-            ing studies are needed. Insights into the fate of biomass burn-
processing mechanisms such that their characteristics at the     ing emissions in the atmosphere are crucial and applicable on
emission source can be quite different from those farther        a global scale, especially since studies have indicated an in-
downwind (e.g., Yokelson et al., 2009; Akagi et al., 2012).      creasing trend in biomass burning worldwide (Flannigan et
Large uncertainties remain in atmospheric aerosol models         al., 2009, 2013).
due to impacts of aqueous processing and wet scavenging              As a megacity in SE Asia, Metro Manila, Philippines (pop-
on aerosol (Kristiansen et al., 2016; Xu et al., 2019).          ulation in 2015 ∼ 12.88 million; Philippine Statistics Au-
   The plethora of both natural and anthropogenic emissions      thority, 2020), is a prime location for the study of locally pro-
in and around Southeast (SE) Asia; the proximity of islands      duced urban anthropogenic aerosol (Kim Oanh et al., 2006)
and continental regions in SE and East Asia; and the large,      that is mixed with biogenic, natural, and anthropogenic pol-
growing population makes SE Asia a prime candidate for the       lutants from upwind areas. Previous research conducted at
study of long-range transport of atmospheric aerosol. More-      the Manila Observatory (MO) in Quezon City, Metro Manila,
over, the extensive cloud coverage and precipitation during      characterized PM2.5 (particulate matter, PM, with aerody-
certain times of the year in SE Asia allow for an exami-         namic diameter less than 2.5 µm) and sources of measured
nation of the effects of aqueous processing and wet scav-        particles, with traffic emissions being the major source at
enging. Characterizations of aerosol in mainland SE Asia         MO (Simpas et al., 2014). Interestingly, levels of measured
and the Maritime Continent (MC), which includes the is-          PM2.5 at MO showed little variance between the wet (June–
lands south of the Philippines and north of Australia (e.g.,     October) and dry seasons (Simpas et al., 2014). Additional
islands part of Malaysia and Indonesia), have found major        studies have further characterized vehicular emissions by fo-
emission sources to be industrial activities, shipping, urban    cusing on black carbon (BC) particulate concentrations in
megacities, and biomass burning (Reid et al., 2013). In addi-    sites around the Metro Manila region, including near road-
tion, natural emission sources, including marine emissions,      ways (Bautista et al., 2014; Kecorius et al., 2017; Alas et al.,
plant life, and occasionally volcanic eruptions, intermingle     2018). Due to very high population density in Metro Manila,
with anthropogenic emissions. Mixing of aerosol from an-         it is expected that many of the urban PM sampling sites are
thropogenic and biogenic sources has been noted to be in-        highly affected by local anthropogenic sources as opposed to
fluential in the overall production of secondarily produced      long-range transport. However, the proximity of the Philip-
aerosol via gas-to-particle conversion processes (Weber et       pines to other islands and continental Asia raises the question
al., 2007; Goldstein et al., 2009; Brito et al., 2018). In ad-   of the relative impacts of long-range transport as opposed to
dition, the mixing of marine and biomass burning emissions       local emissions on not just Metro Manila but also downwind
can produce compositional changes, such as enhancements          regions.
in chloride depletion (e.g., Braun et al., 2017) and methane-        Long-range transport to the Philippines varies by season
sulfonate (MSA) production (Sorooshian et al., 2015). The        since there is a strong change in weather patterns throughout
mechanisms governing aerosol changes in mixed air masses         the year (Bagtasa et al., 2018). Another study of the aerosol
have wide-ranging and complex impacts and require further        over the South China Sea (SCS), which is bordered to the
study in regions, such as SE Asia, that are impacted by mul-     east by the Philippines, found seasonal changes in aerosol
tiple aerosol emission sources.                                  emission sources, with year-round anthropogenic pollution,
   One major contributor to atmospheric aerosol in SE Asia       smoke from the MC between August and October, and dust
and the MC that has received considerable attention is           from northern continental Asia between February and April
biomass burning. Biomass burning in SE Asia appears to           (Lin et al., 2007). The season from approximately June to
be dominated by anthropogenic activities, such as peatland       September (Cayanan et al., 2011; Cruz et al., 2013), referred
burning (Graf et al., 2009; Reid et al., 2013; Latif et al.,     to as the Southwest Monsoon (SWM) season, is character-
2018) and rice straw open-field burning (Gadde et al., 2009).    ized by increased prevalence of southwesterly winds and
However, current satellite retrievals underestimate the true     precipitation. During the SWM season, biomass burning is
emissions in the region (Reid et al., 2013). Identification of   prevalent in the MC, while biomass burning is more common
biomass burning emissions in the MC using satellite-based        in continental SE Asia during the winter and spring (Lin et
observations is difficult for numerous reasons, including the    al., 2009; Reid et al., 2013). While variability exists in the
characteristics of fires common to the region (e.g., low-        start dates of the different seasons, the northeast monsoon
temperature peat burning) and abundant cloud cover (Reid         transition generally occurs in October (Cruz et al., 2013),
et al., 2012, 2013). However, the potential for long-range       and previous research has defined this season as occurring
transport of biomass burning emissions from the MC has           from October to February (Bagtasa, 2011). During the north-
received considerable attention (Wang et al., 2013; Xian et      east monsoon, aerosol influences from northern East Asia
al., 2013; Reid et al., 2016a; Atwood et al., 2017; Ge et al.,   were measured in the northwestern edge of the Philippines
2017; Song et al., 2018). In order to better understand the      (Bagtasa et al., 2018). In addition to transport of aerosol to
frequency, amount, and fate of biomass burning emissions in      the Philippines, the influence of emission outflows from the
the MC and SE Asia, both in situ measurements and model-         Philippines has also been measured in the northern SCS at

Atmos. Chem. Phys., 20, 2387–2405, 2020                                           www.atmos-chem-phys.net/20/2387/2020/
R. A. Braun et al.: Long-range aerosol transport                                                                              2389

Dongsha Island (Chuang et al., 2013) and in coastal southeast     found in Table 1. Sample Teflon substrates (PTFE mem-
China (Zhang et al., 2012). Long-range transported aerosol in     brane, 2 µm pore, 46.2 mm diameter, Whatman) were cut in
SE and East Asia has various sources and, therefore, different    half for preservation for future analysis. Half-substrates were
physiochemical properties. However, the prevalence of the         extracted in 8 mL of Milli-Q water (18.2 M cm) in sealed
signal of long-range transported aerosol in a highly polluted     polypropylene vials through sonication for 30 min. Aqueous
megacity, such as Metro Manila, is not well characterized.        extracts were subsequently analyzed for ions using ion chro-
    As recent studies have indicated a decline in SWM rain-       matography (IC; Thermo Scientific Dionex ICS-2100 sys-
fall in the western Philippines and an increase in no-rain days   tem) and elements using triple quadrupole inductively cou-
during the typical SWM season (Cruz et al., 2013), the poten-     pled plasma mass spectrometry (ICP-QQQ; Agilent 8800 Se-
tial for wet scavenging of aerosol during these time periods      ries). The list of analyzed species and limits of detection for
could be decreasing. Furthermore, decreases in monsoonal          those species can be found in Table S1 in the Supplement,
rainfall in other parts of Asia, including India (Dave et al.,    with limits of detection in the parts per trillion (ppt) range for
2017) and China (Liu et al., 2019), have been linked to in-       ICP and the parts per billion (ppb) range for IC. Background
creases in aerosol, especially those of anthropogenic origin.     concentrations were also subtracted from each sample. For
Reinforcing mechanisms in these interactions, such as de-         each MOUDI set (naming convention: MO#), the mass con-
creased rainfall reducing wet scavenging, leading to higher       centration sum of the water-soluble species was calculated;
aerosol concentrations that in turn suppress precipitation, and   using this summation, the three high-aerosol-loading events
the corresponding climatic changes in monsoonal rain in the       were identified (MO7, MO12, and MO14), as well as the
western Philippines underscore the need to better understand      lowest aerosol event (MO11). The average ± standard de-
the processes governing atmospheric aerosol characteristics       viation of the total water-soluble species measured for the
and sources, especially during the monsoonal season.              remaining eight sets not identified in the high or low cate-
    The present study focuses on three high-aerosol-loading       gories is 6.99 ± 2.71 µg m−3 .
events, contrasted with a very low aerosol event, as iden-
tified by ground-based observations collected at MO from          2.2   Remote-sensing observations
July to October 2018. The objectives of the study are to
(i) describe synoptic- and local-scale conditions facilitat-
                                                                  Retrievals of atmospheric profiles from the Cloud-Aerosol
ing various transport cases; (ii) characterize aerosol physic-
                                                                  Lidar with Orthogonal Polarization (CALIOP) on board the
ochemical properties associated with long-range transport;
                                                                  Cloud-Aerosol Lidar and Infrared Pathfinder Satellite Ob-
and (iii) identify transformational processes, especially with
                                                                  servation (CALIPSO) satellite were taken for select satellite
regard to chemical composition, of aerosol during long-range
                                                                  overpasses corresponding to MOUDI sample sets of inter-
transport to the highly populated Metro Manila region. The
                                                                  est (Winker et al., 2009). Previous studies have examined the
results of this work have implications for better understand-
                                                                  ability of CALIOP to capture atmospheric profiles in SE Asia
ing (i) the fate of biomass burning emissions in a region
                                                                  and the MC, with one major challenge in this region being
with prevalent wildfires that are poorly characterized by re-
                                                                  the lack of cloud-free schemes (Campbell et al., 2013; Ross
mote sensing; (ii) the impact of transformational and removal
                                                                  et al., 2018). Overpasses corresponding to the three highest
mechanisms, including aqueous processing, photochemical
                                                                  aerosol events were analyzed, but no data were available for
reactions, and wet scavenging, on long-range transported
                                                                  the time encompassing MO11. The CALIOP Level 2 Verti-
aerosol from multiple sources; and (iii) typical synoptic- and
                                                                  cal Feature Mask (VFM) version 4.20 was used to distinguish
local-scale behavior of aerosol in a region that is both highly
                                                                  between clear air, clouds, and aerosol (Vaughan et al., 2004).
populated and gaining increasing attention due to campaigns
                                                                  For figures of CALIOP VFM data in this study, data are plot-
such as the NASA-sponsored Clouds, Aerosols, and Mon-
                                                                  ted at 30 m vertical resolution every 5 km along the satellite
soon Processes Philippines Experiment (CAMP2 Ex).
                                                                  ground track.

2     Methodology                                                 2.3   Models

2.1    Ground-based observations                                  To describe the synoptic-scale conditions, data were used
                                                                  from the Modern-Era Retrospective analysis for Research
As part of a year-long sampling campaign (CAMP2 Ex                and Applications, version 2 (MERRA-2; Gelaro et al., 2017).
weatHEr and CompoSition Monitoring: CHECSM) at the                Horizontal winds at 850 hPa (GMAO, 2015a) were tempo-
Manila Observatory (MO; 14.64◦ N, 121.08◦ E) in Quezon            rally averaged over the sampling period using 3 h instanta-
City, Metro Manila, Philippines, 12 sets of size-resolved         neous data and subsequently spatially averaged to increase
aerosol were collected from July to October 2018 using a          figure readability. The total cloud area fraction (GMAO,
micro-orifice uniform deposit impactor (MOUDI; Marple             2015b) was also temporally averaged over the sampling pe-
et al., 2014). Details for the 12 size-resolved sets can be       riod using 1 h time-averaged MERRA-2 data.

www.atmos-chem-phys.net/20/2387/2020/                                              Atmos. Chem. Phys., 20, 2387–2405, 2020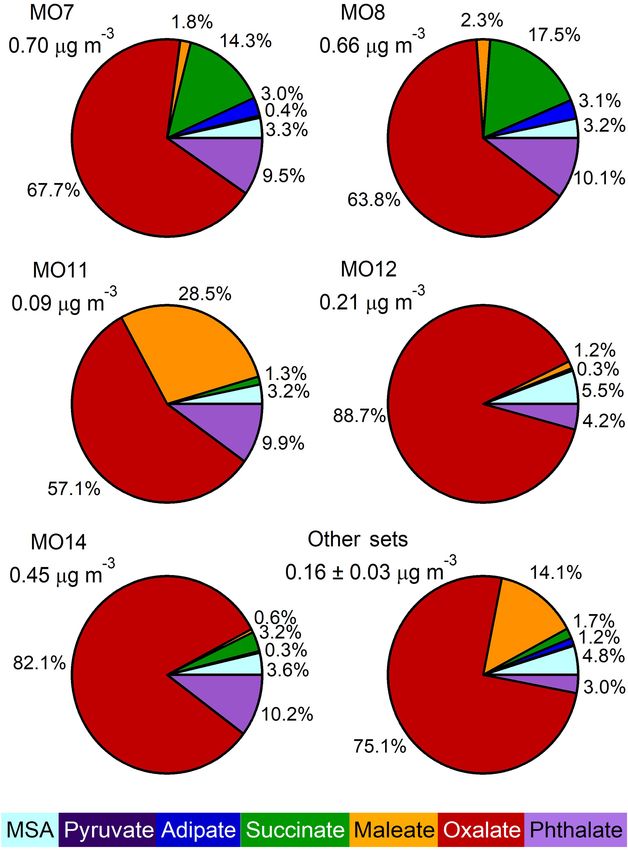
2390                                                                       R. A. Braun et al.: Long-range aerosol transport

Table 1. Description of the MOUDI sample sets from this study. Accumulated precipitation during the sample sets was found using
PERSIANN-CCS for the area bounded by 14.6067–14.6946◦ N and 121.0199–121.0968◦ E.

               Set name   Start date (MM/DD/YY)/    End date/    Total water-soluble      % of water-   Precipitation
                          local time                local time     species (µg m−3 )     soluble mass          (mm)
                                                                                               < 1 µm
               MO1        7/19/18                   7/20/18                    4.61           67.3 %              27
                          12:40                     12:43
               MO2        7/23/18                   7/25/18                    6.52           62.1 %              14
                          11:29                     17:10
               MO4        7/25/18                   7/30/18                    5.17           66.4 %              35
                          19:16                     18:12
               MO5        7/30/18                   8/1/18                     9.17           64.8 %              11
                          19:17                     13:19
               MO6        8/6/18                    8/8/18                     5.11           55.8 %              50
                          14:33                     14:38
               MO7        8/14/18                   8/16/18                   13.70           60.3 %               3
                          13:59                     14:04
               MO8        8/22/18                   8/24/18                   12.73           71.6 %              10
                          13:46                     13:53
               MO9        9/1/18                    9/3/18                     6.23           76.7 %              64
                          05:00                     05:05
               MO10       9/10/18                   9/12/18                    6.36           79.5 %              20
                          14:42                     15:02
               MO11       9/18/18                   9/20/18                    2.70           47.3 %              26
                          14:12                     14:24
               MO12       9/26/18                   9/28/18                   13.49           59.9 %               1
                          13:53                     13:53
               MO14       10/6/18                   10/8/18                   16.55           78.4 %               0
                          05:00                     05:05

   Five-day air mass back trajectories were calculated using      ing Artificial Neural Networks–Cloud Classification System
the Hybrid Single Particle Lagrangian Integrated Trajectory       (PERSIANN-CCS) dataset (Hong et al., 2004), which is
(HYSPLIT) model from NOAA (Stein et al., 2015) and grid-          available from the UC Irvine Center for Hydrometeorology
ded meteorological data from the National Centers for En-         and Remote Sensing (CHRS) Data Portal (Nguyen et al.,
vironmental Prediction/National Center for Atmospheric Re-        2019). PERSIANN-CCS has previously been used to ana-
search (NCEP/NCAR) reanalysis project. The model was run          lyze precipitation events in the region of interest, as shown
for back trajectories terminating at the MOUDI inlet (∼ 85 m      by the successful characterization of rainfall during Typhoon
above sea level) starting at the beginning of the sample set      Haiyan over the Philippines in November 2013 (Nguyen et
and every 6 h thereafter during each sample set, resulting        al., 2014). Benefits of PERSIANN-CCS include the data
in (1 + N/6) trajectories for each set, where N is the total      availability at 0.04◦ × 0.04◦ spatial resolution, while uncer-
number of sampling hours. Heights above ground level for          tainties in the dataset arise from sources such as a lack of bias
HYSPLIT back trajectories corresponding to the three high-        correction (Nguyen et al., 2014). Precipitation accumulated
aerosol-loading events (MO7, MO12, and MO14) can be               during the sample sets (Table 1) was calculated to be the aver-
found in Fig. S1 in the Supplement. The HYSPLIT model has         age found for the region surrounding MO in the box bounded
been used extensively in studies focused on regions across        by 14.6067–14.6946◦ N and 121.0199–121.0968◦ E.
the globe to study aerosol transport (Stein et al., 2015).           To further describe long-range transport activity, results
   Precipitation amounts were found using the Precipita-          from the Navy Aerosol Analysis and Prediction System
tion Estimation from Remotely Sensed Information us-              (NAAPS) operational model are included for the selected

Atmos. Chem. Phys., 20, 2387–2405, 2020                                                www.atmos-chem-phys.net/20/2387/2020/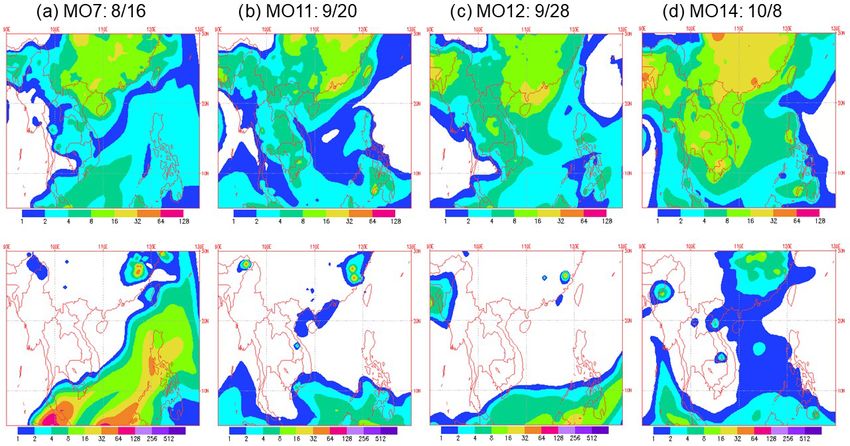
R. A. Braun et al.: Long-range aerosol transport                                                                           2391

study periods (Lynch et al., 2016; https://www.nrlmry.navy.     Philippines during the SWM season is also clearly shown in
mil/aerosol/, last access: 20 February 2019). Global meteo-     the biomass burning smoke surface concentrations from the
rological fields used in the NAAPS model are supplied by the    NAAPS model (Fig. 4a).
Navy Global Environmental Model (NAVGEM; Hogan et al.,
2014). The NAAPS model has previously been employed to          3.1.2   MO11 (18–20 September 2018): lowest aerosol
study aerosol in the MC (e.g., Xian et al., 2013).                      event

                                                                MO11 had the lowest overall water-soluble aerosol mass
3     Results                                                   concentration (2.7 µg m−3 ), which is over 6 times lower than
                                                                the highest aerosol MOUDI set. As evidenced by both the
3.1     Cases of long-range aerosol transport
                                                                850 hPa wind vectors (Fig. 1b) and the HYSPLIT back tra-
The following sections (3.1.1–3.1.4) describe the synoptic-     jectories (Fig. 2b) from this set, conditions are very different
and local-scale meteorological conditions governing long-       from the highest three aerosol events and show transport pat-
range aerosol transport during the three highest aerosol        terns with flow originating over the open ocean to the east of
events (MO7, MO12, and MO14) and, for the purposes of           the Philippines moving almost due west. The lack of anthro-
comparison, the lowest aerosol event (MO11). Also included      pogenic aerosol sources in the path of the back trajectories
are characterizations of aerosol from remote-sensing and        could result in the overall low amount of aerosol observed.
model results. Results of size-resolved aerosol characteriza-   This set was also characterized by high accumulated rainfall
tion at MO are discussed in Sect. 3.2.                          amounts for the region in the path of the back trajectories
                                                                (Fig. 2b) and in the area surrounding MO as compared to the
3.1.1    MO7 (14–16 August 2018): smoke transport from          highest aerosol events (Table 1), increasing the possibility
         the Maritime Continent                                 that wet scavenging effectively removed most of the trans-
                                                                ported (and, to some extent, local) aerosol. In addition, the
Many previous studies have focused on the prevalence of         NAAPS model showed no smoke influence from the MC and
biomass burning in the MC and the potential for transport       an isolated anthropogenic and biogenic fine aerosol plume
of smoke towards the Philippines (Wang et al., 2013; Xian       around Metro Manila, suggesting local sources accounted for
et al., 2013; Reid et al., 2016a; Atwood et al., 2017; Ge et    the majority of the measured aerosol (Fig. 4b).
al., 2017; Song et al., 2018). Figure 1a shows the average
850 hPa wind vectors and cloud fraction for the MO7 sam-        3.1.3   MO12 (26–28 September 2018): impacts of
pling period. The prevailing wind direction was towards the             Typhoon Trami
northeast, consistent with typical SWM flow. Furthermore,
areas with lower cloud coverage were present to the south-      Typhoon Trami (Category 5) passed to the northeast of the
west of Metro Manila. The HYSPLIT back trajectory for           island of Luzon in the Philippines during MO12 (Fig. 1c).
this sample set also shows an air mass originating around       Typhoon influences on atmospheric aerosol, caused by vary-
the MC to the southwest of MO that is then transported over     ing factors such as wind speed and precipitation, have been
the ocean towards the Philippines (Fig. 2a). As evidenced       studied in China (Yan et al., 2016; Liu et al., 2018), Korea
by the name of the season (i.e., Southwest Monsoon), this       (Kim et al., 2007), Malaysia (Juneng et al., 2011), the South
trajectory is typical for this time of the year and was the     China Sea (Reid et al., 2015, 2016b), and Taiwan (Fang et al.,
dominating trajectory pattern for the remaining eight sample    2009; Chang et al., 2011; Lu et al., 2017). The influences of
sets not chosen for in-depth analysis (Fig. S2). Furthermore,   typhoons on biomass burning emissions and transport in the
for MO1–MO10 (i.e., all sample sets with prevailing south-      MC have also been examined (Reid et al., 2012; Wang et al.,
westerly wind influence), MO7 had the lowest rain amount        2013). In this case, the influence of this storm changed the
for the surrounding region, followed by MO8, which had the      prevailing wind direction approaching the northern Philip-
fourth-highest water-soluble aerosol concentration (Table 1).   pines, effectively pulling an air mass from the west of the is-
This suggests that wet scavenging could have been less in-      land and, along with it, emissions from continental East Asia
fluential in MO7 and MO8, thereby leading to an increase        (Fig. 2c). Furthermore, the air mass passed through regions
in the PM measured. Three CALIPSO overpasses near MO            of relatively little rainfall during transport to the Philippines
occurred during the MO7 sample set and one occurred dur-        (Fig. 2c), and accumulated rainfall at MO during this sample
ing the nighttime after sampling ended; however, the signal     set was very low (Table 1). One CALIPSO overpass around
was largely attenuated in the lower 8 km during the daytime     the ending time of set MO12 and one during the nighttime
samples for the area surrounding MO (Fig. S3). In the case      after sampling ended (Fig. 3) show that, in the direction of
of the two nighttime overpasses (Fig. 3), which sampled to      transport (i.e., north of the MO, from around 15–20◦ N),
the southwest of Manila, a deep aerosol layer is observed in    there is an aerosol layer extending up to around 2 km dur-
the VFM extending from the surface to around 3 km (Fig. 3).     ing the day (northwest of MO) and 3 km at night (northeast
This classic case of long-range transport from the MC to the    of MO). The influence of emissions from continental East

www.atmos-chem-phys.net/20/2387/2020/                                            Atmos. Chem. Phys., 20, 2387–2405, 2020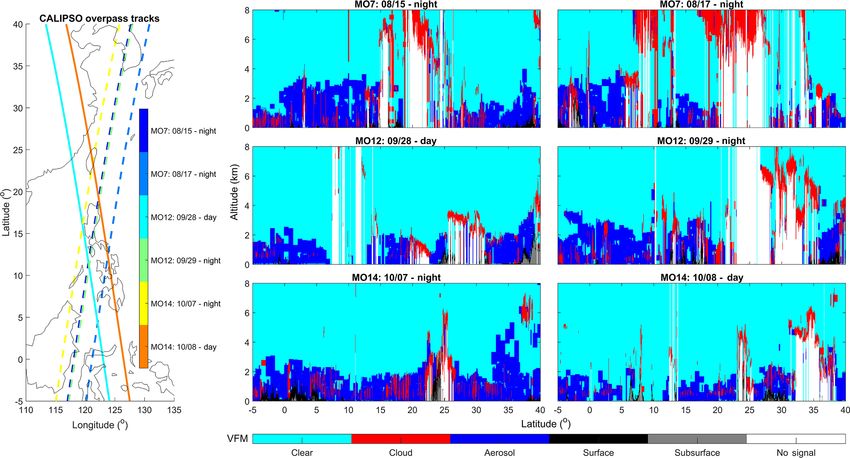
2392                                                                              R. A. Braun et al.: Long-range aerosol transport

Figure 1. MERRA-2 data for 850 hPa wind vectors and total cloud fraction averaged over the sample set duration for (a) MO7 (14–16
August), (b) MO11 (18–20 September), (c) MO12 (26–28 September), and (d) MO14 (6–8 October). The location of the Manila Observatory
is indicated by the red circle. (Note that 850 hPa wind vectors are also averaged to increase grid spacing and improve figure readability.)

Asia is also apparent in the NAAPS model (Fig. 4c). Obser-              (Fig. 2d), with zero accumulated precipitation at MO dur-
vations at Dongsha Island, located to the north of the Philip-          ing the sampling period (Table 1). Furthermore, low cloud
pines, have revealed influence from Gobi Desert emissions               fraction was observed for regions to the northwest and east
(Wang et al., 2011) and anthropogenic sources (Atwood et                of Metro Manila (Fig. 1d). Back trajectories from HYS-
al., 2013). Farther south in the MC, aerosol measurements in            PLIT show that the air mass appeared to be influenced by
Malaysia have also indicated influence of aged, long-range              a mix of continental sources in East Asia and local sources
transport from sites to the north in East Asia (Farren et al.,          (Fig. 2d). Furthermore, two CALIPSO overpasses, one dur-
2019).                                                                  ing the nighttime while sampling was occurring and the
                                                                        other during the daytime after sampling ended, show a deep
3.1.4   MO14 (6–8 October 2018): mixed influences                       aerosol layer north of MO, extending from the surface to
                                                                        around 2 km on 6 October and lower on 8 October (Fig. 3).
                                                                        From the NAAPS model, it appears that a mixture of MC
The final MOUDI set (MO14) included in this study rep-
                                                                        smoke emissions and continental East Asia emissions con-
resents a transition in meteorological regimes at the end of
                                                                        verges around the northern Philippines (Fig. 4d).
the SWM season and resulted in the highest overall water-
soluble mass concentration. This event had some of the low-
est rainfall amounts in the region surrounding Metro Manila

Atmos. Chem. Phys., 20, 2387–2405, 2020                                                   www.atmos-chem-phys.net/20/2387/2020/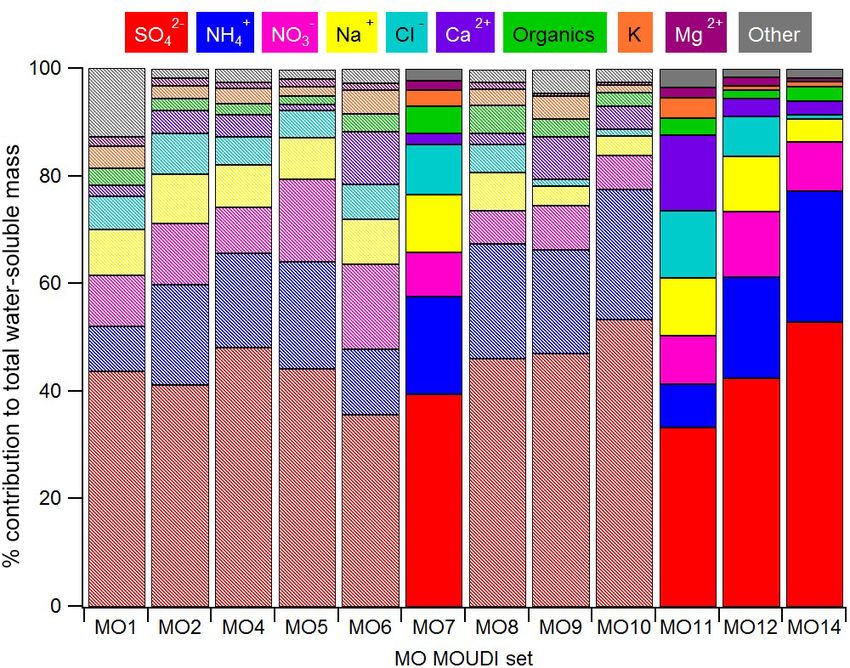
R. A. Braun et al.: Long-range aerosol transport 2393
sion of gaseous SO2 and NH3 , respectively, and aqueous pro-
cessing to form SO2− 4 (Ervens, 2015). In contrast, MO11 had
the lowest overall combined percent contribution of these
two species (41.4 %) to the water-soluble aerosol mass. Of
all 12 SWM MOUDI sets, MO11 had the highest percent
contributions from Ca2+ (14.0 %) and Cl− (12.5 %), as well
as one of the highest contributions from Na+ (10.7 %). Each
of these species is associated with primary emissions, includ-
ing dust in the case of Ca2+ and sea salt for Na+ and Cl− ,
resulting in larger particles (i.e., > 1 µm). The HYSPLIT back
trajectories for MO11 match well with the MOUDI results,
as the influence of marine aerosol (i.e., Na+ , Cl− ) and lack of
anthropogenic sources of SO2 and NH3 are apparent. Local
sources of dust most likely contribute the highest amount to
the measured Ca2+ , as the back trajectories show few other
crustal sources farther upwind. Average size-resolved pro-
Figure 2. Rainfall accumulation, extending from 5 d before the mid- files for all of the species in these 12 sample sets can be found
point of each sample set until the midpoint of each sample set, from in Cruz et al. (2019), with characteristic size distribution pro-
PERSIAN-CCS for (a) MO7, (b) MO11, (c) MO12, and (d) MO14. files agreeing with the above assessments.
In blue are the 5 d air mass back trajectories terminating at the
MOUDI inlet at MO (∼ 85 m above sea level) every 6 h during
3.2.2 Enhancements in tracer species
each of the sample study periods. Note that the maximum precip-
itation accumulation in the region shown during the study periods
was 955 mm; however, for figure readability, the scale was reduced
In addition to insights from the major water-soluble chem-
to 0–250 mm. ical species found in aerosol, tracer aerosol species can
also be used to identify impacting emission sources (e.g.,
Fung and Wong, 1995; Allen et al., 2001; Ma et al., 2019).
3.2 Ground-based aerosol chemical composition For the aforementioned high-aerosol events, numerous tracer
species are elevated in some, but not all, sample sets. This
3.2.1 Size-resolved aerosol characteristics makes these species prime candidates for linking influenc-
ing sources to the measured ambient aerosol. The authors
The water-soluble mass size distributions and the percent theorize that MO8, which was the fourth-highest aerosol
contribution of each MOUDI stage to the water-soluble mass event (Table 1), also was impacted by biomass burning due
for the four sets of interest (MO7, MO12, MO14, and MO11) to the back-trajectory analysis (Fig. S2), NAAPS model
and the average (± 1 standard deviation) of the remaining (Fig. S4), and increases in select species described subse-
sets (MO1–MO6, MO8–MO10) are shown in Fig. 5. Most quently. Therefore, MO8 was separated from the other sam-
of the sets show a bimodal distribution with peaks in both ple sets for the purposes of the following characterizations.
the submicrometer and supermicrometer range; one excep- Figure 7 shows the size-resolved aerosol composition for se-
tion is the lowest aerosol event (MO11), which shows a fairly lect tracer species for the four highest aerosol events (MO7,
broad size distribution. The highest aerosol event, MO14, MO8, MO12, and MO14), the lowest aerosol event (MO11),
shows a significant peak in the submicrometer range, with a and the average (± standard deviation) of the remaining
very large drop in mass concentration in the supermicrom- seven sample sets.
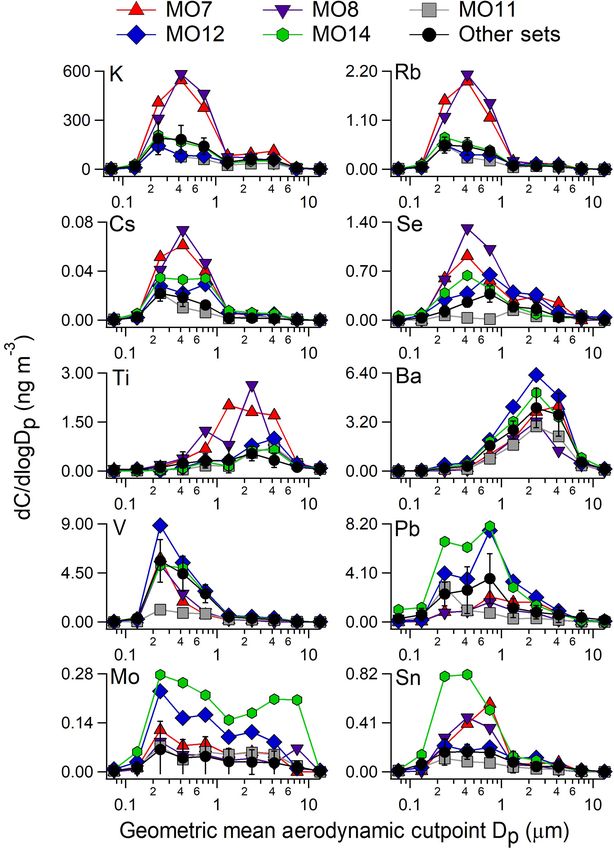
eter range. This is in stark contrast to the lowest aerosol Potassium is frequently used as a biomass burning tracer
event (MO11), which shows that the supermicrometer range (e.g., Andreae, 1983; Artaxo et al., 1994; Echalar et al.,
contributes the greatest percent to the total water-soluble 1995; Chow et al., 2004; Thepnuan et al., 2019). This species
mass. The second- and third-highest aerosol events, MO7 shows highly elevated levels in the submicrometer range for
and MO12, also show significant enhancements in the su- MO7 and MO8 (i.e., the sets influenced by biomass burn-
permicrometer range as compared to the average of the other ing transport from the MC). Other elevated trace elements
sets and MO14. for these two profiles include Rb, Cs, Se, and Ti (Fig. 7).
Figure 6 describes the major species contributing to the Previous studies in the western United States (Schlosser et
water-soluble mass. MO14 had one of the highest combined al., 2017; Ma et al., 2019) have also shown Rb enhance-
contributions of SO2− +
4 and NH4 (77.2 % of water-soluble ments in wildfire-influenced aerosol. Rb has also been mea-
mass), with only MO10 being slightly larger at 77.6 %. These sured in flaming and smoldering biomass burning emissions
two species are typically associated with the submicrome- (Yamasoe et al., 2000). Enhancements in Rb and Cs in the
ter range and anthropogenic origins due to their formation fine fraction of aerosol influenced by wildfire emissions have
through secondary processes such as gas-to-particle conver- been observed in South Africa (Maenhaut et al., 1996), with
www.atmos-chem-phys.net/20/2387/2020/ Atmos. Chem. Phys., 20, 2387–2405, 2020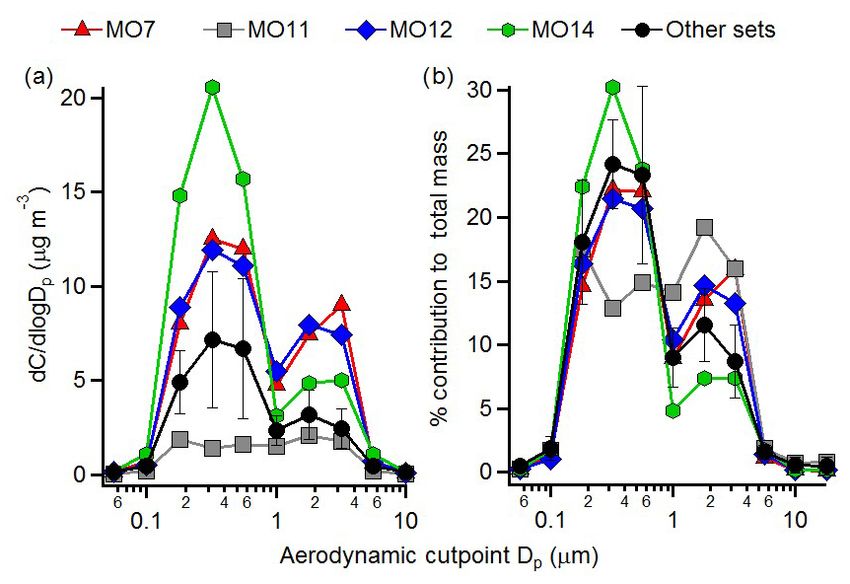
2394                                                                              R. A. Braun et al.: Long-range aerosol transport

Figure 3. CALIOP Vertical Feature Mask (VFM) for overpasses during or following MO7, MO12, and MO14. For the CALIPSO satel-
lite overpass tracks, the dashed lines correspond to the nighttime profiles and solid lines are for daytime. Note that nighttime overpasses
correspond to early morning times before sunrise for the listed days and daytime overpasses occurred during the early afternoon.

Figure 4. NAAPS model snapshots corresponding to conditions at the stop time of sample sets (a) MO7, (b) MO11, and (c) MO12 and
(d) 3 h after the sample stop time for MO14. The top row of figures is anthropogenic and biogenic fine aerosol (ABF) surface concentration
(µg m−3 ), while the bottom row is biomass burning smoke surface concentration (µg m−3 ).

similar results shown in this study for aerosol in the submi-           atmospheric Se exist (Mosher and Duce, 1987), including,
crometer size range. Se is also enhanced for these two sets in          but not limited to, coal combustion (Thurston and Spengler,
the submicrometer range, as it is often formed through gas-             1985; Fung and Wong, 1995; Song et al., 2001), marine emis-
to-particle conversion processes of inorganic Se compounds              sions (Arimoto et al., 1995), volcanos, and biomass burn-
(Wen and Carignan, 2007). A wide variety of sources for                 ing (Mosher and Duce, 1987). In contrast to the other en-

Atmos. Chem. Phys., 20, 2387–2405, 2020                                                   www.atmos-chem-phys.net/20/2387/2020/
R. A. Braun et al.: Long-range aerosol transport                                                                                    2395

Figure 5. (a) Mass size distributions for total water-soluble mass
(C is the sum of mass concentrations for water-soluble species) and
(b) percent contribution of each size range to the total water-soluble
mass for the three MOUDI sets with the highest aerosol mass con-
centrations (MO7, MO12, and MO14), the set with the lowest con-
centration (MO11), and the average (± 1 standard deviation error
bars) for the remaining eight sets.

                                                                         Figure 7. Selected elements that showed elevated concentrations
                                                                         during at least one of the highest aerosol events (MO7, MO8,
                                                                         MO12, or MO14). The concentrations from the lowest aerosol event
                                                                         (MO11) are also shown. The “other sets” category displays the av-
                                                                         erage (± 1 standard deviation) for the remaining seven sets.

                                                                         biomass burning tracer species, local emission sources, such
                                                                         as waste burning and wood burning for cooking, may also
                                                                         play a role.
                                                                            Two tracer species are included that showed enhancements
                                                                         for MO12, specifically Ba in the supermicrometer range and
                                                                         V in the submicrometer range (Fig. 7). One well-documented
                                                                         source of aerosol Ba is nonexhaust vehicle emissions, includ-
                                                                         ing brake wear (Sternbeck et al., 2002; Querol et al., 2008;
Figure 6. Percent contribution of various species to the total water-    Amato et al., 2009; Jeong et al., 2019). V also has well-
soluble mass concentration for each of the 12 sample sets. The sam-
                                                                         characterized emission sources, most specifically fuel com-
ple sets with the three highest aerosol concentrations (MO7, MO12,
and MO14) and the lowest aerosol concentration (MO11) are shown
                                                                         bustion (Fung and Wong, 1995; Artaxo et al., 1999; Song
as solid bars while all other sample sets are stripes. The “organics”    et al., 2001; Lin et al., 2005; Kim and Hopke, 2008). In
category contains the sum of methanesulfonate (MSA), pyruvate,           coastal environments, V is often tied to shipping emissions
adipate, succinate, maleate, oxalate, and phthalate.                     (Agrawal et al., 2008; Pandolfi et al., 2011; Maudlin et al.,
                                                                         2015; Mamoudou et al., 2018). As these sources are anthro-
                                                                         pogenic in origin, it is difficult to determine the relative in-
hanced species for MO7 and MO8, the mass concentration                   fluences of long-range transport versus local emissions, espe-
mode for Ti resides in the supermicrometer size range. Ti                cially with the proximity of the sampling site to major road-
is typically associated with crustal material that can be sus-           ways and shipping in Manila Bay. However, the enhancement
pended through mechanisms such as vehicle usage (Stern-                  in V could result from the transport of the aerosol over major
beck et al., 2002; Querol et al., 2008; Amato et al., 2009) and          shipping lanes farther upwind.
lofting in wildfire plumes (Maudlin et al., 2015; Schlosser                 Finally, Fig. 7 shows three selected elements that appear
et al., 2017). While long-range transport of biomass burning             enhanced in MO14, all of which are typically tied to an-
aerosol could lead to the enhancements measured for these                thropogenic sources. Both Pb and Sn are found mainly in

www.atmos-chem-phys.net/20/2387/2020/                                                     Atmos. Chem. Phys., 20, 2387–2405, 2020
2396 R. A. Braun et al.: Long-range aerosol transport
the submicrometer range and have been linked by previous
studies to vehicle emissions (Singh et al., 2002; Amato et
al., 2009), industrial emissions (Querol et al., 2008; Allen
et al., 2001), and waste burning (Kumar et al., 2015). Other
sources of Pb could include e-waste recycling (Fujimori et
al., 2012) and biomass burning (Maenhaut et al., 1996). The
size distribution of Mo for MO14 shows a much broader dis-
tribution, with peaks in both the sub- and supermicrometer
ranges. Sources of Mo include vehicle emissions (Pakka-
nen et al., 2003; Amato et al., 2009), combustion (Pakkanen
et al., 2001, 2003), and industrial activity, including copper
smelters (Artaxo et al., 1999). As is the case with the en-
hanced species in MO12, the anthropogenic nature of these
species makes it difficult to determine the relative contribu-
tion of long-range versus local emissions. However, as both
MO12 and MO14 show enhancements in anthropogenically
produced trace elements, the influence of long-range trans-
port from industrial and urban areas in continental East Asia
is plausible.
3.2.3 Variability of water-soluble organic species
Figure 8 shows the sum of the total measured water-soluble
organic species and the relative contributions of oxalate, suc-
Figure 8. Pie charts showing the fraction of species contributing to
cinate, adipate, maleate, pyruvate, MSA, and phthalate to the measured water-soluble organic aerosol. Below each pie chart
the total measured water-soluble organics for MO7, MO8, title is the sum of the water-soluble organic species measured, with
MO11, MO12, MO14, and the average (± 1 standard devia- the “other sets” chart showing the average ± 1 standard deviation
tion) of the remaining sets. Malonate (C3) was not character- for the remaining sets.
ized due to its low concentrations in the samples measured
and the coelution of C3 with carbonate in the IC analysis.
Glutarate (C5) was also excluded from the analysis due to organic aerosol). Oxalate is often considered a byproduct
very low concentrations. For the examination of the organic of photochemical aging of longer-chain dicarboxylic acids
species, MO8 was again separated from the other MOUDI (e.g., Kawamura and Ikushima, 1993; Kawamura and Sak-
sets due to it having the second-highest concentration of or- aguchi, 1999), and therefore an increase in oxalate is often
ganic species (0.66 µg m−3 ) and an organic species contri- considered a signature of aged aerosol in the absence of pri-
bution profile very similar to that of MO7. The remaining mary oxalate emissions from sources such as biomass burn-
MOUDI sets included in the average category (MO1–MO6, ing. Another major pathway of oxalate formation is aqueous
MO9–MO10) all have total organic species concentrations processing (Crahan et al., 2004; Ervens et al., 2004, 2018;
that were lower than the four highest aerosol sets (MO7, Sorooshian et al., 2006, 2007b; Wonaschuetz et al., 2012),
MO8, MO12, MO14) and greater than the lowest aerosol set which is likely prevalent during the SWM when there is fre-
(MO11). The lowest aerosol event (MO11) has the lowest quent cloud cover. Previous studies have also demonstrated
overall concentration of organic aerosol (0.09 µg m−3 ), while the ability for transport and photochemical aging of water-
the second-highest aerosol event (MO7) has the highest con- soluble organic acids over long distances in a marine envi-
centration of organic aerosol (0.70 µg m−3 ). ronment (e.g., Kawamura and Sakaguchi, 1999) and the im-
Many studies worldwide have examined the relative con- portance of emissions from continental Asia in the organic
tributions of organic species to atmospheric aerosol, with aerosol budget in the western north Pacific (Aggarwal and
oxalate typically having the highest contribution among Kawamura, 2008; Hoque et al., 2017). The back trajecto-
dicarboxylic acids (Kawamura and Kaplan, 1987; Kawa- ries of the air masses terminating at MO during MO12 and
mura and Ikushima, 1993; Kawamura and Sakaguchi, 1999; MO14 indicate origins of emissions from continental East
Sorooshian et al., 2007a; Hsieh et al., 2007, 2008; Aggar- Asia (Fig. 2). It is plausible that the high contribution of
wal and Kawamura, 2008; Deshmukh et al., 2012, 2018; oxalate to the organic aerosol in MO12 and MO14 (which
Li et al., 2015; Hoque et al., 2017; Kunwar et al., 2019). had the fourth-highest percent contribution of oxalate) is
Oxalate was the dominant water-soluble organic species for due to the degradation of both primarily emitted and secon-
all 12 MOUDI sets, with oxalate having the highest con- darily produced longer-chain dicarboxylic acids during the
tribution to the organic aerosol in MO12 (88.7 % of total transport process through mechanisms described above, such
Atmos. Chem. Phys., 20, 2387–2405, 2020 www.atmos-chem-phys.net/20/2387/2020/R. A. Braun et al.: Long-range aerosol transport 2397 as photochemical degradation and aqueous processing, with in the relative contribution of oxalate is plausible. Hsieh et the former mechanism being plausible in the regions of low al. (2008) showed in samples from Taiwan that the relative cloud cover to the north and northwest of Manila (Fig. 1) and contribution of oxalate to the organic acids was also higher the latter mechanism potentially being of great importance during periods of high aerosol loading as opposed to periods due to the typhoon influences during transport. While the of moderate aerosol loading when the overall PM concen- aerosol measured in MO7 and MO8 also shows long-range tration was lower. MO11, which showed air mass back tra- transport influences (Figs. 2a and S2), the overall signal of or- jectories originating to the east of the Philippines from the ganic aerosol is much stronger in these two sets, such that the open Pacific (Fig. 2b), had the lowest overall water-soluble absolute concentration of oxalate (MO7: 0.47 µg m−3 ; MO8: PM concentration, the lowest overall concentration of water- 0.42 µg m−3 ) is still greater than in MO12 (0.19 µg m−3 ) and soluble organic acids, and the second-lowest percent contri- MO14 (0.37 µg m−3 ). However, biomass burning is a well- bution of oxalate to the organic acid mass (57.1 %) of all the documented source of both oxalate and longer-chain dicar- sets. boxylic acids (e.g., Falkovich et al., 2005; Nirmalkar et al., Phthalate is an aromatic dicarboxylic acid often linked 2015; Cheng et al., 2017; Deshmukh et al., 2018; Thepnuan to anthropogenic sources through photochemical transfor- et al., 2019). mation of emissions from vehicles (Kawamura and Kaplan, Succinate has been linked to biomass burning emissions 1987; Kawamura and Ikushima, 1993) and waste burning (Wang and Shooter, 2004; Falkovich et al., 2005; Zhao et (Kumar et al., 2015), although aqueous processing has also al., 2014; Balla et al., 2018), vehicular emissions (Kawa- been proposed as a formation mechanism (Kunwar et al., mura and Kaplan, 1987; Kawamura et al., 1996; Yao et 2019). Accordingly, phthalate has been shown to have sea- al., 2004), and secondary production via photochemical re- sonal and diurnal variations in concentration, with enhanced actions of precursor organic compounds (Kawamura and production usually linked to times of stronger solar radiation Ikushima, 1993; Kawamura et al., 1996; Kawamura and Sak- (i.e., summertime and daytime: Satsumabayashi et al., 1990; aguchi, 1999). The two MO MOUDI sets thought to have Ray and McDow, 2005; Ho et al., 2006; Kunwar et al., 2019). the most influence from biomass burning emissions (MO7 However, increased emissions of precursor species during and MO8) had the highest organic aerosol mass concentra- different times of the year may affect these trends (Hyder tions and the highest mass percent contributions of succi- et al., 2012). Sets MO7, MO8, MO11, and MO14 had the nate to the organic aerosol (MO7: 14.3 % and MO8: 17.5 %). highest contribution to the water-soluble organics from ph- In contrast, the next highest contribution of succinate to the thalate (range: 9.5 %–10.2 %). In contrast, the remaining sets organic aerosol was 4.2 % measured in MO5. These results had a much lower contribution (range: 1.7 %–4.9 %). How- agree with previous studies in Northeast China that showed ever, the absolute concentration of phthalate was highest in an increase in total organic aerosol mass concentration and a sets MO7, MO8, and MO14 (range: 45.3–67.0 ng m−3 ) and strong increase (decrease) in the relative contribution of suc- much lower for the remaining sets (range: 2.0–8.9 ng m−3 ). cinate (oxalate) during biomass burning periods as opposed Increased phthalate concentrations during biomass burning to non-biomass-burning periods (Cao et al., 2017). Results episodes have been previously measured in SE Asia (Cao et from California, USA, also showed higher percent contribu- al., 2017). Furthermore, cloud coverage was fairly low dur- tions of succinate to the water-soluble organic aerosol dur- ing MO14 as compared to the other sets of interest (Fig. 1), ing periods influenced by biomass burning (Maudlin et al., increasing the possibility of photochemical production of ph- 2015). thalate. For the remaining sample sets, the range of phthalate MO11 had the second-highest relative contribution of concentrations is substantially lower and fairly consistent, in- maleate (28.5 % of water-soluble organic aerosol) out of all dicating that the measured phthalate in these samples most 12 sample sets and had a much higher percent contribution as likely represents the local background conditions. compared to the four highest aerosol events (< 2.5 % for each While not a carboxylic acid, MSA is nonetheless an im- of the following: MO7, MO8, MO12, and MO14). Maleate portant organic aerosol species, especially in marine environ- is linked to the oxidation of aromatic hydrocarbons, usu- ments. The assumed precursor of MSA in this study is from ally from anthropogenic sources such as vehicular emissions the oxidation of marine-emitted dimethylsulfide (DMS). In- (Kawamura and Kaplan, 1987; Kunwar et al., 2019). One ex- terestingly, all sample sets showed approximately the same planation for this result could be the higher rainfall accumu- mass percent contribution of MSA to the organic aerosol, lation in and around the study region during MO11 as com- ranging from a minimum of 3.1 % (MO6) to a maximum of pared to the three highest aerosol sets (Fig. 2). Wet scaveng- 7.0 % (MO5). However, the absolute concentration of MSA ing could have removed aerosol from transported air masses was highest in the two sets with biomass burning influence during their journey towards MO, thereby increasing the rel- (MO7: 23.3 and MO8: 21.4 ng m−3 ), with concentrations 8.4 ative contribution of local sources to the measured aerosol and 7.7 times higher, respectively, than the lowest MSA con- in MO11. Because of the reduced aging time associated with centration measured (MO11: 2.8 ng m−3 ). A previous study emissions from local sources, the relative increase in the con- showed that MSA concentrations in air masses with mixed tribution of longer-chain dicarboxylic acids and the decrease influence from marine and biomass burning emissions are www.atmos-chem-phys.net/20/2387/2020/ Atmos. Chem. Phys., 20, 2387–2405, 2020
2398                                                                           R. A. Braun et al.: Long-range aerosol transport

higher than the concentrations measured from either source            itated by the influence of a typhoon. In these cases, it is dif-
alone (Sorooshian et al., 2015). The results from the present         ficult to separate urban emissions between local and distant
study (i.e., more MSA measured in sets with biomass burn-             sources. However, the elevation of select tracer species (Ba,
ing influence) in SE Asia again highlight the complexity of           V, Pb, Mo, Sn) and the water-soluble organic aerosol char-
interactions between air masses with different sources and            acteristics for these two cases (i.e., high relative contribution
the accompanying changes in aerosol physiochemical prop-              of oxalate to the organic aerosol) indicated that long-range
erties.                                                               transported urban emissions could impact Metro Manila.
                                                                         Finally, one low-aerosol-loading case was impacted by
                                                                      air masses traveling over the open ocean to the east of the
4   Conclusions                                                       Philippines. This case showed an enhanced fraction of super-
                                                                      micrometer aerosol and a very low concentration of water-
This study sought to characterize influences of local and             soluble organic acids. Higher rain accumulation during this
long-range transported aerosol to the Philippines during the          sample set, as opposed to the sample sets with the high-
Southwest Monsoon (SWM) season as well as the various                 est water-soluble aerosol concentrations, could have led to
synoptic- and local-scale conditions that facilitate and sup-         greater wet scavenging of aerosol. This case also had the
press long-range transport of aerosol. As a highly populated          lowest overall mass concentration of water-soluble organic
megacity, Metro Manila is the source of a large amount                species, a low percent contribution of oxalate to the water-
of urban, anthropogenic pollution. However, synoptic-scale            soluble organics, and a high percent contribution of maleate.
weather, including the typical SWM flow and typhoons, can             This result points to the relative importance of locally emit-
impact the transport of aerosol to and from Metro Manila.             ted species that have not yet undergone photochemical and
While previous work in a rural area in the northwest edge             aqueous processing mechanisms that lead to the degradation
of the Philippines has identified seasonal aerosol transport          of longer-chain dicarboxylic acid species into oxalate.
patterns to the Philippines using PM2.5 data (Bagtasa et al.,            These results have important implications for better under-
2018), the present study highlights case studies of in situ           standing the aerosol budget in and around the Philippines and
size-resolved aerosol measurements from Metro Manila to               SE Asia via the identification of various tracer species (e.g.,
examine the potential for aerosol transport to impact this ur-        K and Rb for biomass burning) and the impacts of differ-
ban area as well.                                                     ent long-range aerosol transport pathways. In addition, the
   For two of the sample sets with enhanced total water-              mixing of different air mass types, resulting in changes in
soluble aerosol mass concentration, biomass burning aerosol           aerosol characteristics (e.g., enhanced oxalate in emissions
transport from the Maritime Continent (MC) towards the                from continental regions, enhanced MSA during periods of
Philippines was identified using air mass back trajectories           biomass burning influence), is a subject that requires more
and the NAAPS model. This transport followed a southwest-             attention on a global basis. While this work has shown the
erly flow pattern that is typical of this time of year (Fig. S2)      influence of mixing biomass burning emissions and urban
and lends its name to the SWM season. Deep aerosol lay-               emissions, from both local and more distant urban centers,
ers, extending from the surface to 3 km, were identified by           additional analysis at the study site has demonstrated the in-
CALIOP to the southwest of the Philippines. The influence             fluences seen from the mixing of sea salt aerosol with other
on aerosol in Metro Manila was shown through enhance-                 air masses (AzadiAghdam et al., 2019). As remote-sensing
ments in biomass burning tracer species (e.g., K, Rb) and             measurements in this region are notoriously difficult (e.g.,
increased concentration of organic aerosol. The challenges            Reid et al., 2009, 2013), in situ and model results lend vi-
in satellite-based retrievals of biomass burning in the region        tal data to address the questions surrounding characteristics
(Reid et al., 2012, 2013) and the underestimation of fire activ-      of aerosol that are transported into and out of this highly
ity in the region by these satellite retrievals (Reid et al., 2013)   populated region. Measurements from in situ airborne cam-
lead to unanswered questions about the amount and fate of             paigns, such as CAMP2 Ex, can further address the changes
biomass burning emissions in the MC and SE Asia. The abil-            in aerosol physicochemical characteristics that occur during
ity to measure biomass burning signatures in a highly pol-            long-range transport and aging in the atmosphere in the re-
luted, urban megacity such as Metro Manila and the evidence           gion.
of long-range transport gathered through multiple methods
and data sources (i.e., in situ measurements, models, and re-
mote sensing) speak to the strong signature of biomass burn-          Data availability. Ground-based        size-resolved aerosol
ing emissions in the region and the long-range transport path-        data from the Manila Observatory can be found at:
ways available for these emissions.                                   https://doi.org/10.6084/m9.figshare.11861859 (Stahl et al.,
   In contrast, transport of anthropogenic emissions from             2020).
continental East Asia was identified on two occasions with
high water-soluble aerosol mass concentrations, with one
measured instance of long-range transport having been facil-

Atmos. Chem. Phys., 20, 2387–2405, 2020                                                www.atmos-chem-phys.net/20/2387/2020/
R. A. Braun et al.: Long-range aerosol transport 2399
Supplement. The supplement related to this article is available on- Allen, A. G., Nemitz, E., Shi, J. P., Harrison, R. M., and Green-
line at: https://doi.org/10.5194/acp-20-2387-2020-supplement. wood, J. C.: Size distributions of trace metals in atmospheric
aerosols in the United Kingdom, Atmos. Environ., 35, 4581–
4591, https://doi.org/10.1016/S1352-2310(01)00190-X, 2001.
Author contributions. MTC, MOC, JBS, RAB, ABM, CS, and AS Amato, F., Pandolfi, M., Viana, M., Querol, X., Alastuey, A., and
designed the experiments, and all coauthors carried out some aspect Moreno, T.: Spatial and chemical patterns of PM10 in road dust
of the data collection. MTC, RAB, CS, and AS conducted the data deposited in urban environment, Atmos. Environ., 43, 1650–
analysis and interpretation. RAB and AS prepared the manuscript 1659, https://doi.org/10.1016/j.atmosenv.2008.12.009, 2009.
with contributions from all coauthors. Andreae, M. O.: Soot Carbon and Excess Fine Potassium: Long-
Range Transport of Combustion-Derived Aerosols, Science, 220,
1148, 10.1126/science.220.4602.1148, 1983.
Competing interests. The authors declare that they have no conflict Arimoto, R., Duce, R. A., Ray, B. J., Ellis Jr., W. G., Cullen, J.
of interest. D., and Merrill, J. T.: Trace elements in the atmosphere over
the North Atlantic, J. Geophys. Res.-Atmos., 100, 1199–1213,
https://doi.org/10.1029/94jd02618, 1995.
Artaxo, P., Gerab, F., Yamasoe, M. A., and Martins, J. V.: Fine mode
Acknowledgements. Rachel A. Braun acknowledges support from
aerosol composition at three long-term atmospheric monitoring
the ARCS Foundation. Melliza Templonuevo Cruz acknowledges
sites in the Amazon Basin, J. Geophys. Res.-Atmos., 99, 22857–
support from the Philippine Department of Science and Technol-
22868, https://doi.org/10.1029/94jd01023, 1994.
ogy’s ASTHRD Program. Alexander B. MacDonald acknowledges
Artaxo, P., Oyola, P., and Martinez, R.: Aerosol composition
support from the Mexican National Council of Science and Tech-
and source apportionment in Santiago de Chile, Nucl. In-
nology (CONACYT). We acknowledge Agilent Technologies for
strum. Meth. B, 150, 409–416, https://doi.org/10.1016/S0168-
their support and Shane Snyder’s laboratories for ICP-QQQ data.
583X(98)01078-7, 1999.
Atwood, S. A., Reid, J. S., Kreidenweis, S. M., Cliff, S. S., Zhao,
Y., Lin, N.-H., Tsay, S.-C., Chu, Y.-C., and Westphal, D. L.:
Financial support. This research has been supported by the NASA Size resolved measurements of springtime aerosol particles over
(grant no. 80NSSC18K0148). the northern South China Sea, Atmos. Environ., 78, 134–143,
https://doi.org/10.1016/j.atmosenv.2012.11.024, 2013.
Atwood, S. A., Reid, J. S., Kreidenweis, S. M., Blake, D. R., Jon-
Review statement. This paper was edited by Joshua Fu and re- sson, H. H., Lagrosas, N. D., Xian, P., Reid, E. A., Sessions,
viewed by three anonymous referees. W. R., and Simpas, J. B.: Size-resolved aerosol and cloud con-
densation nuclei (CCN) properties in the remote marine South
China Sea – Part 1: Observations and source classification, At-
mos. Chem. Phys., 17, 1105–1123, https://doi.org/10.5194/acp-
References 17-1105-2017, 2017.
AzadiAghdam, M., Braun, R. A., Edwards, E.-L., Bañaga, P. A.,
Aggarwal, S. G. and Kawamura, K.: Molecular distributions Cruz, M. T., Betito, G., Cambaliza, M. O., Dadashazar, H.,
and stable carbon isotopic compositions of dicarboxylic acids Lorenzo, G. R., Ma, L., MacDonald, A. B., Nguyen, P., Sim-
and related compounds in aerosols from Sapporo, Japan: Im- pas, J. B., Stahl, C., and Sorooshian, A.: On the nature of
plications for photochemical aging during long-range atmo- sea salt aerosol at a coastal megacity: Insights from Manila,
spheric transport, J. Geophys. Res.-Atmos., 113, D14301, Philippines in Southeast Asia, Atmos. Environ., 216, 116922,
https://doi.org/10.1029/2007jd009365, 2008. https://doi.org/10.1016/j.atmosenv.2019.116922, 2019.
Agrawal, H., Malloy, Q. G. J., Welch, W. A., Wayne Miller, J., and Bagtasa, G.: Effect of Synoptic Scale Weather Distur-
Cocker, D. R.: In-use gaseous and particulate matter emissions bance to Philippine Transboundary Oxone Pollution us-
from a modern ocean going container vessel, Atmos. Environ., ing WRF-CHEM, Int. J. Environ. Sci. Dev., 2, 402–405,
42, 5504–5510, https://doi.org/10.1016/j.atmosenv.2008.02.053, https://doi.org/10.7763/IJESD.2011.V2.159, 2011.
2008. Bagtasa, G., Cayetano, M. G., and Yuan, C.-S.: Seasonal
Akagi, S. K., Craven, J. S., Taylor, J. W., McMeeking, G. R., Yokel- variation and chemical characterization of PM2.5 in north-
son, R. J., Burling, I. R., Urbanski, S. P., Wold, C. E., Seinfeld, J. western Philippines, Atmos. Chem. Phys., 18, 4965–4980,
H., Coe, H., Alvarado, M. J., and Weise, D. R.: Evolution of trace https://doi.org/10.5194/acp-18-4965-2018, 2018.
gases and particles emitted by a chaparral fire in California, At- Balla, D., Voutsa, D., and Samara, C.: Study of polar or-
mos. Chem. Phys., 12, 1397–1421, https://doi.org/10.5194/acp- ganic compounds in airborne particulate matter of a coastal
12-1397-2012, 2012. urban city, Environ. Sci. Pollut. R., 25, 12191–12205,
Alas, H. D., Müller, T., Birmili, W., Kecorius, S., Cambaliza, M. https://doi.org/10.1007/s11356-017-9993-2, 2018.
O., Simpas, J. B. B., Cayetano, M., Weinhold, K., Vallar, E., Bautista, A. T., Pabroa, P. C. B., Santos, F. L., Racho, J. M. D., and
Galvez, M. C., and Wiedensohler, A.: Spatial Characterization Quirit, L. L.: Carbonaceous particulate matter characterization in
of Black Carbon Mass Concentration in the Atmosphere of a an urban and a rural site in the Philippines, Atmos. Pollut. Res.,
Southeast Asian Megacity: An Air Quality Case Study for Metro 5, 245–252, https://doi.org/10.5094/APR.2014.030, 2014.
Manila, Philippines, Aerosol Air Qual. Res., 18, 2301–2317,
https://doi.org/10.4209/aaqr.2017.08.0281, 2018.
www.atmos-chem-phys.net/20/2387/2020/ Atmos. Chem. Phys., 20, 2387–2405, 2020You can also read