A review of MIS 5e sea-level proxies around Japan - ESSD
←
→
Page content transcription
If your browser does not render page correctly, please read the page content below
Earth Syst. Sci. Data, 13, 1477–1497, 2021
https://doi.org/10.5194/essd-13-1477-2021
© Author(s) 2021. This work is distributed under
the Creative Commons Attribution 4.0 License.

              A review of MIS 5e sea-level proxies around Japan
                                          Evan Tam1,2 and Yusuke Yokoyama1,2,3,4,5
                  1 Atmosphere  and Ocean Research Institute, The University of Tokyo, 5-1-5 Kashiwanoha,
                                                   Kashiwa, 277-8564, Japan
           2 Graduate Program on Environmental Sciences, Graduate School of Arts and Sciences, The University of

                                  Tokyo, 3-8-1 Komaba, Meguro-ku, Tokyo, 153-8902, Japan
              3 Department of Earth and Planetary Science, Graduate School of Science, The University of Tokyo,

                                       7-3-1 Hongo, Bunkyo-ku, Tokyo, 113-0033, Japan
         4 Biogeochemistry Program, Japan Agency for Marine-Earth Science and Technology, 2-15 Natsushima-cho,

                                          Yokosuka-city, Kanagawa, 237-0061, Japan
                5 Research School of Physics, The Australian National University, Canberra, ACT 2601, Australia

                                 Correspondence: Evan Tam (evan.tam@g.ecc.u-tokyo.ac.jp)

                               Received: 29 November 2020 – Discussion started: 14 December 2020
                         Revised: 13 February 2021 – Accepted: 19 February 2021 – Published: 6 April 2021

       Abstract. Sea-level proxies for Marine Isotopic Stage 5e (MIS 5e, ca. 124 ka) are abundant along the Japanese
       shoreline and have been documented for over at least the past 60 years. The bulk of these sea-level proxies
       are identified in Japan as marine terraces, often correlated by stratigraphic relationships to identified tephra
       layers, or other chronologically interpreted strata. Use of stratigraphic correlation in conjunction with other
       techniques such as paleontological analysis, tectonic uplift rates, tephra (volcanic ash), uranium–thorium (U–
       Th), and carbon-14 (14 C) dating have connected Japan’s landforms to global patterns of sea-level change. This
       paper reviews over 60 years of publications containing sea-level proxies correlated with MIS 5e in Japan.
       Data collected for this review have been added to the World Atlas of Last Interglacial Shorelines (WALIS),
       following their standardizations on the elements necessary to analyze paleosea-levels. This paper reviewed
       over 70 studies, assembling data points for over 300 locations and examining related papers denoting sea-
       level indicators for MIS 5e. The database compiled for this review (Tam and Yokoyama, 2020) is available
       at https://doi.org/10.5281/zenodo.4294326. Sea-level proxy studies in Japan rely heavily on chronostratigraphic
       techniques and are recognized as reliable, though opportunities exist for further constraining through the further
       use of numerical age dating techniques.

1   Introduction                                                   higher than at present (Dutton and Lambeck, 2012). Sea-
                                                                   level increases are credited to warmer global temperatures,
                                                                   an increased influx of icebergs into the ocean, or varying de-
Marine Isotope Stage (MIS) 5e is of particular interest be-        grees of both (Overpeck et al., 2006; Otto-Bliesner et al.,
cause of its position as the last major interglacial period be-    2006; Yokoyama and Esat, 2011). Accurate measurements
fore present, and due to similarities in global mean temper-       of changes in ocean basin seawater volume and ice sheet vol-
atures during this period to projected changes in climate,         ume are necessary to parameterize the effects of tectonics,
observations of MIS 5e could aid in quantifying sea-level          isostasy, and eustasy on fluxes in sea-level for a given lo-
change in the current and coming century (Stirling et al.,         cation (Milne, 2014; Yokoyama et al., 2018, 2019a). These
1995; Rohling et al., 2008; Rahmstorf, 2007; Church et al.,        data are vital for accurate glacial isostatic adjustment (GIA)
2001). This stage has been constrained to between 128–             modeling and calculation of tectonic uplift rates using coastal
116 ka (Stirling et al., 1998; Yokoyama and Esat, 2011), with      sea-level proxies (Okuno et al., 2014; Fukuyo et al., 2020).
average sea-level rise in tectonically stable areas at 5–9 m

Published by Copernicus Publications.
1478                                                            E. Tam and Y. Yokoyama: MIS 5e sea-level proxies around Japan

                                                                       island arcs created by the collision of at least five plates:
                                                                       the Amurian, Eurasian, Okhotsk, Pacific, and Philippine sea
                                                                       plates (Fig. 1). The archipelago is primarily composed of
                                                                       four large islands: Hokkaido, Honshu, Shikoku, and Kyushu.
                                                                       Subduction of the Pacific plate beneath the Okhotsk plate and
                                                                       the Philippine sea plate, forms the Kuril and Izu–Ogasawara
                                                                       arcs and the northeast Honshu arc. Additionally, subduction
                                                                       of the Philippine sea plate beneath the Okhotsk and Amurian
                                                                       plates forms the southwest Honshu arc, and subduction be-
                                                                       neath the Eurasian plate forms the Ryukyu arc (Taira, 2001;
                                                                       Taira et al., 2016; Apel et al., 2006). This unique convergence
                                                                       of plates results in distinct uplift and subsidence patterns that
                                                                       alter marine terrace elevations (Ota and Omura, 1991), with
                                                                       MIS 5e creating sea-level indicators at elevations ranging
                                                                       from −85.5 to 205 m. Japan is also host to a large number
                                                                       of active volcanoes due to its tectonic activity, and records of
                                                                       volcanic activity are vital in constraining ages of terraces and
                                                                       sea-level proxies (as discussed later).
                                                                          Almost all studies of sea-level proxies defining sea-level
Figure 1. Modified from Taira (2001). An overview of the tectonic      maxima during MIS 5e in Japan utilize analyses of ma-
plates that compose and surround the Japanese archipelago, detail-     rine terraces. Relatively high uplift rates are found in many
ing the interactions between the Okhotsk, Amura, Eurasian, Pacific,    coastal regions in Japan, preserving sea-level highstands as
and Philippine sea plates; their plate boundaries; and the resulting   staircase terraces. Terraces have been previously subcatego-
volcanic arcs. Names of the major islands of Japan are abbreviated:    rized into three types: topographically defined marine ter-
Ho: Hokkaido; Hn: Honshu; S: Shikoku; K: Kyushu.                       races, sedimentologically defined marine terraces, and ter-
                                                                       races defined by paleontological evidence (Ota and Omura,
                                                                       1991), though many studies provide little information on ma-
   This paper serves as context to the data collected on               rine terrace details. Sea-level proxies in this study are catego-
MIS 5e sea-level proxies in and around Japan. The database             rized according to definitions provided in Rovere et al. (2016;
was compiled as a part of the World Atlas of Last Inter-               Table 1).
glacial Shorelines (WALIS), which aims to globally com-
pile MIS 5e sea-level indicators in a standardized format
                                                                       2.2   Historical studies and U–Th dating
(https://warmcoasts.eu/world-atlas.html, last access: 31 Jan-
uary 2021). Descriptions of each database field can be                 Earlier studies chronicling sea-level proxies in Japan gen-
found here: https://doi.org/10.5281/zenodo.3961543 (Rovere             erally utilized paleontological evidence to constrain marine
et al., 2020), compiled at the following website: https:               deposit ages (Kamada and Niino, 1955; Sakaguchi, 1959;
//walis-help.readthedocs.io/en/latest/ (last access: 31 Jan-           Yonekura, 1968), or they used proxies to calculate Quater-
uary 2021). The regional database for sea-level indicators             nary crustal movement (e.g., Yoshikawa et al., 1964; Ota,
of Japan during this period can be found at the follow-                1971). Marine terraces were correlated to the Riss–Würm
ing link: https://doi.org/10.5281/zenodo.4294326 (Tam and              interglacial period (then identified between 90–100 ka) but
Yokoyama, 2020). This database reviewed over 70 stud-                  have since been reassessed to align with MIS 5e sea-level
ies, extracting 315 representative sea-level indicators across         highstands. Paleontological proxies such as Mollusca species
Japan. Among these, 310 proxies were age constrained by                were utilized to identify warmer climate conditions associ-
stratigraphic correlation, 149 utilized tephra–stratigraphic           ated with the deposition of sea-level highstand marine sedi-
correlation, 6 used optically stimulated luminescence (OSL)            ments (e.g., Yonekura, 1968).
dating, and 5 employed U–Th dating, with studies frequently               In the 1970s, the utilization of uranium–thorium (U–Th,
using multiple techniques.                                             a.k.a. U-series) dating provided age constraints on fossilized
                                                                       coral terraces representing sea-level highstands globally.
                                                                       Since then, studies examining Kikai Island and other Ryukyu
2     Literature overview
                                                                       Islands combined with results from Barbados (Thompson et
2.1    Geologic background                                             al., 2011; James et al., 1971) and Papua New Guinea (Chap-
                                                                       pell, 1974; Chappell et al., 1996; Yokoyama et al., 2001a, b)
The Japanese archipelago is tectonically one of the most ac-           have reconfirmed constrained dates of terraces representing
tive locations in the world (Ando et al., 2018; Nakanishi              sea-level highstands, matching age groups of approximately
et al., 2020; Yokoyama et al., 2016), consisting of several            120, 100, 80, and 60 ka (Konishi et al., 1974; Yonekura et al.,

Earth Syst. Sci. Data, 13, 1477–1497, 2021                                             https://doi.org/10.5194/essd-13-1477-2021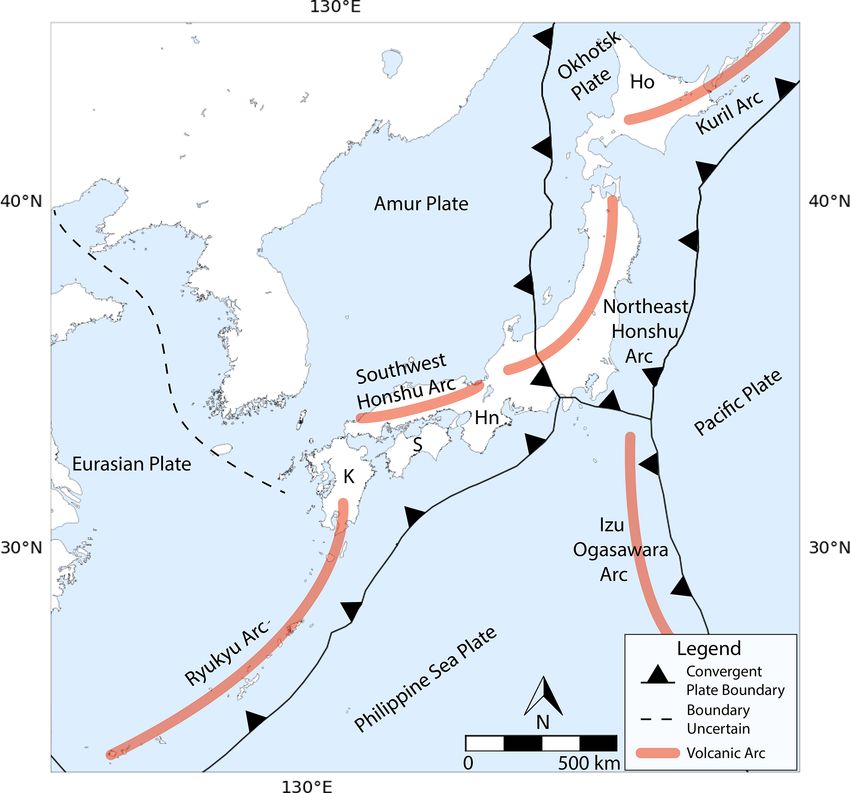
E. Tam and Y. Yokoyama: MIS 5e sea-level proxies around Japan                                                                           1479

Table 1. Varieties of sea-level proxies identified in this study.

      Sea-level proxy   Proxy description                           Description of RWL calculation    Description of IR calculation
      type              (from Rovere et al., 2016)
      Marine terrace    Relatively flat surfaces of marine ori-     Tidal prediction heights, aver-   Range of tidal prediction heights,
                        gin, shaped by marine erosion or accu-      aged over daily and then 3-       calculated over a daily period and
                        mulation of sediments from erosional        month time spans, then corre-     then averaged over a 3-month time
                        and depositional processes (Pirazzoli,      lated regionally (see Sect. 3)    span, then correlated regionally (see
                        2005)                                                                         Sect. 3)
      Beach deposits    Accumulation of loose sediments found       See above                         See above
                        on coastal surfaces, such as sand,
                        gravel, or pebbles (Anthony, 2005)
      Coral terrace     A marine terrace formed specifically        MLLW – (MDp /2)                   MDp – see Table 3
                        from the interaction between biocon-
                        structional (coral reef growth) and ero-
                        sional processes (Anthony, 2008)

2001). Ages from oxygen isotope analyses of deep-sea sedi-
ment cores also corresponded to these high-sea-level periods,
linking these analyses together and more accurately defining
MIS 5e, 5c, and 5a (Lisiecki and Raymo, 2005; Yokoyama
et al., 2019a; Ota, 1986). Though U–Th dating continues to
be used in Japan (e.g., Inagaki and Omura, 2006), suitable
samples of carbonate origin are generally found only in the
Ryukyu Islands (Ota and Omura, 1991).

2.3     Chronostratigraphy and tephrochronology

Studies examining sea-level proxies in Japan heavily rely on
chronostratigraphic correlations, employing key widespread
tephra and stratigraphic layers, the latter of which are
often constrained by the former. Machida (1975) used
tephrochronology with fission track ages to correlate high-
sea-level stages as observed in Papua New Guinea and Bar-
bados (Ota and Omura, 1991; Chappell, 1974; Chappell et
al., 1996; Yokoyama et al., 2001a, b), paving the way for the
use of tephra and pumice layers as a common chronohori-                   Figure 2. Tephra distribution map in and around Japan, modified
zon dating technique in stratigraphic analysis. Characteriza-             from Machida (2002). Tephra recognized as key chronohorizons in
tion of glass mineral assemblages and chemical composition                this study include Toya, Kc-Hb, On-Pm1, Aso-4, K-Tz, SK, DKP,
through electron microprobe, instrumental neutron activation              and AT. Source volcanoes are indicated by red triangles.
analysis, and inductively coupled plasma mass spectrometry
has allowed for identification of chemical signatures of spe-
cific tephra layers, linking these layers to specific eruptive            moluminescence, electron spin resonance, and K–Ar dat-
events and volcanoes (Machida, 2002). Thus, it became pos-                ing techniques have all been utilized to establish and cross-
sible to link widely distributed tephra layers and associated             check ages associated with tephra depositional events. Due
stratigraphic layers/marine terraces by age and to Marine                 to the wide distribution of tephra layers and the plethora
Isotope Stages (Machida and Arai, 2003). Key tephra lay-                  of dating techniques available for analyzing them, chronos-
ers from individual eruptions have broad distributions, with              tratigraphic correlation to identified tephra layers or age-
Japanese-sourced tephra layers identified in Korea and the                constrained stratigraphic layers is considered reliable and
Ryukyu Islands (Fig. 2; Machida, 2002).                                   heavily used in Japan (Machida, 2002; see Table 4).
   Dating of tephra layers is essential in constraining ages                 Of the many tephra layers identified and employed as reli-
of stratigraphic layers, and 14 C, fission-track, U–Th, ther-             able chronostratigraphic horizons, the Toya tephra, Zarame

https://doi.org/10.5194/essd-13-1477-2021                                                 Earth Syst. Sci. Data, 13, 1477–1497, 2021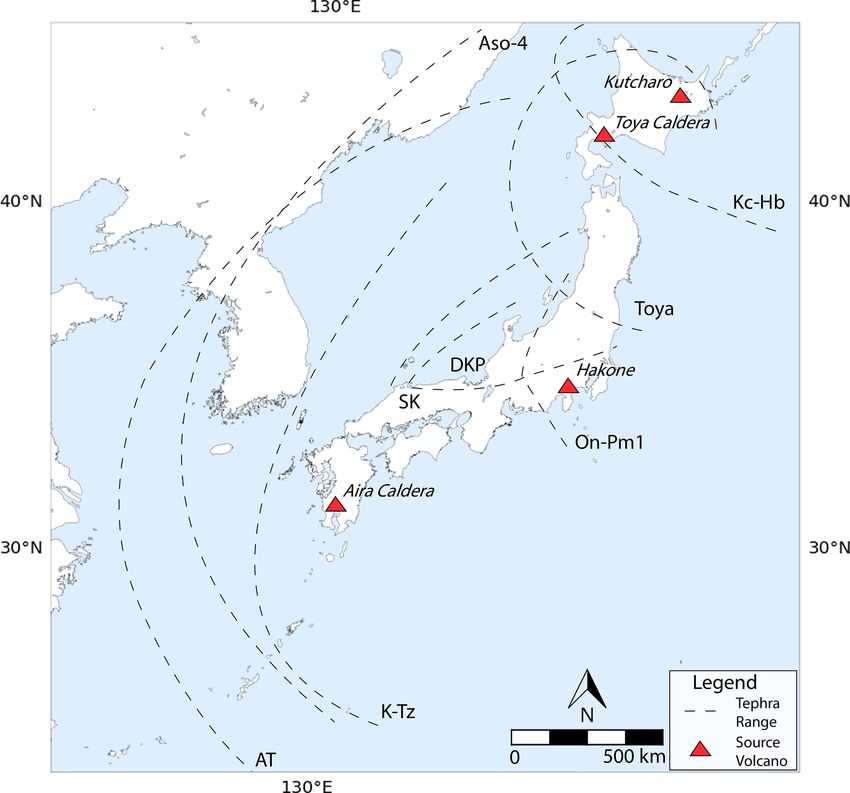
1480                                                         E. Tam and Y. Yokoyama: MIS 5e sea-level proxies around Japan

pumice (ZP), Aso-4, and Aira-Tn (AT) layers have broad             not uncommon when deemed equivalent to well-constrained
distributions and are commonly used to constrain ages of           proxies within the region (e.g., Koike and Machida, 2001).
sea-level proxies around Japan (Fig. 2). The Toya tephra is
widely distributed over much of Hokkaido and northern Hon-         2.4   Tectonic uplift studies
shu, sourced from eruptions that formed the Toya Caldera
(Machida et al., 1987). Ages have been constrained to be-          The reliance on tephrochronology-based chronostratigraphy
tween 112–115 ka by stratigraphic correlations of tephras          and chronostratigraphic correlation without use of a direct
and terrace heights (Machida, 2002), though zircon U–Th–           dating technique highlights the frequent lack of directly dat-
Pb dating and aliquot regeneration–red thermal lumines-            able samples associated with sea-level proxies in Japan. Ma-
cence dating have given ages of 108 ± 19 ka and 104 ± 30–          rine terraces, when found without reliable tephra layers, have
118 ± 30 ka (Ito, 2014; Ganzawa and Ike, 2011). The ZP             been correlated by counting interglacial deposits/terraces
layer was deposited as thick airlaid tephra from an unknown        backwards from MIS 5e (Ito et al., 2017), or by compar-
volcano and is found below the Toya tephra and above MIS           ing relationships within a series of terraces where one ter-
5e surfaces in stratigraphic sequences, with ages estimated        race is constrained by recognized tephra layers, 14 C dating
by Miyauchi (1985) between 110–120 ka (Matsuura et al.,            (for younger terraces in the series), or paleontological prox-
2019; Miyauchi, 1985). The ZP layer has been identified in         ies such as molluscs (Koike and Machida, 2001). Due to the
studies examining northern Honshu, though mainly in the            relationship between uplift and terrace preservation, regional
well-studied Kamikita coastal region where Middle and Late         uplift rates have been utilized to assign MIS stages to ter-
Pleistocene terraces are widely distributed on multiple levels     race sequences, and likewise terrace ages have been used to
(e.g., Matsuura et al., 2019).                                     calculate uplift rates.
   The AT tephra is one of the most widespread tephra                 Often, studies that identify sea-level proxies in Japan fo-
in Japan, with traces having been found in Kyushu,                 cus on calculating regional tectonic uplift rates and pat-
Shikoku, Honshu, and Korea (Machida and Arai, 2003, 1983;          terns (e.g., Suzuki et al., 2011; Miyazaki and Ishimura,
Machida, 2002). The tephra was sourced from three phases           2018). As uplift rate calculations require dating of an up-
of eruptions of the Aira caldera in northern Kagoshima Bay         lifted proxy, MIS 5e terraces can be utilized for their de-
and has been dated by 14 C to an age of 25.12 ± 0.27 ka BP         fined age range. When possible, numerical age dating tech-
(Miyairi et al., 2004; Machida and Arai, 2003). The Aso-           niques (see below for more techniques) or tephrochronol-
4 tephra layer represents the youngest and largest tephra          ogy are utilized to constrain ages to calculate the regional
layer from the Aso Caldera in central Kyushu and was dis-          uplift rates (e.g., Hiroki, 1994; Ota and Odagiri, 1994). If
tributed as far as eastern Hokkaido, making it ideal for ter-      direct dating techniques cannot be employed, stratigraphic
race chronology (Machida, 2002; Aoki, 2008). Ages be-              correlation has been relied on to constrain terrace ages. Ter-
tween 86.8–87.3 ka were obtained from detailed δ 18 O iso-         race heights, regional uplift rates, and sediments signifying
topic stratigraphy from ocean cores collected in the north-        transitions between sea-level highstands have been used to
west Pacific Ocean and the Sea of Okhotsk (Aoki, 2008).            designate MIS 5e terraces when there is a lack of datable
   Though techniques defining tephra ages have become              material (Yoshikawa et al., 1964). River profiles have also
more precise over time, overreliance on tephra-based               been used to designate sea-level/marine terrace height re-
chronostratigraphy can be precarious, as certain tephra lay-       lationships (Yoshiyama, 1990) and implied regional strati-
ers have been and still are described with large age uncer-        graphic relationships (Koike and Machida, 2001). However,
tainties. Although the Toya tephra has since been more ac-         these techniques introduce a higher possibility of dating un-
curately constrained (Ito, 2014; Ganzawa and Ike, 2011),           certainties due to the use of stratigraphic relationships (as
historical utilizations of ages from the original fission track    mentioned earlier) and age calculation based on regional up-
age, along with ages from stratigraphic constraints of the         lift rates, which rely on the assumption of constant uplift over
ash layer in the northern part of Japan, resulted in a range       the proxy’s history.
of 90–130 ka (Okumura and Sagawa, 1984; Miyauchi, 1988;
Ota and Omura, 1991). An applied example, updated ages of          2.5   Other techniques
tephra-defined marine terraces from Tanegashima (Machida
et al., 2001) compared with the original age interpretation        While the abovementioned geochronological techniques rep-
(Ota and Machida, 1987) show a discrepancy of 20 kyr. Large        resent the bulk of techniques commonly utilized in sea-level
uncertainty ranges from various dating techniques combined         proxy identification, many others have been employed in as-
with tephra layer ages defined solely by stratigraphic corre-      sessing their ages. In addition to U–Th dating, tephrochronol-
lation alone indicate that while tephrostratigraphy is viable,     ogy, and stratigraphic correlation, a limited number of in-
direct dating of tephra layers and sea-level proxies should be     vestigative studies utilizing OSL dating have been performed
utilized when available. It should also be noted that age cor-     on marine terraces in Japan. Samples from the Noto Penin-
relation of sea-level proxies in the absence of tephra layers is   sula, the Kamikita coast, and the Oga Peninsula have been
                                                                   analyzed utilizing thermoluminescence and multiple-aliquot

Earth Syst. Sci. Data, 13, 1477–1497, 2021                                         https://doi.org/10.5194/essd-13-1477-2021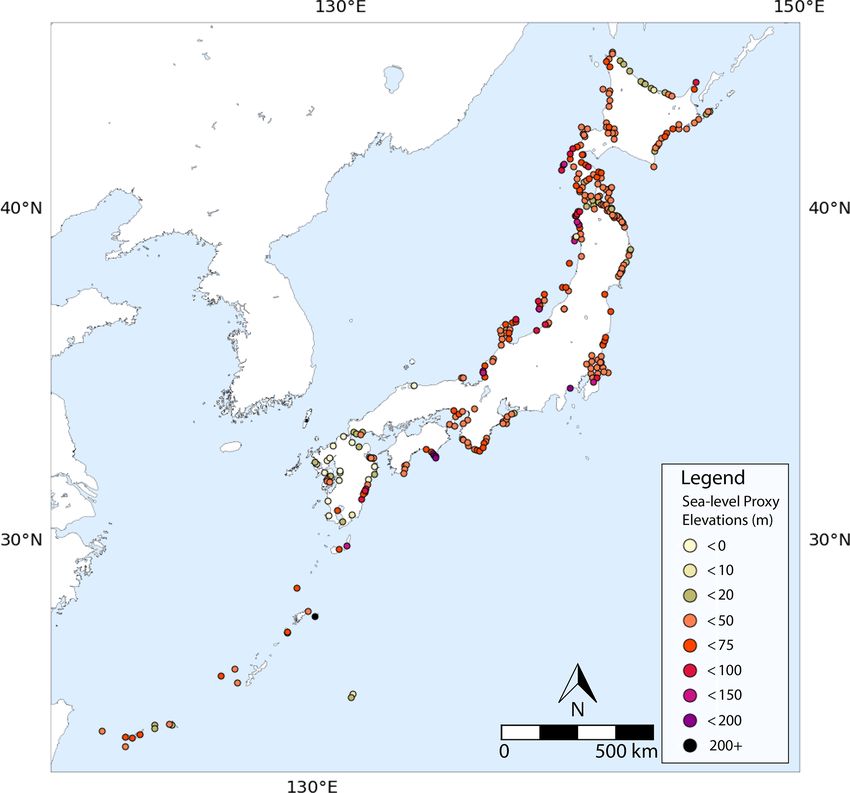
E. Tam and Y. Yokoyama: MIS 5e sea-level proxies around Japan                                                                              1481

Table 2. Elevation measurement techniques identified in this study.

     Measurement technique           Description (from Rovere et al., 2016)                      Typical vertical error under optimal
                                                                                                 conditions
     Barometric altimeter            Difference in barometric pressure between a point of        Up to ±20 % of elevation measurement
                                     known elevation (often sea level) and a point of un-
                                     known elevation
     Differential GPS                GPS positions acquired in the field and corrected in real   ±0.02/±0.08 m, depending on survey
                                     time or during post-processing                              conditions and instruments used
     Metered tape or rod             The end of a tape or rod is placed at a known elevation     Up to ±10 % of elevation measurement
                                     point, and the elevation of the unknown point is calcu-
                                     lated using the metered tape or rod
     Not reported                    The elevation measurement technique was not reported,       20 % of the original elevation reported
                                     most probably hand level or metered tape
     Topographic map and digi-       Elevation derived from the contour lines on topographic     Variable with scale of map and tech-
     tal elevation models            maps. Most often used for large-scale landforms (i.e.,      nique used to derive DEM
                                     marine terraces)
     Total station or auto or hand   Total stations or levels measure slope distances from the   ±0.1/±0.2 m for total stations,
     level                           instrument to a particular point and triangulate relative   ±0.2/±0.4 m for auto or hand level
                                     to the XYZ coordinates of the base station

additive dose (MAAD) quartz OSL dating (Tanaka et al.,                    3.1   Data collection and calculations
1997), K–feldspar post-infrared infrared (pIRIR) stimulated
luminescence dating (Ito et al., 2017), and both quartz OSL               Sea-level proxy elevations and uplift rates were recorded
and K–feldspar pIRIR dating (Thiel et al., 2015). Results                 from data sources when values were clearly articulated in
from Thiel et al. (2015) and Ito et al. (2017) suggest that               reviewed studies or could be interpreted from figures. Data
K-feldspar pIRIR dating is appropriate for dating marine                  retrieved from Koike and Machida (2001) were averaged for
terraces and marine sediments formed during MIS 5 and                     each given location. Elevation and uplift rate values describ-
older, even in locations where quartz OSL is deemed unsuit-               ing a single location were summed and divided by the total
able. Limited studies have utilized cosmogenic nuclide dat-               number of utilized values for the average elevation and uplift
ing (10 Be and 26 Al) to analyze MIS 5e- and MIS 7-associated             rate and noted within our database as averaged. Data from
terraces in the Kii Peninsula and Shikoku (Yokoyama et al.,               other studies were added to the database to be representative
2015, 2019b). Amino acid racemization has seen limited use                of each region.
in constraining MIS 5e terrace ages in Japan (e.g., Ota and                  Few examined studies listed sea-level proxy elevation mar-
Odagiri, 1994), as has electron spin resonance (ESR) dating               gin of error (MoE) values, so values were assigned based on
(e.g., Ikeya and Ohmura, 1983).                                           the measurement technique utilized as described in Rovere et
                                                                          al. (2016, Table 2). For proxies that had elevations averaged
3   Database details                                                      from multiple points, half of the range between the highest
                                                                          and lowest proxy elevations was added to the MoE. Sea-level
As a part of this review, over 70 papers, including three                 proxies with large ranges in elevation resulted in rather large
databases and the references therewithin, were examined. Di-              MoEs, which are denoted in the relative sea level (RSL) qual-
rect latitude and longitude values were provided only in lim-             ity rating as less reliable (see Sect. 5.1).
ited studies (specifically in databases provided in Pedoja et                Tidal ranges were calculated for the Japanese coastline to
al., 2011, 2014), so locations were estimated by comparing                calculate indicative range (IR), relative water level (RWL),
mapped locations provided in published studies to Google                  and the upper and lower limits (UL, LL; as defined in Rovere
Earth, or finding an appropriate average location for areas               et al., 2016) for modern analogs of sea-level proxies. Tidal
examined in the study. Due to the large quantities of data ex-            predictions were provided by the Hydrographic and Oceano-
amined (in Koike and Machida, 2001, alone over 2000 data                  graphic Department of the Japan Coast Guard (2020). Tidal
points), this review aims to broadly represent studies con-               predictions for all functional tide gauges were examined for
ducted throughout Japan.                                                  dates between 1 January and 31 March 2020, to calculate
                                                                          the average, maximum, and minimum sea-level height and

https://doi.org/10.5194/essd-13-1477-2021                                                  Earth Syst. Sci. Data, 13, 1477–1497, 2021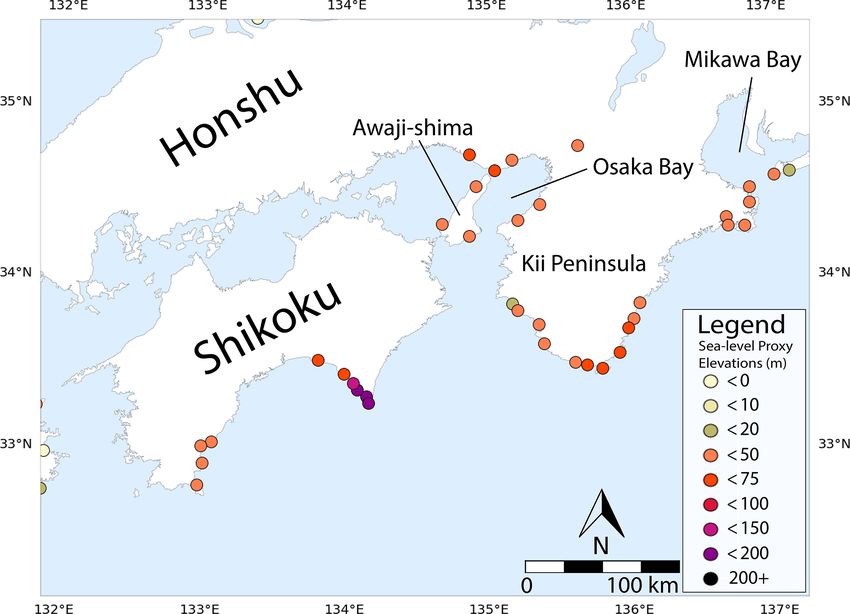
1482                                                       E. Tam and Y. Yokoyama: MIS 5e sea-level proxies around Japan

sea-level range for each day and the overall examined time
period. The Japanese coastline was divided into 59 sectors,
based on similarities in tidal changes during this period (Ap-
pendix A).
   For marine terraces and beach deposits, IR and RWL with
the data and formulas of IMCalc (Lorscheid and Rovere,
2019) were used. Instead of the standard tidal values in IM-
Calc, the tidal values calculated in this study were utilized.
UL and LL for coral terrace proxies or those with relevant
molluscan constraints were evaluated manually (Table 3) to
reflect a more accurate sea-level range due to proxy forma-
tion below sea level. Sea-level extent for coral- or mollusc-
defined proxies can reach from 0 to 30 m in Japan but can
be further constrained by identifying key species (Yokoyama
and Esat, 2015; Nakamori et al., 1995). Coral reef habitat ex-
tent ranges from the mean lower low water (MLLW) to the
end of the forereef (Rovere et al., 2016). Using the IR and
RWL obtained for each sector, UL and LL for coral-terrace-
and mollusc-constrained proxies were calculated as follows:
                                                                 Figure 3. Map of Japan, indicating subsections in which MIS 5e
UL = RWL − (IR/2),                                         (1)
                                                                 sea-level proxies are examined.
LL = UL − MDp ,                                            (2)

where RWL, IR, UL, and LL represent the relative water
                                                                 3.2   Sea-level indicators
level, indicative range, upper limit, and lower limit, and MDp
represents the maximum depth of the proxy examined (Ta-          Studies reviewing MIS 5e sea-level proxies in Japan seldom
ble 3).                                                          differentiate the term “marine terrace” from other types of
   Paleosea-level and sea-level uncertainties were evaluated     sea-level indicators. As such, there is frequently ambiguity
within the WALIS database, using the principles outlined in      in how terraces are defined, especially when utilized as refer-
Rovere et al. (2016). Paleosea-levels for each location were     ence points to examine tephra layer relations or to calculate
calculated using the following formula:                          tectonic uplift rates. Terrace composition is often described
                                                                 in studies, but this information is not often utilized to differ-
RSLp = E − RWL,                                            (3)   entiate between types of terraces. Sea-level indicators exam-
where RLSp represents the paleosea-level, E is the current       ined were categorized as marine terraces, beach deposits, and
proxy elevation, and RWL is the modern relative water level.     coral reef terraces, as defined in Rovere et al. (2016; Table 1).
The associated MoE for each proxy was calculated with the
following formula:                                               3.3   Elevation details
        h               i1/2                                     Little information was provided in studies reviewed about
σRSL = (Ee )2 + (IR/2)2      ,                           (4)     sea-level proxy elevation data utilized. Some studies reported
                                                                 elevations measured by barometric altimeter, total station or
where σRSL is the proxy’s paleosea-level MoE, Ee is the ele-
                                                                 hand level, differential GPS, or using elevations reported on
vation MoE, and IR is the modern indicative range. Paleosea-
                                                                 topographic maps, though often the measurement technique
level uncertainties are captured within σRSL , with IR of the
                                                                 was not reported (Table 2). The sea-level datum utilized is
modern analog describing the range over which the sea-level
                                                                 relative mean sea level (RLS), namely assumed to be mean
proxy formed (Shennan, 1982; Van de Plassche, 1986; Hijma
                                                                 sea level (MSL), and does not correct for changes in sea level
et al., 2015; Rovere et al., 2016) and Ee representing uncer-
                                                                 due to eustacy or glacial isostatic adjustments. Uplift rate
tainties in the elevation measurements.
                                                                 margin of errors was not reported in most studies, so proce-
   Values denoted as averages within our database should
                                                                 dures outlined in Pedoja et al. (2011) were utilized to calcu-
be taken as overviews of the data provided for the area and
                                                                 late rates for studies that reported them. Each proxy elevation
should not be used for rigorous calculations. Paleosea-level
                                                                 MoE was divided by 124 000 years and reported in mm yr−1 .
calculations and their associated MoE do not directly account
                                                                 Rates were calculated relative to MSL and likewise do not
for subsidence or uplift that has occurred over its lifetime.
                                                                 factor in sea-level changes due to eustacy or glacial isostatic
Proxy data points were rejected when the background ref-
                                                                 adjustments.
erences could not be evaluated or did not provide a usable
elevation value.

Earth Syst. Sci. Data, 13, 1477–1497, 2021                                        https://doi.org/10.5194/essd-13-1477-2021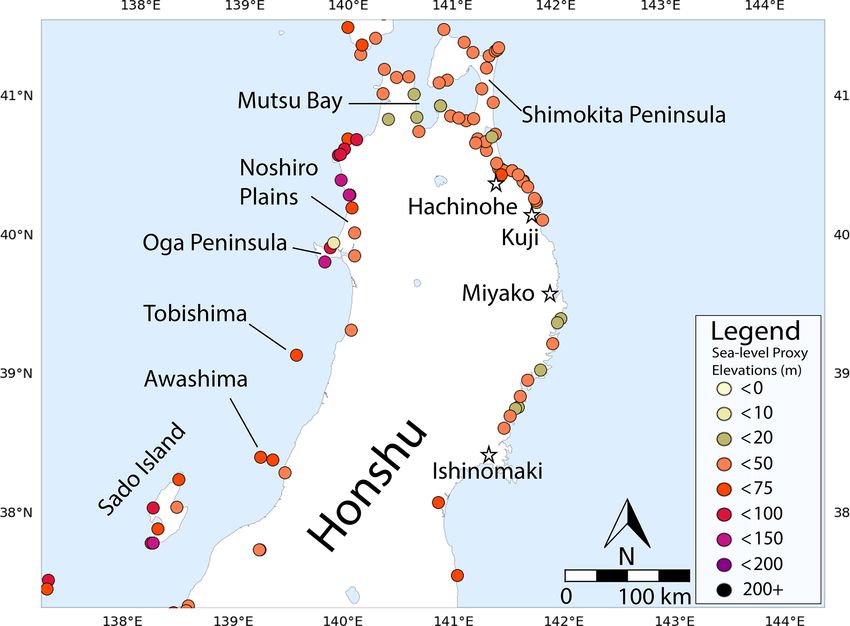
E. Tam and Y. Yokoyama: MIS 5e sea-level proxies around Japan                                                                            1483

Table 3. Coral assemblage descriptions from reviewed literature used to constrain sea-level margin of error.

    Marine assemblage                           Utilized             Maximum Depth rationale                        Depth reference
                                                reference            depth of
                                                                     proxy
                                                                     (MDp )
    Coral assemblage                            Koike and            30 m          General coral range              Yokoyama and Esat
    (no further details)                        Machida                                                             (2015); Nakamori et al.
                                                (2001)                                                              (1995)
    Mollusca: Mactra sulucataria,               Sugihara             20 m          Mollusc habitat in upper shal-   Sugihara (1970)
    Cycymeris vistita                           (1970)                             low ocean of warm current flow
    Foraminifera: Baculogypsina sphaeru-        Koba et al.          5 m (reef     Baculogypsina sphaerulata:       Hosono et al. (2014)
    lata, Calcarina pengleri, Amphistegina,     (1979)               crest to      range within 5 m
    Lithophaga curta, Acropora sp., Montipora                        upper
    sp., Goniastrea sp., Hydnophora exesa,                           reef
    Symphilla recta                                                  slope)
    Hermatypic corals, encrusting algae,        Omura et al.         20 m          Typical coral depth of her-      Japanese Coral Reef
    benthic foraminifera: Calcarina, Baculo-    (1994)                             matypic corals up to 20 m        Society, Ministry of the
    gypsina, Marginopora                                                           around Japanese islands          Environment (2004)
    Crassostrea gigas                           Miyauchi             20 m          Intertidal to subtidal range     Harris (2008)
                                                (1985)
    Mollusca: Arca granosa L., Ostrea palmipe   Yonekura             Indicative    Arca granosa: intertidal zone,   Pathansali (1966)
    Sow. cf. multlilirata                       (1968)               range         at 1–2 m water depth
    Mollusca: Paphia undulata                   Ishii et al.         Indicative    Inhabits inshore seabed          Paphia undulata (2020)
    (Paratapes undulatus)                       (1994)               range
    Mollusca: Patinepecten tokyoensis, Pecten   Kamada         and   10 m          Typical Patinopecten habitat     Patinopecten yessoen-
    (Notovola) naganumanus, Psedoamusium        Niino                              range is between 4–10 m          sis (FAO, 2020)
    insusicostatum, Pseudoraphitoma naganu-     (1955)
    maensis Ctuka, Mikaithyris hanazawai
    Intertidal molluscan fossil assemblage      Shimoyama et         Indicative    Intertidal habitat range
                                                al. (1999)           range
                                                                     provided
    Subtidal molluscan fossil assemblage,       Shimoyama et         5m            Interpreted from Ophiomorpha     Frey et al. (1978)
    including Ophiomorpha sp.                   al. (1999)                         analog Callianassa major; sug-
                                                                                   gested subtidal depth is 3–5 m

4     Sea-level proxies: regional overview                                  of the studies conducted denoting proxy elevations have uti-
                                                                            lized them to investigate tectonic uplift rates.

Sea-level proxies as recorded in the WALIS database are de-                 4.1   Hokkaido
scribed in the following section. These data points were di-
vided into eight regions for description and analysis based                 Sea-level proxies in Hokkaido are numerous and have been
on geographic location and regional patterns as follows:                    well documented (Fig. 4). In particular, Okumura (1996) re-
Hokkaido; northern Honshu; Kanto; the Noto Peninsula;                       ported terraces across the island, constraining proxies with
the Kii Peninsula and Shikoku; Japan seaside consisting                     their relationship to the Toya (112–115 Ka), KP-IV (115–
of Kansai and Chugoku, Kyushu, and Yamaguchi; and the                       120 Ka), Kc-Hb (115–120 Ka), ZP (110–120 Ka), and Mb-
Ryukyu Islands (Fig. 3). Proxy elevations range between                     1 (> 130 Ka) tephra layers (Fig. 2). The first three ash lay-
−85.5 ± 5 and 205 ± 5 m for all of Japan, and patterns in                   ers are sourced from Hokkaido volcanoes, specifically from
elevation changes are indicative of tectonic activity across                Toya Caldera (Machida et al., 1987) for the former and from
the archipelago. Individual transects within regions can have               the Kutcharo Volcano for the latter two (Hasegawa et al.,
large variations in proxy elevations (Figs. 4–11), and many                 2012).

https://doi.org/10.5194/essd-13-1477-2021                                                   Earth Syst. Sci. Data, 13, 1477–1497, 2021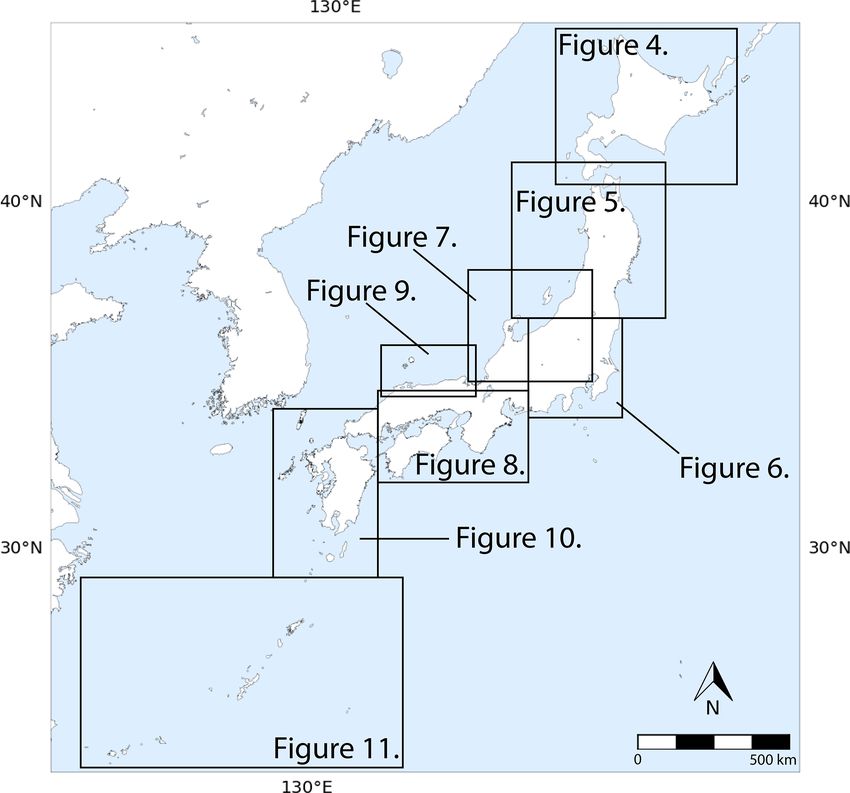
1484                                                                                       E. Tam and Y. Yokoyama: MIS 5e sea-level proxies around Japan

Table 4. A list of tephra chronohorizons utilized in the reviewed literature. Modified from Machida (2002).

           Chronohorizon                     Abbreviation Distribution                        Dating                   Dates (ka)      Reference
           name                                                                               method
                                                                                              utilized
           Toya                              Toya              Northern Japan and             OI, ST                     112–115       Machida et al. (1987)
                                                               surrounding oceans
           Zarame pumice                     ZP                Kamikita coastal               ST                         110–120       Miyauchi (1988)
                                                               plains
           Kutcharo Volcano                  Kc-Hb             Hokkaido                       FT, ST                     115–120       Machida et al. (1987); Okumura (1988)
           Kutcharo pumice flow IV           KP-IV             Hokkaido                       ST                         115–120       Hasegawa et al. (2012); Machida et al. (1987)
           Monbetsu tephra                   Mb-1              Hokkaido                       ST                            > 125      Okumura (1991)
           Daisen-Kurayoshi tephra           DKP               Across Honshu                  ST, 14 C, U                       55     Machida and Arai (1979)
           Kamitaru pumice                   KT                Northern Honshu                ST                         130–150       Hayatsu et al. (1982)
           Furumachi pumice                  FR                Northern Honshu                ST                                90     Hayatsu et al. (1982)
           Towada-H tephra                   To-H              Northern Honshu                14 C, OI                          15     Machida and Arai (2003); Hayakawa (1990);
                                                                                                                                       Arai et al. (1986)
           Naruko-Yanagisawa                 Nr-Y              Northern Honshu                14 C, OSL, FT                41–63       Machida and Arai (2003)
           Naruko-Nisaka tephra              Nr-N              Northern Honshu                ST                                90     Machida and Arai (2003)
           Dokusawa tephra                   DKS               Northern Honshu                ST                          90–100       Matsuura et al. (2009)
           Tanabu tephra                     Tn (A-C)          Northern Honshu                ST, OI               MIS 7–MIS 8         Matsuura et al. (2014)
           Ontake-1 pumice                   On-Pm1            Central to northern            FT, K–Ar, ST                ca. 100      Machida and Arai (2003)
                                                               Honshu
           Sambe-Kisuki tephra               SK                Across Honshu                  ST                         110–115       Toyokura et al. (1991)
           Shimosueyoshi loam                                  In and around                  FT                         120–130       Toma (1974)
                                                               Yokohama
           Hakone pumice fall                Hk-KIP-7          Chubu-Kanto                    ST                              130      Suzuki (1992)
           deposit                                             (central Japan)
           Hakone Kissawa pumice             Hk-KIP-8          Chubu-Kanto                    FT                              132      Suzuki (1992)
           layer                                               (central Japan)
           Miwa Lower pumice                 Miwa-L            Chubu-Kanto                    ST                              130      Suzuki (1992)
           layer                                               (central Japan)
           Hakone-Tokyo pumice               Hk-Tp             Around Tokyo                   OSL                      67.5 ± 4.3      Machida et al. (1987); Tsukamoto et al. (2010)
           Matsue tephra                     DMP               Chugoku and Shikoku            ST                         110–120       Inoue et al. (2005); Miura and Hayashi (1991)
           Aso-3 tephra                      Aso-3             Central Kyushu –               FT, K–Ar, ST               120–135       Machida and Arai (2003)
                                                               central Honshu
           Ata tephra                        Ata               In and around Japan            K–Ar, ST                   105–110       Machida and Arai (2003)
           Aira-Tanzawa tephra               AT                In and around Japan            14 C                  25.12 ± 0.27       Machida (2002); Miyairi et al. (2004)
           Aso-4 tephra                      Aso-4             In and around Japan            OI, K–Ar, ST                 87–89       Takarada and Hoshizumi (2020)
           Kikai-Tanazawa tephra             K-Tz              In and around Japan            ST, TL                       75–80       Machida and Arai (2003)
 ∗ OI: oxygen isotope dating; ST: stratigraphy correlation; FT: fission-track dating; 14 C: carbon-14 dating; K–Ar: potassium–argon dating; OSL: optically stimulated luminescence dating; U:
 uranium–thorium dating.

   Sea-level proxies in Hokkaido can be examined in five                                                 ally by the ZP and Kc-Hb layers (Okumura, 1996; Koike and
subregions: northeast, southeast, northwest, southwest, and                                              Machida, 2001; Machida et al., 1987). Higher elevations can
the western cape. Proxies on the northeastern edge of                                                    be found towards the center (35 ± 7–60 ± 12 m), decreasing
Hokkaido are age constrained by the Toya, KP-IV, Kc-Hb,                                                  moving outwards (15 ± 3–32.50 ± 11.5 m). Both the north-
and Mb-1 tephra layers and are low in elevation compared                                                 eastern and southeastern edges are described along several
to the rest of the island. Elevations generally range be-                                                transects by Okumura (1996), and marine terraces correlated
tween 6 ± 1.20–18 ± 7.60 m. The proxies closer to the Ne-                                                to the last interglacial period have been designated as M1
muro Strait increase from 33.50 ± 35.70–80 ± 16 m. Prox-                                                 stage terraces, which are often observed in sequence with H1,
ies along the southeastern edge of Hokkaido are constrained                                              H2, and M2 terraces. M1 terraces are composed of marine
predominantly by the Toya and KP-IV tephras but addition-

Earth Syst. Sci. Data, 13, 1477–1497, 2021                                                                                       https://doi.org/10.5194/essd-13-1477-2021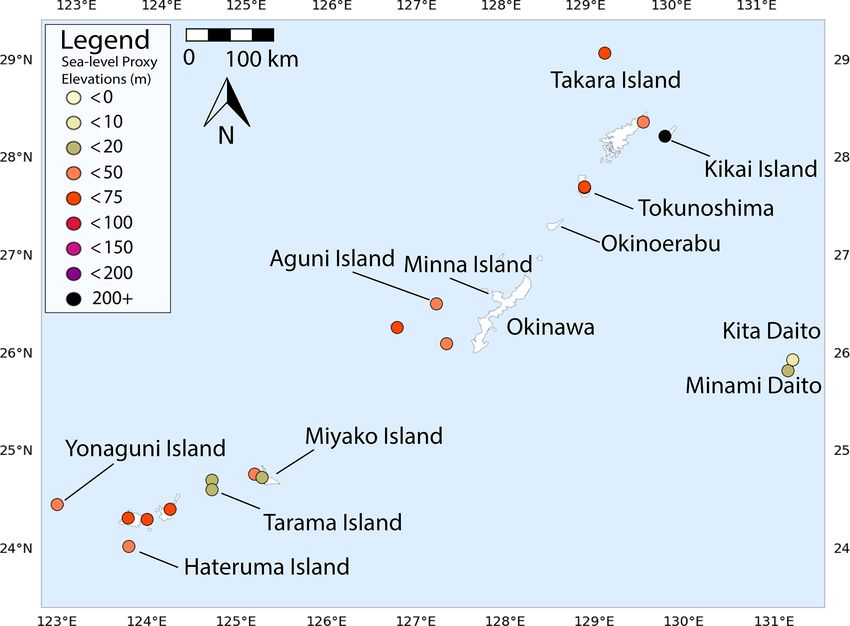
E. Tam and Y. Yokoyama: MIS 5e sea-level proxies around Japan                                                                           1485

Figure 4. Sea-level elevation proxies in Hokkaido. Sea-level indi-       Figure 5. Sea-level elevation proxies in northern Honshu. Sea-level
cators (circles) with elevation range indicated by color (see legend).   indicators (circles) with elevation range indicated by color (see leg-
Reference cities are indicated by stars.                                 end). Reference cities are indicated by stars.

sediments and overlie fluvial gravel, though no other terrace
descriptions are provided.                                               Machida, 2001), with the sand-gravel marine deposit Taka-
   Elevations of sea-level proxies on the northwestern edge              date terrace constrained by the Toya tephra to correlate to
of Hokkaido generally range between 40 ± 8–45 ± 9 m in                   MIS 5e (Miyauchi, 1985; Ito et al., 2017). Proxies in northern
elevation, though on the northern tip proxies range from                 Honshu are constrained by the Toya tephra and the ZP layer
40 ± 8–61 ± 32.20 m. Inland marine terraces near Sapporo                 (Miyauchi, 1988; Machida et al., 1987) and stratigraphic cor-
range from 30 ± 6–52.50 ± 15.50 m in elevation. Sea-level                relation. The relatively detailed understanding of terrace lay-
proxy ages are defined primarily through stratigraphic cor-              ers and age constraints in this region has encouraged trials of
relation, though a few are directly constrained by Toya and              pIRIR OSL dating in this region (Ito et al., 2017; Thiel et al.,
Kc-Hb tephra layers (Koike and Machida, 2001; Machida et                 2015), establishing it as a viable dating method for marine
al., 1987). Sea-level proxies on the western arm of Hokkaido             sediments.
vary between 20 ± 1–130 ± 10 m in elevation, with lower                     Sea-level proxy elevations around Mutsu Bay itself range
elevations in areas further to the north or south (20 ± 1–               between 13.5 ± 3.70–35 ± 22 m, while further north on the
45 ± 25 m). Proxies toward the center of this range have ele-            Shimokita Peninsula proxy elevations range between 30 ± 6–
vations between 55 ± 21–130 ± 26 m, with the highest eleva-              50 ± 10 m. Terraces are generally constrained by the Toya
tions found on Okushiri Island. Terraces on the eastern side             tephra and the ZP layer, but Tanabu A, B, C (MIS 7–8; Mat-
of the arm also have higher elevations (50 ± 30–90 ± 38 m).              suura et al., 2014) tephra layers have also been identified to
Ages are constrained primarily by use of the Toya tephra                 underlie MIS 5e terraces at certain sites. More recent stud-
and stratigraphic relationships (Koike and Machida, 2001;                ies from Matsuura et al. (2014) and Watanabe et al. (2008)
Machida et al., 1987), though ZP layers are also found at                have explored marine terraces on the Shimokita Peninsula in
select locations including Okushiri Island (Miyauchi, 1988).             depth to examine regional tectonic uplift and deformation.
While sea-level proxies for southwestern Hokkaido have                      Terraces on upper eastern side of northern Honshu have
been studied (Yoshiyama, 1990), elevation values were not                elevations between 15 ± 0.08–51 ± 2 m overall, though gen-
specifically recorded.                                                   erally they range between 35–45 m from the bottom of
                                                                         the Shimokita Peninsula down towards Hachinohe. Between
4.2   Northern Honshu
                                                                         Hachinohe and Kuji, sea-level proxy elevations vary between
                                                                         22.25 ± 5–48.50 ± 3 m, though most are between 25–30 m,
Recorded elevations of sea-level proxies in northern Hon-                generally decreasing towards the south. Most terraces are
shu can be subdivided into Mutsu Bay–Shimokita Peninsula,                constrained by an observed Toya tephra layer, and in some
upper eastern, lower eastern, and western regions (Fig. 5).              areas by the ZP layer. OSL ages from AIST (2015, 2016)
Marine terraces are well defined and categorized on the                  and Ito et al. (2017) for MIS 5e terraces as examined in
eastern edge, and they are recognized and named as the                   Matsuura et al. (2019) are noted to align with results from
Fukuromachi, Shichihyaku, Tengutai, Takadate, Nejo, and                  tephrochronology, though OSL ages from terraces represent-
Shibayama terraces around the Kamikita Plains (upper sec-                ing MIS 7 and 9 from the same studies were found not to
tion of the eastern region; Miyauchi, 1985, 1987; Koike and              match tephrochronologically restrained ages. Sea-level prox-

https://doi.org/10.5194/essd-13-1477-2021                                                 Earth Syst. Sci. Data, 13, 1477–1497, 2021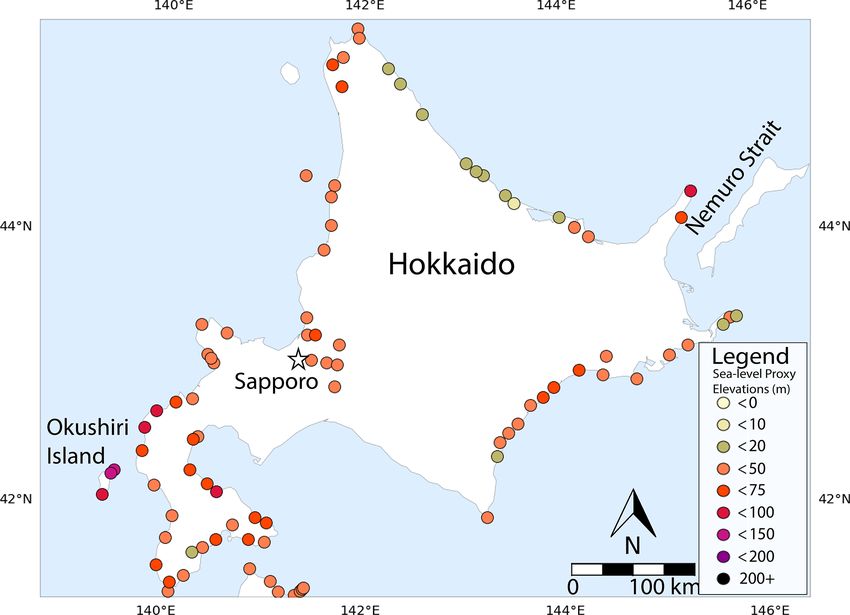
1486                                                             E. Tam and Y. Yokoyama: MIS 5e sea-level proxies around Japan

Figure 6. Sea-level elevation proxies in the Kanto region. Sea-level    Figure 7. Sea-level elevation around the Noto Peninsula. Sea-level
indicators (circles) elevation range indicated by color (see legend).   indicators (circles) with elevation range indicated by color (see leg-
Reference cities are indicated by stars.                                end). Reference cities are indicated by stars.

ies in this transect are identified by their beach deposit se-
quences, mainly silt, sand, and gravel deposits (Miyazaki and           4.3   Kanto
Ishimura, 2018; Miyauchi, 1985).
   On the lower eastern side between Miyako and Ishi-                   Studies identifying sea-level proxies from the last interglacial
nomaki, sea-level proxy elevations varied between                       in Kanto denote terraces mainly in Ibaraki and Chiba prefec-
17.83 ± 8.56–25.33 ± 11.10 m. Ages were constrained                     tures (Fig. 6). Tephra utilized to constrain sea-level proxy
through stratigraphic correlation (Koike and Machida,                   ages are sourced predominantly from Mt. Hakone (Hk-Tp,
2001; Miura, 1966), and the DKS tephra layer was ob-                    Hk-KIP-8, Hk-KIP-7), though Miwa-L, K-Tz layers, and
served in Matsuura et al. (2009). Terraces reported in                  Shimosueyoshi loam are also utilized in this region.
Miura (1966) were initially correlated to the Shimosueyoshi                 Sea-level proxies in the upper part of Ibaraki pre-
interglacial period, which has since been reinterpreted as              fecture (north of Hitachinaka) have elevations between
the last interglacial period. Terraces reported by Matsuura et          52.75 ± 11.55–74 ± 14.80 m, decreasing towards the south,
al. (2009) were described wave cut benches. Proxies south               and are chronostratigraphically constrained mainly by the
of Ishinomaki had relatively higher elevations (60 ± 12,                Miwa-L pumice layer, in addition to the K-Tz and Hk-
67.50 ± 18.50 m).                                                       KIP-7 layers (Suzuki, 1989). In the Joban region to the
   Sea-level proxies on the western side of northern Hon-               south, sea-level proxies are observed with elevations between
shu are lower in elevation towards the northern tip                     23.23 ± 9.46–50 ± 10 m, and increasing drastically south on
(19.25 ± 14.85–30 ± 6 m), and drastically increase mov-                 the Boso Peninsula (maximum elevation of 130 ± 10 m; Sug-
ing south (72 ± 54.50–140 ± 28 m). Proxy elevations de-                 ihara, 1970; Koike and Machida, 2001; Kaizuka, 1987). The
crease to 45.5 ± 14.5–53.67 ± 26 m in the Noshiro Plain                 tilting towards the northeast is thought to be at least partially
(Miyauchi, 1988; Naito, 1977). Two locations have signif-               due to uplift related to Sagami trench subduction to the south-
icantly lower elevations of 2.5 ± 0.5 m (Thiel et al., 2015)            west of the Boso Peninsula (Tamura et al., 2010). Proxies are
and 21 ± 18 m (Naito, 1977), though ages for the for-                   mainly constrained by the presence of Miwa-L and Hk-KIP-8
mer were well constrained by both tephrochronology and                  layers, in addition to Hk-Tp, On-Pm1, and the Shimsueyoshi
pIRIR OSL dates. Elevations of terraces found on the                    loam (Suzuki, 1989; Suzuki, 1992). 14 C dating was utilized
Oga Peninsula are relatively high (80 ± 16 m, 130 ± 26 m,               on identified molluscs (Crassotrea gigas) to constrain a MIS
Miyauchi, 1988), and proxies found south of this range                  1 stage terrace and correlate other highstand-related terraces
from 25–45 m. Sea-level proxy heights are also found on                 accordingly at Yokaichiba (Koike and Machida, 2001). OSL
islands along the western shoreline, including Tobishima                dating using quartz grains identified ages of shallow marine
(58.88 ± 23.80 m), Awashima (54.55 ± 21.93 m), and Sado                 sediments from near Lake Kitaura, identifying sequences
Island (45.57 ± 20.02–120 ± 24 m). Age correlations were                correlated to MIS 5e–5c (Hataya and Shirai, 2003). One sea-
made through mainly the Toya and ZP tephra layers, though               level proxy was denoted in Sagami Bay (160 ± 32 m), and
K-Tz and SK tephra layers were also noted (Watanabe and                 other locations in the bay have been studied, though eleva-
Une, 1985; Koike and Machida, 2001).                                    tion values were not reported (Koike and Machida, 2001;
                                                                        Machida, 1973).

Earth Syst. Sci. Data, 13, 1477–1497, 2021                                                https://doi.org/10.5194/essd-13-1477-2021
E. Tam and Y. Yokoyama: MIS 5e sea-level proxies around Japan 1487
4.4 The Noto Peninsula
Sea-level proxies on the Noto Peninsula itself are primar-
ily age constrained through general stratigraphic correla-
tion, though tephra layers are more numerously identified
in locations to the east and the southwest (Fig. 7). East of
the peninsula, the easternmost two terrace elevations con-
tinue lower elevations seen in northern Honshu (30 ± 6,
45 ± 49 m), but moving west towards the peninsula eleva-
tions are higher (81.67 ± 21.33, 85 ± 17 m) and are age con-
strained by FR pumice and KT layers (Koike and Machida,
2001). On the Noto Peninsula, the northern tip has gener-
ally higher elevations (maximum at 85.44 ± 69.08 m) that
decrease significantly towards the middle of the peninsula
(18.06 ± 14.61–36.09 ± 38.20 m) and increase proceeding
south (37.62 ± 44.52–52.55 ± 16.51 m), aligning with the
Figure 8. Sea-level elevation proxies in Shikoku and the Kii Penin-
southward tilting of the peninsula observed by Ota and Hi-
sula. Sea-level indicators (circles) with elevation range indicated by
rakawa (1979). Age constraints of sea-level proxies on the color (see legend).
Noto Peninsula are mainly from stratigraphic correlations,
though the Shimosueyoshi loam layer has also been identi-
fied (Toma, 1974).
are between 41.25 ± 13.25–45 ± 9 m, with one location con-
South of the peninsula sea-level proxy elevations range
strained by AT tephra (Koike and Machida, 2001; Machida,
between 31.75 ± 36.35–46 ± 42.2 m and increase near Fukui
2002).
(67.13 ± 115.42–117.71 ± 42.50 m). Terrace ages are mainly
Elevations of proxies studied on the eastern side
constrained by DKP and AT tephra layers, especially terraces
of Shikoku range widely between 57.80 ± 27.60–
found south of Fukui, though SK and Aso-4 tephra layers
173 ± 34.60 m, increasing towards the southern tip
have also been identified (Yamamoto et al., 1996; Koike and
(Yoshikawa et al., 1964; Yonekura, 1968; Matsuura,
Machida, 2001).
2015; Mizutani, 1996; Koike and Machida, 2001). The
terraces are identified by their inner edges, with boulders
4.5 The Kii Peninsula and Shikoku through fine silt as terrace deposits (Matsuura, 2015). Older
studies utilize stratigraphic correlation to constrain ages,
Sea-level proxies found on the Kii Peninsula and the Shikoku though several tephra layers including the K-Tz layer are
region can be subcategorized into five sections: eastern recognized by Matsuura (2015). Western Shikoku has a
Kii, western Kii, Osaka Bay, eastern Shikoku, and western small number of evaluated proxies, with elevations ranging
Shikoku (Fig. 8). Age constraints for proxies in this general from 26 ± 5.20–36.58 ± 28.30 m (Ota and Odagiri, 1994;
region are determined primarily through stratigraphic corre- Koike and Machida, 2001). Five terrace layers were iden-
lation, though K-Tz, AT tephra layers, and amino acid racem- tified (H1 –H3 , M, L), with the M terrace recognized as
ization dates were utilized in select studies. representing MIS 5e (Ota and Odagiri, 1994). Ages from
Sea-level proxy locations on the eastern side of the Kii shell amino acid racemization of an underlying layer (ca.
Peninsula range between 20 ± 14–40 ± 8 m and utilize strati- 138 ka) and overlying K-Tz tephra were used to constrain
graphic correlation to constrain ages to MIS 5e (Muto, 1989; terrace layer ages (Ota and Odagiri, 1994; Mitsushio et al.,
Hiroki, 1994; Koike and Machida, 2001), though several 1989).
additional locations have been reported without elevations
around Mikawa Bay (Koike and Machida, 2001). Elevations
on the western side of the Kii Peninsula generally increase 4.6 Japan sea side: Kansai and Chugoku
towards the southern tip from 18.75 ± 5.33–63.17 ± 7.28 m
and rely on stratigraphic correlation to MIS 5e (Yonekura, Few studies have been performed in this region identifying
1968; Koike and Machida, 2001). Seven terrace levels are MIS 5e sea-level proxies (Fig. 9). Two marine terraces by
reported (H1 –H4 and L1 –L3 , with L1 representing MIS 5e) Wakasa Bay (elevations of 40 ± 8, 50 ± 10 m) were age con-
and are described as wave-based erosionally formed ma- strained from stratigraphic correlation. One submerged sea-
rine terraces, covered by later deposited sand and gravel level indicator was observed through seismic surveys of sed-
layers (Yonekura, 1968). Proxies around Osaka Bay exhib- iments in Miho Bay and identified MIS 5e-associated sedi-
ited elevations of 34.80 ± 26.96–59 ± 44.80 m with lower el- ment layers at a depth of −42 ± .08 m constrained by DMP
evations on the eastern side of the bay and higher eleva- tephra (Inoue et al., 2005). Additional locations in Kyoto,
tions to the north-northwestern side. Proxies on Awaji-shima Tottori, and Shimane prefectures (Machida and Arai, 1979;
https://doi.org/10.5194/essd-13-1477-2021 Earth Syst. Sci. Data, 13, 1477–1497, 20211488 E. Tam and Y. Yokoyama: MIS 5e sea-level proxies around Japan
Figure 9. Sea-level elevation proxies along the Japan Sea (Kansai
and Chugoku). Sea-level indicators (circles) with elevation range
indicated by color (see legend).
Koike and Machida, 2001) have been studied but were re-
ported without elevation values.
4.7 Kyushu and Yamaguchi Figure 10. Sea-level elevation proxies in Kyushu and Yamaguchi.
Sea-level indicators (circles) with elevation range indicated by color
Numerous sea-level proxies have been identified in Kyushu (see legend). Reference cities are indicated by stars.
and Yamaguchi, with most elevations identified with low to
negative values (Fig. 10). Kyushu is a source of several key
indicator tephra layers, and many sea-level proxies are well At least five sea-level proxies have been identified
constrained by the Ata and Aso-4 layers. This region can be on the southern coast of Kyushu. Terraces associated
examined in five subsections: Yamaguchi, northern Kyushu, with Kagoshima Bay have higher elevations (15.6 ± 0.4 m,
eastern Kyushu, southern Kyushu, and western Kyushu. A 52.3 ± 0.4 m) than those on the coast (6.1 ± 0.4 to
substantial number of sea-level proxies from around Kyushu −39 ± 0.4 m). Elevations of proxies on the islands directly
were collected by Shimoyama et al. (1999), using mollus- south of Kyushu are recorded at 51.5 ± 0.4 m (Yakushima)
can fossil assemblages from both the intertidal and subtidal and 120 ± 0.4 m (Tanegashima) and are substantially higher
ranges to determine the marine top height. at Tanegashima. Terraces in southern Kyushu are all well
Proxies found along the inland sea in Yamaguchi have el- constrained between Ata and Aso-3 tephra layers (Shi-
evations between 16.10 ± 9.20–20.70 ± 17.10 m and are age moyama et al., 1999). On the western side of Kyushu, sea-
constrained by both the Aso-4 tephra layer and stratigraphic level indicators in proximity to the Ariake and Yatsushiro
correlation (Koike and Machida, 2001). In the northern seas have lower elevations (−63.1 ± 0.4 to 12.7 ± 0.4 m).
section of Kyushu, terrace elevations between −7.5 ± 0.40 Proxies on Amakusa Island are comparatively higher
and −8.1 ± 0.4 m are reported, constrained by Ata tephra, (27.71 ± 15.54–45 ± 9 m) and again lower near Omura Bay
in addition to the terrace at 11.80 ± 2.40 m constrained (7 ± 1.4, 13.33 ± 12.66 m). Ages are mainly constrained be-
by stratigraphy. On the eastern edge of Kyushu, sea-level tween Ata and Aso-3 tephras, though some locations utilize
proxies near Oita generally range between 20.70 ± 0.40– Aso-4 or stratigraphic correlation (Shimoyama et al., 1999;
50 ± 10 m in elevation, in addition to one submerged Kamada and Niino, 1955; Koike and Machida, 2001).
proxy (−85.50 ± 0.40 m). Until Nobeoka, terrace eleva-
tions are between −29.90 ± 0.40 and 18.75 ± 6.25 m. Sea- 4.8 The Ryukyu Islands
level proxies south of this appear as both a high-elevation
set (74 ± 14.8–107 ± 0.4 m) and lower elevations (32 ± 6.4, Sea-level proxies in the Ryukyu Islands are here categorized
33.33 ± 16.66 m). Ages for eastern Kyushu are typically cor- in three groups: north of Okinawa, Okinawa and the Daito Is-
related between Aso-3 and Ata tephra layers, in addition to lands, and west of Okinawa (Fig. 11). Most sea-level indica-
the Aso-4 layer and general stratigraphic correlation (Shi- tors found in the Ryukyu Islands are coral terraces, allowing
moyama, et al., 1999; Chida, 1974; Koike and Machida, for direct U–Th dating of terraces and 14 C dating of lower
2001; Nagaoka et al., 2010). terraces to constrain higher MIS highstand-correlated ter-
Earth Syst. Sci. Data, 13, 1477–1497, 2021 https://doi.org/10.5194/essd-13-1477-2021E. Tam and Y. Yokoyama: MIS 5e sea-level proxies around Japan 1489
ages and MIS stages are correlated from chronostratigraphi-
cal relationships. However, due to the abundant distribution
and detailed analysis of tephra in Japan, these techniques and
results are considered reliable.
Details about elevation measurement styles were reported
infrequently and inconsistently across the studies analyzed.
Though some older studies often reported use of devices such
as a Paulin altimeter MT-2 (e.g., Yonekura, 1968), others ei-
ther did not report or did not clearly articulate measurement
styles. As a result, many studies have larger MoEs assigned
to sea-level proxy elevations. Sea-level proxy type assign-
ments are similarly infrequently delineated, with some stud-
ies listing sea-level proxies as marine terraces despite com-
position details (such as coral reef terraces). Others provided
little to no characteristics of the marine terraces themselves.
As explored in Sect. 3, these details can change the interpre-
Figure 11. Sea-level elevation proxies in the Ryukyu Islands. Sea-
level indicators (circles) with elevation range indicated by color (see
tation of sea-level extent. Future studies could benefit from
legend). more rigorous descriptions of elevation measurement styles,
sea-level proxy compositions, and details on sea-level proxy
type assignments.
race platform series. Elevations of MIS 5e-correlated terraces Data entered into the WALIS database were reported
north of Okinawa range from 43.95 ± 46.79–66.58 ± 103 m, with relative sea level (RSL) and age quality ratings on
aside from Kikai Island at 245 ± 5 m. Direct dates of cor- a 0–5 scale rating, with 5 representing the highest value.
responding terraces from U–Th were taken at Kikai Island Age quality ratings were assigned on age reliability, cate-
(122.1 ± 3.8 ka) and Tokunoshima (125 ± 10 ka). 14 C dates gorizing studies with direct dating on sea-level proxies as
on Takara Island (2.3 ± 0.15–3.3 ± 0.13 ka) were used to cor- most reliable (5), followed by studies interpreting sea-level
relate MIS 5e terrace dates (Koba et al., 1979; Ikeda, 1977; proxies using directly dated or constrained chronohorizons
Inagaki and Omura, 2006; Koike and Machida, 2001). such as tephra (4), studies utilizing regional stratigraphic re-
On the Okinawa-adjacent islands, elevations for sea-level lationships without numerical age dating to interpret sea-
proxies ranged between 23.33 ± 14.66–55.75 ± 21.15 m. level proxy ages (3), and studies using poorly described
Ages were constrained through stratigraphic correlation, and chronohorizons (2). Sea-level proxies reported in compila-
at Aguni Island younger terraces were dated at 33.7 ka by 14 C tion databases but deemed unverifiable due to missing source
dating. On Minami and Kita Daito, elevations were measured references were assigned the lowest ratings (0–1) but were
at 12.45 ± 2.49 and 10 ± 2 m, and U–Th dates were averaged omitted from this database.
at 123 ± 5 and 123 ± 6 ka respectively (Omura et al., 1991; RSL quality ratings were assigned using the same 1–5
Koike and Machida, 2001; Ota and Omura, 1992). West of scale rating. Studies were assessed on their description of
Okinawa, proxy elevations fell into two groups: between sea-level proxies, including details about composition (in-
11 ± 2.2–25 ± 15 m (Miyako, Yonaguni, Minna, and Tarama cluding sediment types and identified coral/mollusc species)
islands) and 41 ± 8.2–60.17 ± 46 m (islands near Ishigaki and sea-level proxy type assignment (such as identification
Island). U–Th ages were calculated from coral limestones of the inner margin of a marine terraces). Studies were as-
at Hateruma Island (128 ± 7 ka), and ages were otherwise signed between 2–5, scaling between vague (2) and highly
constrained through stratigraphic correlation (Omura et al., detailed descriptions (5). Uncertainties about sea-level proxy
1994; Ota and Omura, 1992; Koike and Machida, 2001). elevations such as rounding of elevation values of sea-level
proxies were assigned low ratings (2). Sea-level proxies with
elevation MoEs over 60 % of the original elevation were also
5 Further details on sea-level proxies around Japan
assigned low ratings (1). For proxies with large MoEs due to
averaging, results are likely less representative of the mea-
5.1 Data quality
surement accuracy but rather indicative of the large range
The data quality from studies examining MIS 5e sea-level of sea-level proxy elevations due to regional tectonic uplift.
proxies in and around Japan is considered scientifically reli- Specific regions can have large changes in overall area, as
able. Age constraints provided for studies are generally well can been seen on the Boso Peninsula (Fig. 6), Sado Island
supported, reporting the dating technique or rationale for age (Fig. 7), and eastern Shikoku (Fig. 8). Entries with the low-
assignments for specific sea-level proxies. As mentioned in est rating (0) were not included in the database, representing
Sect. 2, use of chronohorizons can introduce larger age con- data from studies that could not be located.
straint MoEs and can be considered suboptimal since terrace
https://doi.org/10.5194/essd-13-1477-2021 Earth Syst. Sci. Data, 13, 1477–1497, 2021You can also read