Spontaneous neural synchrony links intrinsic spinal sensory and motor networks during unconsciousness
←
→
Page content transcription
If your browser does not render page correctly, please read the page content below
RESEARCH ADVANCE

                                       Spontaneous neural synchrony links
                                       intrinsic spinal sensory and motor
                                       networks during unconsciousness
                                       Jacob Graves McPherson1,2,3,4*, Maria F Bandres1,5
                                       1
                                        Program in Physical Therapy, Washington University School of Medicine, St. Louis,
                                       United States; 2Department of Anesthesiology, Washington University School of
                                       Medicine, St. Louis, United States; 3Washington University Pain Center, Washington
                                       University School of Medicine, St. Louis, United States; 4Program in Neurosciences,
                                       Washington University School of Medicine, St. Louis, United States; 5Department of
                                       Biomedical Engineering, Washington University School of Medicine, St. Louis,
                                       United States

                                       Abstract Non-random functional connectivity during unconsciousness is a defining feature of
                                       supraspinal networks. However, its generalizability to intrinsic spinal networks remains incompletely
                                       understood. Previously, Barry et al., 2014 used fMRI to reveal bilateral resting state functional
                                       connectivity within sensory-dominant and, separately, motor-dominant regions of the spinal cord.
                                       Here, we record spike trains from large populations of spinal interneurons in vivo in rats and
                                       demonstrate that spontaneous functional connectivity also links sensory- and motor-dominant
                                       regions during unconsciousness. The spatiotemporal patterns of connectivity could not be
                                       explained by latent afferent activity or by populations of interconnected neurons spiking randomly.
                                       We also document connection latencies compatible with mono- and disynaptic interactions and
                                       putative excitatory and inhibitory connections. The observed activity is consistent with the
                                       hypothesis that salient, experience-dependent patterns of neural transmission introduced during
*For correspondence:                   behavior or by injury/disease are reactivated during unconsciousness. Such a spinal replay
mcpherson.jacob@wustl.edu              mechanism could shape circuit-level connectivity and ultimately behavior.

Competing interests: The
authors declare that no
competing interests exist.
                                       Introduction
Funding: See page 21                   Synchronous neural activity across functionally and spatially distinct brain structures, that is, func-
Received: 15 January 2021              tional connectivity, is a hallmark of sensorimotor integration, cognition, and behavior during periods
Accepted: 26 May 2021                  of attentive wakefulness. Recent elucidation of brain networks intrinsically active during unconscious-
Published: 27 May 2021                 ness and inattentive wakefulness has led to a substantially more nuanced view of brain
                                       function (Demertzi et al., 2019; Fox et al., 2005; Greicius et al., 2003; Mashour and Hudetz,
Reviewing editor: Jeffrey C
                                       2018; Raichle et al., 2001; Steriade et al., 1993; Wenzel et al., 2019). Unconscious network activ-
Smith, National Institute of
Neurological Disorders and
                                       ity spans multiple spatiotemporal scales and has known functions ranging from circuit-level synaptic
Stroke, United States                  stabilization (Puentes-Mestril and Aton, 2017; Tsodyks et al., 1999; Wei et al., 2016) to mainte-
                                       nance of ongoing physiological processes (Sanchez-Vives et al., 2017). Although the finding of
   Copyright McPherson and
                                       spontaneous, non-random network activity during unconsciousness appears to be robust across dif-
Bandres. This article is distributed
                                       ferent functional regions of the brain, it has yet to be unequivocally confirmed whether this phenom-
under the terms of the Creative
Commons Attribution License,           enon is a conserved feature of complex neural systems that generalizes to the spinal cord.
which permits unrestricted use             Patterns of resting state functional connectivity in the spinal cord have only been preliminarily
and redistribution provided that       characterized (Barry et al., 2014; Chen et al., 2015; Conrad et al., 2018; Eippert et al., 2017;
the original author and source are     Kong et al., 2014; Tl et al., 2019). The most reliable findings to date have been correlations
credited.                              between spontaneous BOLD signals in the left and right dorsal horns, and, separately, the left and

McPherson and Bandres. eLife 2021;10:e66308. DOI: https://doi.org/10.7554/eLife.66308                                                  1 of 24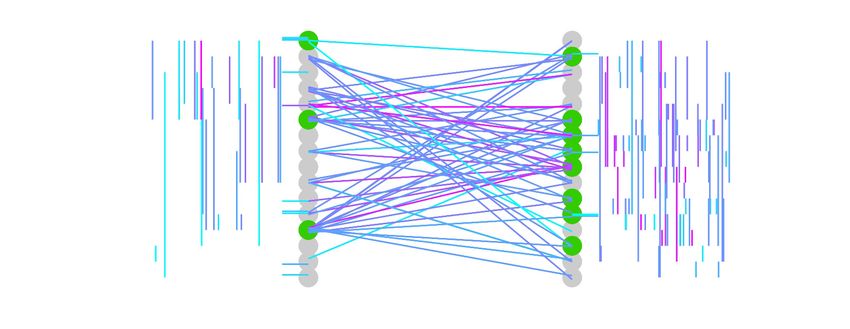
Research advance                                                                                                   Neuroscience

                                  right ventral horns (VHs) (Barry et al., 2014; Eippert et al., 2017; Kong et al., 2014; Tl et al.,
                                  2019). Spontaneous connectivity between the dorsal horn and VH, between the intermediate
                                  gray (IG) and the VH, and within the VH itself has yet to be reliably delineated.
                                     Other gaps also exist. For example, it is unknown whether network topologies evinced by spinal
                                  BOLD signals mirror those drawn from spike trains of individual neurons. Indeed, BOLD signals are
                                  only indirectly linked to spiking activity (Logothetis et al., 2001; Murayama et al., 2010;
                                  Vakorin et al., 2007), which is compounded by the relatively coarse spatiotemporal resolution of
                                  fMRI in the spinal cord. It is also not readily apparent whether structured activity at the single-unit
                                  level actually persists in spinal networks during unconsciousness in the absence of evoked neural
                                  transmission. The most relevant evidence, which suggests that aggregate multi-unit and local field
                                  potential activity in the dorsal horn is broadly correlated with dorsal horn BOLD fluctuations, was
                                  made during mechanical probing of the dermatome (Tl et al., 2019).
                                     The potential function(s) of resting state intraspinal connectivity are likewise unknown. An intrigu-
                                  ing possibility is that it plays a role in adaptive or maladaptive neural plasticity through a form of
                                  reactivation and synaptic stabilization during unconsciousness. This hypothesis is drawn from the
                                  function of supraspinal network activity during sleep (Abel et al., 2013; Puentes-Mestril and Aton,
                                  2017; Wei et al., 2016) and is supported by the finding of altered patterns of BOLD-based intraspi-
                                  nal functional connectivity in conditions associated with maladaptive neural plasticity in spinal net-
                                  works (Chen et al., 2015; Conrad et al., 2018). To have a direct role in shaping neural plasticity,
                                  however, a necessary substrate would be the tandem presence of synchronous discharge amongst
                                  populations of individual units spanning multiple spatial and functional regions.
                                     Given the critical role played by the spinal cord in sensorimotor integration (broadly) and reflexes
                                  (specifically), we reasoned that spontaneous functional connectivity between neurons in sensory-
                                  dominant and motor-dominant regions of the gray matter would be a precondition for functional
                                  network activity during unconsciousness, regardless of its function. And for the reasons noted above,
                                  such a finding would have important implications for both the physiological and pathophysiological
                                  states. Several fundamental questions remain unresolved, however. Here, we address three. First, is
                                  neuron-level functional connectivity evident in regions of the spinal gray matter not traditionally
                                  associated with primary afferent inflow? Second, is spontaneous functional connectivity evident
                                  between sensory and motor regions of the gray matter? And third, does the proportion of spontane-
                                  ously active neurons exhibiting correlated discharge, as well as their topology, depart from that
                                  which would be expected amongst an interconnected population of statistically similar neurons firing
                                  uncooperatively (i.e., randomly)?
                                     We addressed these questions in vivo in rats, recording large populations of single units through-
                                  out the dorsoventral extent of the lumbar enlargement. We find that robust spontaneous neural
                                  activity is prevalent throughout the gray matter during unconsciousness and that neurons in sensory
                                  and motor regions exhibit significant, non-random correlations in their spatiotemporal discharge
                                  patterns. We also find a substantial portion of connection latencies consistent with mono- and disy-
                                  naptic interactions, offering clues to a possible mechanism by which intrinsic network activity could
                                  directly shape synaptic plasticity.

                                  Materials and methods
                                  All experiments were approved by the Institutional Animal Care and Usage Committees at Florida
                                  International University and Washington University in St. Louis.

                                  Surgical procedures, electrode implantation
                                  Experiments were performed in adult male Sprague–Dawley rats (N = 24; weight), divided across
                                  two cohorts. Fifteen animals received urethane anesthesia (1.2 g/kg i.p.). The remaining nine animals
                                  received inhaled isoflurane anesthesia (2–4% in O2). Heart rate, respiration rate, body temperature,
                                  and SpO2 were monitored continuously during the experiments (Kent Scientific, Inc), and tempera-
                                  ture was regulated via controlled heating pads.

McPherson and Bandres. eLife 2021;10:e66308. DOI: https://doi.org/10.7554/eLife.66308                                              2 of 24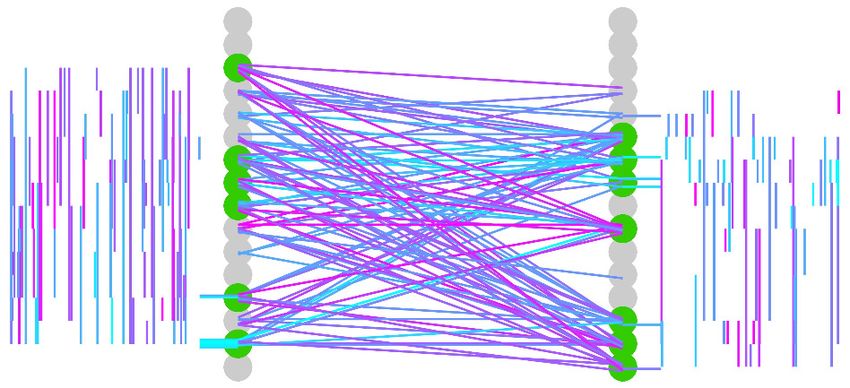
Research advance Neuroscience
In a terminal, aseptic procedure, a skin incision was made over the dorsal surface of the T1–S1
vertebrae and the exposed subcutaneous tissue and musculature were retracted. The T13–L3 verte-
brae were cleaned of musculotendonous attachments using a microcurette and the vertebral laminae
were removed to expose spinal segments L4–6. The rat and surgical field were then transferred to
an anti-vibration air table (Kinetic Systems, Inc) enclosed in a dedicated Faraday cage.
Clamps were secured to the vertebrae rostral and caudal to the laminectomy site, and the rat’s
abdomen was elevated such that respiration cycles did not result in upward or downward movement
of the chest cavity or spinal cord. Under a surgical microscope (Leica Microsystems, Inc), the
exposed spinal meninges were incised rostrocaudally and reflected. The spinal cord was then cov-
ered in homeothermic physiological ringer solution.
A custom four-axis motorized micromanipulator with submicron resolution (Siskiyou Corp.) was
then coarsely centered over the laminectomy site. A silicon microelectrode array (NeuroNexus, Inc)
custom electrodeposited with activated platinum-iridium electrode contacts (Platinum Group Coat-
ings, Inc) was mated via Omnetics nano connectors to a Ripple Nano2+ Stim headstage (Ripple
Neuro, Inc). The microelectrode array contained two shanks, each with 16 individual electrode con-
tacts spaced uniformly at 100 mm intervals (Figure 1a). Electrode impedance ranged from ~1 to –4
kW per contact. The headstage was then securely fastened to the micromanipulator for implantation.
During implantation, the data acquisition system was configured for online visualization of multi-unit
and spiking activity from all 32 electrodes. Neural waveforms for specific electrode channels were
also patched into an audio monitor (A-M Systems, Inc) for additional real-time feedback.
The electrode implantation site targeted the tibial branch of the sciatic nerve, with particular
emphasis on sensitivity to receptive fields on the glabrous skin of the plantar surface of the ipsilateral
hindpaw toes. The implantation site corresponded closely to the L5 spinal nerve dorsal root entry
zone in all animals. Initial implantation site verification was performed by mechanically probing the
L5 dermatome, specifically on the plantar aspect of the ipsilateral hindpaw, with the bottom-most
electrodes of the microelectrode array being in contact with the dorsal roots at their entry zone. If
clearly correlated multi-unit neural activity was evident, the probe was slowly advanced ventrally in
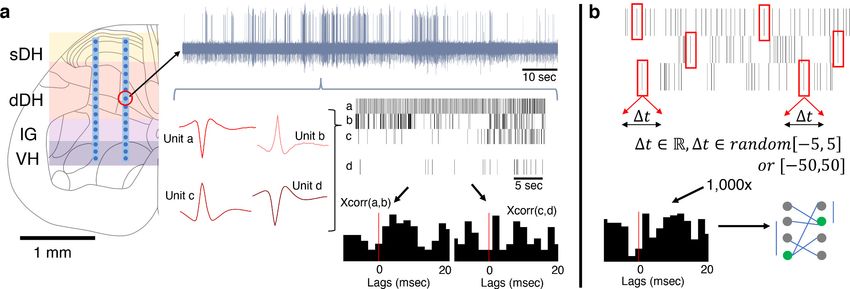
Figure 1. Experimental setup and design. (a) Dual-shank microelectrode arrays with 32 independent recording contacts were implanted into the spinal
cord at the L5 dorsal root entry zone. Electrodes spanned the superficial dorsal horn (sDH), deep dorsal horn (dDH), intermediate gray matter (IG), and
the ventral horn (VH). Multi-unit neural activity was recorded from each electrode (e.g., upper gray trace) and discriminated offline into spike trains of
individual units (red single-unit waveforms and spike train raster plots depict four units found on a single channel). Temporal synchrony between
spontaneously co-active units was then analyzed via correlation-based approaches (cross-correlation ‘xcorr’ histograms below rasters, vertical red lines
illustrate the 0 ms lag point). (b) Illustration of procedure for generating the synthetic dataset. Each spike, from every identified neuron in every trial,
was randomly jittered by [ 5:5] ms or, separately, [ 50:50] ms. The jittered data were then reconstructed, forming synthetic trials containing neurons
with firing properties that were statistically similar to the observed data. This process was then repeated over 1000 to generate a large synthetic
dataset from which to sample. Spatiotemporal correlation analyses then proceeded on this synthetic dataset to benchmark the empirically observed
data.
McPherson and Bandres. eLife 2021;10:e66308. DOI: https://doi.org/10.7554/eLife.66308 3 of 24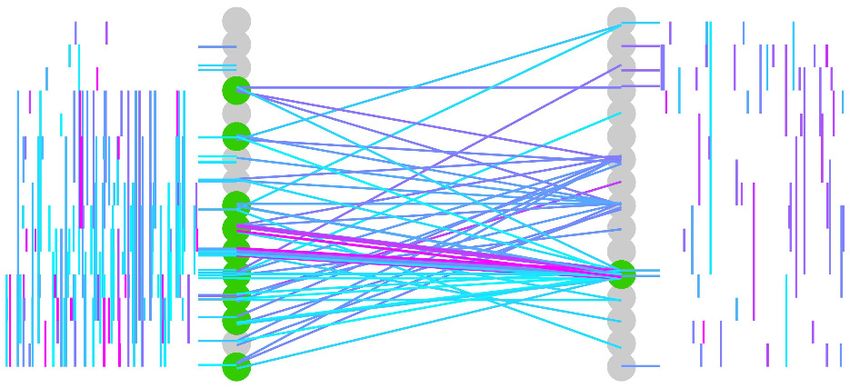
Research advance                                                                                                    Neuroscience

                                  25 mm increments until the deepest row of electrodes was ~200 mm deep to the dorsal surface of
                                  the spinal cord. The L5 dermatome was again probed to verify alignment between neural activity at
                                  the implantation site and the dermatome. If correlated multi-unit activity was again observed, the
                                  electrode continued to be advanced ventrally in 25 mm increments until the ventral-most row of elec-
                                  trode contacts was 1600–1800 mm deep to the dorsal surface (and correspondingly, the dorsal-most
                                  row of electrode contacts, i.e., the most superficial, was 100–200 mm deep to the dorsal surface of
                                  the spinal cord).
                                     In cases where multi-unit dorsal root activity was not clearly correlated with the desired hindpaw
                                  receptive field, but rather was correlated with a different receptive field (e.g., on the hairy skin of
                                  the leg), the electrode was repositioned prior to implantation. In cases where no discernible correla-
                                  tion could be observed between a receptive field and dorsal root activity, yet the electrode was
                                  positioned over the L5 dorsal root entry zone, the electrode was advanced in 25 mm increments to a
                                  depth of 200 mm ventrally into the spinal cord and the receptive field mapping procedures was per-
                                  formed again. If appropriate activity was observed, the electrode was tracked fully; if not, it was
                                  removed and a new track was made.
                                     In all cases, electrodes were advanced slowly to the target depth to avoid compression of the spi-
                                  nal cord and minimize intraspinal trauma from shear. After every ~100–200 mm of penetration, elec-
                                  trode advancement was paused momentarily. Penetration was resumed when neural activity
                                  (evinced by multi-unit and spiking data from implanted channels) stabilized.
                                     In two animals, the sciatic nerve of the ipsilateral hindlimb was exposed proximal to its bifurcation
                                  into the tibial and peroneal nerves and a silver hook electrode (A-M Systems, Inc) placed around the
                                  nerve to record electroneurographic (ENG) activity. Upon completion of surgical procedures and
                                  data collection, all animals were humanely euthanized in accordance with AVMA guidelines via over-
                                  dose of sodium pentobarbital (i.p. injection of Fatal Plus solution).

                                  Experimental procedure
                                  We established resting motor threshold for each animal prior to recording spontaneous neural trans-
                                  mission. We delivered single pulses of charge-balanced current (cathode leading, 200 ms/phase, 0 s
                                  inter-phase interval) to electrodes located in the VH, with current intensity increasing in increments
                                  of 5 mA until a muscle twitch was detected in the L5 myotome (toe twitch on ipsilateral hindpaw).
                                  Current intensity was then reduced in 1 mA steps until the twitch was undetectable. Subsequently,
                                  we increased current intensity again in 1 mA increments until a twitch was recovered. The lowest cur-
                                  rent at which a twitch was detected, across all electrodes, was considered to be resting motor
                                  threshold.
                                      We recorded 10–20 trials of spontaneous intraspinal neural transmission per animal. Each trial
                                  lasted for ~2–5 min. Raw, broadband neural activity was sampled continuously from the microelec-
                                  trode array at 30 kHz. Electrical line noise and harmonics were removed via hardware filters prior to
                                  digitization. During data acquisition epochs, data from all 32 electrode channels was streamed in
                                  real time to a 600 flat screen monitor. These data were high-pass filtered at 750 Hz to reveal multi-
                                  unit neural activity (e.g., Figure 1a). On channels in which single-unit activity was readily observable,
                                  dual-window time-amplitude discriminators were used to discriminate and visualize real-time single-
                                  unit spiking activity. Prior to each trial, the dermatome was mechanically probed to ensure ongoing
                                  consistency between electrode placement and receptive field location and to assess qualitatively the
                                  overall degree of neural excitability. The latter assessment in particular was used in conjunction with
                                  vital and other physiological signs to control depth of anesthesia and ensure that neural excitability
                                  did not become progressively depressed during the data acquisition session.
                                      For sciatic nerve recordings, we first collected trials of spontaneous, baseline ENG (~1–5 min per
                                  trial). We then induced sensory transmission in the nerve by mechanically stimulating the L4, L5, and
                                  L6 dermatomes. Specifically, we recorded ENG during periods of innocuous cutaneous stimulation
                                  of the glabrous and hairy skin and during periods of proprioceptive stimulation. Proprioceptive stim-
                                  uli included ankle plantarflexion and dorsiflexion, abduction and adduction of the toes, and holding
                                  joints in a flexed or extended position for a prolonged period of time. Sensory stimuli lasted ~30 s
                                  each, with 30 s to 1 min elapsing between stimuli. Subsequently, we blocked transmission in the
                                  nerve via epineurial injection of lidocaine (20 mL, 2%) (Gokin et al., 2001; Kau et al., 2006;
                                  Thalhammer et al., 1995) and repeated the sensory transmission experiments described above. This
                                  pharmacological nerve block is a form of deafferentation that avoids the confound of ectopic

McPherson and Bandres. eLife 2021;10:e66308. DOI: https://doi.org/10.7554/eLife.66308                                               4 of 24
Research advance Neuroscience
discharge sometimes observed with mechanical sectioning of the nerve. ENG was sampled at 30
kHz (Ripple Neuro, Inc), and filtered offline to remove electrical noise (60, 120, and 180 Hz). We
applied a broadband filter to the data (40 Hz to 15 kHz) to enable detection of compound action
potentials/multi-unit activity as well as any potential single-unit action potentials.
Discrimination of units, correlation and functional connectivity analyses
Single-unit neural activity was discriminated offline using the unsupervised, wavelet-based clustering
approach ‘wave_clus’ (parameters: bandpass filter: 1 Hz to 15 kHz; minimum detection threshold: 4
standard deviations [SD] from mean; maximum detection threshold: 25 SD; detection thresholds on
both positive and negative deviations; filter order for detection: 4; filter order for sorting: 2)
(Quiroga et al., 2004). The veracity of discriminated units was verified manually. Spurious and/or
duplicative units were identified and eliminated, with particular focus on units discriminated on the
same or adjacent electrodes. Exclusion criteria were both quantitative (e.g., predominance of ISI < 2
ms) and qualitative (e.g., non-physiological shape, inappropriate action potential duration). Func-
tional connectivity analyses then proceeded as follows on a per-trial basis, where pairs of units found
to exhibit statistically significant temporal synchrony were deemed ‘functionally connected.’
First, we computed the cross-correlation of all unique pairs of admissible units from the 32-chan-
nel microelectrode array, effectively analogous to computing peri-spike time histograms for each
pair (Figure 1a). These computations were performed without regard to the anatomical/spatial loca-
tion of the units and without defining each units of a pair as either pre- or post-synaptic. Connection
latency was taken to be the time to peak correlation strength. Connection polarity (excitatory or
inhibitory) was inferred using the normalized cross-correlation approach (Pastore et al., 2018;
Shao and Chen, 1987).
We then quantified the strength of correlation by adapting an approach originally developed to
be compatible with spike trains containing a relatively small numbers of spikes (Gerstein and Aer-
tsen, 1985; Shao and Tsau, 1996). This calculation led to a correlation coefficient analogous to the
Pearson correlation coefficient common in linear regression. If the number of spikes per train is suffi-
ciently low (N ~50), it is possible to use this approach to compute p-values via Fisher’s exact
test (Shao and Tsau, 1996). However, our surprisingly vigorous spontaneous neural transmission
(see Results), coupled with the length of each trial, rendered Fisher’s exact test largely intractable.
As the number of spikes in a train increases, however, the distribution of spike times approximates
the chi-square distribution and enables that statistic and associated degrees of freedom be used for
computation of p-values associated with each correlation coefficient.
Given the large number of neurons discriminated per trial (~50–70 on average), and thus the large
number of unit-pair combinations in which we computed correlation strength, careful attention was
paid to multiple comparison corrections to minimize the prevalence of falsely concluding that a pair
of units was significantly correlated. Controlling the family-wise error rate by applying Bonferroni
correction to each test, as is often used for post-hoc multiple comparisons corrections in statistical
inference, is inappropriate for datasets such as ours with trials containing extremely large numbers
of non-independent comparisons (Shao and Tsau, 1996). Therefore, we instead used the Benjamini–
Hochberg procedure to control the false discovery rate of our data on a per-trial basis. This
approach ensures that the proportion of false-positive findings amongst all findings deemed to be
significant is no more than specified level (in our case, 5%). The Benjamini–Hochberg procedure is
applied at the trial level, and the specific p-value deemed to indicate statistical significance is a func-
tion of the data from which the statistics are being inferred. Thus, the significant p-value may be rela-
tively more or less across different trials. Controlling the false discovery rate is a validated method
for multiple comparisons corrections with datasets containing large numbers of comparisons, and it
is particularly effective for situations in which certain elements being compared in a trial are likely to
be more or less correlated than others due to factors such as anatomical connectivity (e.g., voxel-
wise comparisons of fMRI data, where distance between voxels may influence correlation strength
based on the anatomy/structure-function relationships of the sampled neural
structures) (Lindquist and Mejia, 2015).
To characterize topological aspects of functional connectivity, we classified the significantly corre-
lated unit pairs based on their gross anatomical locations as well as the electrode from which their
correlated units were discriminated. Gross anatomical locations included the superficial dorsal horn
(sDH), ranging from the dorsal surface of the spinal cord to ~400 mm in depth and corresponding
McPherson and Bandres. eLife 2021;10:e66308. DOI: https://doi.org/10.7554/eLife.66308 5 of 24Research advance Neuroscience
approximately to Rexed’s Laminae I–III; the deep dorsal horn (dDH), ranging from ~500 to 1000 mm
and corresponding approximately to Rexed’s Laminae III/IV–VI; the IG, ranging from ~1100 to 1300
mm, corresponding to Rexed’s Laminae VII–VIII; and the VH, ranging from ~1400 to 1600+ mm and
including Rexed’s Laminae VIII–IX. We define the ‘most connected nodes’ for a given trial as the
electrodes containing a significantly greater number of significant unit-pair connections than the
mean number of connections across all electrodes in the microelectrode array.
Synthetic data
We generated large synthetic datasets that matched the broad statistical properties of our observed
data to use as an additional means of comparison and analyses (Figure 1b). The details of our
approach to creating this synthetic dataset have been described previously (Amarasingham et al.,
2012; Fujisawa et al., 2008). Briefly, however, the procedure is as follows. After performing spike
sorting on each electrode channel for a given trial, we arrived at N spike trains (where N corresponds
to the number of units discriminated during the spike sorting process for that trial). We then ran-
domly selected a single number from one of two uniform distributions (see next paragraph) and
added that value to the first spike time for, say, Unit 1. For example, if the first spike of Unit 1
occurred exactly 1 s after recording commenced, and we randomly drew a value of +3 ms, we would
restate the first spike time for Unit 1 as occurring at 1.003 s after recording began. We then ran-
domly drew another number from the same distribution (numbers were replaced after each draw)
and added that value to the second spike time of Unit 1. This process continued for all spike times
for Unit 1 during the trial. We refer to this process as jittering. The same process was subsequently
performed for all units discriminated in that trial, resulting in N jittered spike trains. After jittering all
spike times for all units for a single trial, we arrived at a ‘synthetic’ trial. We then re-ran the correla-
tion analyses on the jittered spike trains in the synthetic trial. By repeating this process 1000 for
each unit, trial, and rat, we developed a large synthetic dataset from which statistical confidence
intervals could be derived and hypothesis testing could be performed.
We created two synthetic datasets, each designed to test a different aspect of connectivity. The
first synthetic dataset was designed to test short-latency connectivity, as would be observed with
mono-, di-, and minimally polysynaptic connections. For this dataset, we jittered the real data using
a distribution of ±[0, 1, 2, 3, 4, or 5] ms. These values simulate perturbations to short-latency interac-
tions while preserving each unit’s firing rate at a broad timescale. The second synthetic dataset was
designed to test latencies compatible with complex, highly polysynaptic interactions, and used a jit-
tering distribution of ±50 ms (also with 1 ms granularity; i.e., draw a random number from [ 50,–49,
48, . . . 48, 49, 50] ms). The overall number of spikes per unit was not changed in either jittering
procedure so as to avoid confounds in the interpretation of our correlation results.
Statistical methods
Statistical inference beyond that required for the determination of significant temporal connections
between pairs of co-active units (described above) is largely based on analysis of variance (ANOVA)
techniques for both the urethane and isoflurane cohorts. The normality of each dataset was con-
firmed prior to performing ANOVAs. For within-cohort comparisons, a main effect of anatomical
region on the mean number of units, proportion of significant connections, or proportion of most
connected nodes (respectively) was inferred using one-way repeated measures ANOVA formula-
tions. Assessment of the potential significance of anatomical region (within-subjects factor), anes-
thetic (between-subjects factor), and their interaction on the proportion of excitatory and inhibitory
connections was conducted using a two-way repeated measures ANOVA design. If data violated the
assumption of sphericity, Greenhouse–Geisser correction was applied. The family-wise error rate of
post-hoc testing was controlled through Bonferroni correction for all comparisons. Student’s t-tests
were used to determine differences between individual (non-repeated) factors. This included com-
parisons of the proportion of within-region vs. between-region connections for a given cohort, com-
parisons of the mean number of units discriminated per animal between the cohorts, and excitatory
vs. inhibitory latencies for a given cohort. For both ANOVA-based and t-test-based analyses, com-
parisons were considered significant at the a = 0.05 level. Data are presented in text as
mean ± standard error unless otherwise noted. All statistical tests were performed in the IBM SPSS
environment.
McPherson and Bandres. eLife 2021;10:e66308. DOI: https://doi.org/10.7554/eLife.66308 6 of 24Research advance Neuroscience
Results
Vigorous spontaneous activity in single units remains evident
throughout sensory and motor regions of the spinal gray matter during
unconsciousness
We focus on urethane anesthetized animals because urethane potently suppresses spontaneous dis-
charge in the dorsal roots (minimizing undue afferent activity) while only modestly impacting resting
membrane potential, GABA-ergic, and excitatory amino acid transmission (Daló and Hackman,
2013; Hara and Harris, 2002). Thus, urethane enables characterization of the spinal cord in a state
more representative of physiological activity than many other anesthetic agents.
First, we quantified the gross anatomical distribution of spontaneously active units. In total, we
recorded from approximately 860 well-isolated units across 13 urethane-anesthetized rats, averaging
66 ± 8 units per trial (e.g., Figure 1a). This per-animal average number of units corresponds to
approximately two units discriminated per electrode across the array, with a range from 0 to ~5 units
per electrode. These findings are consistent with the initial validation data for the wave_clus pack-
age, which was developed with three neurons per electrode as the benchmark (Quiroga et al.,
2004). They are also consistent with subsequent studies using wave_clus with similar electrodes to
ours, which show that 1–4 units are typically discriminated and that 5–6 units can be discriminated
effectively without missed clusters or false positives (Pedreira et al., 2012; Rey et al., 2015).
A representative raster plot from one trial is shown in Figure 2a. Spontaneously active units can
be observed throughout the dorsoventral extent of the sampled region. Broadly distributed, robust
discharge was a consistent feature of all animals. Across the urethane cohort, the mean number of
spontaneously active units discriminated per gross anatomical region per trial was: sDH: 11 ± 3;
dDH: 25 ± 3; IG: 16 ± 2; VH: 14 ± 2 (Figure 2b). We found a significant main effect of region on con-
nection number (F = 6.368, p=0.001), which was driven by a significantly greater number of units in
the dDH than the sDH or VH. No other regions differed from one another (Supplementary file 1,
tab 1a).
a Lateral electrode shank Medial electrode shank b
100 100
Avg. number of units per animal
200 200
300 300
400 400
m]
m]
500 500
600 600
Approx. electrode depth [
Approx. electrode depth [
700 700 *
800 800
900 900
1000 1000
1100 1100
1200
1300
1200
1300
*
1400 1400
1500 1500
1600 1600
0 30 60 0 30 60
Time [ s ] Time [ s ]
Figure 2. Spontaneous neural transmission is broadly evident across all spatial and functional regions of the spinal gray matter. (a) Raster plot of
spontaneously active neurons. Each row of hatches represents a discrete neuron. Inset depicts representative spike waveforms discriminated from a
single electrode. X-axes (time) are synchronized across the two subplots. (b) Distribution of spontaneously active units per gross anatomical region
across animals in the urethane cohort (m ± sem; N = 13 animals). The deep dorsal horn contained significantly more spontaneously active units on
average than the superficial dorsal horn or ventral horn, driving an overall main effect of region (p=0.001).
McPherson and Bandres. eLife 2021;10:e66308. DOI: https://doi.org/10.7554/eLife.66308 7 of 24Research advance Neuroscience
Spontaneous functional connectivity remains evident in intrinsic spinal
networks during unconsciousness, enabling persistent communication
between functionally and spatially diverse regions of the spinal gray
matter
Next, we asked whether pairs of spontaneously active units exhibited correlated discharge patterns.
Statistical matrices of unit-pair correlations for a 5 min epoch with a high degree of connectivity can
be seen in Figure 3. In Figure 3a, each pixel’s color represents the magnitude of correlation
between the two units defined by an x–y pair; connection polarity is not indicated (although see
Figure 4c). Figure 3b indicates the p-values of the correlations. Across all animals and epochs in the
urethane cohort, 4.2 ± 0.8% of unit pairs exhibited significantly correlated temporal discharge
patterns.
We then sought to determine the gross anatomical organization of synchronous unit pairs. To do
so, we constructed functional connectivity maps that enabled topological aspects of the correlation
structure to be visualized in the context of the microelectrode array geometry and location within
the spinal cord. Because it is not possible to know if the units were synaptically coupled, we adopt
the term functional connectivity to refer to significant temporal synchrony between unit pairs.
Figure 4 depicts examples of such intraspinal functional connectivity maps from two representa-
tive animals. Figure 4a, b depicts all significant connections, regardless of polarity; Figure 4c high-
lights the topology of excitatory and inhibitory connections from Figure 4a. In Figure 4c (red), we
show only the significant excitatory connections from the animal in Figure 4a; in Figure 4c (blue),
we show putative inhibitory connections, also from the animal in Figure 4a. In both figures, gray
circles represent each electrode on the microelectrode array, referred to as ‘nodes.’ Green
highlighted circles in Figure 4 were determined to be the most connected nodes of the array (see
Materials and methods). Qualitatively, it is evident from Figure 4 that pairs of temporally correlated,
spontaneously active units can be found (a) at all sampled dorsoventral depths, (b) within each gross
anatomical region, and (c) between all anatomical regions.
a Correlation matrix b P-value matrix
0.6
10 10
0.5
20 20
Neuron number
Neuron number
0.4
30 30
0.3
40 40
0.2
50 50
0.1
60 60
0
10 20 30 40 50 60 10 20 30 40 50 60
Neuron number Neuron number
Figure 3. Spontaneously active units exhibit temporal synchrony. For both plots, rows and columns are ordered from 1 N, where N is the total number
of units discriminated for a given trial. (a) Strength of temporal correlation between pairs co-active units, indicated by pixel color. Pixels below identity
line are omitted because reciprocal connections were not considered. (b) Statistical matrix of correlation strength show in panel (a). White pixels
represent statistically significant correlations, here defined as those with p-values 0.02. Of the 66 total spontaneously active units discriminated in this
epoch, and thus 2145 possible unique connections (ignoring reciprocal connections), 438 pairs exhibited significantly correlated temporal discharge.
McPherson and Bandres. eLife 2021;10:e66308. DOI: https://doi.org/10.7554/eLife.66308 8 of 24Research advance Neuroscience
a 60 c
Lateral Medial
shank shank
Lateral Medial
shank Putative excitatory shank
0
connections
4
sDH dDH IZ VH 0
50
0.6
Increasing correlation strength 0
90
b
Putative inhibitory
connections
0
7
sDH dDH IZ VH
0
80
0.8
Increasing correlation strength
0
Figure 4. Topology of spontaneously synchronous unit pairs is not relegated to regions of primary afferent terminations, rather it links sensory- and
motor-dominant regions of the spinal cord. Representative functional connectivity maps from two animals (panels a and b from same animal; panel c
from separate animal). For all topology plots (a–c): spinal cord inset image in panel (a) shows electrode location. Gray circles represent individual
electrodes on the microelectrode array. Green highlighted circles were determined to be the most connected nodes of the recording. Colored lines
represent significantly correlated temporal discharge between pairs of spontaneously active units at the indicated locations (note: horizontal lines
indicate connections between units discriminated from a single electrode, vertical lines are connections between units on the same shank). For panels
(a) and (b), line color delineates increasing correlation strength from blue to violet; for panel (c), red lines indicate putative excitatory connections, blue
lines indicate putative inhibitory connections. In panels (a) and (b), histograms depict the following (top to bottom): purple histograms indicate the
overall anatomical distribution of significant connections (in order left to right: sDH-sDH, sDH-dDH, sDH-IG, sDH-VH, dDH-dDH, dDH-IG, dDH-VH, IG-
IG, IG-VH, VH-VH); green histograms indicate the gross anatomical distribution of most connected nodes (in order left to right: sDH, dDH, IG, VH); and
red/blue histograms indicate the distribution of putative excitatory and inhibitory connections, respectively, in same order as purple histograms above.
Black arrows in panel (c), inhibitory connections, are intended simply to highlight the preponderance of within-electrode connections. sDH: superficial
dorsal horn; dDH: deep dorsal horn; IG: intermediate gray matter; VH: ventral horn.
Summary functional connectivity data from all animals in the urethane cohort can be seen in Fig-
ure 5 and Figure 5—figure supplement 1. The proportion of significant connections within regions,
at 68.9%, was significantly greater than the proportion of between-region connections, 31.1%
(pResearch advance Neuroscience
a Anatomical distribution of significant connections
30
*
100
*
Percent of significant
80
connections
20
60
40
10
20
0 0
on
on
gi
gi
re
re
/in
w
b/
w
b Most connected nodes [ % ] c Lateral electrode Medial electrode
shank shank sDH 1
Electrode number
Electrode depth
More occurrences away
per shank
from centerline
*
VH 16
0 2
d Anatomical distribution of significant connections by polarity e 21
Connection latency [ ms ]
18
*
Percent of significant
Excitatory 15
connections
Inhibitory 12
9
6
3 Putative mono-,
di-synaptic
0
excitatory inhibitory
Excitatory Inhibitory
Figure 5. Summary of topological data for urethane-anesthetized animals. (a) Proportion of significant connections by anatomical region (N = 13
animals). From left to right, bar plots indicate connections from sDH-sDH, sDH-dDH, sDH-IG, sDH-VH, dDH-dDH, dDH-IG, dDH-VH, IG-IG, IG-VH, and
VH-VH. Darkening color gradient from left to right qualitatively indicates depth from dorsal surface of spinal cord. Grayscale plots are the proportion of
within- and between-region connections, respectively. Significant connections are not uniformly distributed anatomically, with an overall main effect of
connection location (pResearch advance Neuroscience
Figure 5 continued
latencies were significantly shorter than excitatory latencies on average (p=0.0003). sDH: superficial dorsal horn; dDH: deep dorsal horn; IG:
intermediate gray matter; VH: ventral horn.
The online version of this article includes the following figure supplement(s) for figure 5:
Figure supplement 1. Summary of topological data for urethane-anesthetized animals.
greater proportion of trials (35.4 ± 4.6%) than nodes in the sDH (14.1 ± 4.3%), IG (27.4 ± 4.4%), or
VH (23.0 ± 3.9%), driving an overall main effect of anatomical region on the distribution of most con-
nected nodes (F = 4.333, p=0.009; Figure 5b, Supplementary file 1, tab 1c). It should be noted,
however, that the dDH comprised a relatively larger dorsoventral extent than did the other regions,
and thus contained a greater number of nodes. This contributed to the greater proportion of con-
nections attributed to it. To this point, in Figure 5c, we show a histogram of the most connected
nodes across the 32-channel microelectrode array. While a clear increase in counts is evident moving
from dorsal-most to ventral-most, many individual electrodes in the IG or VH exhibited a higher
occurrence of being ‘most connected’ than those in the dDH (see Discussion).
Finally, we characterized the distribution of putative excitatory and inhibitory connections. In
Figure 5d, we highlight their anatomical distribution. We found that connections within the dDH,
within the IG, and within the VH contained the highest proportion of putative inhibitory connections
(22.7 ± 5.3%, 24.1 ± 7.3%, and 37.8 ± 9.0%, respectively), with the dDH containing the highest pro-
portion of excitatory connections (25.9 ± 3.7%). Interestingly, only the dDH displayed an approxi-
mately balanced proportion of excitation and inhibition – that is, nearly the same proportion of the
overall number of putative excitatory connections as overall putative inhibitory connections.
Although it is striking that the highest percentage of inhibitory connections were all within spe-
cific regions rather than between regions, this may be a practical consequence of the extracellular
recording technique: detection of inhibitory connections via correlation-based approaches is notori-
ously challenging, in part because both cells must have a relatively high and stable base firing rate
to detect a reduction in firing. Functional connectivity, which includes many polysynaptic pathways,
makes detection more difficult still. Thus, some of the differences we observed in the within-vs.
between-region distribution of inhibitory connections may reflect these experimental elements and
should not be interpreted exclusively as a physiological feature of spinal network structure. The rela-
tive balance of inhibitory connections may also change with sensorimotor reflex activation, volitional
movement, nociceptive transmission, etc., even using extracellular recording techniques.
The distribution of latencies between each statistically significant connection is shown in
Figure 5e. Mean excitatory latency was significantly longer than the mean inhibitory latency, at
6.4 ± 0.6 ms vs. 2.7 ± 0.4 ms (p=0.0003), with both categories including latencies consistent with
putative mono-, di-, and polysynaptic pathways. Interestingly, we find a subset of both excitatory
and inhibitory connections with latencies between 0 and 1 ms. While some of these connections
could indeed be monosynaptic and the lower-than-expected delay merely related to binning spikes,
the most likely interpretation for coincidentally firing unit pairs would be a shared presynaptic input.
While the distribution of inhibitory latencies contained was skewed towards an increased probability
of observing putative mono- and disynaptic connections, this apparent disparity may also be related
to the aforementioned challenging of detecting inhibition via extracellular recording techniques.
Functional connectivity within and between deep regions of the spinal
gray matter is not abolished by preferential pharmacological
depression
The finding of robust functional connectivity between sensory-dominant dorsal horn regions and the
IG and VH was unexpected. Especially intriguing was the presence of vigorous neural transmission
within the IG and VH themselves. Although urethane profoundly depresses spontaneous discharge
in the dorsal root ganglia, it exerts less of a depressive effect on cells deep in the gray matter (i.e.,
the IG and VH) (Daló and Hackman, 2013; Hara and Harris, 2002). To control for the potential
influence of this anesthetic gradient on our findings, we conducted an additional set of experiments
in a cohort of eight rats anesthetized with isoflurane. Isoflurane is a more potent depressant of spinal
motor activity than urethane, with an overall gradient of depression that increases from the dorsal
McPherson and Bandres. eLife 2021;10:e66308. DOI: https://doi.org/10.7554/eLife.66308 11 of 24Research advance Neuroscience
horn to the VH (Kim et al., 2007). For example, while nociceptive pathways in the sDH remain
largely uninhibited by isoflurane, premotor interneurons and motoneurons in the VH are markedly
depressed (Grasshoff and Antkowiak, 2006). Mean intraspinal resting motor threshold confirmed
the greater depression of VH cells by isoflurane than urethane (isoflurane threshold: 20.4 mA; ure-
thane threshold 14.0 mA).
In total, we recorded from 484 well-isolated units across the nine rats, translating to ~51 ± 2 units
per trial. The mean number of units recorded per trial did not differ between the urethane and the
isoflurane cohorts (p=0.0718). A representative raster plot of spontaneous neural activity from one
trial is shown in Figure 6a. Surprisingly, spontaneously active units were observed throughout the
dorsoventral extent of the sampled region in all animals, including the IG and VH. The mean num-
bers of units per region are as follows: sDH: 9 ± 2, dDH: 20 ± 3, IG: 12 ± 1, VH: 13 ± 1 (main effect of
region: F = 6.650, p=0.001; Figure 6b, Supplementary file 1, tab 1d). In Figure 6c, we show a rep-
resentative functional connectivity map for the isoflurane cohort.
Summary data from the isoflurane cohort can be seen in Figure 7 and Figure 7—figure supple-
ment 1. Here, we show the gross anatomical distribution of significant connections. Similar to the
urethane cohort, we observed a significantly greater proportion of connections within regions
(66.4%) than across regions (33.6%) (p=0.005), and an overall main effect of anatomical region (e.g.,
sDH-sDH, sDH-dDH) on the proportion of significant connections (F = 6.517, pResearch advance Neuroscience
a Anatomical distribution of significant connections b Regional differences between URE, ISO
*
More under URE
Percent of significant connections
25
100 6
*
20
4
15
2
50
10
0
More under ISO
5 -2
0 0 -4
c d Lateral electrode Medial electrode
Most connected nodes [ % ] sDH 1
shank shank
Electrode number
More occurrences away
Electrode depth
from centerline
per shank
*
VH 16
0 2
e Anatomical distribution of significant connections by polarity f
24
*
Connection latency [ ms ]
21
Percent of significant
Excitatory 18
connections
Inhibitory 15
12
9
6
3 Putative mono-,
di-synaptic
0
excitatory inhibitory
Excitatory Inhibitory
Figure 7. Summary of topological data for isoflurane-anesthetized animals. (a) Proportion of significant connections by anatomical region (N = 9
animals). From left to right, bar plots indicate connections from sDH-sDH, sDH-dDH, sDH-IG, sDH-VH, dDH-dDH, dDH-IG, dDH-VH, IG-IG, IG-VH,
and VH-VH. Darkening color gradient from left to right qualitatively indicates depth from dorsal surface of spinal cord. Grayscale plots are the
proportion of within- and between-region connections, respectively. Significant connections are not uniformly distributed anatomically, with an overall
main effect of connection location (pResearch advance Neuroscience
Figure 7 continued
cohort. Purple shaded region intended to highlight latencies compatible with potential monosynaptic or disynaptic connections. Inhibitory latencies
were significantly shorter than excitatory latencies on average within the isoflurane cohort (p=0.017). We found no systematic differences in the
spatiotemporal profiles of excitatory and inhibitory connections between the urethane and isoflurane cohorts, which preferentially depress the
dorsal horns and VH, respectively. sDH: superficial dorsal horn; dDH: deep dorsal horn; IG: intermediate gray matter; VH: ventral horn.
The online version of this article includes the following figure supplement(s) for figure 7:
Figure supplement 1. Summary of topological data for isoflurane-anesthetized animals.
depressive profiles of the two anesthetics, we found no systematic difference in the proportion of
significant connections per region across the urethane and isoflurane cohorts (anesthetic by region
interaction: F = 0.369, p=0.949; main effect of anesthetic: F = 0.631, p=0.436); rather, all were within
1.8% of one another on average (range, 4–6%, Figure 7b). The distribution of most connected
nodes in the isoflurane cohort also mirrored that of the urethane cohort. Specifically, the largest pro-
portion of most connected nodes was found in the dDH (34.2%), the lowest in the sDH (13.2%), with
22.6% in the IG and 30.0% in the VH. There was a significant main effect of region on most con-
nected node (F = 4.935, p=0.006; Supplementary file 1, tab 1f; Figure 7c, d). Together, these find-
ings provide additional confirmation of the presence of persistent, synchronous discharge between
functionally and spatially different regions of the spinal gray matter during unconsciousness. That
such activity persisted in the IG and VH with isoflurane also underscores the apparent robustness of
the finding.
The anatomical distribution of excitatory and inhibitory links also remained remarkably stable
between urethane and isoflurane (Figure 7e). There was no main effect of anesthetic agent nor an
interaction of drug by region for either the proportion of excitatory or inhibitory links in each region
(excitatory: region: F = 13.981, p=0.000; region*drug: F = 0.348, p=0.819; drug: F = 0.030,
p=0.865, Supplementary file 1, tab 1g; inhibitory: region: F = 19.403; p=0.000; region*drug:
F = 0.231, p=0.794; drug: F = 0.611, p=0.444, Supplementary file 1, tab 1h). The mean latency of
excitatory and inhibitory connections also did not change from the urethane to the isoflurane cohorts
(excitatory: 6.4 ± 0.5 vs. 6.7 ± 1 ms, p=0.8188; inhibitory: 2.6 ± 0.4 vs. 3.1 ± 0.6 ms, p=0.5389).
Within the isoflurane cohort, inhibitory latencies were significantly shorter than excitatory latencies
(p=0.017; Figure 7f), which was also reflected when pooling data across both cohorts (i.e., inhibitory
latencies were significantly shorter than excitatory latencies on average at 2.9 vs. 6.5 ms, pResearch advance Neuroscience
possible to directly compute the probabilities that significant connections will exist within or
between regions if neurons are distributed at random. In our paradigm, the number of electrodes
per region is: sDH: 8; dDH: 12; IG: 6; VH: 6. These values can be seen in Figure 1a. We are inter-
ested in all within- and between-region connections as a matter of combinations, not permutations
(i.e., sDH-DH connections are the same as dDH-sDH connections).
Assuming that neurons are randomly (albeit uniformly) distributed throughout the sampled gray
matter, the expected value for each regional comparison is the ratio of the number of electrodes
represented in a given comparison to the total number of electrodes represented across all compari-
sons. For example, the expected percentage of dDH-dDH connections is arrived at by dividing 12,
the number of electrodes in the regional comparison, by 128, the total number of electrodes repre-
sented across all combinations. Note that the overall total (128) is not the same as the number of
electrodes on the array itself (32). This difference is because we are including comparisons between
regions in addition to comparisons within regions. Expected values for overall within-region and
between-region connectivity are the sum of the individual regional percentages. Theoretical proba-
bilities are: sDH-sDH: 6.3%; sDH-dDH: 15.6%; sDH-IG: 10.9%; sDH-VH: 10.9%; dDH-dDH: 9.4%;
dDH-IG: 14.1%; dDH-VH: 14.1%; IG-IG:4.7%; IG-VH: 9.4%; and VH-VH: 4.7%. For within- and
between-region connections, the probabilities are 25 and 75%, respectively. We then verified that
the bootstrapped synthetic data indeed converged to these theoretical predictions (Figure 8a).
We found an overall main effect of anatomical region on connectivity patterns between the boot-
strapped synthetic data and the observed data (urethane: F = 10.571, pResearch advance Neuroscience
a 80 Anatomical distribution of significant connections:
observed and synthetic datasets
70
Percent of significant
60
connections
50 Theoretical prediction
40 Synthetic urethane dataset
30
20
10
0
b
Synthetic urethane dataset
Percent of significant
connections
* * * ! * * ! ! ! *
Figure 8. Experimentally realized spatial patterns of functional connectivity diverge from predictions of random
network interactions. (a) Proportion of significant connections by anatomical region. From left to right, bar plots
indicate connections from sDH-sDH, sDH-dDH, sDH-IG, sDH-VH, dDH-dDH, dDH-IG, dDH-VH, IG-IG, IG-VH,
and VH-VH. Black bars indicate theoretical predictions; white bars indicate results of simulations ± sem (i.e.,
synthetic data). The synthetic dataset, generated from randomly shuffling by ±0–5 ms each spike time of each
neuron in each trial, then repeating >1000 , converges to theoretical predictions. Theoretical predictions are
based upon the number and anatomical distribution of electrodes throughout the gray matter. (b) Anatomical
distribution of synthetic data (white, as in panel a) compared to experimentally realized urethane data (N = 13,
purple bars). We found a significant interaction of cohort by anatomical region (real vs. synthetic, pResearch advance Neuroscience
To computer
a b 2 sec
0.5 mV
Lack of spontaneous action potential discharge in intact sciatic nerve
Sciatic nerve
c Light touch Light touch
1
0.5 mV
2 sec
2
4
3
e Pre-lidocaine nerve block: d Plantarflex + hold Dorsiflex + hold Alt. P-flx / D-flx
Light touch Toe ab/adduction Light touch
2 sec
0.5 mV 2 sec 0.5 mV
f Avg. peak amplitude of
During nerve block: evoked transmission
1
Light touch Toe ab/adduction
mV
Avg. spontaneous
2 sec 0.5 mV 0.5 mV
2 sec
Spontaneous discharge remains absent
Confirmation of nerve block Pre- block During block
Figure 9. Spontaneous baseline electroneurographic (ENG) activity in the sciatic nerve is minimal and unaltered by nerve block. (a) Schematic diagram
of recording site and relevant anatomical features. Yellow line indicates the nerve; we recorded sciatic nerve ENG using a hook electrode located at
site #1, proximal to the bifurcation into tibial and peroneal nerves; site #2 represents the common peroneal nerve, site #3 represents the sural nerve,
and site #4 the tibial nerve. (b) Representative ENG activity in the absence of sensory stimulation, as during intraspinal recording sessions. No
spontaneous action potential discharge is present, and ENG amplitude is minimal and constant. (c) Large bursts of high-amplitude ENG are induced by
cutaneous stimulation of the L4–L6 dermatomes. Stimulation epochs are indicated by the top-most horizontal bars, and the dots above the ENG are
rasters of individual spikes discriminated from the compound action potential/multi-unit ENG waveforms. The horizontal dashed line indicates the
average ENG amplitude during bursts of induced sensory transmission, and the solid horizontal line below it indicates the average ENG amplitude
during periods without sensory stimulation plus 3 its standard deviation. (d) Identical in layout to panel (c), with proprioceptive feedback rather than
cutaneous. The ankle was plantarflexed and held, dorsiflexed and held, and then alternated between plantarflexion and dorsiflexion. (e) Top panel:
sciatic nerve ENG recording during periods of induced sensory transmission (horizontal black bars) and baseline transmission prior to lidocaine nerve
block. Bottom panel (left): baseline ENG 30 min after epineurial lidocaine injection, showing a lack of spontaneous action potential discharge and
minimal amplitude. Bottom panel (right): minimal ENG during attempted induction of sensory transmission confirms efficacy of nerve block. (f)
Spontaneous baseline ENG amplitude is indistinguishable before (black) and during (gray) nerve block, and is 16.7 smaller than average peak ENG
amplitude during bursts of induced sensory transmission before the block (white). Note: the y-axis scales are the same for all plots in (b–e).
spontaneously arising action potential discharge is evident during epochs between sensory stimula-
tion; that is, the nerve returns to quiescence.
We then enveloped the multiunit ENG (gray lines over the ENG; 250 ms envelope window) and
extracted amplitude and variability metrics for periods of spontaneous baseline ENG and induced
sensory transmission. Across modalities of induced sensory transmission, bursts of multi-unit ENG
had an average peak amplitude 16.7 (±0.82 sem) greater than the average amplitude of spontane-
ous baseline ENG (N = 51 pairs). The average ENG amplitude across each period of sensory stimula-
tion (not the average peak amplitude, as previously reported) was 3.09 (±0.17 sem) greater than
the sum of the spontaneous baseline ENG amplitude and its standard deviation.
Next, we blocked afferent transmission via epineurial lidocaine injection. In the top panel of
Figure 9e, we show periods of induced sensory transmission and interleaved periods of spontaneous
baseline ENG prior to nerve block. In the bottom-left panel of Figure 9e, we show a representative
McPherson and Bandres. eLife 2021;10:e66308. DOI: https://doi.org/10.7554/eLife.66308 17 of 24You can also read