EMBRACING TRANSPARENCY - HARNESSING THE POWER OF DATA IN HONG KONG'S PRIVATE HEALTHCARE SYSTEM - 保柏
←
→
Page content transcription
If your browser does not render page correctly, please read the page content below

Embracing
Transparency
Harnessing the Power of
Data in Hong Kong’s Private
Healthcare System

Embracing
   Transparency
   Harnessing the Power of
   Data in Hong Kong’s Private
   Healthcare System

Contents

   1.      Executive Summary                   5

   2.      Transparency: the greatest source
                                               9
           of untapped value in healthcare?

   3.      The Hong Kong context:
           Would transparency increase
                                               19
           quality, affordability, and
           sustainability of care?

   4.      Taking transparency forward
           in Hong Kong:                       49
           Recommendations and conclusion

   5.      Appendix                            65
Abbreviations and Acronyms

ACA

ALOS
        Affordable Care Act (US)

        Average length of stay (hospitals)
                                                                       1. Executive Summary
COPD    Chronic Obstructive Pulmonary Disease

CMS     Centers for Medicare and Medicaid Services (United States)

DRG     Diagnosis-Related Group

EHR     Electronic Health Record(s)

eHRSS   Electronic Health Record Sharing System (Hong Kong)

ICD-9   International Classification of Diseases, Ninth Revision

MDC     Major Diagnostic Category

NQS     National Strategy for Quality Improvement in Healthcare (US)

PHF     Private Healthcare Facility

PHI     Private Health Insurance

NHS     National Health Service (United Kingdom)

VHIS    Voluntary Health Insurance Scheme
1.
Executive
Summary

            1. Executive Summary
                                                                                     Key Findings

            Overview                                                                 1. Hong Kong’s private healthcare market is experiencing rapid medical
                                                                                     inflation, resulting in higher out of pocket expenses and significant increases
            Transparency and measurement are fast-emerging as tools to enable        in health insurance premiums.
            health system sustainability in the wake of economic, epidemiologic,
            and lifestyle patterns burdening modern-day health systems. Hong         Actual out-of-pocket health expenditure has more than quadrupled to HKD 43
            Kong’s dual-track health system is experiencing these trends whilst      billion over the last 25 years while the real wage indices that actually indicate
            concurrently facing market inefficiencies and an underutilized private   changes in purchasing power saw only incremental change, meaning that
            health sector.                                                           individuals were able to buy less products and services in the healthcare space
                                                                                     with their money.
            The research conducted in this report explores issues around price
            opacity, the current use of the private sector, and recent government    Going forward, out-of-pocket expenditure is projected to more than double to
            initiatives on health insurance and services. Research and lessons       HKD 94 billion by 2024/25 if no improvements in the current system are put in
            from other markets point to ways these initiatives could be expanded     place, placing significant extra financial burden on consumers whose purchasing
            and strengthened, including the need for design of an overarching        power is already under pressure.
            national quality framework.

                                                                                     2. There is high price variation for inpatient and outpatient procedures.
            The efficient growth of the private system will ultimately impact the
            sustainability of Hong Kong’s healthcare ecosystem. Transparency is a
            vehicle to improve quality and manage cost, whilst shining a light on    Across providers, the same procedure, to the same quality standard, varies
            the importance of the overall patient journey. Transparency measures     significantly in price by room class, outpacing trends in international markets.
            serve as the architecture to facilitate a volume shift between public
            and private sectors and help alleviate ever-surging service demands.     The analysis revealed that certain high volume procedures, particularly elective
            An embrace of transparency offers the potential to develop a             procedures such as knee replacements and colonoscopies were priced higher
            stronger, more sustainable healthcare ecosystem in Hong Kong.            than in most developed countries, whilst others procedures were more in line
                                                                                     with international norms for private care.

            Methodology                                                              3. Hong Kong does not have a consistent approach to monitoring quality,
            This paper examines transparency across the domains of finance,          pricing and performance of health service providers.
            quality, and patient experience. All original analyses were conducted
            using cited reports and up-to-date data sources, along with insurance    The current regulatory framework for private providers is significantly different to
            statistics from the Hong Kong Federation of Insurers (HKFI).             the framework for public providers, resulting in inconsistent ways of defining and
            International best practices were researched to arrive at a set of       measuring quality and performance.  The analysis shows that private providers
            approaches that have already been successfully adopted in other          often rely on process measures as a proxy for quality, such as whether or not an
            markets. The result is a comprehensive analysis, with                    infection control policy is in place, rather than outcome measures, such as the
            recommendations for individual stakeholders in the present, and a        actual infection control rate.  In contrast, public providers are more orientated
            series of action areas to address moving forward.                        towards outcome measures, which have greater validity.

                                                                                     4. Consumers are confronted with inconsistent information, unstandardized
                                                                                     pricing terminology, unclear price breakdowns, and incomplete procedure lists.

                                                                                     93% of polled individuals in Hong Kong support calls for greater legislation of
                                                                                     quality and price in private healthcare facilities. Along with increased demand for
                                                                                     quality, new patient tools are emerging to rate patient experience.

6.                                                                                                                                                                          7.
1.
Executive
Summary

            Recommended Action Areas for Key Stakeholders                                            2. Transparency: the greatest
            Better use of data has the potential to reduce costs, increase                           source of untapped value
            transparency, increase capacity for volume, and elevate quality,
            thereby fostering market growth. The adoption of international best                      in healthcare?
            practices could result in significant cost savings over time. Examples
            of best practices from the UK, Australia, Singapore and the U.S.
            highlight the many-fold benefits of transparency and can be readily
            adapted to the Hong Kong market.

            A salient example is the current practice of colonoscopies. Currently,
            49% of private health insurance procedure claims arise from
            colonoscopy and gastroscopy cases. 64% of colonoscopy procedures
            are performed at ward level in Hong Kong, whilst most cases are
            performed as outpatient procedures in comparable international
            markets. The report shows that a shift to outpatient settings, in line
            with international best practice, could result in a potential cost saving
            of HKD 200 million annually.

            In the path towards sustainability, four key stakeholders have
            emerged. They each have a role to play in driving the transparency
            evolution forward. Action can begin in the present, irrespective of
            system-wide reforms or macro-level strategic planning.

            Figure 1: Recommended Action Areas by Key Stakeholder

             Government                                      Provider

               Create a methodology to capture                Provide key quality, financial and
               outcome measures                               patient experience data
               Standardize publicly available data            Engage patients in decisions about
                                                              their care
               Engage private providers in electronic
               health record sharing                          Invest in electronic health record
               Develop a national quality framework           Collect data linked to process and
                                                              outcome measures
               Task regulation of public and private
               healthcare facilities to the same              Establish mechanisms to adopt better
               regulatory bodies                              safety practices
                                                              Share management tools used to
             Insurer                                          measure quality and safety with
                                                              regulators and payors
               Link data to funding in order to transition
               to performance-based purchasing
                                                             Consumer
               Lead the design of managed care in the
               Hong Kong market                               Seek information to drive
               Emphasize the benefits of transparency,        decision-making
               including efficiency, data-sharing, and        Positively engage the health system
               benchmarking in communications with
               other stakeholders                             Report feedback of patient
                                                              experience to enrich the value chain
               Formulate common terminology in
               product redesign across the market
               Disclose clearer pricing data to consumers
               Begin collection of patient
               satisfaction data

8.
2.
Transparency:
the greatest
source of
untapped        2. Transparency: the greatest source of                                         2.1 Finance: effect of transparency on
value in
healthcare?     untapped value in healthcare?                                                   market pricing

                Transparency and measurement are necessary to                                   Price transparency offers an effective method to inform consumers about
                drive improvement in our health care system                                     health care costs, and could support a more efficient health care delivery
                                                                                                system. Often patients have an asymmetrical knowledge of the service or
                Globally, countries are moving towards greater transparency in health           product, leading to the way in which they approach healthcare purchasing
                care, as evidence highlights gains in patient health, quality, efficiency,      decisions being directed by their healthcare provider.
                and significant cost-savings.
                                                                                                This is further complicated if basic data on pricing, quality and patient experience
                Health systems today need to respond better and faster to the
                                                                                                is not readily available. This has led many to believe that transparency is not only
                challenges of a changing world. Overburdened and underfunded,
                                                                                                a “nice to have” but a fundamental prerequisite to ensuring patients and their
                these systems operate against the rising tide of mounting cost,1
                                                                                                insurers can make effective choices. Yet there are often significant gaps in
                demographic shifts in fertility and life expectancy, 2 and a
                                                                                                available data, leading to decision making based on inference rather than fact.
                prevalence of chronic disease that is rapidly accelerating worldwide3
                (see Figure 2).
                                                                                                In many healthcare systems, improved financial transparency on the price of
                                                                                                healthcare services has only come about as the results of decision making based
                Echoing trends already present in other sectors, health systems now
                                                                                                on inference have started to take effect. Perhaps a striking example of this is the
                confront growing waves of consumerism and a movement towards
                                                                                                rapid medical inflation seen in the United States – a country which spends almost
                more open and accountable institutions. Across other industries,
                                                                                                1/5 of its GDP on healthcare. Many purchasers – both insurers and individuals –
                transparency as a tool for change has consistently yielded positive
                                                                                                recognised that opaqueness of pricing was failing to allow them to make effective
                results and improved operating methods – for both consumers
                                                                                                choices on the care they received, and encouraging clinicians to treat the patient
                themselves, and the sector as a whole.
                                                                                                to the very limits of their policy or purse. With the passage of the Affordable Care
                                                                                                Act (ACA), the US began to confront the issue of price opacity and sustainability
                Whilst the need for health services is ever-rising, the adoption of             at the national level.
                transparency across the health sector in Hong Kong has been slower
                than in other industries. To ignore transparency as a tool, however,
                would be a missed opportunity.
                                                                                                Figure 3: Asymmetrical knowledge of healthcare can prevent healthcare
                Building upon the growing merits of transparency indicators, health             from being an effective “market” system
                systems need to begin to create strategies to extract the untapped
                value of transparency. Meaningful performance measures within the                 A lack of transparency                   Transparency normalises
                domains of finance, quality and patient experience have been shown                creates asymmetry                        market activity
                to improve performance,  reduce variations, and improve efficiencies.

                Figure 2: Growing stressors are disrupting health systems

                Cost                      Aging Populations         Chronic Disease

                                                                                                  Paternalistic model                      Clinician as partner
                                                                                                  Clinician directs consumption of         Patient and clinician direct
                                                                                                  healthcare                               consumption of healthcare
                Health care costs are     17% of the world’s        NCDs contribute to
                rising globally and are   population will be 60     70% of global deaths          Patient has limited ability to be        Patient is empowered to make
                estimated to reach        or older by 20302         annually3                     a proactive decision maker in            decisions in relation to their care
                14% of GDP by 20601                                                               their care

                                                                        Source: OECD, UN, WHO

10.                                                                                                                                                                                    11.
2.
Transparency:
the greatest
source of
untapped
value in
healthcare?
                2.2 Quality: does transparency improve it?
                                                                                           Figure 4: Change in Rates for Hospital-Acquired Conditions, 2010-2013

                There is an old management saying: “what gets measured gets
                managed”. This sentiment holds true across healthcare services              Adverse Drug Events                  -19%
                globally. Quality measures allow a comparison of institutions
                between and across regions. These indicators allow the                      Cattheter-Associated
                documentation of clinical behaviour during the provision of care,           UTIS                                            -28%
                which can be used to improve and understand management
                processes and clinical pathways.                                            Central Line-Associated
                                                                                            Bloodsteam Infections                                                     -49%
                Marked gains in the quality of clinical services have been observed in
                countries and systems which embrace robust transparency of                  Falls                      -8%
                meaningful quality indicators. The US is a market that began to adopt
                greater transparency measures after the passage of the
                Affordable Care Act (ACA). In addition to the more familiar health
                                                                                            Pressure Ulcers                      -20%
                insurance coverage reforms, the ACA contains provisions to address
                the extreme variability in quality of care patients receive from region
                to region. The National Strategy for Quality Improvement in Health
                Care (NQS) was designed to align healthcare improvement efforts
                                                                                            Surgical Site Infections             -19%
                across federal, state, and local agencies and the private sector. NQS
                aims to ensure providers and government are working towards the             Ventilator-Associated
                same goal.                                                                  Pneumonias
                                                                                                                         -3%

                According to the U.S. Department of Health and Human Services,              Venous
                                                                                            Thromboembolisms
                                                                                                                                -18%
                work undertaken in the area of patient safety has had a significant
                impact on hospital-based care after the initiative was launched:
                between 2010 and 2013, incidents of harm experienced by hospital            Total                              -17%
                patients nationwide decreased 17 percent, and potentially as many as
                50,000 deaths were avoided, and 1.3 million fewer patients
                experienced harm from hospital-acquired medical conditions (see                                              -10%        -20%        -30%        -40%         -50%
                Figure 4). These improvements are estimated to have saved USD 12
                billion in healthcare costs.4
                                                                                                                                       Source: Agency for Healthcare Quality and Research

                Whilst there is no definitive way of measuring quality, there is
                increasingly agreement on the major indicators that are used, such as
                readmission rates and surgical infection rates. The data for these
                indicators is almost always generated as a by-product of clinical
                processes rather than as a separate exercise, which helps reduce the
                administrative burden and increase the likelihood that the data will be
                accurate. As such, almost all providers find themselves in a position to
                monitor these indicators.

                Using this pragmatic approach has further benefits: true value is
                achieved by benchmarking quality indicators with national and
                international peers. Globally, the most common quality indicators are
                those that are easily monitored as a by-product of clinical practice,
                making this not just pragmatic but allowing a global knowledge base
                to be created and leveraged when assessing the question ”what really
                improves quality in healthcare?”.

12.                                                                                                                                                                                         13.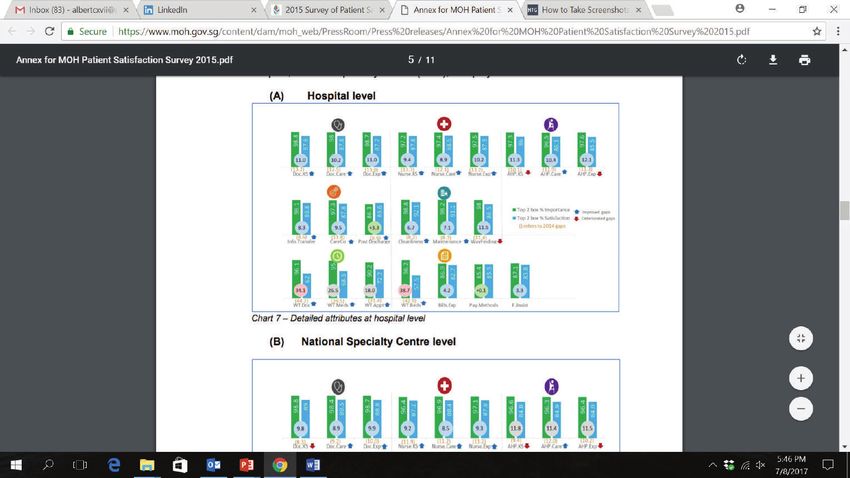
2.
Transparency:
the greatest
source of
untapped
value in
2.3 Patient experience: does the patient’s
healthcare? An NHS example highlighting the impact voice matter?
of benchmarking
From 2000 onwards, the UK Government pursued a new policy of Transparency efforts regarding patient experience are continually evolving.
“choice and competition” in the NHS in an attempt to drive up Whilst many health reform initiatives promote patient-centred and coordinated
standards of care. One key aspect of this was the production of care, past measurement efforts were mostly provider-centric and heavily
quality data to help patients and their families determine which weighted toward institutional care. Many health systems are increasingly turning
hospital provider they preferred to use. This was a marked departure away from a paternalistic model of care, instead supporting measures that reflect
from the old system, which had guaranteed hospital funding and the interests, needs, functional status, and financial preferences of consumers.
provided limited transparency on quality, as well as little patient
choice. The scale of such an “experiment” was unprecedented and The move towards transparency of consumer experience revolutionised many
untested, but was part of a broader system of public sector reforms industries. In the travel industry, Lonely Planet guides were quickly superseded by
which pursued pro-market principles. TripAdvisor with the platform’s emphasis on user-driven content. What was
surprising was the consistency of feedback, which is now regarded as an
The Government also invested heavily in the NHS; encouraging new authoritative guide on where to go, stay and do.
services to evolve, new ways of monitoring and communicating
quality data or be developed, and, controversially, allowing private Patient-reported measures have several advantages and offer a more holistic
providers to “compete” directly with the NHS, provided they agreed view of the patient across the care continuum. These measures can be used to
to deliver care to the same set-price per procedure. determine treatment compliance, patient preference, and various aspects of the
patient’s life that impact care (physical, psychological, social, economic).
The results of this policy shift were very significant. Over a period of
less than ten years waiting times for key elective surgeries reduced, Hospitals and health systems are expanding initiatives around patient experience,
mortality rates in key clinical areas, such as cardiac care, improved as the positive benefits have been many-fold. Clinically, a better patient
and length of stay were reduced (see Figure 5) 5 . A number of experience is correlated to both lower readmission and lower mortality rates (see
systematic reviews have concluded that transparency of data, Figure 6 and Figure 7).7
alongside patient choice and investment in enabling technology, such
as IT, played a role in these improvements.6
When asked the right questions, patients’ views on their care are surprisingly
aligned to the actual quality of service received, as exemplified by findings from
the Hospital Consumer Assessment of Healthcare Providers and Systems
Figure 5: Length of stay for elective surgery in the UK dropped (HCAHPS) questionnaire recently featured in many Harvard research studies
significantly when patients were able to choose the hospital for their
(see appendix).
elective surgery based on the mandatory published quality data
Figure 6: Better patient experience correlates to lower readmission rate
14
Mean Length of stay of total prosthetic
replacement of hip joint using cement
25%
12
10
20%
8
Readmission rate
6 15%
4
10%
2
0 5%
2000-01 2001-02 2002-03 2003-04 2004-05 2005-06 2006-07 2007-08 2008-09 2009-10
Year
Source: National Health System 0%
1-Star 2-Star 3-Star 4-Star 5-Star
Rating score of hospital experience
Source: JAMA Internal Medicine
14. 15.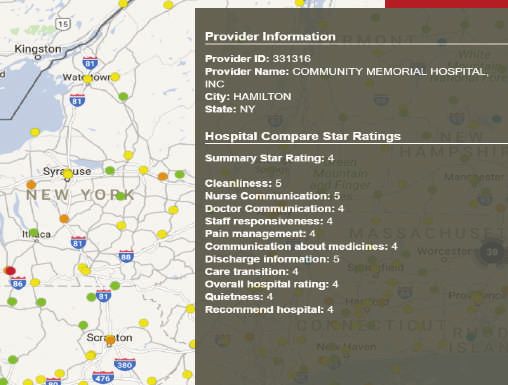
2.
Transparency:
the greatest
source of
untapped
value in
healthcare?
2.4 A holistic approach to transparency
Figure 7: A better patient experience correlates to lower mortality rate
Figure 8: The Overlapping Nature of Transparency Dimensions
11.5%
Finance
11 %
Performance
Prices (patients)
Morality Rate
Prices (payors)
10.5%
Disclosure
10%
Quality of Patient
Healthcare Experience
9.5% Mortality/survival rates Outcome measures
Hospital readmission rates Satisfaction
Waiting times Approval
9.0% Adverse-event reporting Complaints
1-Star 2-Star 3-Star 4-Star 5-Star
Rating score of hospital experience
Source: JAMA Internal Medicine
In examining transparency, it is critical to remember that the domains are
dynamic, often overlap (see Figure 8), and interact nonlinearly on different scales
(the patient, healthcare facility, government). 8 A transparency reform across the
domain of finance, for example, may impact affordability of care but also patient
satisfaction, which falls under the domain of “patient experience.” Likewise,
innovations in waiting times, a quality measure, may impact the category of
approvals or complaints, which are both measures of patient experience.
Transparency domains and their measures often have intrinsic properties. The
nonlinear interactions between the domains can create an output that is greater
than the sum of its parts.
Collectively, innovations across the dimensions of quality, finance, and patient
experience offer a roadmap for systems confronting soaring costs, paradigm
shifts, and the growing burden of chronic disease. Transparency as a way forward
has yielded documented gains in efficiency, affordability, benchmarking, and data
sharing – improvements that appeal to stakeholders across the vast spectrum of
the healthcare ecosystem.
Moves towards transparency can be marred with difficulty. Governments have
often learnt the hard way that improving one dimension of transparency without
also improving transparency in other domains can lead to unintended
consequences, including increase in prices. This is often because the absence of
information causes consumers to make assumptions, for instance, higher priced
care must be better care.
16. 17.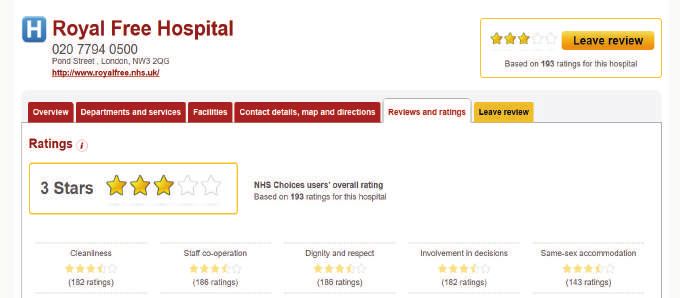
2.
Transparency:
the greatest
source of
untapped
value in
healthcare?

                Using one domain as a proxy for another will not necessarily translate                  3. The Hong Kong context: would
                to the assumed output measure. For example, if a consumer uses
                price as a proxy for quality, the logical assumption would be that                      transparency increase quality,
                higher price translates to better quality. This is due to the fact that
                price can exert a nonconscious influence on expectations of quality,                    affordability, and sustainability of care?
                even though a quick review of evidence in healthcare would dispute
                this very correlation. Similar trends can be observed between
                transparency dimensions when proxies are used (see Figure 9).

                Therefore, the overlapping nature and non-linear relationships
                between transparency domains should inform public policy reforms.
                Innovations across any transparency domain must be considered as
                part of a broader agenda in order for systematic and beneficial
                changes to occur.

                Figure 9: The Relationship Between Transparency Dimensions

                                                Transparency
                     Financial   Transparency
                                                  of patient
                  transparency     of Quality
                                                 experience

                                                                   Fully empowered consumers

                                                                   Consumers assess trade-offs
                                                                   between price/quality

                                                                   Consumers use price as a proxy
                                                                   for quality (assume higher price
                                                                   is higher quality)

                                                                   Consumers use quality and
                                                                   experience as a proxy for price
                                                                   (assume higher quality costs more)

                                                                   Consumers use quality as a proxy
                                                                   for price (assume higher quality
                                                                   costs more)

                                                                   Consumers are not able to
                                                                   exercise choice

18.
3.
The Hong Kong
context
3. The Hong Kong context: would transparency increase
quality, affordability, and sustainability of care?
Figure 10: Health insurance premiums keep rising
The challenges facing Hong Kong’s healthcare system 5,000
Individual
Annual Premium (HKD)
Hong Kong’s healthcare system faces rapid medical inflation and Group
increasing insurance premiums, in spite of continued growth and 4,000
profitability over the past decade. Data increasingly reveals market
inefficiencies and problems of affordability rooted in transparency
gaps around price, quality, and patient experience. 3,000
Hong Kong has one of the fastest growing elderly populations in the
world as the result of both longer life expectancy and declining 2,000
2007 2008 2009 2010 2011 2012 2013 2014 2015 2016
fertility rates, creating a “silver tsunami”. Concurrently, concerns over
Year
medical inflation, the instability of the housing market, the
unaffordability of daily living and uncertainties on the political Source: HKFI 2016
outlook are all resulting in less consumer confidence, and a tightening
of spending.
Whilst premium increase and cost increase are widely discussed macro-level
In the near-term, these factors are driving a rapid increase in the problems, less discussed is the impact of such increases at the level of the
utilisation of public healthcare services, and pose mid-term fiscal risks individual consumer. At first glance, little has changed over time: the proportion
to the Government of Hong Kong. This makes a rare moment, when of out-of-pocket health expenditure has remained relatively static over the last 25
purchasers – both Government and insurers - are grappling with the years. However, examination of financing by source reveals that actual out-of-
same challenge: how to ensure value can be achieved from healthcare pocket expenditure has in fact more than quadrupled over the same period,
and, crucially, how those that can afford to contribute to the cost of increasing from HKD 9,212 million to HKD 43,452 million (see Figure 11).11
their care are encouraged to do so.
Further analysis revealed that over the same period out-of-pocket expenditure
The prevailing legislation regulating the private hospital system dates was quadrupling, the real wage indices that actually indicate changes in
to the 1960s, and contains no requirements in relation to purchasing power saw only incremental change12 (see Figure 12), meaning that
transparency of quality, pricing or patient experience. So whilst Hong individuals were able to buy less products and services in the healthcare space
Kong’s private market is often referred to as a “free market”, the with their money.
system conversely lacks many of the characteristics of an effective
market economy. This has resulted in anomalous practices that are Going forward, out-of-pocket expenditure is projected to more than double to
radically out of synch with other developed private HKD 94,279 million by 2024/25 (see Figure 13 and appendix) if no improvements
healthcare markets. in the current system are put in place, placing significant extra financial burden
on consumers whose purchasing power is already under pressure.
Insurers have typically managed risk by tightly defining target
markets and limiting coverage to high-net worth individuals and The implication of this is two-fold: firstly more people will be relying on the
corporate groups. This is reflected in the profile of policyholders; in Hospital Authority for preventative and curative medicine, and secondly those
Hong Kong for example, the majority of holders earn 60k (HKD) per who do shop in the private marketplace will be buying products with lower levels
month and are of working age, and only 28% having a pre-existing of insurance coverage. Essentially, individuals can have insurance and still be
medical condition.9 “underinsured”, a scenario that does not address the fundamental purpose of
using private healthcare facilities, which is to divert patient flow and service
However, a changing economic environment is putting pressure on demand away from the already overburdened public system.
large corporates, who are in turn growing increasingly intolerant of
continued increases in premium pricing. Individuals, even those
defined as middle-class, are struggling with the growing
unaffordability of premiums (see Figure 10).10 Individuals in the Hong
Kong market currently confront rising health expenditure, variation in
product pricing, and reduced purchasing power in the healthcare
marketplace.
20. 21.3.
The Hong Kong
context
Figure 11: Out-of-pocket expenditure quadruples in the private market Figure 13: Projections, 2014/2015 - 2024/2025. Proportional and actual
out-of-pocket expenditure, Hong Kong.
Proportional and actual out-of-pocket expenditure, Hong Kong
50,000 100% 100% 100000
90% 90000
40,000 80%
80% 80000
HKD in millions
30,000 65% 70% 70000
HKD in millions
60% 60000
20,000 40%
50% 50000
10,000 20% 40% 40000
30% 30000
0 0%
1989/90 1994/95 1999/00 2004/05 2009/10 2013/14 20% 20000
Others Insurance Households
10% 10000
Non-profit institutions Employers Private household out-of-
pocket expenditure (million)
0% 0
Source: Domestic Health Accounts (2013/14); Asia Care Group analysis
2014/15 2015/16 2016/17 2017/18 2018/19 2019/20 2020/21 2021/22 2022/23 2023/24 2024/25
Figure 12: Real and Nominal Wage Index Over Time Households Insurance Others
Employers Non-profit institution Private household out-of-pocket expenditure (million)
200
In the next section, the analysis explores how Hong Kong fairs in relation to the
three vital pillars of transparency: financial, quality and patient experience data.
In assessing Hong Kong’s private system, stakeholders should seek to answer key
questions: Is pricing sustainable? Is there sufficient understanding of the quality
150
of services and is the patient voice being heard? Together, the answers to these
questions shine light on the sustainability of the current system.
100
50
0
Sep-92
Aug-93
Jun-95
May-96
Feb-99
Dec-00
Sep-03
Jun-06
Mar-09
Jul-94
Apr-97
Mar-98
Jan-00
Nov-01
Oct-02
Aug-04
Jul-05
May-07
Apr-08
Feb-10
Jan-11
Dec-11
Nov-12
Oct-13
Sep-14
Aug-15
Jul-16
Nominal wage index Real wage index
Source: Census and Statistics Department; Asia Care Group analysis
22. 23.3.
The Hong Kong
context
3. 1 Financial transparency: is the price of
care sustainable?
Figure 15: Average Price for Common Procedures in Private Hospitals in Singapore
The lack of financial transparency is inhibiting the functioning of an
20,000
effective market: an inability to measure the true costs of various
hospital procedures stops purchasers from fully comparing prices of Single Bed
providers and therefore interferes with normal competitive practices. 2-Bedded
It impacts the ability of insurers to develop innovative plan design Ward
(e.g. covered benefits, disease management programmes,
15,000
reimbursement ratios) and general procedures (e.g. provider network,
speed and accuracy of claims processing).
Hong Kong sees high variation in price across providers for
procedures delivered to the same standards (see Figure 14). 10,000
SGD
Procedures delivered by the same provider can carry vastly different
prices, depending on the service level or “room class.” Whilst there
are differences in price for room accommodation in many
international markets, the trends seen in Hong Kong outpace
international trends (see Figure 15), and create customer confusion. 5,000
When patients ask for a detailed list of fees, they may not anticipate
that room amenities like cotton or soap will drive up the overall cost
of their bill, or that the classification of ‘private’, ‘semi-private’, and
‘ward’ level actually vary from one hospital to the next.
0
Appendectomy Knee Breast lump
The publicly available data on room rates and surgical fees for Gastroscopy removal
replacement
commonly performed procedures is still provided in unstandardized
ways, with classification language and data presentation failing to
provide “like for like” comparisons between providers. Greater Source: Ministry of Health, Singapore; Asia Care Group analysis
transparency around pricing would alleviate much of the confusion
experienced by consumers, as well as reduce variation In Singapore, the price difference is around 25% between ward and 2-bedded
between providers. rooms, and 10-30% between semi-private and private rooms.13 The same
procedure in Hong Kong, to the same quality-standard, costs 2-31% more
Figure 14: Median Price for Common Surgeries, Hong Kong Private Hospitals between ward and semi-private rooms, and 5-43% more between semi-private
and private rooms.14
60,000
Private Aside from the trend to weight pricing by room class, the price of high volume
Semi-Private
Ward
elective procedures are often much higher than comparable markets (see Figure
50,000 16). Cost of total hip and total knee replacement surgeries top the list in price
among all developed nations, with little to no published quality data to support
40,000 the higher costs (see Figure 17).
30,000 The Hong Kong Federation of Insurers reported 49% of all insurance claims came
HKD
from gastroscopy and colonoscopy surgeries. This is significantly higher than
20,000 international standards, and warrants further investigation by all involved in the
private market.
10,000
Many of the procedures are not being performed according to widely-adopted
trends in international best practice, with a skew towards inpatient settings that
0
Appendectomy Colonoscopy Cataract Fracture and /or Femur and knee joint drive up costs. The same HKFI report revealed that 75% of all colonoscopies were
dislocation (repair, revision and/
(forearm or wrist) or reconstruction
occurring in inpatient settings, whilst in most developed countries, colonoscopies
are performed largely in outpatient settings. This begs the question, is this
Source: Hong Kong Federation of Insurers; Asia Care Group analysis
practice sustainable or in the best interest of the patient?
24. 25.3.
The Hong Kong
context
In the absence of medical necessity, high volume surgical cases like If Hong Kong’s private sector adopted best-practice in relation
colonoscopy could be shifted to outpatient settings and result in to colonoscopies it could save approximately HKD 200
significant cost savings. Assuming the market were to adopt
million annually
international best practice in the case of colonoscopy procedures,
data from HKFI was extracted for the proportion of surgeries by
procedure setting, average price by setting, and average 49% of procedure claims are from colonoscopy and gastroscopy
reimbursement ratio by setting. For simplification, a 100% rate in shift
to outpatient settings was assumed. The resulting margin for cost
savings comes to approximately HKD 200 million annually. Current Scenario Clinic Ward Semi-private Private
Distribution by Colonoscopy price Reimbursement rate
accommodation level (HKD)
Figure 16: Average Private Sector Pricing for Common
Procedures across Countries*
25%
$366,735
Singapore
3% 91%
Australia
56,865 84%
Hong Kong 8% 80%
$206,477
$204,981
United States 75%
39,230
$138,993
$108,425
HKD
25,400 25,400
$40,000
64%
$40,353
$36,000
$36,968
$29,940
$31,254
$25,400
$29,323
8,408 8,408
$10,213
$5,477
$6,127
Most claims are coming from ward level --- whilst in most developed countries
Cataract Appendectomy Colonoscopy Hip replacement colonoscopies are mostly performed in out-patient settings.
*Median prices calculated for private room rate. Source: International Federation of
Health Insurance Plans (2015); 15 Hong Kong Federation of Insurers;
Ministry of Health, Singapore; Asia Care Group analysis.
Conversation rates current as of 07.06.2017 http://www.xe.com/currencyconverter/
Best practice
Distribution by Colonoscopy price Reimbursement rate
accommodation level
Figure 17: Cost of Total Knee Replacement
$36,861
$25,398 $24,614
$21,435
USD
$20,668
$12,589
$8,100 Clinic 100% $8408 91%
$6,015
Hong Kong US Switzerland Australia New Netherland Spain Argentina Estimated cost savings if best practice applied: HKD 200 million
Zealand
Source: Hong Kong Federation of Insurers, Asia Care Group analysis
Source: AXA International,16 International Federation of Health Plans, Hospital Authority,17
Ministry of health Singapore, Australian Institute of Health and Welfare,18 BQS Institut für
Qualität und Patientensicherheit,19 Archives of Orthopeadic and Traumatic Surgery20
26. 27.3.
The Hong Kong
context
Insurers have underutilised their potential leverage on providers. By Figure 19: Price Variation for Reimbursement Products
guaranteeing volume to providers, insurers can better negotiate price
and delivery setting for the items reimbursed under their product 10,000
plans than individuals can. This approach could help address many of
the practices around pricing that occur in the market. 9,000
8,000
In order to help create for greater transparency, insurers should more
lead by example and move towards standard product language to
7,000
reduce confusion and variation in coverage pricing. Analysis revealed
Annual Premium (HKD)
that the same level of healthcare cover for comparable insurance
6,000
products was priced very differently between insurers
(see Figures 18, 19, 20).
5,000
Insurers have it within their power to change the direction of these 4,000
trends and begin a much-needed system rebalancing between
inpatient and outpatient care. The increases and variations in cost are 3,000
simply not sustainable over time. Additionally, the trends in use of
inpatient care for elective procedures that could be done in 2,000
outpatient settings are slowing the potential for insurance
marketplace growth. Insurers can redesign their products with an 1,000
emphasis on managed care and integrated primary care settings,
contributing to a healthier population. 0
Insurer A Insurer B Insurer C Insurer D Insurer E Insurer F
Figure 20: Price Variation for SME Plans
Figure 18: Price Variation for High-End Products
8,000
25,0000
7,000
Annual Premium (HKD)
20,0000
Annual Premium (HKD)
6,000
15,0000 5,000
4,000
10,0000
3,000
5,000
2,000
0 1,000
Insurer A Insurer B Insurer C Insurer D Insurer E Insurer F
0
Insurer A Insurer B Insurer C Insurer D Insurer E
Source: Asia Care Group analysis
28. 29.3.
The Hong Kong
context
Solution Tool: DRGs are a step towards
better, fairer payment systems
Figure 21: DRG Properties Explained
Current model
Diagnosis Related Groups (DRGs) have emerged as a multipurpose Financial Clinician behaviour Organizational Features of this model
tool in healthcare planning, with documented benefits including underpinning behaviour
efficiency gains, cost maintenance, and decreases in the volume of
inflation. Whilst DRGs do not meet all policy objectives nor solve all Fee-for-service “I will maximise every Links survival to Over-supply
problems in healthcare, their implementation has been a critical step individual patient’s increasing volume Limited or no access barriers
in increasing the further transparency of hospital output. health status, without Limited appeal to cost-
restriction on effectiveness of interventions
resource” (practice of defensive
medicine)
Information about what drives spending is often incomplete. DRG No incentive to manage or
systems emerged in an effort to increase transparency of services improve the efficiency of care
and to incentivize greater efficiency in the use of resources invested
in acute care settings. These systems, whilst not a cure-all, enhance Block “I will maximise the Links survival to Under-supply
the quality of inpatient care by discouraging unnecessary and contracting health status of the reducing volume Waiting times
potentially harmful procedures. Additionally, they encourage patient population as Rationing
far as possible, within Exclusions of costly or novel
concentration of complex procedures in settings where the high resource limits” treatments (inhibits innovation)
frequency and volume of these procedures promotes efficiency.
Performance “I will improve the Links survival to Improves the quality/
DRGs allowed, for the first time, a meaningful way to compare “like based quality of care I deliver specified efficiency of care delivered
for like” cases and procedures within and between delivery settings. contracting to patient and meet or performance Encourages the effective use
exceed targets, with measures, within of resources
This innovation of controlling cost whilst promoting quality is at the
some consideration of financial envelope Can create unhealthy or
very centre of the transparency debate. resource limits” narrow focus on metrics
Can limit/reduce clinical
innovation
Substantial efficiency gains could be made by reforming hospital
payment mechanisms, especially since expenditure on hospital
services comprises one of the largest shares of total health-care Value based “I will improve the Links survival to the Encourages clinicians to focus
Aspirational model
contracting outcome of the care I outcome of care on the outcome of the care
spending in all countries, regardless of their income level. deliver to meet agreed delivered, within provided, not the process
metrics, with some financial envelope. Notoriously hard to define
Payment systems based on DRGs have gained momentum since the consideration of outcome measures, making the
resource limits” likelihood of poor specificity
1990s, gradually becoming the principal means of reimbursing and conflict between provider/
hospitals for acute inpatient care in most high-income countries. purchaser high
Although DRG-based payment systems are now mainly understood
as a reimbursement mechanism (see Figure 21), their original purpose
was to enable performance comparisons across hospitals.
30. 31.3.
The Hong Kong
context
Case study: The implementation of a DRG DRGs: Moving towards transparency,
reimbursement scheme in Australia efficiency, quality
Challenge Today DRGs are used primarily by purchasers to reimburse providers for acute
Following the transition of the public system to casemix and DRG- inpatient care, but in principle they can also be used to reimburse them for non-
based schemes in the 1990s, the private insurance sector in Australia acute inpatient care. The most frequent reasons for introducing DRG-based
was tasked with navigating the transition from passive bill pay to payments are to increase efficiency and contain costs. Research on the impact of
active purchase of health services to accommodate the 40% of different DRG-based payment schemes in North American and Europe suggests
hospital admissions that occur in private hospitals nationwide. DRGs generally help to increase hospital efficiency by reducing the average
length of stay (see Figure 22); simultaneously, they also increase case volumes,
Approach which has incentivized hospital systems and insurers to gradually adopt DRG
Linking data to funding models over time. The US first implemented a nationwide DRG system in 1983
Private Health Insurance (PHI) in Australia provides health insurance with the Medicare ‘prospective payment system, followed by Australia and
against the costs of access to private hospital care and ancillary England in 1992 and Spain (Catalonia) in 1996.
services to complement the publicly-funded universal health care
system for access to hospital and medical care. Amid a system-wide Meanwhile, low-and middle-income countries are increasingly adopting or
overhaul in the public sector and increasing regulations, PHI piloting DRG-based payment systems, mostly for the reimbursement of acute
transitioned from day payments to episodic payments and a full inpatient care (see Figure 23).
DRG-based payment scheme.
Figure 22: DRG Implementation Year and Inpatient Care Average
Targeted Messaging Length of Stay (days), All Hospitals
To overhaul the innumerate medical and surgical codes of the existing
1990 2002 2012
ICD-9 system, Australia first began an extensive mapping exercise.
1992 1996 1992 1983
The next step included targeted messaging to the players in the
private system: private hospitals, participating clinicians, and all other
12.2
payors/health funds. The DRG-based model was not marketed as
10.7
“cost-containment”, but rather, was presented as “efficiency”, “bench- 8.8
10.3 9.1 6.6
marking”, and “data-sharing”. 7.6
7.2 7.2
6.4 5.6 6.1
Australia enhanced the US’s DRG system, which was
subsequently adapted by Singapore, France, and Germany
The Results Australia Spain England United States
Within two years, other health funds in the PHI market were on
board. Source: OECD Stat Calculator 21 , Eurostat Statistics Database22 ,
WHO European Health for All Database23 , Asia Care Group analysis.
A transition from day payments to episodic payments under a
traditional bundled DRG case payment model. Figure 23: Transparency in Pricing: An Emerging Trend Globally
A reduction from around 1,500 medical and surgical codes to a
Europe
manageable 23 MDCs and 665 DRG codes + cost-weighting. Estonia Portugal
Hospitals provide Hospital Casemix Protocol (HCP) to health England Netherlands
Finland Denmark
funds on a monthly basis. North America France Sweden
Provisions were put in place to avoid loopholes and upcoding. Canada Germany Italy Asia
Average length of stay (ALOS) decreased from 14 days to 10 days United States Poland Bulgaria Japan
Costa Rica Spain Latvia Republic of Korea
“almost overnight.” Sweden Montenegro Iran
Austria Moldova Malaysia
Quality and financial benefits beyond the initial results Ireland Servia Vietnam
Data was tied to funding, ensuring its accuracy. South America Africa
PHI and the private hospitals enjoy a mutually dependent, Argentina South Africa
profit-from-volume relationship. Countries with Chile Tunisia
Colombia Australia
ALOS declined in acute care settings, whilst affordability, established DRG systems
Uruguay Australia
improved health outcomes, and efficiency all increased. Countries piloting or exploring New Zealand
a hospital payment system
Patients continued to enjoy choice of providers and access to based on diagnosis-related
private health facilities and a range of ancillary health groups (DRGs)
care services. Source: WHO24
32. 33.3.
The Hong Kong
context
3.2 Transparency and quality:
A tale of two cities
Figure 24: Quality indicators in Hong Kong’s private system tend to be process based
When it comes to transparency of quality outcomes, Hong Kong is a Brand Evaluation criteria
Population of Process Outcomes
quality of quality
tale of two hospital systems. The public system is required to provide focus
domains
measures measures
indicatiors
considerable quality data to its regulator – the Food and Health
Bureau, and the private system is required to provide comparatively Safety The creation or risk Number/severity of
little quality data to its regulator – the Department of Health. The lack registers sentinel events
The availability of Infection control rates
of a single regulator, and the coexistence of two different sets of an infection control Surgical complication
reporting requirements, creates stark differences in the practices and policy rates
The creation of safe Surgical revision rates
approaches to quality in hospitals in Hong Kong. surgery checklists
Importance
The approach taken by the Department of Health in relation to private
The creation of a Waiting Times Scientific
hospitals is procedure driven (see Figure 24); the emphasis is on Accessibility waiting time policy Acceptability
ensuring that private hospitals have policies and activities in place to The creation of staff Validity
ratios to ensure
support high-quality care, such as the existence of an infection effective clinical cover Evidence to
control policy. In contrast, the approach taken by the Food and Insured patients improve
Health Bureau in relation to public hospitals is outcome driven; the seeking elective outcomes
emphasis is on ensuring the actual result of the care being delivered is care in private Reliability
hospitals The creation of a Sickness absence
quantitatively measured and improved. Efficiency Responsibility
discharge and rates for clinical staff Viability
admission policy
Usability
The result of these differing approaches are vastly different levels of
transparency on the actual quality of care, with the public system Effectiveness Having care Readmission rates
Feasibility
Ready data
being more in line with international norms. The private system protocols in place New to follow-up sources
focuses on assuring policies are in place rather than looking at what The creation of a ratios
staff training % patients treated
effect the policies are having on quality outcomes. This is not likely to policy and clinical to care standards/
be the best situation, impeding real comparisons of quality and audit standards protocols
Mortality and
limiting private providers from understanding how their services are morbidity statistics
performing in relation to peers.
Example: Hong Kong has a gap in
Code of Practice for transparency in relation
Whilst Hong Kong operates as a dual-track system, the quality Private Hospitals, to outcomes related
standards for healthcare, in theory, should be universal. The Nursing Homes and quality indicators
Maternity Homes,
development and implementation of quality standards and constant Department of Health
quality improvement efforts are central to system sustainability.
Following international examples, Hong Kong should move towards
streamlined regulation of healthcare facilities, tasking oversight of all
healthcare providers to the same regulatory bodies -- as seen in
Singapore, Australia, the UK, and the US. This leads to a second
critical point in the discussion of quality measurement: Hong Kong
currently lacks a national quality framework. In the absence of an
overarching framework, Hong Kong collects fewer financial, quality,
and patient experience indicators than comparable developed
markets (see Selected Indicators for Evaluating System Performance
on page 36). The development of a quality framework would provide
a mechanism for data collection and measurement with an aim to
improve safety, strengthen clinical outcomes, develop clinical
guidelines, reduce variations and inefficiencies, and improve public
trust in healthcare providers.
34. 35.3.
The Hong Kong
context
Selected Indicators for Evaluating
System Performance Developing a balanced scorecard approach
Indicator US UK Australia Singapore Hong Kong A balanced scorecard is a simple but effective tool to support organisations to
focus on a meaningful number of critical performance indicators. There are
Financial Indicators
typically four domains to a balanced scorecard; each highlighting performance in
Efficiency and Sustainability
a different domain, such as clinical processes and financial performance (see
Cost per DRG
Average length of stay for
Figure 25). The overarching aim is to gain a rounded perspective of the overall
selected DRGs performance of an organisation, and reduce or eliminate the tendency to focus
Number of MRI scans/CT too narrowly on one aspect.
scans/colonoscopies per
1,000 population
Use of generics versus The use of a balanced scorecard approach may lead to significant improvements
branded where generics if introduced in Hong Kong. Current reforms focus heavily on financial
are available
transparency, but it will be imperative to ensure that this domain is balanced by
New to follow-up ratios
transparency in other domains, notably quality and patient experience.
Costing and Pricing
Access to historical billing
data The use of balanced scorecards are well established in other markets. For
Access to projected costs example, the UK’s NHS has adopted a balanced scorecard within all of its 300+
for surgical procedures hospitals, allowing meaningful comparisons on performance to be made. In the
Access to projected costs case of the NHS, the indicators, and performance thresholds, are set nationally,
for inpatient stay with each hospital publicly reporting on these areas. Hospitals have, over time,
Access to projected costs evolved their internal processes in order to allow easy (and in many cases
for primary care and
diagnostics automated) reporting of the required data, which has in turn reduced the
Quality Indicators
administrative burden associated with each hospital devising its own system and
Safety
reporting on different indicators.
Adverse events treated in
hospital
Figure 25: Sample Balanced Scorecard
Unplanned readmission
following selected surgical
care Patient Financial
“To meet the quality expectations of “To succeed financially, which
Healthcare associated patients, how should we structure the reimbursement schemes should we
infections patient journey?” employ?”
Falls resulting in patient
Objectives Objectives
harm in hospital
Reliability of care Measures Measures
Waiting times for elective Targets Targets
surgery (waiting time in days)
Indicators Indicators
Surgical revision rates
Morbidity and mortality
rates
Standardised admissions Vision and Strategy
rates per 1,000 population
Patient Experience Indicators
Self-reported experience Learning and Growth Clinical Processes
“To achieve our vision, how will we “To meet service demands and quality
Patients rating of their own sustain our ability to change and benchmarks, what internal clinical
care improve?” processes should we excel at?”
Carer, friends or family
Objectives Objectives
rating of care
Proxy measures Measures Measures
Patients rating of their own Targets Targets
care
Indicators Indicators
Sources: The Commonwealth Fund (US)25 , Hospital Compare (US)26 , NHS Outcomes
Framework (UK)27, NHPF Framework (Australia)28 , NHA Framework (Australia)29, Quality and
Safety Framework (Singapore)30, Hospital Authority (Hong Kong)31 , Department of Health
(Hong Kong)32 , Asia Care Group analysis
36. 37.3.
The Hong Kong
context
The current NHS balanced scorecard is composed of three types of Figure 26: NHS Balanced Scorecard Indicators
performance indicators: patient focus, clinical focus, and capability
and capacity focus. The balanced scorecard is a powerful Best outcomes
management tool for healthcare organisations operating in an Outturn Monthly Annual Aug 15 6-month trend YTD
Measure
environment facing unprecedented levels of change. In the face of 14/15 target 15/16 target 15/16 Actual 15/16
changing demographics, growing consumer expectations,
heightened competition, and increasing regulations, the balanced In-hospital SHMI 583.
The Hong Kong
context
3.3 The voice of Hong Kong’s patients
Figure 27: Public Approval for Increased Regulation of PHFs
The changing pattern of disease within Hong Kong, from episodic
care to long-term chronic care, is creating a new, very knowledgeable
and experienced voice – the voice of the patient. This group of
“expert” patients are often more vocal in sharing their views and 35%
experiences of the healthcare system; the repercussions of which
include a broader and wider call for the reporting of patient’s
experience.
Government consultations have consistently found that patients want 1%
greater information on all aspects of their healthcare in order to make 1%
effective choices, with 93% supporting calls for greater Government- 5%
backed legislation to ensure transparency in healthcare pricing (see
Figure 27).
Agree
Strongly agree
With the mounting wait times for public hospital services, consumers
58%
increasingly look to private hospital care but find their decision- Half-half
making hampered by a lack of transparency across the market. Disagree
Strongly disagree
The growing relevance of patient experience is captured in a
number emerging tools globally. These range in format from patient
surveys to online rating platforms and databases, to mobile apps that
Source: Public Opinion Survey on Regulation of Private
collect health data and allow virtual consultations and referrals to Healthcare Facilities, Food and Health Bureau (2016)34 .
ease wait times.
Patients and the public are not simply passively waiting for change.
Instead, they are driving it. First-hand patient feedback offers insight
into the demand, and need, for greater involvement of patients in
shaping the healthcare services of tomorrow.
In 2016, a voluntary pilot scheme was launched in an effort to
increase transparency of medical charges. Under the scheme, Hong
Kong’s private hospitals agreed to start providing bill estimates for 24
commonly-performed surgical procedures. To determine how the
launch of this scheme actually impacts consumers in the marketplace,
analysis of the publicly available data from the participating 12
hospitals was conducted. Much of the analysis revealed significant
inconsistencies in the range of data hospitals chose to publish.
Analysis of the voluntary pilot scheme produces little evidence that
the pricing data in its current form will be impactful or particularly
informative for those seeking to make like for like comparisons before
settling on a choice of provider. For the rollout of the actual
regulatory bill, Government may need to look to establish
standardized data requirements to minimize confusion over
reporting measures.
40. 41.3.
The Hong Kong
context
The patient experience of navigating pricing
data across private hospitals Emerging Tools to Capture Patient Experience
Analysis reveals consumers confront inconsistent information, Consumer Assessment of Healthcare
unstandardized pricing terminology, unclear price breakdowns, and US: National patient experience Provider and Systems surveys (CAHPs),
incomplete procedure lists funded and overseen by Agency for
survey framework Healthcare Research and Quality (AHRQ)
CAHPs ask consumers and patients to
evaluate their experiences of health care
Number of hospitals reporting Hospitals convey price with services, which are accessible to all
on key statistical figures different terminology citizens cross the US.
Hospital Compare, a website with
healthcare quality information of over
4000 Medicare-certified hospitals across
1 US was created by Centres for Medicare
Price 1 Median
& Medicaid Services (CMS), which allows
Length of Min/mean/ consumers to easily assess quality of
12 stay 1 median/max
Number of hospitals from different aspects. One of
discharges Packaged data sources of Hospital Compare comes
10 price from hospital CAHPs.
8 9 50 th/90 th
percentiles The map displays star ratings from
Hospital Compare database.
Since 2011, the NHS UK: National patient experience
Hospitals selectively report on It is difficult to compare prices
National Quality
Board (NQB) agreed
survey framework
key parameters of surgical due to unstandardized pricing to guide the
procedures including price (all), terminology and reporting. measurement of
LOS (10/12), and volume (8/12). patient experience
across the NHS.
Patients are able to
Number of published quickly and easily
Several categories of access the star ratings
procedures across hospitals
treatment charges ranges from 12 to 29 of all NHS primary and
secondary care
medical centres and
hospitals.
Hospital Hospital Hospital
A B C Hospital Source: AHRQ, 35 Hospital Compare, 36 Leapfrog, 37 Babylon Health, 38 Hospital Advisor 39.
E
Doctor's fee N/A Hospital
Operating N/A N/A Hospital D 29 Singapore: National patient The patient satisfaction
survey is conducted annually
theatre C
Surgeon fee N/A N/A Hospital
Hospital 22 experience survey framework and overseen by Ministry of
B 19
Anaesthetist fee N/A N/A
A Health to assess the level of
13 patients’ satisfaction with
Hospital fee N/A 12
public health providers and
Total charge selected private providers.
The survey aims to assess
patients’ perceptions in
An unclear price breakdown for There is a large variation in relation to seven touchpoints:
surgical procedures across reported procedures across health professionals, care
hospitals makes it impossible to hospitals, ranging from 12 to 29. coordination, facilities,
waiting times and billings
draw “like for like” comparisons.
issues.
The survey results are
published on MOH website
for consumers to review.
Source: Singapore Ministry of Health, 40 CMS, 41 The Huffington Post42 Advisor. 41
42. 43.You can also read