THE LEADING MARITIME CAPITALS OF THE WORLD 2O19 - Menon Economics
←
→
Page content transcription
If your browser does not render page correctly, please read the page content below

THE LEADING
MARITIME CAPITALS
OF THE WORLD
2O19
A Menon Economics and DNV GL Publication
A Menon Economics and DNV GL Publication

Authors:                                                                              CONTENTS
Menon team: Erik W. Jakobsen, Sunneva Juliebø, Lars Martin Haugland, Håvard Baustad
DNV GL team: M. Shahrin Osman, Deepti Sewraz, Alina Villemin
                                                                                      EXECUTIVE SUMMARY                                       4
Design:
Ludvig Holmen                                                                         THE MARITIME INDUSTRY                                   8
Daniel Barradas

Photos: iStock                                                                        THE LEADING MARITIME CAPITALS OF THE WORLD              12

                                                                                      SHIPPING CENTERS                                        18

                                                                                      MARITIME FINANCE AND LAW                                24

                                                                                      MARITIME TECHNOLOGY                                     28

                                                                                      PORTS AND LOGISTICS SERVICES                            34

                                                                                      ATTRACTIVENESS AND COMPETITIVENESS                      38

                                                                                      THE LEADING MARITIME CITIES OF THE FUTURE               42

                                                                                      APPENDIX A: LIST OF OBJECTIVE INDICATORS OF 30 CITIES   44

                                                                                      APPENDIX B: METHODOLOGY AND DATA SOURCES                46
EXECUTIVE SUMMARY

     1                          2                         3                         4                        5
    SINGAPORE                HAMBURG                  ROTTERDAM                 HONG KONG                   LONDON

                                                                                                                                                      RANKING
     M       ore than half of the world’s population live in
             cities and it is predicted that two-thirds of the
     world population will be living in urban areas by 2050,
                                                                 each pillar, these come in the form of the perception
                                                                 and assessment by nominated business executives –
                                                                 mostly shipowners and managers – from around the
                                                                                                                           OBJECTIVE INDICATORS   SUBJECTIVE INDICATORS

     according to United Nations estimates. The impor-           globe. Of these 200 experts called upon for this study,
     tance of city regions will therefore continue to grow.      around 40% are based in Europe, 30% in Asia, and the
     Cities are the centers of knowledge, talent, innova-        remaining 30% are from America, Middle East and
     tion and specialization of production and services. In      Africa.
     today’s world, particularly for the maritime industry,         Singapore maintains its position as the leading
     cities are to an increasing extent competing to attract     maritime capital of the world. Despite the “new
     the best companies, startups and most talented              normal” economic conditions in traditional shipping
     people. The winners in this race for attractiveness         and the still weak offshore service market, Singapore
     are – and will continue to be – the leading maritime        has been able to retain its position as a world leading
     centers of the world.                                       maritime hub due to its strength in all pillars.
        Two years after its last publication, the 2019 edition   Singapore is still outperforming other cities in the
     of Leading Maritime Capitals report is back, with a         Shipping Centers, Ports and Logistics, Attractiveness
     fresh insight about which maritime capitals provide         and Competitiveness pillars, and for the remaining
     the best support, in terms of soft and hard infrastruc-     two pillars it is within the top 10 cities.
     ture and world-class talent, to allow maritime busi-           Whilst Singapore, Hamburg, London and Tokyo
     nesses and people to connect and thrive. Similar to         have maintained their previous ranking, other cities
     its previous editions, the LMC 2019 report covers 5         have seen an improvement in their overall score.
     pillars – Shipping Centers, Maritime Finance and            Dubai has climbed up by one rank and is now in
     Law, Maritime Technology, Ports and Logistics,              the 9th global position for leading maritime cities,
     Attractiveness and Competitiveness – on which the           followed by Busan which also saw a positive move in
     maritime cities are benchmarked. Under each pillar          its in score. It is, however, Rotterdam and Hong Kong
     a comprehensive set of objective and subjective indi-       that show the greatest development in their rank.
     cators have been considered. For the 2019 report,           Rotterdam has moved up three places and is now
     some new and more comprehensive objective and               ranked 3rd and Hong Kong, with a similar upward
     subjective indicators as well as data sources have          move, is now in the 4th position. Rotterdam has
     been used to ensure that the analysis is based on reli-     improved its score across all pillars, with the biggest
     able and complete data for the various cities, which        positive change in the Shipping Centers pillar, with
     ultimately allow for a more refined benchmarking            an increase in the size of its controlled as well as
     of the relative performance of each city compared to        managed fleet. The fleet controlled by owners based in
     the previous report. For the subjective indicators on       Rotterdam has increased by 50%, whilst the fleet size

4                                                                                                                                                                         5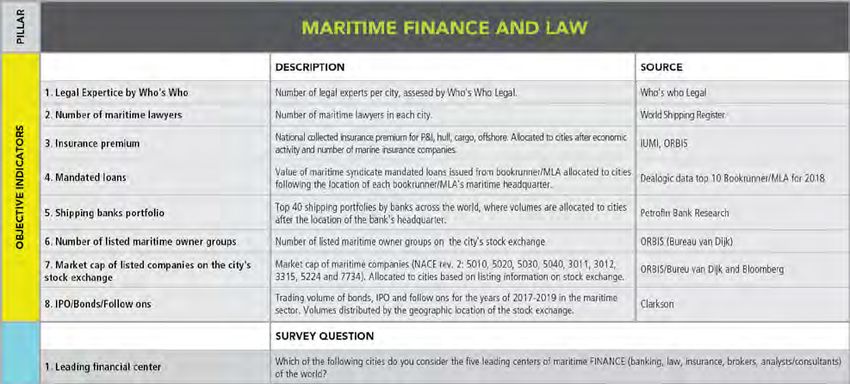
that is managed from there has grown by close to 60%.        experts voted Singapore, Oslo, Copenhagen and
    Rotterdam has moved up in the Maritime Finance               London to be the cities best prepared for the digital
    and Law pillar, largely due to a 50% increase in loan        transformation of the industry. Oslo has also forged
    value from 2017. Unlike Rotterdam, Hong Kong’s               its position as the world’s leading center for sustain-
    improvement has not been across all the pillars. Its         able technologies and solutions for the oceans.
    score has climbed up in three of five pillars; Shipping         Looking five years into the future, our experts still
    Centers, Maritime Finance and Law, and Ports and             predict that Singapore will keep its position as the
    Logistics pillars. Hong Kong is popular for its strong       global leader, while Shanghai is expected to increase
    infrastructure in promoting and supporting the ease          its importance and become the second most impor-
    of conducting shipping business there, with efficient        tant maritime city. The race to be the leading city in
    customs procedures. Hong Kong is ranked 2nd by the           Europe is still open with Oslo, London, Hamburg,
    industry experts as the most attractive location for         Athens and Rotterdam as the leading contenders in
    shipping operations. In terms of the number of listed        this regional race. In the Middle East, India and Africa
    maritime companies on their local stock exchanges,           region, Dubai is the leading maritime center and at a
    Hong Kong has also boosted its numbers since 2017,           global level, now ranked 9th. The experts predict that
    indicating that it is an attractive market for registering   Dubai will continue to grow in importance and could
    new stocks. When considering the trading volume of           be in the top five of the world’s most important mari-
    bonds, IPO and follow-on offerings from each city’s          time centers by 2024, albeit with strong competition
    stock exchange during the period 2017 to 2019, Hong          by the European cities as well as Hong Kong.
    Kong is in the 2nd position right after New York.
       An interesting observation is that most cities are
    ranked consistent across the objective and subjective
    indicators. Two cities stand out: Oslo and Tokyo. Oslo
    is ranked 2nd on the subjective indicators, but only
    10th on the objective (down 7 places). For Tokyo, the
    story is the other way around: 3rd on the objective,
    but only 11th in the subjective. The main reason for
    Oslo’s weak ranking on the objective indicators, is
    the lack of a substantial port, giving Oslo a 50th place
    on the Port and Logistics pillar. The same holds for
    Copenhagen, a city that is ranked 8th on the subjective
    indicators and only 16th on the objective. For Tokyo,
    the explanation is not as straightforward, because
    Tokyo is ranked lower by the maritime experts on all
    five pillars than on the objective indicators.
       The maritime industry is on the verge of a digital
    transformation including the adoption of disruptive
    and innovative technologies. The maritime industry

6                                                                                                                           7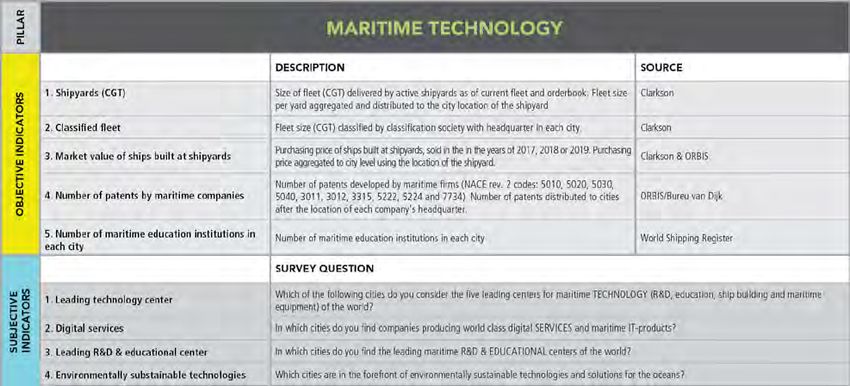
THE MARITIME
INDUSTRY
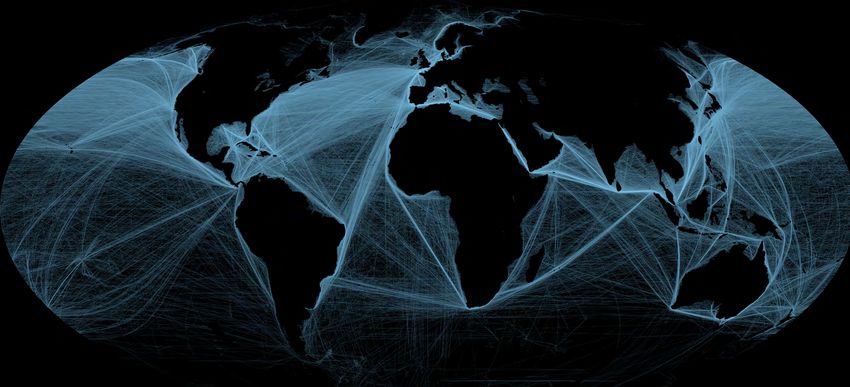
AIMING FOR AN EFFICIENT GLOBAL REACH of USD 12 144), while the Baltic Dry Index reached a level of 690 China, all serve as important remainders how fragile the inter- regional, often located around the shipowning companies. Ship
F
points in March 2019 after a relative volatile recovery from the national system is. What is clear, however, is that geopolitical finance was among the first to globalize, while legal services, due
or decades, the world economy has become increasingly inte-
record low level reported in February 2016 (a score of 291). The tensions and trade policies will continue to influence the industry to national jurisdictions, have been the most national of the mari-
grated with a shift of global economic power to emerging
offshore market is also characterized by a large part of the OSV going forward just as it has done for the last centuries. time services. English law firms have been the exception, with
economies. According to Peter Dicken, a British professor of
fleet in lay-up, and yards around the world are struggling to fill Transnational companies operate across the entire world, branches in shipping hubs all over the world, since English law
Economic Geography, a “global shift” (Peter Dicken, 2015) has
up existing capacity. With one of the largest bankruptcies in ship- taking advantage of economic differences by locating their busi- is commonly chosen as the jurisdiction in contracts of trade and
transformed the world economy. The main characteristics of
ping recorded in 2016, with South-Korean container giant Hanjin ness activities in the most attractive locations. This global trend chartering.
this shift are market integration, strong growth in international
Shipping filing for bankruptcy, other players in the shipping has been a key factor why world GDP has doubled since 1995 and Today, most maritime services are globalized. For example,
trade, foreign direct investments, the emergence of transnational
industry have been looking into consolidation and cost efficien- world trade has quadrupled. At the same time, it also represents the five leading classification societies class 82% of the world’s
companies and a dramatic increase in interdependence between
cies. In the past recent years, new alliances have occurred, with, a tremendous challenge to countries: it can no longer be taken for ships, and the two largest book runners for ship finance cover one
nations. Although the globalization process does not seem as
for example, German Hapag-Lloyd’s merger with the Middle granted that companies will stay in their home countries. To an sixth of the global market. Even port operations are becoming
straight-lined as it did some years ago, the world will continue
Eastern container shipping line United Arab Shipping Company increasing extent, states and cities must compete to attract and globalized. One of these companies is the Port of Singapore
to be highly interdependent and bound together by shipping and
(UASC), CMA CGM’s acquisition of Singapore’s national carrier retain international firms. In other words, they have to be attrac- Authority (PSA) that was corporatized in 1997. PSA is now one
maritime activities.
NOL/APL, and the amalgamation of the container segment of tive hosts. of the world’s largest port operators with operations in many key
Shipping has and will continue to play a vital role for interna-
Kawasaki Kisen Kaisha, Ltd. (K Line), Mitsui O.S.K. Lines, Ltd. Shipping has always been an international industry. In fact, markets.
tional trade and the division of labor. The growing demand for
(MOL), and Nippon Yusen Kabushiki Kaisha (NYK), to form the shipping is the premise for international trade. A central driver Partly as a contributing factor to, and partly as an effect of global
raw materials and goods in China and other emerging markets
new joint venture Ocean Network Express (ONE). for the global shift described above has been the operational and markets, maritime companies have also become globalized. For
lead to a commodity boom and shipping market bonanza in
The world in 2019 might continue a path of becoming increas- technological development of the shipping industry, which has example, the Swiss-based Mediterranean Shipping Company
the early 2000s. From 1995 until today, world GDP doubled
ingly integrated, but recent political events suggest that the world lowered transportation costs dramatically. With the emergence of (MSC) has a worldwide presence with close to 500 offices in 150
and world trade quadrupled. However, in the last few years we
might be heading in the exact opposite direction. For example, the standardized bulk carriers, oil and other raw materials could be countries and close to 25,000 employees. The structure of the
have seen both weak GDP growth and a weakened relationship
US threatening international cooperation and trade, the messy traded globally. Today most shipping markets, including cruise, companies varies greatly, but the dominant trend is to build corpo-
between GDP growth and demand for shipping services. The
and damaging disentanglement of Britain from the European offshore and car carriers, are globalized. Maritime services, rations around specialized business units with a global reach.
ClarkSea Index (measuring earnings for the main vessel types)
Union, and other political feuds between several countries and however, have until the last decade been relatively national or The John Fredriksen Group is a good example of this. The group
ended above USD 10,000 at the end of year 2018 (year average
8 9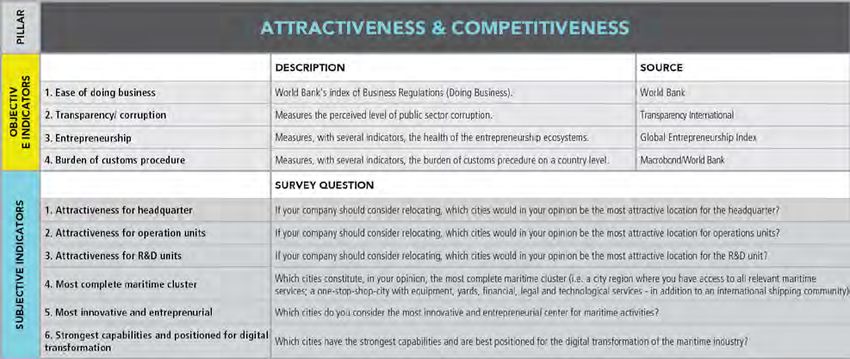
use of AI-powered algorithms for optimized stowage plans for
container ships.
With the force at which digitalization is propagating and newly
emerging disruptive technologies springing across the globe,
there is an increasing and critical need for a radical improvement
of the digital infrastructure for the maritime industry, and an
environment that supports the collaboration between maritime
companies, technology companies and progressive regulators
and assurance providers. A location that can offer this will have a
strong competitive edge.
ALTERNATIVE FUELS AND TECHNOLOGY
Global environmental concerns about the invasion of aquatic
organisms, GHG (greenhouse gases) and SOx emissions from
the shipping industry, have led the IMO in recent years to imple-
ment initiatives aimed at limiting the impact of these. As a conse-
quence, ballast water management has been implemented and the
carriage ban of fuel with more than 0.50% sulphur content will be
enforced as of 1st January 2020. Other potential game changers
in the maritime industry include the Tier III NOx requirement,
the stronger push for new vessels having improve EEDI (Energy
Efficiency Design Index), as well as measures for monitoring and
reporting of CO2 emissions from both the EU and IMO.
To navigate in such regulated waters, potential solutions have
become available in various parts of the world, whether from
scrubber manufacturers or providers of alternative fuels such as
consists of companies specialized in segments like rigs (Seadrill), tainties about the extent and momentum to which digitalization LNG. There is thus a need for countries and cities to provide an
crude carriers (Frontline) and dry bulk (Golden Ocean). The loca- will affect them, based on concerns related to the need to stand- infrastructure that supports such upcoming aspects of the mari-
tion of companies has also become globalized. Value chains split ardize digital practices, and the change of organizational culture time industry.
up, with headquarters located in financial centers, operating units and mindset. Considering this global view of where maritime industry is
close to markets, and R&D units in knowledge hubs. The group Under the umbrella of digitalization, we have assigned another heading (in terms of its global reach, its uptake of digitalized
is also an example of how some companies are broadening their hot topic in the maritime industry: cyber security. Vessels are and innovative solutions, its requirement for new fuels), there
focus to more than one specific segment. Both the Fredriksen becoming smarter constantly as they increase their connec- is a strong competition on which capitals around the world will
Group and A.P. Moller-Maersk Group are examples of groups tivity, control and most importantly their operation is based on provide the best support, in terms of soft and hard infrastructure
that focus on broadly diversified segments within the industry Operational Technology (OT). This provides tremendous benefits and world-class talent, to allow maritime businesses and people
– although Maersk has decreased their strategic scope recently. in terms of safety, availability, and energy efficiency, but at the to connect and thrive.
same time opens doors to cybercrime which is recognized as
DIGITAL TRANSFORMATION, CYBER SECURITY the biggest emerging challenge of the industry in 2017 alone, the
AND INNOVATION total cost of cyber threats to shipping is estimated at more than
1 billion USD. Cyber security is thus increasingly becoming an
Digitalization is happening across all industries and change the
integrated part of the safety topic of maritime companies, with
way we work and live. For the maritime industry, whilst disrup-
the strategic decision of many big maritime players to establish an
tive innovation is the current buzzword, its digital transforma-
Information Security Management System and seek compliance
tion is under way, challenging existing business models but also
to the robust ISO 27001 standards to build confidence among
offering new opportunities.
their stakeholders.
Digital capabilities are important in the entire maritime
In terms of disruptive innovation, the maritime industry has
industry, which is already seeing a trend whereby crew size is
already been introduced to it, whether in the form of additive
steadily decreasing, whilst software, automation, centralisation
manufacturing or as the concept of autonomous ships being
and interconnectivity are on the rise. Many maritime companies
operated remotely, to name a few. The port of Rotterdam will
are already quite technology-driven, with most of their bookings
have its own ‘Additive Manufacturing FieldLab’ with 3D metal
and orders coming through the internet, their internal processes
printers. This lab will provide port-related companies with a
based on digital solutions – and with some shifting to using block-
collective location to accelerate developments in this area and
chains to increase their operational efficiency and transparency –
to work together on applications for the maritime industry.
as well as their infrastructural and/or assets’ operations based on
Yara Birkeland, the world’s first fully-electric, zero-emission
cyber-physical systems (systems coupling digital software with
and autonomous container ship developed by Kongsberg in
hardware). To adapt to this new reality, some shipping compa-
collaboration with Yara, is due to be launched in 2020 and will
nies and maritime technology providers have a designated Chief
operate within Norway. Another upcoming area is the develop-
Digital Officer (CDO) on their management team. However, for
ment of algorithms for predictive maintenance and asset integ-
most other players in the maritime industry, there are still uncer-
rity, wider application of Drones for maritime sector and the
10 11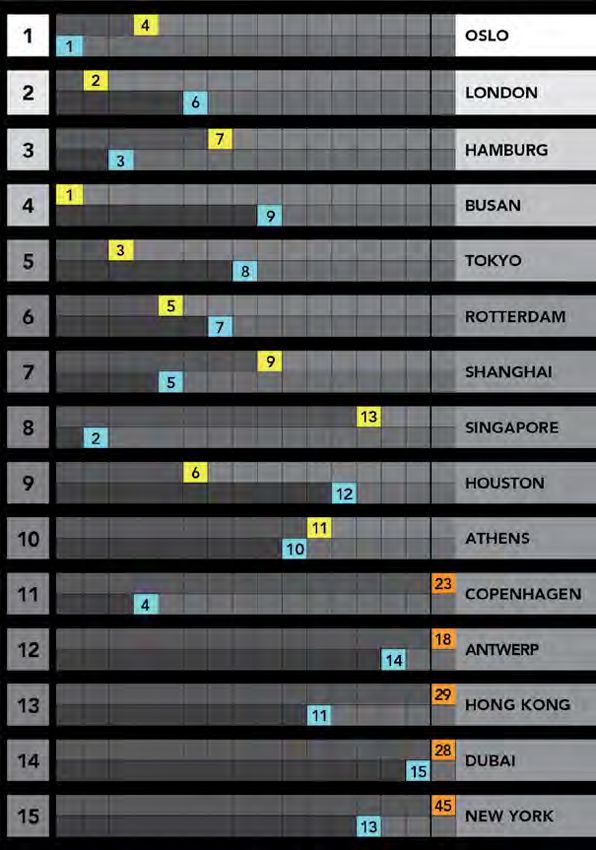
THE LEADING MARITIME
 CAPITALS OF THE WORLD

CITIES – ENGINES OF INNOVATION AND                                     generates more opportunities for interaction and communica-          to attract them. As the maritime industry is global in nature,              • Owners and headquarters
GROWTH                                                                 tion, promotes creative thinking, creates knowledge spillovers       many maritime companies are mobile entities seeking to take                 • R&D – product and technology development
                                                                       and develops new ideas and technologies. Cities also facilitate      advantage of localization advantages in different countries. This,          • Financial, legal and other sophisticated business services
U     rbanization is one of the strongest global megatrends in
      this century, with a clear shift in importance from nations
to cities (Moretti, 2012; Quartz, 2015). Today, more than half of
                                                                       trade and commerce by providing super market places. Hence,
                                                                       all knowledge-based industries tend to centralize in a few leading
                                                                                                                                            combined with the maritime industry being a high value-added
                                                                                                                                            industry, means that the fight to attract maritime companies               While many cities are important centers in today’s maritime
                                                                       city regions; San Francisco for ICT, Boston for biotechnology,       is tough, especially for shipping being the most highly mobile           industry, some researchers suggest that we might see a future
the world’s population live in cities. These cities generate 80% of
                                                                       Houston for oil & gas, London for finance – and Singapore for        sector within the maritime industry. This also implies that it is        concentration of shipping activity (Center for Liveable Cities,
global GDP (World Bank, 2017). In 2016, there were more than
                                                                       maritime. It is not, however, a “winner-takes-it-all” game. There    easy to lose maritime business activities. The gains from winning        2014). Martin Stopford was one of those who proposed that we
500 cities globally with more than 1 million inhabitants (United
                                                                       is room for cities with leadership in niches of industries, like     the location race are hence higher for the less mobile part of the       will see a development of two or three global centers characterized
Nations, 2017). China alone is home to more than 100 cities with
                                                                       Geneva in medtech, and London in fintech. There is also room         industry.                                                                as “shipping super cities” - one city in each of the eight-hour time
more than 1 million inhabitants, a number that is likely to double
                                                                       for cities with regional leadership, like Shenzhen in ICT and           Specialized knowledge-based services are probably the least           zones (Asia, Europe and the Americas). This will mean that some
in the next decade. Companies are increasingly focusing on city
                                                                       Singapore’s Biopolis for biomedical science.                         mobile companies in the maritime industry. The reason being              of today’s shipping centers will lose importance to a few global
regions when developing their strategies for relocation or expan-
                                                                                                                                            that knowledge-based companies often have links to universi-             centers that will act as shipping service hubs. Stopford also went
sion of their operations. Population projections show that virtu-
                                                                       MARITIME COMPANIES – RESTRUCTURING                                   ties and are deeply embedded in the local milieu; for example, in        further, dividing the cities into cargo port cities and shipping
ally all growth over the next 30 years will come in urban areas.
                                                                       WITHIN A GLOBAL PLAYGROUND                                           their reliance on specialized local competence. Another impor-           services ports. Port cities, such as Rotterdam and Shanghai, are
Every year the world’s cities are growing by 60 million people,
                                                                                                                                            tant point, following from the fact that firms increasingly split up     mainly driven by their role of transporting cargo to the regional
roughly equal to the current population of the United Kingdom.           Aware of such international competition, cities are developing
                                                                                                                                            their value chains, is that cities compete to attract activities – not   markets. In shipping services ports, on the other hand, the port is
   The influx and agglomeration of people, companies and invest-       strategies to enhance their attractiveness to highly productive
                                                                                                                                            companies. The winners in the future will be those cities that are       secondary while offering other services to the international ship-
ments is fueled by the vibrant knowledge-creation and innova-          and innovative companies, and to talented individuals. The more
                                                                                                                                            able to attract:                                                         ping industry will be key.
tion of the cities. High concentration of competent people in cities   mobile the companies, the stronger the competition among cities
                                                                                                                                                • Science and higher education
12                                                                                                                                                                                                                                                                                     13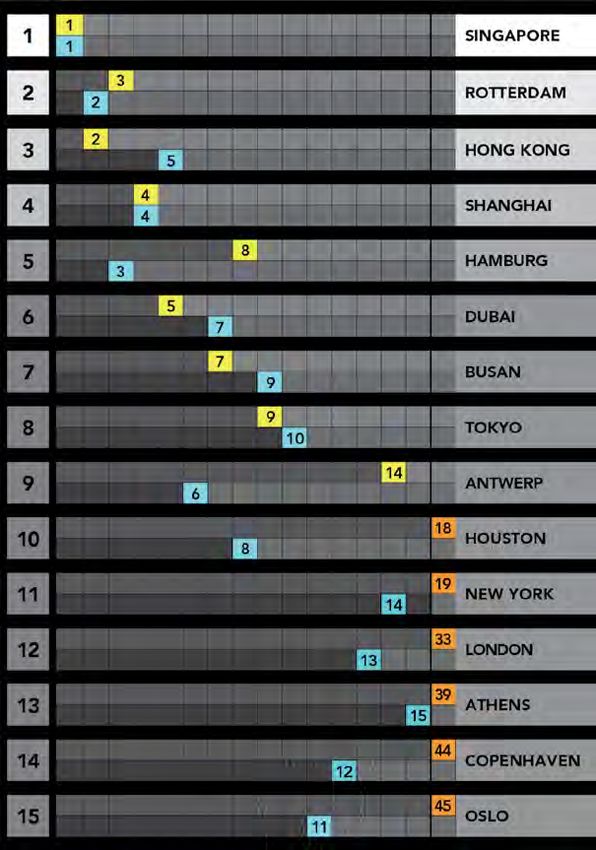
DRIVERS OF COMPETITIVENESS BENCHMARKING BASED ON OBJECTIVE &
For the maritime industry in a city to prosper, two conditions SUBJECTIVE INDICATORS
There are lots of inter-connected factors that drive the attrac-
must be satisfied: the companies must be competitive, and the city 50 NOMINATED MARITIME CITIES
tiveness of a city and the competitiveness of the industries located The Leading Maritime Capitals report for 2019 is the fourth
must be attractive as a host for these companies. These two condi- ORDERED BY RANKING ON THE
there: edition of this report. Again, the ranking was based on a combi-
tions are mutually dependent: the companies gain their competi- OBJECTIVE INDICATORS
• Strategic location nation of objective data from leading sources and subjective
tiveness from resources available in the city; for example, access to
• Favorable and stable political framework measures to assess and benchmark the 15 leading maritime cities.
capital, talent and specialized supplies – and the price they must SINGAPORE
• Transparent and efficient legal framework This approach offers the advantage of considering both hard facts
pay for these resources. Accordingly, the attractiveness of the city ROTTERDAM
• Proximity to large, demanding customers (objective indicators) as well as expert opinions (subjective indica-
increases when competitive companies are present in the city.
• Local rivalry – creates incentives to continuous improve- tors) in areas that are difficult to measure with available objective HAMBURG
Hence, the clue is to attract the winners (Jakobsen, et al 2003).
ments and innovation data at city level (such as regulations, cluster dynamics, techno- TOKYO
Over time, the attractiveness of the cities is gradually shaped by
• Abundance of suppliers and service providers logical expertise and other capabilities). LONDON
the dynamics of the industry. In an industry with strong cluster
• Specialized universities and research institutions One major difference (and improvement) in this year’s report SHANGHAI
dynamics, knowledge is continuously improved and dispersed,
• Large pool of talents compared to its previous editions is that the identification of HONG KONG
upgrading both companies and resources. Finally, governments
• Rich and open flow of knowledge and ideas the top maritime cities in the world is now carried out by using BUSAN
play a central role in defining the attractiveness of the city.
• Relationships based on trust a bottom-up approach, whereby all maritime cities in the world DUBAI
Through various public policy factors like taxes and subsidies,
• Meritocratic education and career system are initially considered before being narrowed down to the top 50 OSLO
they determine the price of capital, labor and other input factors.
• Soft location factors – an attractive place to live for families through several rigorous elimination and ranking rounds across NEW YORK
The quality of the resources is to a large extent determined by
and individuals the different pillars. In the previous reports, a top-down approach COPENHAGEN
investments in infrastructure, education and R&D.
was used which was based on the subjective nomination of top HOUSTON
The four main elements in the model, public policy factors, the
Together, these factors produce spirals of self-reinforcing 30 maritime cities in the world. The revised bottom-up approach ANTWERP
competitiveness of the companies, the attractiveness of the cities,
growth – or decline, if the factors are absent. The mechanisms instead allows for the objective selection of the top 50 maritime ATHENS
and finally, the dynamics of the industry clusters, are measured
that drive industry competitiveness are summarized in the model cities before the leading 15 cities are extracted for further ranking
and benchmarked for the maritime industry in 30 cities. MUMBAI
below. through the subjective assessment by nominated business execu- GUANGZHOU
tives from all around the globe. The main benefit is that this new SEOUL
approach is more transparent and comprehensive. Note that with HELSINKI
this year’s bottom-up approach, direct comparison of values KUALA LUMPUR
between 2019 and 2017 is not possible as some cities are out of
THEORETICAL MODEL OF INDUSTRIAL COMPETITIVENESS sample in the 2017 ranking. The approach is illustrated as follows:
ISTANBUL
BERGEN
Source: Jakobsen et al, 2003 (Attracting the winners)
MIAMI
DALIAN
NEW ORLEANS
ALL MARITIME CITIES IN THE WORLD
IMABARI
JAKARTA
COMPANY LOS ANGELES
COMPETITIVENESS SEATTLE
50 NOMINATED CITIES VANCOUVER
OPERATIONAL EFFICIENCY & - benchmarked on objective indicators only
PARIS
STRATEGIC RESOURCES
QINGDAO
GLASGOW
GENOA
PUBLIC POLICY
CLUSTER DYNAMICS BEIJING
Fiscal and monetary policy LONG TERM 15 LEADING MARITIME CITIES
KOBE
Demanding customers - benchmarked on both objective indicators and
RELATIVE
Tax & subsidies Local rivalry expert assessments MARSEILLE
Cooperation
INDUSTRY
Regulations
Open information and trust PERFORMANCE WASHINGTON D.C.
Labour market
Education Mobility of competence ABERDEEN
R&d
TIANJIN
NINGBO
CITY PANAMA CITY
ATTRACTIVENESS SYDNEY
LIMASOL
(Availability, quality and price)
HO CHI MINH
Talent, capital, infrastructure, connectivity,
business friendliness, living conditions, etc. STOCKHOLM
MANILA
SAINT PETERSBURG
DURBAN
VALLETTA
14 15
INDICATORS FOR CITY RANKING
       There are numerous ways to assess the strength of             ecutives – mostly shipowners and managers – from all
     the maritime cities. Data sources that are widely used          around the globe. Of these 200 experts called upon for
     and renowned in the industry have been used. Method-            this study, around 40% are based in Europe, 30% in
     ology and data sources for the indicators are described         Asia, and the remaining 30% are from America, Middle
     in the appendixes.                                              East and Africa.
       In this year’s report, for the objective assessment,             The study uses a ranking model consisting of objec-
     previously used objective indicators were revised to be         tive and subjective rankings that are weighted 50%
     based on new databases whilst new objective indica-             each. All indicators are normalized to allow compari-
     tors were also included. The overarching aim has been           sons of different data on a common scale. After nor-
     to ensure that the analysis is based on reliable, com-          malizing the data, an arithmetic average is used to rank
     plete and improved data quality for the various cities.         the different cities within five main pillars. Each pillar
     Hence, adjustments to the data sources and/or indica-           is weighted 20 percent. The five pillars of the study are
     tor set, where deemed necessary, have been made. For            the same as in the last edition of the report: Shipping,
     the five pillars in this study, a total of 25 objective indi-   Maritime Finance and Law, Ports and Logistics, Mari-
     cators have been used.                                          time Technology, and Competitiveness and Attractive-
       For the subjective assessment, this comes in the form         ness. The full list of indicators is described in these ta-
     of the perception and assessment by key business ex-            bles.

16                                                                                                                                 17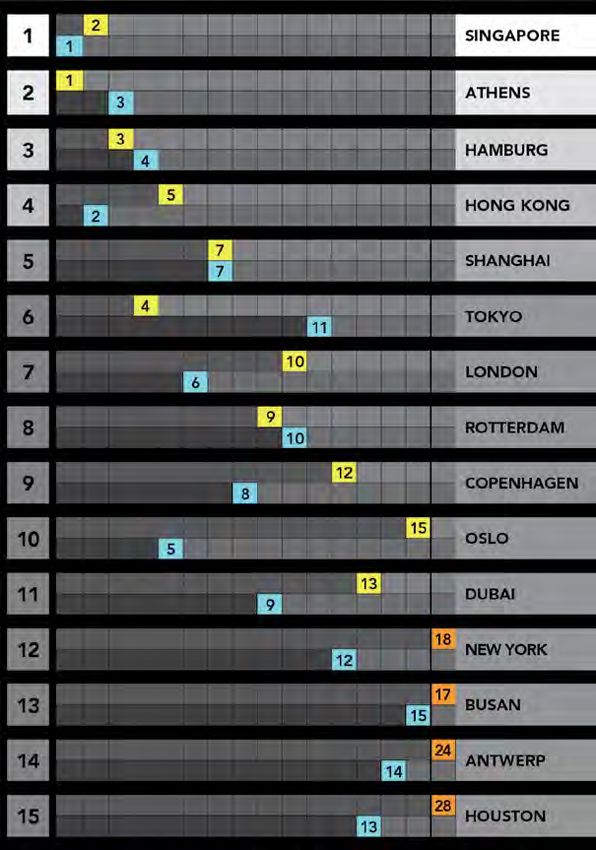
SHIPPING CENTERS                                                                                                “The maritime industry will transform; the
                                                                                                               liner & tanker industry will consolidate leading
                                                                                                                to merging of suppliers such that only the big
     SUMMARY                                                                                                      and efficient players or the small and highly

        1 2 3 4 5
                                                                                                                                innovative players will survive”

                                                                                                                                   – INDUSTRY EXPERT FROM SINGAPORE

     SINGAPORE          ATHENS                 HAMBURG               HONG KONG              SHANGHAI

       W       hen assessing the importance of the
               world’s shipping centers with an equally
       weighted combination of four objective indica-
                                                           have increasingly moved away from Europe,
                                                           and today many Asian cities are more impor-
                                                           tant for operations than traditional European
                                                                                                                       RANKING OF SHIPPING CENTERS
                                                                                                                              OBJECTIVE INDICATORS   SUBJECTIVE INDICATORS

       tors and subjective evaluations from 200 leading    centers. It should also be noted that European
       maritime professionals, Singapore, Athens and       ownership dominance is actually on a gradual
       Hamburg take the top three spots in the total       decline, as Asian shipowners have taken most
       ranking of the leading shipping centers. With       of the fleet growth in the last few years. Since
       Hong Kong and Shanghai coming next in the           2012 the European share of the world fleet (in
       ranking, this means that three of the top five      terms of GT) has fallen from 47 to 35%. Asian
       shipping centers are now located in Asia. This      owners on the other hand are increasing their
       is a change from the 2017 edition of this report,   market share and now control 41%, up from
       where European maritime cities were leading         38% in 2012. In particular, Chinese owners
       the top five.                                       have increased their share of the fleet and now
          A general observation for the shipping           own 12% of the world fleet.
       pillar is that the Asian-based maritime cities         Based on the objective indicators, Athens
       have either maintained the same ranking             and Singapore are the leading shipping centers,
       as the 2017 report (Singapore) or improved          followed by Hamburg and Tokyo. This ranking
       their ranking such as Hong Kong, Shanghai,          is, to some extent, aligned with what the experts
       Tokyo and Busan. In Europe, it is only Athens       say, with Singapore and Hong Kong in the lead,
       and Rotterdam that have moved up in their           followed by Athens and Hamburg. The main
       ranking, with the biggest improvement by            difference lies with Tokyo, which is subjectively
       Rotterdam which moved four places up. Most          ranked 11th. This is possibly due to Japanese
       of the leading maritime cities in Europe in this    owners being focused on local cooperation
       ranking have suffered a downgrade, such as          instead of having a global outlook. Shanghai is
       Hamburg, London and Oslo.                           ranked as the 5th strongest shipping city in the
          Globally, there has been a 9% rise in the        world, with an equal score both on the subjec-
       world’s fleet value since 2016. The world’s total   tive and objective criteria.
       fleet value is concentrated in the US, Japan,          Singapore’s strength lies, to a large extent,
       China and Greece whilst Europe currently            in its geographic location with close proximity
       remains an important center for shipowners,         to important markets. The city is a key market
       with roughly 40% of the world fleet value being     place for shipping with an important center
       controlled by owners based there. However,          for commercial management. Our industry
       whilst Europe has historically been domi-           experts rank Singapore highest, while the city
       nant when it comes to ownership, operations         scores slightly weaker on the objective criteria.

18                                                                                                                                                                      19
“The ability to develop technology that
will meet the new requirements imposed
by environmental challenges and changing
regulatory framework”
– INDUSTRY EXPERT FROM OSLO
EXPERT ASSESSMENT London, Hong Kong, Hamburg and Oslo should as the most attractive location for shipping
they be given the choice to relocate their operations and is in 3rd position when it comes
Still Singapore keeps its position as the leading ship- When measured at city level, the worlds’ fourth For the shipping pillar, the expert panel identi- companies’ headquarter. This ranking is slightly to attracting shipping companies’ headquarter
fied Singapore, Athens and Hong Kong as the different when it comes to choosing a city for for relocation.
ping center in the world. Singapore is home to the third largest fleet is controlled by owners in the Hamburg
overall three leading cities. This is a change from operating their fleets and companies; Dubai and Athens is placed 3rd on the subjective ranking.
largest fleet in the world (at city level), while the second region, making it an important shipping hub in Europe. the 2017 analysis since Hong Kong and Athens Shanghai are in the top 5 preferred locations, Greek shipowners have been important in the
largest fleet is managed from the city. This demonstrates Industry experts also rank Hamburg as one of the five were not perceived to be in the top 4 as shipping displacing London and Oslo. shipping industry for decades and the country
the strength in operational capabilities in the city. One leading shipping centers of the world. Despite this, the centers, with their positions formerly taken by Singapore has a strong position, both com- used to be home to key industry players such as
of the industry experts highlights that the presence value of the German fleet has fallen over the last years. Hamburg and London. Oslo, Dubai, New York mercially and operationally, and is also an Aristotle Onassis and Stavros Niarchos. Greece’s
and Busan have also fallen slightly in their overall important meeting place for shipowners even if shipping magnates have emerged largely un-
of many foreign owners in the city. This illustrates Owners in Hamburg have focused on container ship-
ranking as shipping cities by the industry experts. many of them are not originally from Singapore. scathed from the country’s financial crisis and
Singapore’s global attractiveness. At the same time, it ping, a segment that has seen low rates and large bank- This new perception from the industry experts An important reason for Singapore’s popularity is one of the industry’s longest downturns. Today,
could also be a sign of vulnerability, because foreign ruptcies during the last years. The shipowning commu- about the ranking of these maritime cities is due its stable pro-business environment. In the recent the shipowning environment is still strong, even
companies probably are more footloose than domestic nity is also not very strong, the reason for this being that to various factors as explained below. editions of the World Bank’s “Ease of doing though many of the Greek shipowners run their
companies. most of their fleet has been financed through KG struc- When considering the breakdown of the Business” Index, only New Zealand has been business from other cities.
Athens’ strengths lie in an impressively large and tures, leaving the individual owners with little control industry experts’ assessment for the shipping ahead of Singapore.
pillar, it is seen from Figure 1B that the preferred Hong Kong has achieved an overall 2nd posi-
strong shipowning community. Athens is home to the over the fleet. The KG structure is a limited partnership
maritime cities for all key shipping activities (i.e. tion by our experts, which is a clear improvement “The upcoming years in the industry
world’s largest fleet and has a strong ownership posi- with typically the sole general partner being a limited ownership, operations and management) are from the previous report. Hong Kong is popular
will see continual growth of maritime
tion with more than 700 Greek shipowners located liability company. It can thus combine the advantages Singapore, London, Hong Kong, Hamburg and for its strong infrastructure in promoting and
shipping industry and shipowners in
both in Athens and around the world. Many Greek of a partnership with those of the limited liability of a Oslo. Of the expert pool used in this study, those supporting the ease of conducting shipping busi-
Asia, compared with the rest of the
shipowners are in cities outside of Greece, something corporation. This could be one of the reasons why rela- business executives with strong insights in ship- ness there, with efficient customs procedures.
ping indicated they would prioritize Singapore, Hong Kong is ranked 2nd by the industry experts world”
that can explain why Athens only ranks third on the tively few companies would consider relocating their
subjective indicators, while it is number one on objec- shipping headquarter to Hamburg. – Industry Expert
tive indicators. Furthermore, Athens is being perceived Rotterdam has moved up in the ranking this year, due
as primarily serving the local Greek shipping companies to its improved score on the objective criteria. Rotterdam Fig. 1A - Percentage of industry experts that rank Fig. 1B - Preferred city for relocation of
the cities as top-five within shipping activities headquarter or operations. Number of shipping
and not international shipping entities and hence the has benefitted from an increase in the size of the fleet that Source: Menon (2019)
companies selecting each city
experts have voted for other shipping centers that are is controlled as well as managed from the city; the fleet Source: Menon (2017) With Hong Kong and Athens pushing ahead in
% of industry experts selecting each city % of industry experts selecting each city
the experts’ assessment, Hamburg and London
taking a dominant regional or global role in interna- controlled by owners based in Rotterdam has increased
100
10
20
30
40
50
60
70
80
90
100
are now subjectively ranked 4th and 6th. The
0
10
20
30
40
50
60
70
80
90
0
tional shipping. Greek shipowners have played a key role by 50% whilst the fleet size that is managed from there SINGAPORE drop behind London’s subjective ranking could
SINGAPORE
in the industry for decades, and they are still expected has grown by close to 60%. ATHENS LONDON also be due to the perceived effects of Brexit.
to be a strong player also in the future. This view can HONG KONG HONG KONG Over the past few years, industry experts have
be strengthened by looking at the development in order- HAMBURG HAMBURG been acknowledging Dubai as having a strong
OSLO position in the shipping pillar. When asked about
book volume for Greek shipowners located in Athens, OSLO
LONDON the current leading shipping centers, Dubai is
in terms of CGT. The contracted orderbook volume has SHANGHAI
DUBAI
ranked 11th but 6th if shipping business execu-
COPENHAGEN
more than doubled each year since 2016. Thus, Greek COPENHAGEN tives were given the choice of relocating their
SHANGHAI
shipowners in Athens have experienced an outstanding TOKYO companies’ headquarter. Dubai’s best score
ROTTERDAM
exponential growth in contracted CGT-values the last ROTTERDAM
NEW YORK
in the shipping pillar is however from industry
DUBAI experts ranking it 3rd relative to other leading
few years. ATHENS
NEW YORK maritime cities for the operations of a shipping
ANTWERP LIMASOL
business. This suggests that Dubai is seen as an
HOUSTON ANTWERP
HQ
attractive location for shipping activities and
BUSAN TOKYO
Operations might be a growing center for shipping in the
OTHER CITIES GENEVA
future.
20 21OBJECTIVE INDICATORS’ ASSESS- In addition to ownership, the size of the fleet more than USD 487 bn which is about half of the
MENT managed from the different cities were also world fleet’s value. This share illustrates how im-
considered. For an international industry like portant these 15 cities are in the global world of
To be recognized as a leading center for ship- the maritime business, ownership and manage- shipping. Tokyo and Athens have increased their
ping, a city must be the registered home to a ment of companies can easily be split up to take fleet value from 2017, whilst a drop in fleet value
strong number of shipowners and managers, advantage of specialized local competence in is observed for Singapore and New York, possibly
both in terms of their fleet size as well as fleet different cities. For example, in Singapore, whilst as a result of a decrease in their fleet size either
value. The number of shipping companies that its shipowners control a fleet of 45 million CGT, through the sale or the scrapping of ships.
chose to have their headquarters in a particular the city is of such importance for the manage- The composition of the merchant fleet differs
city will further impact this city’s ranking in ment of other fleets that the figure is almost between cities. Athens might be best known
our benchmarking assessment of the objective 60% more when measured in terms of managed for being home to a large tanker fleet, but the
indicators for the shipping pillar. These objective fleet. An even stronger effect is seen in Busan; city also has a substantial fleet within the bulk,
indicators rank Athens first due to its position as the city manages a fleet that is more than four container and gas carrying segment. Tokyo has
a city controlling and managing the largest and times as large as the owned fleet. Similar effects a well-diversified fleet consisting of bulkers,
most valuable fleet. Singapore comes second, are observed in Vancouver, Limassol, Glasgow tankers, ro-ro vessels and gas carriers. Hamburg
while Hamburg ranks third. and Manila. is quite specialized within containerships, while
As of March 2019, the world orderbook in It can also be noted that whilst New York plays Singapore has its strength within tankers,
terms of GT is dominated by Japanese, Chinese a key role in financing maritime operations, its bulkers, offshore and containerships.
and Greek owners. When considering the commercial and operational capacity is weak.
number of ships on order, the leading owners’ The fleet managed from New York is only 40% NUMBER OF SHIPPING HEADQUARTERS
country are Japan, China, Singapore, Norway of its controlled fleet. Such weak fleet managed
and Greece. This suggests that, from an objec- to fleet controlled ratios are also observed in The location of shipping companies is a strong
tive point of view, Athens is likely to keep its Seoul, Tokyo, Imabari and Oslo. indicator of a city’s attractiveness. Figure 4
position as a significant ownership city, while shows the number of shipping companies with
the importance of both Tokyo and Shanghai will VALUE OF CITY-CONTROLLED FLEET headquarters in each city. Athens is ahead of all
continue to rise. other cities for this indicator with 193 shipping
Another means of benchmarking the cities is by companies registered there, followed closely by
SIZE OF SHIPOWNERS’ FLEET AND MAN- considering the value of the fleet controlled from Singapore and Jakarta. Next in line, but with a
AGEMENT OF FLEET these cities. As opposed to the size of a fleet, drop of almost half of the amount of shipping
the value of the fleet offers a better reflection companies that are headquartered in Athens
In Figure 2, cities are ranked by the total fleet of its economic importance. This evaluation are Hamburg and Tokyo. Rotterdam, Istanbul,
in compensated gross tonnage (CGT) based on is based on data from Clarksons World Fleet Dubai have on average 66 shipping companies
owners located there. Data was compiled for Register and estimating the value of share of the headquartered there. It should be emphasized,
the entire world fleet and vessels were then as- fleet controlled from the city out of its nation. however, that although only companies with
signed to individual cities where their owners are Globally, there has been a rise in the world’s fleet at least 5 ships are included, cities with many
located. Athens comes out strongly in the first value in the past recent years, with USD 873 bn small companies are favored on this indicator
position, with an owned fleet of 97 million CGT, in 2016 compared to USD 951 bn as of March compared to cities with few but large companies.
followed by Tokyo, Singapore and Hamburg each 2019. The world’s total fleet value is concen- Copenhagen, with the A.P. Møller-Mærsk head-
of which have only half this amount. By looking trated in the US, Japan, China and Greece whilst quarter, falls weak on this indicator.
at owners located in a city and not at a country Europe currently remains an important center for
level, hubs like Singapore and Hong Kong will shipowners, with roughly 40% of the world fleet
increase their relative importance. National value being controlled by owners based there.
numbers will generally include several shipping At a city level, as shown in Figure 3, the top
communities located within a country. 15 cities in this ranking control a fleet valued at
Fig. 2 - CGT owned by shipmanagers registered Fig. 3 - The 15 most valuable fleets in the world. Fig. 4 - Number of listed shipping companies with
in the city / Size of fleet (CGT) controlled by Value in Bill USD of the fleet controlled by headquarters in the city
shipowners registered in a city companies with headquarter in the city Source: Bureau van Dijk (2017)
Source: Clarksons/ Menon (2019) Source: Clarksons/ Menon (2019)
Million CGT USD bn
100
100
100
120
140
160
180
200
10
20
30
40
50
60
70
80
90
10
20
30
40
50
60
70
80
90
20
40
60
80
0
0
0
ATHENS ATHENS ATHENS
SINGAPORE TOKYO SINGAPORE
HAMBURG HAMBURG JAKARTA
HONG KONG SINGAPORE HAMBURG
TOKYO SHANGHAI TOKYO
LONDON MIAMI ROTTERDAM
SHANGHAI OSLO ISTANBUL
DUBAI IMABARI DUBAI
BUSAN COPENHAGEN IMABARI
COPENHAGEN SEOUL HONG KONG
ROTTERDAM NEW YORK SEOUL
ISTANBUL ROTTERDAM LONDON
JAKARTA LONDON SHANGHAI
Managed MARSEILLE BUSAN
LIMASOL
Owned
MUMBAI BERGEN MUMBAI
22 23MARITIME FINANCE AND LAW “Funding accessibility seems to be progressively
shifting to the Far East and is expected to remain
as such whether China (through Hong Kong
SUMMARY or Shanghai) will start putting local content, or
1 2 3 4 5
in-country value assessments to access the funding.“
– INDUSTRY EXPERT FROM HAMBURG
LONDON NEW YORK OSLO HONG KONG SINGAPORE
RANKING MARITIME FINANCE AND LAW
O verall, London is ranked first in the world
for maritime finance and law, followed by
New York, Oslo, Hong Kong and Singapore.
the world’s two leading shipping banks and has
a strong position with a maritime focused stock
exchange and leading insurance and brokering
OBJECTIVE INDICATORS SUBJECTIVE INDICATORS
London has a special position in the financial entities.
industry globally and is widely recognized for In ship financing, whilst Rotterdam is behind
its law-related and marine insurance services. Oslo, it is still considered a leading city in this
It is home to world-leading institutions, such aspect, with a 50% increase in loan value from
as Lloyd’s for insurance, and English law is 2017. Rotterdam-based banks ING and ABN
the most widely applied in shipping disputes. AMRO have boosted their position for both
New York, Hong Kong and Singapore together bookrunner loans and in their MLA (Mandated
with London, are considered the four leading Lead Arranger) portfolios.
global financial cities according to the Global Following the recent shipping crisis, Asian
Financial Centres Index. (particularly Chinese banks) have emerged in
When it comes to maritime finance, our data ship finance and as of today, three out of global
rank New York first, followed by Oslo. New top ten banks are now Chinese banks (e.g. Bank
York is home to the world’s largest maritime of China, ICBC, China Exim). When assessing
stock exchange and plays a key role in financing top shipping portfolios by banks headquartered
maritime operations. In the last few years, the in various cities across the world, Beijing is the
importance of private equity in the industry has top performer, followed by Tokyo, Paris, Oslo
increased at the expense of traditional shipping and Rotterdam.
banks, and New York based institutions have According to the industry experts, there
played a key role in this development. There seems to be four cities that stand out for mari-
seems to be a roll back now with banks again time finance – London, Oslo, New York but
playing the major role in financing. In terms of also Singapore. They ranked Singapore as the
the number of listed maritime companies on second most important city even though on
their local stock exchanges, Hong Kong, Tokyo the objective criteria Singapore is in the 9th
and Shanghai have also boosted their numbers position, behind Rotterdam, Hong Kong and
since 2017, indicating that they are attractive Shanghai.
markets for registering new companies (IPOs).
Oslo’s strong position in maritime finance is
mainly due to Norway’s strong historical posi-
tion in the maritime industry and the develop-
ment of world leading financial services that
have supported this industry. Oslo is home to
24 25EXPERT ASSESSMENT LEADING FINANCIAL CITIES and Shanghai. Singapore, in the 5th position, and investment programs, Chinese lenders, leading city with the highest number of maritime companies insure both the cargo and the hull of
traded almost half of what Oslo achieved during leasing institutions and export-import agen- lawyers, followed closely by New York and the ship.
Maritime activities tie up large amounts of Maritime cities have been benchmarked based the same period. cies are quickly filling a critical void left by the Athens. Whilst Athens is home to 60 maritime To assess a city’s position in terms of its repu-
capital. The industry is characterized by cyclical on the market value and the number of listed retreat of European commercial banks, especially lawyers, Singapore, Hamburg and Hong Kong tation as a market place for insurance coverage
markets. Hence, access to capital will determine maritime companies on their local stock ex- BANKS – SHIP FINANCING for newbuilding orders. Prior to the shipping have an average of 30 such lawyers. and its marine insurance services, several factors
the long-term success of many companies. changes. New York is by far the largest equity crisis European banks dominated in global ship What these statistics show is that, with English were considered such as concentration of P&I
Companies finance themselves by offering market in the world for maritime stocks, both in Whilst New York stands out as the leading financing sector. Five out of global top ten were law far widely used in shipping disputes, London clubs and the collected insurance premium
bonds, loans and stocks to owners and other number of tradable stocks and market capitaliza- financial capital of the world, in Europe, Oslo and in Germany, two in Scandinavia, one in the UK, has sealed its position as the best location to at city level, and the presence of commercial
financial entities. London, Singapore, Oslo and tion of the companies. Rotterdam seem to be the two leading cities for one in France and only one was based in Asia. resolve maritime disputes and for international insurances covering cargo, hull and machinery
New York remain the clear leaders within this Compared to the 2017 results, Oslo has main- ship finance. Oslo-based DNB and Nordea (ship- However, with the crisis many traditional lenders maritime arbitrations. In that aspect, Singapore (H&M). This assessment shows that London,
field, according to the industry experts, due to tained its second position when it comes to the ping division) are the two leading ship finance experienced heavy hits on their P&L and were and Hong Kong could be London’s strongest home to the first marine insurance company in
their strong positions in banking, law, insurance number of tradable stocks. Hong Kong, Tokyo banks measured in terms of book runner and forced to write-off, reduce or even exit their ship- competitors. In Singapore, the efforts of the the early 18th century with Lloyd’s of London
and brokering services. The main difference in and Shanghai have boosted their numbers since MLA (Mandated Lead Arranger) portfolios. In ping portfolios. Due to the shipping crisis, Asian Singapore Maritime Foundation (SMF) to de- and complemented by the International
the experts’ opinion compared to the previous 2017, indicating that they are attractive markets Rotterdam, the banks ING and ABN AMRO have (particularly Chinese banks) have emerged in ship velop the city’s own Ship Sale Form and SMF’s Underwriting Association (IUA), continues to
assessment is that Tokyo and Dubai are now for registering new stocks. Singapore which was boosted their position for both bookrunner loans finance and as of today, three out of global top involvement in the development of a modern be the unrivalled city for marine insurance with
judged to be better in the maritime finance and previously ranked third, has now dropped to the and in MLA. BNP Paribas, based in Paris, is a new ten banks are now Chinese banks (e.g. Bank of Charter Party Form together with BIMCO and more than 50% of International Group (IG)
law pillar, whilst Athens, Houston and Busan 7th position in a tie with Kuala Lumpur, noting entry, whereas New York is losing its position, China, ICBC, China Exim). When assessing top Association of Shipbrokers and Agents (ASBA) of P&I clubs covered gross tonnage served by
have dropped in this subjective assessment. that Kuala Lumpur, Busan and Mumbai have with Citi falling on both bookrunner and MLA. shipping portfolios by banks headquartered in incorporating Singapore as the location of UK-based clubs, over 30% of global cargo and
maintained the same number of tradable stocks Danske Bank in Copenhagen has also fallen in various cities across the world, Beijing is the top arbitration (in addition to New York and London), H&M premium collected by UK-headquartered
OBJECTIVE INDICATORS’ ASSESS- since 2017. bookrunner loans while Stockholm-based SEB performer, followed by Tokyo. Considering that reflects the growing importance of Singapore insurance companies and the highest number of
MENT In terms of market capitalization of maritime has improved its position in MLA. the recent slowdown in the Chinese economy as a leading international maritime legal center. representation offices of all clusters. However,
stocks, Shanghai and Copenhagen have main- Many ships are financed by syndicated loans, and with fewer newbuilding orders, it is ex- The strength of both Singapore and Hong considering the recent acquisition of rival Jardine
Eight objective indicators were chosen to bench- tained their 2nd and 3rd ranks, respectively, after which reduce the risk for the individual lenders. pected that the financing from banks based in Kong seems to be related to their proximity Lloyd Thompson (by Marsh’s parent company
mark the leading maritime financial and legal New York, even though there was an overall In this process one bank usually functions as the the Far East may also be affected. to commercial operations and access to key Marsh & McLennan Companies), there might be
centers. These indicators measure the volume reduction in their values from 2017. On both mandated lead arranger. That means that the industry players, with Hong Kong positioned as a an impact on future ranking for London as the
of legal and financial expertise and associated these two exchanges, one or two major compa- bank has the leading role in the financing stage LEGAL CENTERS gateway to mainland China. In the Middle East, company is now headquartered in New York.
activities in each selected city – from the number nies dominate the value of maritime stocks. In of a project. During the syndication process one whilst not a direct challenger to London, Dubai There is already a positive development for New
of maritime legal experts rooted in each location Shanghai, China Shipbuilding Industry combined of the banks may also fulfil the role of book To assess the strength of cities when it comes is also building its reputation as a maritime legal York; the city has shifted three levels up from our
to the volume of mandated loans issued from the with Shanghai International Port Group, has a runner. When the structure and terms of the to maritime law, the use of statistics such as the center. The Emirates Maritime Arbitration Centre previous report and is now in the 4th position
financial institutes and companies that provide combined market capitalization of USD 43.5 bn, loan have been agreed, one (or a number) of number of leading legal experts in shipping law (EMAC) was launched in 2016 and aims to serve behind Tokyo and Singapore.
financing (debt, equity, mezzanine) for the in- while A.P. Møller-Mærsk A/S traded at a total banks will be appointed “book runner” and as well as the number of maritime lawyers from as the first specialized marine arbitration center Out of Asia, Tokyo and Shanghai have
dustry, primarily for the sale and purchase of ves- value of USD 26.5 bn on the stock exchange in sell the loan to other banks in the syndicated the broader maritime sector give an indication in the Middle East. maintained their positions in the top 5, with
sels. These companies also include international Copenhagen. That is approximately the same loan market. In some markets national export of a city’s importance for financial and legal their focus being mainly on domestic clients.
and investment banks, private equity firms as value as world-leading companies in other indus- credit banks also play a key role in the financing transactions. Strong knowledge centers with MARINE INSURANCE Singapore has dramatically improved and is now
well as smaller boutiques, which act as arrangers tries such as Kraft Foods and Hyundai Motor. It process. Oslo is the most important center in the many experts also attract more business to a city. ranked 3rd in this indicator, possibly as a result
or introducers of capital. Data on the number of is also observed that Oslo suffered a 30% drop world for this kind of financing. Both Nordea and Who’s Who Legal, which identifies the foremost Marine insurance was the earliest well-developed of its efforts to increase its marine insurance
listed maritime companies, and volume of traded from its 2017 market value mainly because of DNB have their shipping headquarters located in legal practitioners in business law based upon kind of insurance, with origins in the Greek and activities by introducing its own Singapore War
bonds, IPO and follow-ons from stock exchanges the decline in the offshore industry, for example Oslo, with regional offices in maritime cities like comprehensive and independent research, shows Roman maritime loan. Marine insurance in the Risk Mutual supported by its industry association
headquartered in each city was also used as an among seismic service companies like PGS and London, New York, Singapore and Shanghai. that London, by far, has the largest number of modern world is a prerequisite for a functioning (Singapore Shipping Association, SSA).
objective indicator. subsea construction, like Subsea 7. leading legal experts (81) in maritime law. Behind shipping market. Large shipping companies
When considering the trading volume of However, in general, with traditional European London are Hamburg, Singapore, New York and transport cargo worth hundreds of millions
bonds, IPO and follow-ons from each city’s stock banks gradually cutting back on ship financing Hong Kong with an average of 20 such legal of dollars every day on large ships that them-
exchange during the period 2017 to 2019, New and with owners increasingly looking for experts. When considering the broader maritime selves might be as valuable as their cargo. To
York is leading, followed by Hong Kong, Oslo alternative ways to finance their fleet renewal sector, statistics show that London remains the reduce risk involved in such operations, shipping
Fig. 5 - The five leading maritime financial and Fig. 6 - Market value and number of listed maritime companies on local stock exchange Fig. 7 - IPO/Bonds/Follow-ons during the period Fig. 8 - Shipping banks portfolio Fig. 9 - Number of leading maritime legal experts
legal centers, according to industry experts Source: Clarkson and ORBIS/Bureu van Dijk and Bloomberg
2017 to 2019 (green) and laywers (blue) practicing in the city
Source: Menon (2019) Source: Menon (2019) Source: Petrofin Bank Research Source: Who’s Who and World Ship Register
% of industry experts selecting each city bn USD bn USD bn USD
100
100
100
10
20
30
40
50
60
70
80
90
10
20
30
40
50
60
70
80
90
10
12
14
16
18
20
10
20
30
40
50
10
20
30
40
50
60
70
80
90
0
0
0
2
4
6
8
0
0
LONDON NEW YORK 90 NEW YORK BEIJING LONDON
SINGAPORE HONG KONG
OSLO SHANGHAI 35 TOKYO HAMBURG
OSLO
NEW YORK SHANGHAI
COPENHAGEN 8 PARIS NEW YORK
HONG KONG
SINGAPORE
HAMBURG LONDON 16 OSLO SINGAPORE
DUBAI
SHANGHAI
TOKYO 37 BUSAN ROTTERDAM HONG KONG
TOKYO
LONDON
ROTTERDAM
BUSAN 27 MUMBAI SEOUL ATHENS
ATHENS
COPENHAGEN
DUBAI SINGAPORE 25 NEW YORK SYDNEY
COPENHAGEN TOKYO
OSLO 52 SYDNEY COPENHAGEN GENOA
ANTWERP
HOUSTON MANILA
DUBAI 2 LONDON DUBAI
Legal Maritime Experts
BUSAN ATHENS
Maritime Lawyers
OTHER CITIES HONG KONG 47 JAKARTA STOCKHOLM OSLO
26 27
8You can also read