Chance or Ability? The Efficiency of the Football Betting Market Revisited
←
→
Page content transcription
If your browser does not render page correctly, please read the page content below
Munich Personal RePEc Archive

Chance or Ability? The Efficiency of the
Football Betting Market Revisited

Gross, Johannes and Rebeggiani, Luca

FOM University of Applied Sciences, Fraunhofer FIT

June 2018

Online at https://mpra.ub.uni-muenchen.de/87230/
MPRA Paper No. 87230, posted 15 Jun 2018 13:23 UTC
Chance or Ability? The Efficiency of
   the Football Betting Market
            Revisited

                               Johannes Gross
                              Luca Rebeggiani*

                              This Version: June 2018

Keywords: Gambling, Sports Betting, Market Efficiency
JEL-Classification: G14, L83, Z2

*Corresponding author
Fraunhofer FIT and FOM University of Applied Sciences
Schloss Birlinghoven
D-53754 Sankt Augustin
luca.rebeggiani@fit.fraunhofer.de
Abstract
The extent of market efficiency induced by rational behaviour of market participants
is central for economic research. Many economists have already examined sports-betting
markets as a laboratory to better understand trading behaviour and efficiency of stock
prices while avoiding to jointly test the hypothesis of a correct capital market model.
The following paper will investigate whether the European football betting market fulfils
the efficiency paradigm introduced by Fama (1970) with a unique dataset allowing for
an investigation of the German betting market in view of its regulatory changes recently.
The analysis contributes to the literature by conducting a variety of empirical strategy
including rational expectation frameworks and an ordered choice model to stress the ex
post market performance from a weak and semi-strong form perspective. In view of
existing market distortions as taxes, switching costs of changing betting providers and
limitation in competition, the results of the analysis are indicative of a rational market
equilibrium surprisingly close to the efficiency benchmark.1
1
The analysis is based on a dataset provided by Sportradar. We are grateful to the whole Sportradar
team for their support. We also gratefully acknowledge comments on an earlier draft of this paper
from participants of the 2017 ESEA conference in Paderborn and of the 2017 IASE conference in
Shanghai.
ii1 Introduction
To what extent are market outcomes efficiently induced by rational behaviour of market
participants? This question is still one of the most controversially discussed in economics,
with application to many different market types. The following paper will examine one
very particular application: We will investigate whether the European football betting
market fulfils the efficiency paradigm introduced by Fama (1970).
The degree to which markets incorporate information is one of the most important
questions in economic research, especially for economists dealing with financial markets.2
Hence, the empirical literature tried to test the degree of market efficiency extensively
within stock exchanges and other markets for financial assets (Fama (1991)). However,
as discussed by Fama, it is only possible to test the efficiency hypothesis, e.g. whether
information is properly reflected in asset prices, in the context of a correct pricing model,
the so-called Joint Hypothesis Problem. More recently, several studies examined the
performance of sports betting markets and pointed out the advantage of a fixed terminal
value of its assets realizing within an ex ante fixed period of time. Although these markets
constitute only a small part of most economies compared to other financial markets, the
characteristic of a reduced pricing problem opens up significant opportunities for economic
analysis (Sauer (1998)). Given other similarities between trading with financial assets and
wagering markets, the betting market provides even a superior setting for testing market
efficiency in general according to Thaler and Ziemba (1988).
This empirical study is based on an exclusive dataset of European online bookmaker
prices provided by Sportradar, a multinational sports data provider and institution em-
ployed by the UEFA to monitor the football gambling market. The analysis focuses on
matches of major European leagues since they constitute one of the most liquid and im-
portant betting markets (Vlastakis et al. (2009)). Precisely, the data contains closing
odds of 14 online bookmakers, who report price adjustments to Sportradar. While in the
betting market literature empirical studies are mainly conducted with publicly available
online databases collected at a fixed point during the week,3 this database enables to
test informational efficiency in a more rigorous way. Furthermore, the sample contains
some bookmakers mainly or only active in the German market and allows an analysis
with a special reference to the German betting market, a market characterized by a state
monopoly for betting services until 2012 and afterwards partially liberalized.
This empirical analysis will be divided in two parts. First, the informational efficiency
will be analysed by examining the unbiasedness and neutrality of betting prices. This can
be seen as a weak-form efficiency test while stressing the assumption that no abnormal
returns can be achieved using just historical price information. In the second part, the
2
See on this e.g. the overview by Williams (2005)
3
The main source of historical odds used in the existing literature is www.football.data.co.uk.
1efficiency of the betting market is challenged by a statistical forecasting model using pub-
licly available information from which betting strategies are derived. The analysis will
include the English betting market and the first two divisions within the English football
league system as well as British licensed bookmakers.4 The focus on this market is mainly
justified with its size, its tradition and its liberal market form. In addition, the German
market will be reviewed in detail, e.g. Bundesliga 1 and 2 matches and odds from book-
makers that are available for German costumers. While the British betting market was
liberalized and experienced a reduction in betting taxes already before the first period of
historical odds (2006 - 2016) in the dataset, the German market was officially character-
ized by a state monopoly until 2012 and was afterwards affected by a tax introduction on
stakes, including private bookmaker services, following a partial liberalization. Therefore,
comparing the efficiency of these two markets over time may also reveal some effects of
a change in the market structure and legal framework of betting markets. However, a
clear separation of the two markets will not be possible since we are examining online
betting odds in this analysis and wagering on foreign divisions is not excluded. Neverthe-
less, bookmakers may anticipate closely the domestic betting demand for the English and
German divisions respectively.
The structure of this analysis will be as follows: First, the concept of market efficiency
will be outlined briefly in chapter 2. Subsequently, chapter 3 will provide a short introduc-
tion to the European betting market and a theoretical perspective on gambling. This will
be followed by a literature review of efficiency analysis within betting markets (chapter 4).
The empirical analysis presented in chapter 5 will be structured in two parts, beginning
with tests of the weak-form market efficiency hypothesis, e.g. the informational efficiency
of bookmaker prices. Following this, an ordered-probit model will be estimated to chal-
lenge the efficiency of the bookmaker market which is described with the semi-strong-form
efficiency hypothesis by deriving forecasts based on publicly available information. Finally,
the economic significance of different betting strategies will be examined and the results
of the analysis will be summarized in a conclusion (chapter 6).
4
There are parallel league systems in the UK but the main divisions are the Premier League and First
League.
22 Efficient Market Hypothesis
The Efficient Market Hypothesis (EMH) has mainly been shaped by Eugene Fama. In
one of his early speeches, he claimed the following:
In an efficient market, competition among the many intelligent participants leads to a
situation where, at any point in time, actual prices of individual securities already reflect
the effects of information based both on events that have already occurred and on events
which, as of now, the market expects to take place in the future. (Fama (1965))
This implies that prices should reflect at any time all the relevant and available infor-
mation affecting the underlying security. A more economically sensitive definition is given
by Jensen (1978) where markets are characterized as efficient with respect to an informa-
tion set σt if it is impossible to make economic profits by trading based on the respective
information set σt . As a result, costly fundamental analysis of securities or expert knowl-
edge about market expectations lose their economic rationale. However, Fama (1970)
claims that the following sufficient conditions for market efficiency need to be assumed.
Precisely, there are no transactions costs in trading securities and the information is cost-
lessly available to all market participants. Additionally, it is assumed that all agents agree
on their future expectations and implications of current information. In Grossman and
Stiglitz (1980) the characteristics of an efficient market is examined with a noisy rational
expectations model and endogenous choice of being informed. The informativity of the
price system depends on the number of individuals who are informed and on several other
critical parameters in the model. Precisely, these are the cost of acquiring information,
how informative the price system relative to the market random noise components is, and
how informative the information obtained by an informed individual might be. In conclu-
sion, investors need to be attracted by some form of expected profit as normal returns to
their investment, otherwise there would be no incentive to analyse the market and ensure
its informational efficiency. Hence, an efficient amount of inefficiency needs to be in the
market to ensure a stable equilibrium close to the efficiency benchmark.
Consequently, assigning markets strict efficiency characteristics has to be seen due to
non-zero costs for transaction and information accumulation as well as heterogeneity of
expectations in reality as an approximation or benchmark case. Therefore Fama (1991)
suggests that any finding of market inefficiency is not surprising per se, but proves the
importance of measuring the extent of inefficiency within the market.
Fama (1970) adjusted the EMH by defining different information sets incorporated by
the market price whereupon the tautology of a general efficiency claims becomes empiri-
cally falsifiable:
3• The Weak-Form Efficient Market Hypothesis, in which the information set σt
is defined to be solely the historical price information set derived from past price
history of the market at time t.
• The Semi-Strong-Form Efficient Market Hypothesis, in which σt includes all
public available information at time t extending the historical price information set.
• The Strong-Form Efficient Market Hypothesis, in which σt incorporates all
information, from public as well as private nature, at time t.
However, one of the fundamental problems of detecting inefficiencies in financial mar-
kets is the underlying asset-pricing model defining "proper" prices to securities, given the
uncertainty about future pay-offs, even over an infinite horizon as in the stock market.
The so called Joint-Hypothesis Problem (Fama (1991)) arises since empirical tests can
fail either because one of the two hypotheses, the hypothesis that the pricing model is
correct or the market is efficient, is false or because both parts of the joint hypothesis are
incorrect (Jensen (1978)).
Efficiency Hypothesis Applied to Betting Markets
Since betting markets are defined by a fixed terminal value of bets, the markets’ assets,
realizing within an ex ante fixed period of time, the joint-hypothesis problem of other fi-
nancial markets can be neglected. Many economists have already examined sports-betting
markets as a laboratory to better understand trading behaviour and efficiency of stock
prices while avoiding to jointly test the hypothesis of a correct capital market model
(Williams (2005)).
Precisely, the betting prices should be proportional to the true probability of the un-
derlying event in an efficient market, since otherwise competing bookmakers with fair
odds would get the betting demand solely. Therefore, examining the informational effi-
ciency of bookmaker prices can be seen as a clear testing strategy of weak-form market
efficiency. Moreover, since higher potential payoffs in case of winning the bet need to
be proportional to lower probabilities of the underlying outcomes, the expected betting
returns should be identical, independently of the applied betting strategy. Consequently,
in betting markets weak-form efficiency implies that neither bookmaker nor punters can
achieve abnormal returns using historical price information, where abnormal returns are
defined by divergence from the bookmaker market takeout (Kuypers (2000)). Translat-
ing the semi-strong-form efficiency hypothesis into the betting market setting leads to
the claim that incorporation of publicly available information should neither improve the
accuracy of outcome predictions based on bookmaker odds nor lead to superior returns.
The strong-form includes also private information to that claim. However, in football it
4is common to assume that there is no great deal of private or insider information, since
games are usually played in front of large audiences and the conditions of a team and
their individual players are extensively discussed in the media.5 Therefore, the rest of the
analysis is exclusively focusing on weak and semi-strong-form market efficiency in case of
the football betting market.
3 The Sports Betting Market
In its basic form, sports betting has been around for hundreds of years, as betting on
athletic events dates back to the Roman empire (Sauer (1998)). The market for sports
gambling has steadily gained popularity while the nature of traditional betting markets
has been strongly affected by changes in information and communication technology (Vlas-
takis et al. (2006)). Nowadays, there are several market forms offering in coexistence
betting services for sport events. Hence, their individual market characteristics can be
assumed to be significantly affected by each other, as examined by Franck et al. (2010)
and Vlastakis et al. (2009). This study will focus exclusively on online betting markets,
one of the fastest growing service sectors in Europe with annual growth rates of up to 15%
(Peren and Clement (2016)). Particularly, the European market is today the largest mar-
ket for online gambling worldwide and occupies more than 47.6% per cent of the e34.6 bn
online generated global gaming gross win (stakes minus winnings) in 2015 (EGBA (2016)).
Figure 1 illustrates the gross gaming revenues of the European online and offline market
in 2015 and their expected evolution until 2020. It is expected that the market share of
online betting will increase from 17.5% to 22.5% while the overall market revenue will rise
from e88.2 bn to e109.2 bn.
Figure 1: EU Gross Gaming Revenue
Source: EGBA 2016
In the following, a brief description of the two main forms of betting markets will be
5
See e.g. Kuypers (2000). However, some evidence from studies on match-fixing (e.g. Rebeggiani and
Rebeggiani (2013)) may suggest to be more careful on that.
5given by highlighting their differences and the suitability of online betting markets for an
efficient market analysis.
3.1 The Offline Fixed-Odd Bookmaker Market
The traditional bookmaker market is constituted by coupon betting in physical betting
shops where prices are characterized as "fixed-odds", hence the betting quotes or so-called
odds do not vary over time in response to changes in betting volumes. These offline
services are still accountable for more than two thirds of the overall gambling market
(EuropeanCommission (2012)). Dixon and Pope (2004) describe the typical fixed-odds
pricing mechanism with a panel of professional odds compilers who meet on a weekly basis
and use their subjective judgement and expert knowledge of the football teams’ current
state to set the odds on home team win, away team win and draw results one week
in advance. Therefore, it can be assumed that the fixed-odd betting lines contain less
information and more supply risk than betting prices that are dynamically adjusted until
the match starts (Vlastakis et al. (2009)). This is the case for the rising online betting
market on which we are focusing hereinafter. Another notable feature of the physical
betting market is the anonymity of the betting audience. Usually, there is no requirement
of registering in a betting shop to submit a wager, which is why bookmakers are not able
to identify the betting behaviour of individual punters over time.
3.2 The Online Bookmaker Market
Online bookmaker services perform differently from the offline fixed-odd market, even
though they provide identical assets and are mostly operated by the same service providers
(Peren and Clement (2016)). Whereas punters remain anonymous in the offline market, at
online betting platforms their identities are revealed through the requirement of a personal
account. Therefore, a punter faces switching costs including the time and cost of money
transfer by opening a new online account at a competitor’s platform. Furthermore, online
betting providers have the possibility to gather information about the trading behaviour
of individual clients and reserve the right to limit the individual maximum stakes or to
close an account in case of a history of extreme betting profits (Franck et al. (2013)).
This characteristic potentially impairs the forces of informed traders to ensure an efficient
market equilibrium and therefore has to be mentioned before conclusions across markets
in general are drawn.
However, the main advantage of the online market is its dynamic quoting process in
contrast to the offline services and thereby the ability of bookmakers to incorporate new
information in their price adjustments. This includes, besides the new information about
the contestants itself, primarily the information about the distribution of bets and thus
the expectations of the betting public (Vlastakis et al. (2006)). Apart from this, the online
6market stands out with high price transparency, whereby bettors can easily compare the
odds of various bookmakers and identify favourable price discrepancies at low searching
costs6 (Franck et al. (2011)). Being a relatively young and new market, the online gam-
bling sector in Europe has been steadily developing, albeit more slowly in recent years due
to increasing regulatory pressure (EuropeanCommission (2012)). In conclusion, while so
far the literature was mainly examining fixed-odd betting prices or online odds that were
collected in advance, the following examination of closing odds, which capture the final
price of the online market’s dynamic price adjustment process, may reveal new insights.
3.3 Regulation and Market Characteristics
In most European countries gambling markets are subject to strict regulation, in some
cases they are even entirely controlled by the government (Rebeggiani (2009)). While
the main justification of strict regulation and high tax burden for gambling markets is
based on pathological gambling or addiction, it suits as well as "highly significant area
for governments seeking continuous or compensatory revenue for the public purse" (Nikki-
nen (2014)). However, due to the rise of online platforms, which are based offshore but
are available for domestic costumers, the national regulation and taxation schemes have
recently come under pressure. In response to the threat of decreasing tax incomes and a
rising grey market, the UK was the first country that reformed betting taxation by con-
siderably lowering its effective level and declaring online betting as legal (Vlastakis et al.
(2006)). As Forrest et al. (2005) note, the removal of betting taxes potentially improved
the overall efficiency of betting markets by attracting well-informed professional bettors
who are capable of identifying mispriced bets. Nowadays, the British market is the largest
betting market in Europe and is mainly dominated by a few large service providers like
WilliamHill and Ladbrokes (Vlastakis et al. (2006)).
Moving the focus to the German market, a different framework emerges. Until 2012,
the state monopolist Oddset was the only legally accepted betting provider (Rebeggiani
(2015)). In the same year, a new gambling state treaty was adopted to open up the way
for private betting companies to enter the German market legally via state-issued licenses.
However, none of the planned licenses has been granted to any company so far, leaving
private bookmakers in a legally unregulated but tolerated grey area where companies are
taxed but their legal status remains uncertain (Rebeggiani and Breuer (2017)). Peren
and Clement (2016) examined the German online betting market in 2014 and estimate
the number of active online betting portals for German costumers at round 130. Nearly
95 percent of total turnover of German sport bets is actually estimated to be generated
in "grey" or completely illegal markets (Rebeggiani and Breuer (2017)). While black
6
There are several platforms that compare bookmaker odds as betexplorer.com and oddschecker.com or
identify arbitrage opportunities as surebet.com.
7market providers want by definition to stay illegal, "grey market" companies normally
wish to have a regular public licence or have already applied for one. Public revenues
have significantly risen since the new state treaty collects starting from 2012 taxes even
from not fully licensed betting providers.
All in all, these two national markets are characterized by different regulation schemes
and some providers are only accessible for the betting public in one country . Nevertheless,
both markets are affected by an increase in competition in view of a substantial grey
market and therefore provide an interesting setting for an efficient market analysis.
3.4 A Theoretical Background of Betting Markets
From a theoretical perspective the outcome of a football game consists of three disjunct
events ignoring the actual score result. A home victory (H), a draw (D) or an away vic-
tory (A): Ω = ∪H ∪ D ∪ A. These outcomes provide the underlying events of the football
result online betting market, in which we are interested in the following. By quoting
odds for these individual events, bookmakers offer Arrow-Debreu securities7 denoted by
(σH , σD , σA ) ∈ R3+ . In the European football betting market, decimal odds are common,
determining the payout factor including the returned stake in case of winning for each of
the match outcomes. Hence, within wagering markets, odds constitute prices supplied by
competing bookmakers who want to attract the demand of the betting audience and act
as market makers while the bet demand side is left with a take-it-or-leave-it decision, by
either hitting the market quotes and decide about the amount of stake or refrain from
participating. Therefore, bookmaker markets can be classified as quote-driven markets
in analogy to similar financial markets (Franck et al. (2010)). Moreover, in this simple
speculative market for future cash flows, transactions can be denoted as zero-sum transac-
tions where the bookmaker takes the reverse position to the punter. Hence, bookmakers
are confronted with a substantial risk in case of mispriced betting lines and in presence
of bettors whose skills allow them to achieve positive expected profits (Levitt (2004)).
The following will briefly provide some theoretical foundations how equilibrium prices are
determined in a market with uncertainty and state contingent assets.
If bookmakers have deep pockets such that it can be assumed that they are able to
honour their debt in each case, if they are risk neutral and if there is perfect competition
in the market, then standard General Equilibrium Theory tells us that Arrow-Debreu
securities are in perfectly elastic supply and by rational expectations correctly priced
(Mas-Colell et al. (1995)), i.e. the asset price is the inverse of the probability of the
event. The existence of these so-called rational expectation equilibria is described in
Radner (1979) as generic and defined by an equilibrium that "reveals to all traders the
information possessed by all of the traders taken together".
7
State contingent assets which pay one unit of a numeraire, if a particular state of the world is reached
and zero otherwise, see Mas-Colell et al. (1995).
8Alternatively, one can analyse the market from a Game Theoretic perspective. Since
the Arrow-Debreu securities are individually perfectly homogeneous, the market can be
modelled as a Bertrand competition with N firms (see Mas-Colell et al. (1995)). By
further assuming that all bookmakers share the same cost (cH , cD , cA ) ∈ R3 and subjective
probability over the events (pH , pD , pA ) ∈ [0, 1]3 , we can write the bookmakers’ expected
profit as:
E[π BM ] = max Q(σe , P )(1 − pe σe − ce ) (1)
σe
where the punters’ demand function is given by Q(σe , P ) depending on the bookmaker’s
price vector (σH , σD , σA ) and their own believes about the probability distribution of the
match outcomes P .
Thus, the bookmaker’s expected profit is the money at stake minus cost of provision
and the expected payouts for each of the outcomes e ∈ {H, D, A} where the punters
receive the offered odds multiplied by their stakes Q(σe , P ). We know that in a unique
Nash-Equilibrium, price equals marginal cost:
1 − ce
1 = pe σe + ce ⇐⇒ σe = (2)
pe
Hence, from this perspective we receive the same equilibrium price as we argued using
the Rational Expectations Equilibrium but adding the cost-wedge ce . The assumption of
unanimity in the subjective probability of the event pe is very strong, but there is also
a reasonable rationale for it. In the real world, as mentioned above, online bookmakers
constantly update their quotes ensuring the ability to learn from competitors’ pricing
behaviour. Since quoting "wrong" odds is a costly signal, i.e. bidders can take those odds,
we are in a costly signalling game in which bookmakers learn their competitors’ subjective
probabilities and update their own. Hence, if all competitors are symmetric, this should
aggregate to the same subjective probability across agents. There are analogous arguments
for the unanimity in cost of provision since cost differences would exclude all but the
cheapest firm from the market.8
Since bookmakers are bearing risk and transaction costs =⇒ ce ̸= 0, they are charging
commission for their services implying that the sum of the inverse odds e σ1e > 1 exceeds
∑
the probability of a sure event Ω = ∪H ∪ D ∪ A. Assuming now the costs of providing
bets are homogeneous across outcomes c = cH = cD = cA , the implied commission or
bookmaker margin is then given by:
8
If agents had different beliefs and moved only simultaneously as in the fixed-odd market, there would
be a winner’s curse attached to the one with the highest odds. This bookmaker secures the whole
market but will offer too much money similar to a common value auction. Thus, one should expect
greater cost wedges there.
9∑ 1 ∑ pe 1 c
m= −1= −1= −1= (3)
e σe e 1−c 1−c 1−c
Consequently, to receive the correct implied probabilities of the bookmaker market, we
have to rescale the inverse odds by the commission charged,9 precisely:
1 1 1 1
PeIP = = (4)
σe 1 + m σe e σ1e
∑
This implied probability will be used in the following as a forecast instrument, e.g. the
bookmaker prediction for outcome e, to assess the informational efficiency of the betting
market.
The exact business strategy of bookmakers is not well known and outside the scope of
this analysis. If it can be assumed that bookmakers are systematically at least as good
as the gambling audience at predicting the outcomes of games and always set the correct
prices in line with the true probability, the markets can be assumed to be efficient leading
to a bookmaker return or takeout in the form of the margin m.
Since the betting market is characterized by zero-sum transactions as already men-
tioned, the betting audience is oppositely confronted with negative profits in expectation,
which raises questions about the rationality of sports wagering at all. Even though the
punters’ participation in such an unfair game contradicts the axiomatic approach of ex-
pected utility maximization by Von Neumann and Morgenstern (1953), there are several
explanations in the literature such as obtaining pleasure from gambling or adjusted utility
frameworks where marginal utility is not universally declining but characterized by local
risk preferences. However, for further information about gambling behaviour the reader
is referred to the literature (e.g. Sauer (1998)). The focus will now return to the book-
makers’ profit maximization problem, assuming the punters’ decision to enter the market
has already been made.
Besides the neutral pricing strategy, bookmakers may be aware of predictable patterns
in betting behaviour by punters, including behaviour based on cognitive or judgemental
biases (Dixon and Pope 2004). If on average punters display systematic biases exploited by
the bookmakers, the market will contradict the efficiency hypothesis. Levitt (2004) briefly
sketches some profit maximizing scenarios within the bookmaker market, leading to a de-
viation of an efficient market equilibrium. First, bookmakers are skilled in determining
in advance the prices σe which equalizes the quantity of money wagered on the win and
losing outcomes respectively, hence they balance the book. In this case, the bookmaker
achieves a positive return equal to the margin charged, regardless of the match outcome
realization. Consequentially, bookmakers do not need to be good at forecasting the un-
derlying event outcome but rather good at forecasting bettors’ demand or beliefs about
9
In our analysis, we assume that the commission (overround) is equally distributed over the outcome
probabilities, which is in line with the literature (see Forrest et al. (2005), Franck et al. (2010)).
10the underlying probability distribution, which implies that in case of bettor irrationality
the market implied probabilities may deviate systematically from the true probability
distribution. However, in case of skilled bettors with superior forecasting performance,
bookmakers face substantial losses if their prices do not include all relevant information
and differ widely. Alternatively, bookmakers are not only efficient in predicting game
outcomes but also anticipate bettors’ preferences and systematically set the wrong prices
in a manner that takes advantage of biased irrational behaviour of the betting audience.
To sum up, the bookmaker odds are likely to be influenced by both, the true outcome
probabilities and the betting audience’s expectation and demand (Franck et al. (2010)).
4 Literature Review
There exists a considerable amount of papers dealing with market efficiency in sports bet-
ting markets. Detailed overviews are provided e.g. by Williams (2005) and Sauer (1998).
In general most of the empirical research supports an efficiency paradigm for betting
markets. However, some anomalies have been detected and repeatedly confirmed, though
the statistical and economic significance of these inefficiencies have seemed to disappear
in more recent years, which suggests an increase in betting market efficiency, potentially
evoked by an increase in competition, price transparency and the rise of alternative betting
market forms (Vlastakis et al. (2009)).
4.1 Weak-form Efficiency Testing
The first empirical studies examining market efficiency within wagering markets were
mostly conducted in racetrack betting. This form differs from the bookmaker football
wagering markets with ex ante fixed odds, since horse race betting is characterized by a
pari-mutal betting mechanism, i.e. the potential payout is not fixed ex ante but the frac-
tion of the total betting pool you will receive in case of winning. However, these studies
revealed some interesting anomalies while providing mixed evidence for market efficiency
in general. Several authors have studied the relationship between the objective proba-
bilities of winning a race and the probability reflected by market odds (Quandt (1986)).
Ali (1977) introduced the term "favourite-longshot bias" describing the well-documented
tendency of punters to consistently overbet low probability outcomes (longshots) and
underbet high probability outcomes (favourites) relative to their observed frequency of
winning. This anomaly was confirmed also in other sports betting markets and summa-
rized with the phenomena that lower odds (favourites) tend to be associated with higher
returns and vice versa lower returns with higher odds (underdogs), which suggests that
market prices anticipate the irrationality in betting demand (see Woodland and Woodland
(1994), Snyder (1978) and Cain et al. (2000)). Similar biases were detected in financial
11markets for equity options by Rubinstein (1985) according to which shorter maturity
options (longshots) tend to be overpriced. For the favourite-longshot bias phenomena
there exist a variety of explanations such as risk attitudes in form of risk-loving utility of
gamblers (Ali (1977), Quandt (1986)) or insider trading introduced by Shin (1991, 1993).
Alternatively, behavioural theories as the Prospect Theory suggest that cognitive errors
and misjudgements of probabilities may play a role in market mispricing (Kahneman and
Tversky (1979)).
Examining more explicitly the relationship between objective probabilities of outcome
occurrence and subjective probabilities implied in quoted odds, Pope and Peel (1989) in-
vestigate the efficiency of prices set by four UK high street bookmakers for fixed-odds
betting on English association football. A simple test of the weak-form efficiency hypoth-
esis is based on linear probability regression models of match outcomes against implicit
bookmakers probabilities. The results indicate some deviations of the implied bookmaker
probabilities from the axioms of rational expectations, though exploiting these inefficien-
cies didn’t result into profitable returns. Several other studies were also not able to reject
the weak-form efficiency hypothesis (Gandar et al. (1988), Sauer et al. (1988)). However,
Golec and Tamarkin (1991) suggest that this simple form of regression tests may not reject
market efficiency because of their weak statistical power and it is shown that economic
tests in form of testing the profitability of different betting strategies reject the EMH more
often. Examining the point-spread NFL betting market10 by explicitly testing for home
as well as favourite biases, Golec and Tamarkin (1991) detect significant deviations from
the efficient market hypothesis in these two dimensions implying that bets on underdogs
or home teams win more often than bets on favourites or visiting teams, albeit with disap-
pearing magnitude over their sample period. Using a more general model accommodating
the symmetries and interdependence of the principal team characteristics (favoured, un-
derdog, home and away), Dare and MacDonald (1996) find little or no evidence against
market efficiency in their subsequent analysis. Gray and Gray (1997) apply in a similar
way a probit regression model and test for potential momentum effects including recent
performance proxies. Their results indicate that the market overreacts to a team’s recent
performance suggesting that a profitable strategy involves betting on teams that have
performed well over the season as a whole, but which have performed poorly in recent
weeks. This result has a close analogy with financial markets, in which contrarian strate-
gies are profitable, though the anomalies also seem to have been substantially attenuated
in recent years.
Testing for sentiment bias, Avery and Chevalier (1999) examine the dynamics of point
spread betting lines during betting periods and control for expert opinions, a hot-hand
10
This is wagering on a range of match outcomes where the resulting payoff is based on the wager’s
accuracy.
12bias as well as a bias for team prestige. The results from a sample of games from 1983 to
1994, indicate that each set of sentiment variables serves as a significant predictor of point-
spread betting line movements but not of the actual game outcomes itself. Forrest and
Simmons (2008) examine the weak-form efficiency of the Spanish online football betting
market with respect to fan support bias besides the home-away and favourite-underdog
dimensions. They use a multivariate analysis where a proxy is included to account for
the relative numbers of supporters of the two teams. The odds appear to be influenced
by the relative number of fans respectively, with supporters of the more popular team
offered more favourable terms on their wagers. Focusing on an economic testing strategy,
Vlastakis et al. (2009) assessed the international efficiency of the European football bet-
ting market by investigating the profitability of strategies based on combined betting and
detection of arbitrage opportunities as well as betting strategies derived from regression
models. Despite the increasing competition in the betting industry recently, the results
of the empirical analysis in Vlastakis et al. (2009) suggest deviations from the standard
weak-form market efficiency assumption. In particular, combined betting across two or
three bookmakers simultaneously lead to highly profitable arbitrage opportunities. Sub-
sequently, Franck et al. (2013) examine inter-market arbitrage by combining bookmaker
odds and odds from a bet exchange market platform, receiving a guaranteed positive
return in 19.2 % of the matches in the top five European soccer leagues. The authors
indicate that bookmakers may set prices not only by myopic optimizing over a particular
bet but also by taking the future trading behaviour of their customers into account.
4.2 Semi-strong-form Efficiency Testing
In testing the semi-strong form efficiency of financial markets, two main approaches have
been adopted. The first one is to assess the direct impact of new public information
on prices, the other is searching for opportunities to earn systematic abnormal returns
based on publicly available information and identifiable market circumstances, so-called
market anomalies (Williams (2005)). Translating this into the betting market setting,
the semi-strong efficiency hypothesis implies that the incorporation of publicly available
information should not improve the accuracy of outcome predictions based on bookmaker
odds and not result in superior betting returns (Kuypers (2000)).
However, searching for market anomalies in betting markets including public infor-
mation raises the question how we can incorporate any information for match outcome
predictions in general. It seems evident that match results in association football are
governed partly by chance and partly by skill (Hill (1974)) since teams are not identical
and each one has its own inherent quality (Maher (1982)).
There are two main statistical approaches for modelling football match outcomes in
literature. The first one models the goal scoring process of the two opponent teams by
13estimating a statistical model approximating the underlying stochastic process of a foot-
ball match. Maher (1982) is one of the first papers applying a univariate and bivariate
Poisson distribution11 with means reflecting the attacking and defensive capabilities of
the two opponents. Dixon and Coles (1997)) extend the independent Poisson distribution
model with means modelled as functions of the respective teams’ previous performances
and are able to derive forecast predictions for UK football match score results. Consec-
utively, the probability forecasts of the match outcomes are obtained by aggregating the
probabilities of different permutations of the home and away team goals scored. The
economic value of these forecasts are assessed in Dixon and Pope (2004) later on. By
using their advanced statistical forecasting model, the authors find that the market is
inefficient as the model probabilities can be exploited to earn positive abnormal trading
rule returns. In contrast to the favourite-longshot bias described above, they found less-
than-fair odds for favourites and more-than-fair odds for longshots, hence surprisingly a
reverse favourite-longshot bias.
The alternative approach to predict match outcomes in the literature involves mod-
elling the match outcomes home win, draw and away win, directly using discrete choice
regression models such as ordered probit or logit. Kuypers (2000) uses publicly avail-
able information covariates in his ordered probit framework including difference in teams’
average points and goals scored in preceding games of the season. With a simple forecast-
ratio based betting rule based on the received probability forecasts, he find evidence of
market inefficiency within the UK fixed odd bookmaker market. Forrest et al. (2005) test
odds for the English football seasons 1998 - 2003 with an extended ordered probit model
incorporating a large number of quantifiable variables relevant to match outcomes. The
principal team quality indicators were constructed by partitioning the teams’ win ratios
in components from the present season, the previous season and within 12 and 24 months
respectively. Additionally, the model fit was improved by including recent match results, a
proxy for the importance of the match for final season outcomes, cup involvement, the ge-
ographical distance between the team locations and a measure for the opponents’ relative
fan attendance. The findings suggest that the bookmakers’ forecast accuracy is superior
to the model performance while the odds-setters improved over the sample period relative
to the statistical model. Nevertheless, evidence of statistically significant differences be-
tween the forecast probabilities in three out of five seasons were found and simulation of
a selective betting strategy based on the forecast discrepancy translated into significant
superior returns. In an alternative approach Hvattum and Arntzen (2010) assigned team
ratings based on the ELO rating system, a rating system initially developed for assess-
ing the strength of chess players, and used the rating difference as a single covariate in
an ordered logit model specification. Although the model’s forecasting performance ex-
11
This is a discrete probability distribution that expresses the probability of a number of events (here:
goal scored) occurring in a fixed interval of time.
14ceed the previous approaches in literature, Hvattum and Arntzen also fail to outperform
bookmakers forecast accuracy between seasons 2001-2008. The review of the forecasting
approaches in the literature is completed by a comparison between the forecasting perfor-
mance of the goal-based and result-based approach in Goddard (2005). Estimating a set
of models based on an identical dataset but different modelling approaches, the difference
in performance appeared to be small and no gain was achieved by using the more data
and computational intensive approach of the Poisson distribution models.
All in all, the informational efficiency of the bookmaker market seems to be confirmed
from a semi-strong form perspective, though several authors are able to simulate profitable
betting strategies including their model forecasts.
5 Empirical Analysis
5.1 Data
The data used in the empirical analysis is combined from different sources, whereby the
main part is originated from an exclusive dataset provided by Sportradar. The dataset cov-
ers all football fixtures of the English Premier League, the English second division Cham-
pionship as well as the German Bundesliga 1 and Bundesliga 2. The historical matches
are recorded over the last ten years beginning in the second half of season 2006/2007 until
February 201712 with 15.400 matches in total. Besides the match results, the data lists
odds of 14 online bookmakers for each of the theoretical match outcomes e ∈ {H, D, A}.
Including price changes of online bookmakers before the match starts, we are able to list
the last pre-match price offers, the so-called closing odds, and it can therefore be assumed
that all relevant pre-match information, including the betting demand by then, is incor-
porated in the examined bookmakers’ pricing decision. However, as can be seen in Table
1, the database is not fully balanced and the sample of odds varies depending upon the
individual bookmaker.
The 14 bookmakers in this sample are anonymised by their market focus. The sam-
ple contains 3 bookmaker with a primary focus on German speaking betting audience
(German 1- 3), 6 leading bookmakers of the British betting market (UK 1- 6) and 5 book-
makers which are characterized by a more global/ European focus and denominated by
EU 1- 5.
12
For convenience the football seasons, which typically run from August to May/June are identified by
its end year in the following.
15The first part of the data will be extended to enable the analysis of informational
efficiency with respect to the weak and semi-strong hypothesis. As already mentioned,
examining the semi-strong form efficiency of the bookmaker market requires publicly
available information with potential relevance for match result predictions. Since our
forecasting strategy is structured with a model estimation based on a training sample
including the five preceding seasons, we have to extend the historical match result series by
5 seasons up to season 2001. The information will be extracted from FootballData (2016),
a public database of historical match results and bookmaker odds. In addition to the
match results data, geographical distance between the opponents and relative attendance
is included in the analysis. The geographical coordinates of the team’s stadium location
are collected from GoogleMaps (2016) and the respective distance between the opponents
is calculated with the shortest path between two points on an ellipsoid. The information
regarding fan support, e.g. the relative attendance of the competing teams, is collected
from EFS (2016), whereby the average stadium attendance of the preceding season is
used.
5.2 Descriptive Analysis
In the following, the descriptive statistic of the bookmaker data will be examined. The
first panel in Table 1 lists the individual implied bookmaker margins m and their stan-
dard deviations. In the previous section it was mentioned that no bookmaker should be
able to operate at greater margins than their competitors. Surprisingly, as it can be seen,
there is a significant heterogeneity in bookmakers’ average implied margins. Especially,
the German betting provider German 1 shows a very high margin by 18.50% compared to
the average bookmaker margin of 7.94 %. Among the other bookmakers, the takeouts are
more comparable, though the global oriented provider EU 1 stands out with a very low
average commission by 2.46 % combined with the lowest standard deviation. According
to their webpage, the firm intentionally follows a reduced margin pricing model to attract
higher turnovers by reducing betting limits to safeguard against high-skilled punters. De-
spite taking the standard deviations as proxy for the riskiness of the bookmakers’ pricing
strategy in general, the statistic reveals no clear picture. The highest coefficient of varia-
tion13 is occupied by German 3, a bookmaker with moderate average margin followed by
UK 3 and EU 2. Therefore, from the descriptive analysis it is not possible to conclude
that higher margins can be seen as a compensation for higher risk taken by the bookmaker.
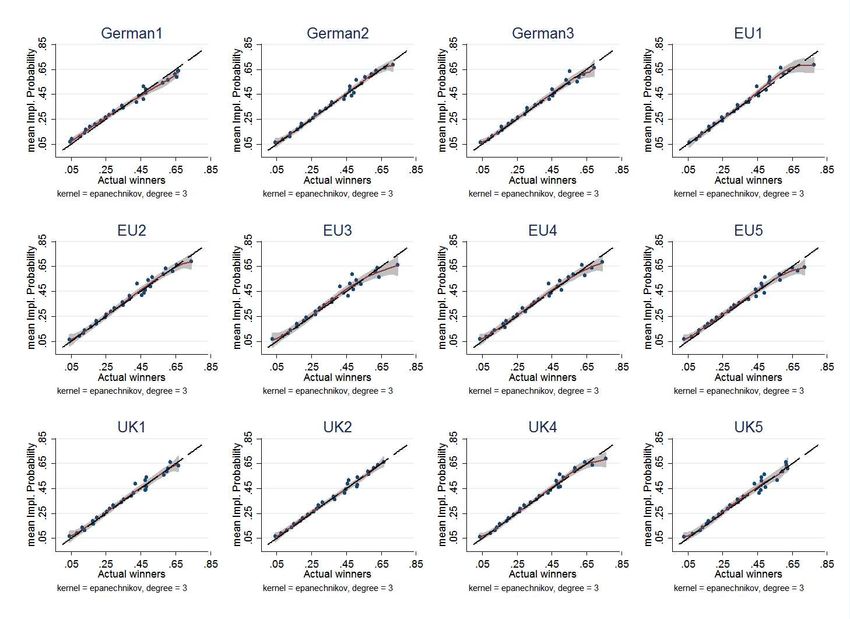
To examine the margin behaviour in more detail, Figure 2 plots the implied margins
by monthly averages based on Bundesliga 1 and 2 matches. First of all, there is a clear
picture that margins have decreased over time where most of the bookmakers showed
13 sd
Coefficient of variation = mean .
16Figure 2: Evolution of bookmaker margins - German market
margins close to or higher than 10 % at the beginning of the observation period in 2007,
besides only German 2, German 3, EU 1 and UK 4 with lower margins. Moreover, the
plot reveals several structural breaks in the time series of monthly margins. The partial
liberalization of the German market seems to affect the bookmaker German 1 in 2014 by
a sharp decrease from roughly 21 % to below 15% whereby EU 4 and 5 as well as UK
3 and 5 reveal sharp decreases already at the beginning or mid of 2012, the year of the
introduction of the new German interstate gambling treaty. All in all, the picture seems
to support decreasing market profits within the bookmaker business, potentially induced
by an increase in competition and market liberalization.
The next panel of Table 1 examines the distribution of implied probabilities derived from
the market odds as described in section 3 relative to the true probability of the respective
outcomes. The chance of the outcome home victory as the final match result is 44.75%
and vice versa 26.64% for away victory. This is in line with the so-called home-field ad-
vantage in association football (Hill (1974)), which implies that the home team exhibits a
significant higher probability of winning than visiting teams. Comparing the bookmakers’
average implied probabilities, the market odds coincide with the underlying probability
IP
distribution quiet well. The home win implied probabilities PHome range from 43.27% to
44.75% comprising the true probability closely. However, comparing the numbers for away
17IP IP
victory PAway and draw PDraw , the market odds tend to overestimate the first one, where
IP
PAway ranges from 26.23% to 29.73%, while underestimating the chance of a draw result,
though the deviations are only marginal. Hence, there is no clear indication that the home-
field advantage is consistently overestimated, as frequently mentioned in the literature for
example by Vlastakis et al. (2009), but the relative proportions of draw and away results
appear not to be correctly represented by the implied bookmaker probabilities on average.
Examining the probability distribution with respect to favourite and underdog winning
probabilities sheds some light on the magnitude of a potential favourite-longshot bias in
bookmaker pricing. Teams are defined as favourites if the implied probability of winning
exceeds the opponent’s odds and for underdogs vice versa. Since there is not always an
agreement about the assignment of the favourite role between the bookmakers, the true
probabilities are defined if at least 5 betting providers agree on the favourite/underdog
status of a team. Comparing the average values of PFIPav by 48.02% and PUIPnd by 23.83%,
the bookmakers seem to slightly underestimate the true odds in the favourite-underdog
dimension on both sides. This raises the question whether the deviation from the true
probability distribution is continuously characterized in the relationship between implied
and actual chance of winning or in form of kinks at the boundary of the probability space
in an otherwise neutral relationship (Cain et al. (2003)).
GER 1 GER 2 GER 3 EU 1 EU 2 UK 1 UK 2 Uk 3 EU 3 EU 4 UK 4 EU 5 UK 5 UK 6 True
Prob.
∅m 18.50 6.29 7.22 2.46 5.42 7.54 7.62 5.80 7.67 8.43 6.87 10.28 8.98 8.10
SD m 4.40 1.52 1.58 1.01 1.91 2.44 2.53 3.19 2.11 1.87 1.66 2.20 1.69 2.72
IP
PHome 43.27 44.33 44.26 44.75 44.53 43.86 44.25 44.43 44.15 44.17 44.30 43.64 44.54 44.22 44.75
IP
PDraw 26.99 26.48 26.47 26.23 26.38 26.96 26.56 26.31 26.60 26.44 26.48 26.74 26.36 26.61 28.62
IP
PAway 29.73 29.19 29.27 29.02 29.09 29.18 29.19 29.26 29.25 29.39 29.23 29.62 29.10 29.16 26.64
PFIPav 47.09 48.48 48.13 49.75 49.09 47.57 48.12 48.79 47.92 48.22 48.52 46.12 48.69 47.83 49.58
PUIPnd 24.48 23.55 24.06 23.70 23.79 23.70 23.76 23.91 23.87 23.94 23.92 24.09 24.17 23.58 24.29
N 10698 14927 14798 14571 15305 13360 14792 14272 15281 15348 15110 15372 12288 10921
Note: Indications are made in percent
Table 1: Descriptive statistics of implied margins and implied outcome probabilities
Examining the relationship between bookmaker’s implied probabilities and the underly-
ing actual chance of the outcome more precisely, Figure 3 and 4 in the appendix use scatter
plots for grouped bets on their actual chance of winning14 categorized by their implied
probabilities. In each plot the dashed diagonal line represents neutrality, or lack of any
14
The categories are specified by a bandwidth of 2.5 percentage points for implied probabilities and at
least 50 observations are required for each group.
18bias, between the mean bookmaker probabilities per group and their actual percentage of
winners. The solid line is estimated by a locally weighted polynomial regression (see Fan
(1992) and Fan and Gijbels (1996)) of implied probability on actual chance of winning us-
ing cubic polynomials, the Epanechnikov kernel and the rule of thumb bandwith (ROT)15 ,
so that no functional form of the relationship has to be prespecified. The grey areas are
defining the 95% confidence intervals, whereby the existence of a conventional favourite-
longshot bias would be indicated if the regression line was significantly above the diagonal
at low chance outcomes and below when the chances of winning approach unity implying
that favourites win more and underdogs less often than their betting prices imply (Cain
et al. (2000)). In case of home victory bets the regression line in Figure 4 tracks the di-
agonal line for the lower and middle part of the probability space closely with only vague
deviations. Narrowing the focus to bets with implied probabilities between 10% and 40%,
where a main part of the home victory bets are located, a slight local tendency to under-
estimate the true odds is revealed for EU 1, UK 1 and German 3. At the upper boundary
of the probability space the implied probabilities seem to underestimate the true odds as
well, particularly for German 1, EU 4 and EU 5, supporting the evidence from Table 1 of
underestimated favourite as well as underdog probabilities in general. Figure 5 plots the
relationship for away victory bets, whereby interestingly the lower boundary lacks of any
deviations from the diagonal except a slight heightened tendency in case of German 1,
EU 4 and EU 5. The biases at the upper boundary of the away victory probability space
is hard to examine due to very few observations in the dataset, in which a heterogeneous
picture EU 1 overestimating high probable away victories while German 1 and EU 5 dis-
play a reverse tendency similar to Figure 3. All in all, the analysis of the relationship
between the implied probabilities and the actual chance of winning revealed no clear bias
in line with the so-called favourite-longshot or home-field bias but some indications for
slight deviations at high and low probable outcomes which are differently characterized
for home and away win bets. In the following, we will assess whether these slight devi-
ations from neutrality in bookmaker prices may be exploited for superior expected returns.
Trading rules like always betting on the favourite, underdog, home or away team should
yield in expectation the same return according to the efficient market hypothesis. Table
2 states the average returns for these simple trading rules. The first line lists the average
returns a punter would have achieved by betting randomly on an individual bookmaker’s
odds in the sample. Obviously, the average returns should reflect the implied margins from
Table 1, hence we get an heterogeneous picture as well, whereby the returns are close to
the negative average overround estimate m in Table 1. The next two rows display the
15
Weighted least square regression using at each point of interest x the Epanechnikov kernel as weighting
function for points within the bandwidth neighbourhood of x. The results are robust to other kernel,
bandwith or polynomial specifications.
19GER 1 GER 2 GER 3 EU 1 EU 2 UK 1 UK 2 Uk 3 EU 3 EU 4 UK 4 EU 5 UK 5 UK 6
∅Return -17.25 -6.51 -7.40 -2.35 -5.48 -7.79 -7.99 -5.80 -7.93 -8.55 -6.91 -10.84 -8.94 -8.17
∅Ret. Home -13.29 -4.96 -6.15 -2.11 -4.57 -5.45 -5.96 -4.57 -5.83 -6.60 -5.39 -7.88 -7.22 -5.38
∅Ret. Draw -18.80 -6.50 -6.28 -1.07 -4.85 -8.21 -7.52 -4.25 -7.70 -7.66 -6.53 -10.35 -7.71 -8.11
∅Ret. Away -19.66 -8.08 -9.78 -3.86 -7.01 -9.70 -10.49 -8.59 -10.27 -11.41 -8.81 -14.30 -11.90 -11.01
# Bets 10698 14927 14798 14571 15305 13360 14792 14272 15281 15348 15110 15372 12288 10921
∅Ret. F av -11.89 -5.44 -6.32 -3.61 -5.46 -5.77 -5.64 -5.57 -6.05 -7.32 -5.94 -6.48 -7.50 -5.87
∅Ret. U nd 20.59 -7.34 -9.53 -2.29 -5.98 -9.08 -10.46 -7.37 -9.78 -10.53 -8.03 -15.05 -11.35 -10.20
# Bets 10482 14613 14522 14506 15147 13024 14468 14076 14938 15045 14881 14717 12154 10620
∅Home.F av -9.07 -4.04 -4.69 -2.47 -4.04 -4.23 -4.40 -3.82 -4.59 -5.30 -4.35 -5.07 -5.55 -4.25
# Bets 7859 10952 11039 10771 11311 9816 10978 10517 11304 11316 11195 11370 9231 8058
∅Home.U nd -4.20 -0.73 -1.38 0.43 -0.72 -1.19 -1.38 -0.62 -1.24 -1.25 -0.86 -2.53 -1.75 -1.03
# Bets 2623 3661 3483 3735 3836 3208 3490 3559 3634 3729 3686 3347 2923 2562
∅Away.F av -2.82 -1.40 -1.63 -1.14 -1.42 -1.54 -1.24 -1.74 -1.46 -2.02 -1.59 -1.41 -1.96 -1.62
# Bets 2623 3661 3483 3735 3836 3208 3490 3559 3634 3729 3686 3347 2923 2562
∅Away.U nd -16.38 -6.61 -8.15 -2.72 -5.27 -7.89 -9.08 -6.75 -8.53 -9.28 -7.17 -12.52 -9.61 -9.18
# Bets 7859 10952 11039 10771 11311 9816 10978 10517 11304 11316 11195 11370 9231 8058
Note: Indications are made in percent
Table 2: Average returns for various simple betting rules
betting returns for betting exclusively on home, draw or away win outcomes respectively.
Contrarily to the findings in the bookmaker’s implied probabilities, the strategy select-
ing only home team winning outcomes performs better than choosing one of the other
outcomes. From this ex-post return analysis, it seems that on average bookmakers un-
derestimate the occurrence of a home victory while overestimating favourable outcomes
for the visiting team. However, assessing betting strategies selectively on favourite or
underdog status results in an inconclusive picture in the next panel. Predominantly, ran-
domly betting can be slightly outperformed by betting exclusively on favourites while
selecting underdogs results in an inferior ex post return. Only in case of the low margin
bookmaker EU 1O there is a slight superior return by betting on underdogs. However,
since home teams have a higher probability of winning due to the home-field advantage
in football, home teams tend to be characterized as favourites more often. Therefore, a
potential home-field and favourite-longshot bias may be interconnected (Vlastakis et al.
(2009)) and is examined separately in the next panel. A different picture is now revealed.
The selective betting strategies on home teams with underdog status performed signifi-
cantly better than random betting or any of the other strategies. Noteworthy is that for
bookmaker EU 1 who has already been characterized by very low margins the ex-post
return changes to positive. Placing reverse bets on the same sample of matches, e.g. bets
on favoured visiting teams, sharply improves the average returns compared to randomly
betting as well and constitutes the best strategy for costumers of the two bookmakers
German 1 and Eu 5, which are characterized by substantially superior favourite returns
20You can also read