The Investor Guide to Deforestation and Climate Change JUNE 2020 - Ceres
←
→
Page content transcription
If your browser does not render page correctly, please read the page content below

The Investor Guide
to Deforestation and Climate Change
                             JUNE 2020

                                     1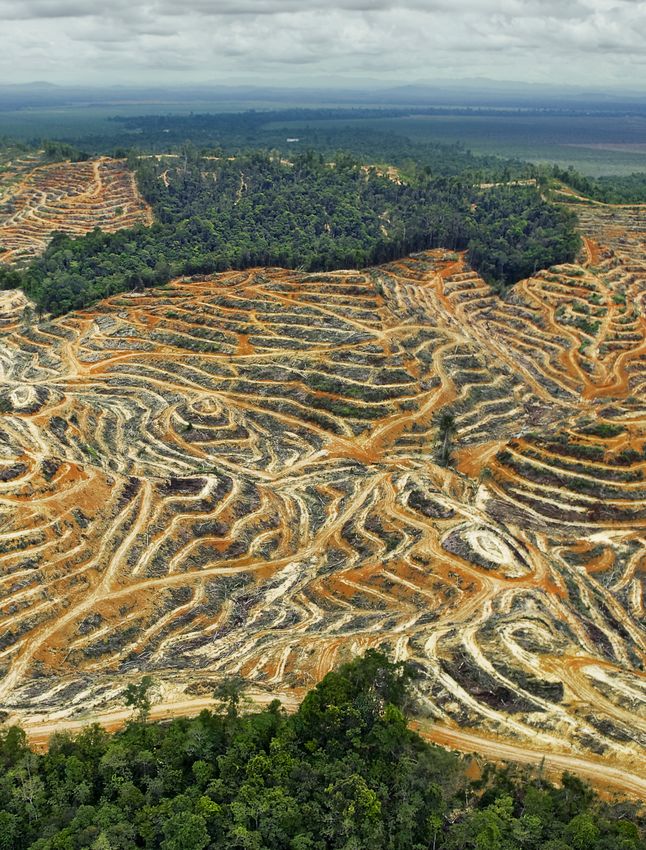
ABOUT CERES
Ceres is a sustainability nonprofit organization working with the most influential investors and companies to build lead-
ership and drive solutions throughout the economy. Through powerful networks and advocacy, Ceres tackles the world’s
biggest sustainability challenges, including climate change, water scarcity and pollution, deforestation, and inequitable
workplaces. For more information, visit www.ceres.org.

Support for this guide was provided by the Norwegian International Climate and Forest Initiative (NICFI),
the Gordon and Betty Moore Foundation, the David and Lucile Packard Foundation, and Erol Foundation.

Investor Reviewers
            Adam Kanzer                    Michelle Edkins and Hilary               Jimmy Yan
   BNP Paribas Asset Management           Novik-Sandberg, BlackRock               NYC Comptroller

The use of the BNP Paribas Asset Management, Blackrock, and the NYC Comptroller logos and/or the feedback provided
by these firms does not represent an investment endorsement or recommendation and does not reflect any policies or
positions of BNP Paribas Asset Management, Blackrock, or the NYC Comptroller.

Additional input provided by Stu Dalheim, Calvert Research and Management; Lauren Compere, Boston Common Asset
Management; Julie Gorte, Impax Asset Management; Frank Sherman and Natalie Wasek, Seventh Generation Interfaith
Coalition for Responsible Investment; Yasmine Svan, Legal and General Investment Management; and Jessye Waxman,
Green Century Capital Management.

Data Partners
Toby Gardner and Javier Godar, Stockholm Environment Institute through its Trase project
Florence Pendrill and Martin Persson, Chalmers University of Technology
Thomas Kastner, Senckenberg Biodiversity and Climate Research Centre

Scientific Advisory Committee
Our thanks to the following individuals who generously shared their time and expertise to review the data and
information in this guide for methodology and transparency of messaging, and to the Meridian Institute for facilitating
the review process.

Justin Adams, Tropical Forest Alliance
Ameer Azim, Climate Advisers
David Cleary, The Nature Conservancy
Stephen Donofrio, Forest Trends/Supply Change
Jamison Ervin, United Nations Development Programme, New York Declaration on Forests Global Platform Secretariat
Morgan Gillespy, CDP
Matthew Hansen, University of Maryland
Diane Holdorf, World Business Council for Sustainable Development
Michèlle Koper, Navigant a Guidehouse Company
Jeff Milder, Rainforest Alliance
Isabel Nepstad, Independent Consultant
Michael Obersteiner, International Institute for Applied Systems Analysis (IIASA)
Matt Ramlow, World Resources Institute, GHG Protocol
Rosa Maria Román-Cuesta, Center for International Forestry Research (CIFOR)
Martha Stevenson, World Wildlife Fund
Viera Ukropcova, CDP
Lini Wollenberg, CGIAR Research Program on Climate Change, Agriculture and Food Security (CCAFS)/
  Gund Institute for Environment
Heather Wright, Moore Foundation
Michelle Zollinger, Quantis

Authors
Meryl Richards		         Rebecca Stern
Nako Kobayashi		         Peyton Fleming
Julie Nash

Thanks to Hugh W. Brown Jr., Ana Orians, Cambria Arvizo, Sarah McCracken and George Grattan for providing support for
this project. Design by Maura Conron. Photo by Mattias Klum, National Geographic.
                                                                                                                            2
Table of Contents

Introduction

PART 1
 Deforestation and its Effects on Climate Change page 4
       Greenhouse gas emissions from deforestation
       Forests as a climate solution

PART 2
 Material Risks of Deforestation page 8
       How deforestation fits into climate scenario analysis
       Deforestation’s risks go beyond climate

PART 3
 Countries and Commodities of Risk page 11
       The geography of tropical deforestation
       Commodity drivers of deforestation

PART 4
 Assessing Portfolio-wide Deforestation Risk and Prioritizing Engagements page 14
       Portfolio-level analysis
       Company/security-level analysis

PART 5
 Evaluating Corporate Actions and Engaging with Companies page 21
       Company climate targets
       Meeting climate targets requires addressing supply chain deforestation
       No-deforestation policy
       Supply chain implementation
       Disclosure of progress
       Company examples

PART 6
 Engaging on Deforestation – Next Steps page 29

APPENDIX page 30
     Definition of terms
     Methodology
     Uncertainty associated with the data

ENDNOTES page 32

                                                                                    3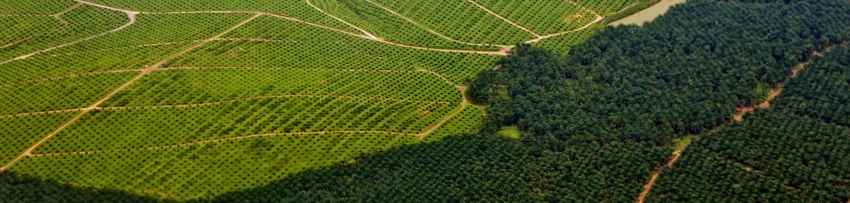
Introduction

As a major driver of climate change, global deforestation has significant financial implications for investors.

Even as the COVID-19 pandemic throttled the global economy, deforestation continued largely unchecked
in many parts of the world. Every day, vast swaths of tropical forests are razed for production of agricultural
commodities such as soybeans, palm oil and beef that eventually make their way to grocery shelves world-
wide. Clearing and burning forests emits staggering amounts of greenhouse gases (GHGs) and reduces the
land’s ability to store carbon. Protecting and restoring forests and other natural ecosystems are second only
to eliminating fossil fuel use as a solution to climate change.

In addition to increasing investors’ exposure to the systemic risk of climate change, deforestation poses
additional salient risks. It accelerates global biodiversity loss and disruption of local and global precipitation
patterns – something Brazil’s Amazon region is already seeing with reduced rainfalls and shorter growing
seasons. It also drives animals closer to human contact which can increase the occurrence of animal-borne
infectious diseases.

Given these wide-ranging material impacts, investors should recognize and act on deforestation with the
same vigor and urgency they bring to other drivers of climate change. Just as investors engage fossil fuel
companies to reduce their carbon footprints, they should also engage companies in a wide range of indus-
tries that source agricultural and forest commodities – food and consumer products, auto components,
textiles and apparel, among others – to eliminate deforestation from their commodity supply chains.

The stakes – and opportunities – are enormous. Companies that fail to reduce emissions from deforestation
will face reduced market access, reputational risks, legal sanctions and other forms of financial exposure due
to increasingly stringent policies, regulations and consumer expectations as the world shifts to a low-carbon
global economy. Eliminating deforestation from supply chains is an achievable way to significantly reduce
corporate greenhouse gas emissions and the systemic burden of climate change. Investors can use their
influence as shareholders to engage with companies on deforestation as a way to mitigate portfolio-wide
climate risks.

And now is the time. The Amazon is approaching a disastrous tipping point where vast areas of rich tropical
forest are being transformed into degraded savannah and scrubland. Progress in limiting global temperature
rise to 1.5 degrees Celsius – the goal of the Paris Climate Agreement – is behind schedule, and a huge shift
in wide-ranging human activities is needed immediately. Eliminating deforestation is a linchpin of this shift.
Simply put, we cannot avoid potentially catastrophic climate warming without eliminating deforestation.

This guide – the result of extensive input from investors and deforestation experts – gives investors a frame-
work to help them understand and engage on deforestation-driven climate risks across their portfolios. It is
especially intended for investors – in particular, engagement specialists – who are relatively new to defor-
estation and may be engaging on climate risk but not deforestation risk. The guide will help them understand
the drivers of deforestation risk and prioritize company engagements based on industries, geographies and
sourcing patterns. It also outlines key expectations that investors should be looking for in corporate climate
and deforestation commitments and example questions for company and sector engagements. Lastly, the
guide provides concrete next steps investors can take to address deforestation risk.
                                                                                                               4
PART 1
Deforestation and its Effects on Climate Change

Human use of land has a unique role in climate change. Collectively, agriculture, forestry and other land uses
are the second-largest source of greenhouse gas emissions behind the energy sector. At the same time,
land is also the largest potential solution to climate change because of the twin opportunities to both reduce
emissions from land use practices and remove additional carbon from the atmosphere by sequestering it in
trees and soils. Lastly, land provides the basis for human livelihoods and well-being through food and fresh-
water supplies, climate and disease control and natural disaster mitigation. These ecosystem services are
already compromised due to the effects of a 1 degree Celsius (1.8 Fahrenheit) rise in global temperatures
and will be further undermined as temperatures continue to increase.1

To manage climate risk, investors have historically focused on sectors such as energy and industrials due
to their significant contribution to GHG emissions from fossil fuel extraction and consumption. However, a
growing number of investors are awakening to the large climate risk inherent in land use practices, and the
even larger opportunity to mitigate climate change by changing them. There are many land-based climate
solutions, but preventing destruction and degradation of forests and promoting forest restoration will have
the largest impact in mitigating climate change.

GHG emissions from deforestation

Forests store large amounts of carbon in trees and soils. If the carbon in a single square kilometer of tropi-
cal forest was emitted as carbon dioxide (CO2) it would be equivalent to the CO2 emissions from the annual
energy usage of 12,000 U.S. homes.2 When forests are converted to agriculture, mining or other land uses,
felled trees are burned or left to decompose. The carbon in those trees is emitted mostly as CO2 and burning
emits other GHGs such as nitrous oxide and methane. Carbon-rich forest soils are then plowed to plant crops
or pastures, releasing even more GHGs into the atmosphere.

While maintaining healthy forests globally is critical to mitigating climate change, the majority of deforesta-
tion and most of the net GHG emissions from deforestation occur in the tropics. This is because tropical
forests (1) currently face the highest pressure for large-scale conversion to agriculture and (2) store large
amounts of carbon—much more than temperate forests.3

Tropical deforestation has a number of drivers. The largest share is due to forest clearance for agriculture
and tree plantations. Tree plantations are human-planted forests that produce timber or wood pulp for paper,
and often store less carbon than natural forests. A smaller proportion of tropical deforestation is due to
mining, urbanization, energy infrastructure and natural forest fires. This guide focuses on GHG emissions
from deforestation due to expansion of agriculture and forest commodities, which are the most likely to show
up in the portfolios of institutional investors. This commodity-driven tropical deforestation is responsible
for approximately 2.6 gigatons of CO2 emissions annually—or 5 percent of global GHG emissions.4

                                                                                                                  5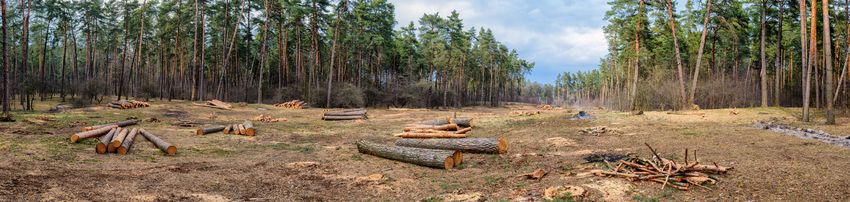
While the contribution of deforestation to GHG emissions has the largest and most direct impact on the
    climate, deforestation contributes to climate change in three other ways as well. First, deforestation not only
    releases carbon already stored in trees and soils, it also eliminates the future potential of the forest to
    sequester additional carbon. Intact tropical forests have absorbed a significant share of human-caused CO2
    emissions in recent decades, though their future potential as carbon sinks is uncertain (see box on
    Loss of Forest Carbon Sinks below).5

    Second, deforestation contributes indirectly to climate change by replacing a sink of GHGs with new GHG
    sources. Agricultural activities that replace forests emit additional GHGs such as methane from livestock
    and nitrous oxide from fertilizer use.

                                       Third, forests shape local and continental climates by driving movements
LOSS OF                                of air, water and heat through evaporation and transpiration. Deforestation
FOREST CARBON SINKS                    alters these dynamics in ways that can dramatically impact temperature
Tropical forests help sequester        and precipitation both locally and thousands of miles away.6 For example,
carbon emissions from human            in parts of the Amazon, rainy seasons have been delayed by two weeks due
activity and thus for a long time      to deforestation.7 Such changes can create feedback loops whereby drier
have been considered an import-        conditions jeopardize the health of forests and cause fires—both natural
ant carbon sink. However, recent       and manmade—to spread out of control, emitting GHGs and further
scientific evidence indicates that     exacerbating deforestation.
the ability of tropical forests to
                                       UNDERSTANDING GHG EMISSIONS FROM LAND
sequester carbon in trees is in
                                       According to the 2019 IPCC Special Report on Climate Change and Land,
decline, potentially due to the
                                       23 percent of global GHG emissions are from land. Of that, 11 percent of
impacts of drought and heat.
                                       emissions are from deforestation and conversion of natural ecosystems
The Amazon rainforest, for
                                       to human uses. The remaining 12 percent are emissions directly from
example, may cease to seques-
                                       agricultural production such as livestock and fertilizers. Tropical
ter additional carbon after 2040.
                                       deforestation contributes 7 percent of global GHG emissions,8 and most
Because of this shifting dynamic,
                                       of that—5 percent of global GHG emissions—is driven by production of
climate change impacts in the
                                       agricultural and forest commodities (Figure 1).
tropics may be even more severe
than predicted, adding to the
                                       For definitions of terms used in this guide, please see the appendix.
imperative to preserve existing
tropical forests.9

                                          Figure 1
                                          GHG emissions
                                          from land
                                                                                                                      6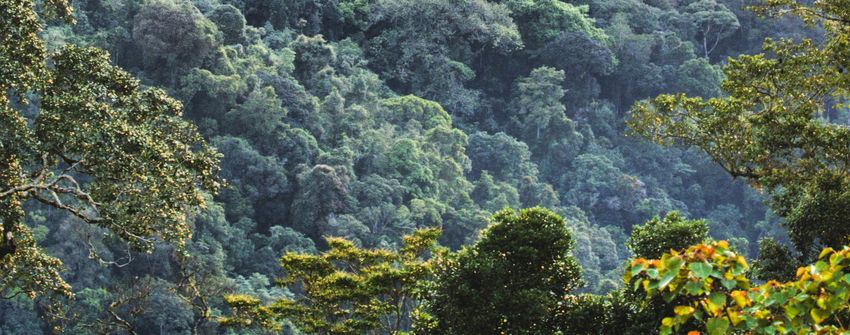
Forests as a climate solution

IT WILL NOT BE POSSIBLE TO LIMIT THE AVERAGE GLOBAL TEMPERATURE RISE TO 1.5° CELSIUS
WITHOUT HALTING DEFORESTATION.

Eliminating commodity-driven tropical deforestation could reduce global annual GHG emissions by 5 per-
cent.10 However, considering only emissions from deforestation underestimates the potential contribution
of forests and other natural ecosystems to reduce greenhouse gases in the atmosphere. Restoring forests
on previously deforested areas could sequester large amounts of carbon. Protecting and restoring other
natural ecosystems such as grasslands, peatlands and coastal wetlands could also help mitigate climate
change. Added together, protecting and restoring forests and other natural ecosystems could provide
16-30 percent of the climate change mitigation needed to limit global warming to 1.5-2 degrees
Celsius—the goal of the Paris Climate Agreement.11 That’s nearly three-quarters the mitigation potential
of all renewable energy technologies combined (Figure 2).

Avoiding catastrophic climate change will require reducing or sequestering a combined 1,580 gigatons of
GHG emissions between 2020 and 2050 (Figure 2).12 To meet this challenge, we must deploy an entire suite
of climate solutions: climate-smart agriculture practices that maintain soil carbon and reduce emissions
from livestock and fertilizers; agroforestry systems that incorporate trees within croplands and grazing
lands; solar and wind energy as primary electricity sources; improved energy efficiency in factories and office
buildings; alternatives to and proper management of CFCs and HCFCs used as refrigerants; electrification
of vehicle fleets and efficient low-carbon aviation and shipping; and technologies such as clean cookstoves
for the three billion people who currently cook over wood and charcoal. But forests and other natural ecosys-
tems are a large—and previously overlooked—part of the solution. When addressing climate risk in their
portfolios, investors have an opportunity to elevate the role of forests and other natural ecosystems
alongside solutions such as renewable energy that have historically been the focus of corporate and
policymaker engagements.

Figure 2 Comparison of climate solutions in terms of their potential to reduce GHG emissions and sequester carbon between 2020 and 2050.
Data are from Drawdown Review 2020,13 which provides individual estimates for 78 climate solutions. Solutions are grouped here according
to how investors might assess their portfolios for opportunities and elevate solutions in investor-company dialogues. Please refer to the
companion website.
                                                                                                                                            7
PART 2
Material Risks of Deforestation

How deforestation fits into climate scenario analysis

Climate change is considered a systemic risk that poses wide-ranging vulnerabilities to businesses in all
sectors. It also has the potential to trigger severe economic instability and collapses of entire industries.
As a key driver of climate change, deforestation exacerbates this risk. Therefore, it is in the clear finan-
cial interest of investors – consistent with their fiduciary duty—to effectively manage climate-related risks by
engaging with companies with deforestation exposure.

To better understand the material impacts of climate change, the Task Force on Climate-related Financial
Disclosures (TCFD) recommends that companies and investors conduct climate scenario analysis. Scenario
analysis provides a way to consider business risks and opportunities in a path leading to a particular out-
come. To assess the potential impacts of climate change on a company’s bottom line or on an investment
portfolio, the TCFD recommends using a 2 degrees Celsius or lower transition scenario, in addition to two or
three other relevant climate scenarios.

Through this exercise, investors can assess how their portfolio companies’ current business operations
and supply chains might perform in the short- and long-term under different future scenarios. The TCFD
recognizes two core categories of climate risks: transition risk and physical risk.

                       Transition risk refers to financial impacts companies may face if they fail to adapt
                       to foreseeable changes in regulation, laws, consumer behavior and market systems
                       that will occur in the transition to a lower-carbon global economy.

                       Physical risk refers to ongoing and projected physical impacts of climate change
                       on businesses. These may be driven by a single event such as an extreme drought,
                       flood or fire, or they may be chronic changes caused by longer-term shifts in local
                       and global precipitation, temperature and sea levels.

Companies and investors should account for deforestation and its associated GHG emissions in order
to have a complete view of how climate change will affect businesses and portfolios. Companies sourcing
agricultural and forest commodities have exposure to transition risks due to their deforestation-related
GHG emissions, as well as high levels of physical risk that are exacerbated by deforestation.14

                                                                                                               8
The following transition and physical climate risks related to deforestation should be considered in a
company’s climate scenario analysis (Table 1):

Table 1 How deforestation exacerbates climate risk

 TRANSITION RISK
                          Companies may incur stranded assets if they are unable to function at current or project-
                          ed capacity due to the risks mentioned below.15 These risks may not come directly from
                          changes to a company’s own operations, but may result from suppliers being unable to
 OPERATIONAL
                          produce sufficient volumes of inputs due to policy changes, consumers demanding less
                          products linked to deforestation and other factors.

                          Companies may lose contracts and see lower credit ratings if they are unable to shift prac-
 MARKET                   tices to what is needed for a lower carbon economy, including eliminating deforestation.

                          Policy mechanisms like carbon pricing, border carbon taxes and other climate change
 REGULATORY               regulations will make deforestation a costly, if not impossible, practice due to it being
                          a large source of GHG emissions.16

                          Increasingly, legal actions are being taken against high emitting companies that may be
 LITIGATION               responsible for escalating climate-related damages.17

                          Investors and consumers alike are increasingly demanding that companies align products
 REPUTATIONAL             and services with global emissions-reduction goals.18 This could lead to reduced consumer
                          demand for deforestation-linked products.

 PHYSICAL RISK
                          Shifting production zones and more extreme weather events will lead to lower yields
                          and stranded assets on company-owned plantations and crop fields.19 Deforestation
 OPERATIONAL              exacerbates these effects, making agricultural supply chains less resilient. Companies
                          may need to invest in technologies and nature-based solutions to help producers adapt.

                          Input costs will be increasingly variable and rise in the long-term due to the physical
 MARKET                   operational risks faced by upstream suppliers, leading to higher production costs.

The financial materiality of deforestation, beyond climate change impacts

Outside the context of climate scenario analysis, deforestation poses other significant and financially
material risks that can affect a company’s bottom line. Companies that fail to ensure that their products
are not sourced with deforestation expose themselves to potential regulatory action, reduced market access
and loss of customers in the near-term, as well as supply chain disruptions and increased production costs
in the long-term. For more information on how deforestation activities have led to material impacts for
companies, please see the Case Study Series: Business Risks from Deforestation.

                                                                                                                        9
Other salient risks from deforestation

Forests are a highly valuable form of “natural capital” and provide numerous benefits beyond climate change
mitigation. The following are other salient issues stemming from deforestation that pose material risks for
companies if left unmitigated:

                        Tropical forests are extremely biodiverse. The Amazon alone is home to 10 percent of
                        the world’s species.20 Recent research shows that preserving biodiversity and related
                        ecosystem services is vital to limiting global temperature rise to 1.5 degrees Celsius.21

      Biodiversity
                        Because forests play an important role in local, regional and global water cycles,
                        deforestation in places like the Amazon could have impacts as far-reaching as
                        devastating droughts in the Midwestern U.S.22 Deforestation also reduces water
                        availability and water quality which has implications for regional food security.
     Water Security

                        Deforestation may involve wrongful displacement of indigenous peoples and
                        destruction of areas that provide cultural importance and resources such as food,
                        fuel and medicine.23 Research also shows that land managed by indigenous peoples
                        may be more effective in storing carbon and mitigating climate change.24
     Human Rights

                        Deforestation is often illegal and may represent criminal activity upstream in supply
                        chains.25 Supply chains with illegal deforestation place workers at risk and make
                        businesses susceptible to potential litigation.
    Criminal Activity

                        Because of the stability trees provide through their extensive root systems, forests
                        also provide protection from natural disasters that are expected to escalate due to
                        climate change.26

    Natural Disasters
                        Forest loss drives wildlife closer to people, increasing human exposure to animal-borne
                        pathogens. Deforestation is closely associated with zoonotic emerging infectious
                        diseases such as SARS, MERS, Ebola, and, potentially, COVID-19.27/28 Deforestation and
                        climate change may also exacerbate the spread of mosquito-borne diseases such as
                        the Zika virus and malaria.
   Zoonotic Diseases

     OPPORTUNITIES TO INVEST IN FORESTS AND OTHER NATURAL CLIMATE SOLUTIONS
     While investors should prioritize addressing the risks posed by deforestation in their portfolios,
     there are also substantial opportunities to invest in conservation, restoration, and sustainable
     management of forests, farmlands, and wetlands. These so-called “natural climate solutions”
     represent an investment opportunity of potentially hundreds of billions of dollars over the coming
     decade, as carbon pricing enables new investment models that integrate production with conser-
     vation and restoration. Opportunities exist across asset classes: corporate or government green
     bonds; equity investments in innovative food companies that are reducing pressure on land; and
     real assets investments in forestry and agriculture that meet high sustainability criteria.

                                                                                                                    10
PART 3
Countries and Commodities of Risk
While most securities in investment portfolios are not directly responsible for deforestation, GHG emissions
from deforestation are embedded in the supply chains of a wide variety of companies. Exposure to deforesta-
tion is related to the sourcing of specific agricultural and forest commodities from specific locations. Under-
standing key geographies and commodities of exposure enables investors to identify risks in their portfolio
and engage strategically on deforestation as a driver of climate change. While these commodities and loca-
tions may change over time, some enduring patterns allow investors to hone in on risks within their portfolios
and prioritize engagements.
The geography of tropical deforestation
A large proportion of the world’s remaining tropical rainforests are concentrated in Brazil and Indonesia,
which are also countries with large agricultural economies. As a result, approximately 60 percent of GHG
emissions from commodity-driven tropical deforestation occurs in these two countries: 33 percent in
Indonesia and 27 percent in Brazil. An additional 20 percent of deforestation-related emissions come from
Malaysia, the Democratic Republic of the Congo, Mexico, Myanmar, Australia, India and Peru (Figure 3).29
In the past 15 years, Argentina, Bolivia, Papua New Guinea and Paraguay have also at various times contribut-
ed between 2-3 percent of annual deforestation-related GHG emissions. For a full list of deforestation-related
emissions by country, please see the companion website.
Brazil, where most of the Amazon rainforest is
located, has already lost an area of forest the size
of Poland to soybean fields and cattle ranches.
Deforestation in the Amazon had been decreasing
since the early 2000s, but recent trends are revers-
ing this progress. 2019 saw the highest rate of de-
forestation since 2007-08,30 with fires that darkened
São Paulo with their smoke. And in the first four
months of 2020, deforestation in the Amazon was
already 55 percent higher than 2019, possibly due
to reduced law enforcement during the COVID-19
pandemic.31 Another region of Brazil, the Cerrado, is
also a hotspot for deforestation and conversion of
grassland ecosystems. This region has fewer legal
protections and is not covered by existing mora-
toriums. Other South American countries such as
Colombia, Peru, Ecuador, Bolivia and Paraguay
are also countries of concern for commodity-driven
deforestation, as well as parts of Central America
and southern Mexico.
Figure 3a GHG emissions from deforestation and logging in South
America, 2010-2018. Map created using data from Global Forest
Watch
11Indonesia has historically had one of the highest rates of
deforestation in the tropics, but progress has been made
in the last few years to slow natural forest losses. In 2018,
deforestation fell by 40 percent compared to the annual
rate from 2002-2016.32 However, Indonesia still has one of
the highest rates of deforestation-related emissions, and
hotter and drier weather in 2019 led to a particularly bad
fire season and deforestation increases. Neighboring
Malaysia also has high deforestation rates, with a
26 percent decrease in tree cover from 2000-2018.33
Deforestation in Indonesia and Malaysia—of which palm
oil production is the largest driver—has a disproportion-
ate impact on climate change because it often occurs
on peatlands. Peatlands are water-logged soils that are
mostly organic matter. These soils can store up to 10
times as much carbon as the trees that grow in them,
but when they are drained to plant crops, that carbon is released as CO2. Nearly one quarter of tropical
deforestation-related GHG emissions are due to peatland drainage.34 Peatland soils continue to emit CO2
for decades after drainage, making them an enduring contributor to climate change. Once drained, they are
also very susceptible to fire.
Most deforestation-related GHG emissions in Africa are
due to smallholder subsistence farming rather than com-
mercial farming, so these emissions do not usually show
up in global supply chains.35 There are a few exceptions,
such as cocoa production in West Africa. Around two-
thirds of all cocoa globally is produced in Côte d’Ivoire
and Ghana, where it has historically been a driver of
deforestation.36
Figure 3b GHG emissions from deforestation, logging and peat
drainage in Southeast Asia and Australia, 2010-2018. Map created
using data from Global Forest Watch
Figure 3c GHG emissions from deforestation and logging in Africa,
2010-2018. Map created using data from Global Forest Watch
TEMPERATE AND BOREAL FORESTS
While tropical forests face the highest pressures for large-scale
conversion to agriculture, forests at boreal and temperate latitudes also
face pressure from timber extraction and other forestry activities. Large
swaths of these forests, especially in boreal regions such as northern
Canada, are on frozen peatlands that, like their tropical counterparts,
store large amounts of irrecoverable carbon.37 These peatlands are threat-
ened by melting and fires that have been exacerbated by temperature
increases.38 Investors can reduce these risks by encouraging compa-
nies sourcing timber and wood pulp (paper products) to strengthen their
no-deforestation and forest management policies. For example, logging
activities should be discouraged in intact, previously undisturbed forests.
12Commodity drivers of deforestation
Beef and leather,40 palm oil, soybeans,
forest products such as timber and pulp,
rubber, cocoa and coffee are all major
drivers of deforestation that commonly
show up in global supply chains (Figure 4).
These commodities collectively account
for 62 percent of tropical deforestation-
related GHG emissions. Maize (9 percent)
and rice (8 percent) are also significant
drivers of deforestation in Indonesia,
the Democratic Republic of the Congo
and Brazil; however, these staple crops
are primarily consumed domestically in
these countries and are less likely to Figure 4 Distribution of tropical deforestation-related GHG emissions between global-
show up in the supply chains of multina- ly-traded commodities. *Maize and soybeans are often grown on the same land during
different seasons in Brazil; emissions have been divided between the two crops. *Maize
tional companies.41 The remaining 20 per-
and rice are primarily consumed domestically. Data from Pendrill et al. (2019).39
cent of emissions are due to a wide variety
A complete data table with all commodities is available on the companion website to
of other commodities, each responsible this guide.
for between 1-2 percent of emissions.
Many of these commodities are also produced primarily for domestic consumption, with a few exceptions
such as sugar cane and wheat of which 30-40 percent of emissions are embedded in exports.42
GHG emissions from soybean cultivation are likely to be higher than the data show in Figure 4 because soy-
beans are also a major driver of conversion of savanna and grassland ecosystems in Brazil, which typically
do not show up in deforestation estimates. The same is true of timber and pulp; the emissions represented in
Figure 4 only reflect tree plantations, such as removing natural forests and replacing them with fast-growing
tree species such as Acacia and Eucalyptus. Selective logging in natural forests does not result in sufficient
loss of tree cover to be considered deforestation, but it does contribute to carbon losses from forest land-
scapes. While this carbon may be re-sequestered by tree re-growth, this process takes time—in many cases,
more time than we have to avoid dangerous climate impacts.
Uncertainty in attributing deforestation to specific commodities
Attributing deforestation to specific commodities is complex and uncertain since there is often a lag time of
one or two years between the deforestation event and when the crop is planted. Additionally, deforested land
is often converted to an intermediate use before the final use. For example, deforestation in Brazil is often-
times driven by land speculation, where buyers purchase the land, set fire to the forest to convert it to pasture
and then quickly sell it to a soy producer at an increased price.43 For this reason, robust corporate no-defor-
estation policies should apply to all commodities sourced by a company and specify cut-off dates—the date
after which deforestation renders an area non-compliant with the policy. By strengthening policies in this
way, companies send market signals discouraging speculative deforestation. For details on the methodology
used to attribute deforestation to specific commodities, please see Pendrill et al. (2019) and the website that
accompanies this guide.
13PART 4
Assessing Portfolio-wide Deforestation Risk
and Prioritizing Engagements
Translating deforestation-driven climate risk at the security/company level requires understanding a
company’s exposure to deforestation. To assess these risks and prioritize company engagements, investors
should analyze their exposure based on the sectors and industries represented in their portfolios, as well
as the geographic location of the securities in those sectors and industries. Once potential companies have
been identified, investors should consider their commodity sourcing patterns to highlight specific risks and
actions companies are taking to mitigate those risks (Figure 5).
Figure 5 Framework for assessing deforestation-driven climate risk
Portfolio-level analysis
Sector exposure to commodity-driven deforestation
Companies in many sectors and industries are exposed to deforestation through their sourcing of commodi-
ties that are drivers of deforestation (Table 2). Consumer staples are exposed to nearly every commodity
associated with deforestation. Within this sector, the food products and food & staples retailing industries
are likely to have high exposure due to the prevalence of all forest risk commodities across their supply
chains. However, deforestation exposure is not unique to these food industries. Palm oil is also used widely
in soaps, detergents and makeup, creating exposure in household products and personal products
industries.
The consumer discretionary sector has several industries that are exposed to deforestation due to their
reliance on leather, rubber, timber and paper. Textiles, apparel and luxury goods are exposed to deforestation
from cattle due to leather sourcing as well as wood pulp used to make fabrics. Hotels, restaurants & leisure
companies are exposed through food sourcing for restaurants.
14In the materials sector, containers and packaging and paper and forest products are exposed to defor-
estation associated with forest plantations, as well as additional emissions from forest degradation due
to logging. Finally, the financial sector is exposed to deforestation risk through financing of the industries
described above.
The number of different commodities sourced by an industry is indicative of the breadth of potential
exposure of individual companies within the industry, but it is not numerically proportional to the exposure
of companies within that industry. Deforestation risk depends on the particular commodities and the volume
of those commodities being sourced since some commodities are bigger drivers of deforestation than
others. Deforestation risk further depends on the geographies from which companies are sourcing their
commodities and the company’s approach to managing deforestation in their supply chains. Assessing
these components of deforestation risk generally requires company engagement. Guidance on this is
described under company/security-level analysis.
15Table 2 Sector and industry exposure to commodities associated with deforestation using the Global Industry Classification Standard (GICS®)
Sector Industry Commodities associated with deforestation
Beef, cocoa and coffee are relatively easy to spot in grocery products, but palm oil
and soybeans may be hidden in processed products. Palm oil and its derivatives
are widely used in food processing and show up in products such as bread, pastries,
Food Products
cereal, peanut butter, chocolate and margarine. Soybeans are made into soybean
oil for cooking and are consumed by pigs and poultry as soy meal, so emissions
from soy-related deforestation are embedded in those products.
Consumer
staples
Household Products; Palm oil and its derivatives are widely used in soaps, detergents and makeup.
Personal Products Cocoa butter is also used in personal care products.
Food distributors and retailers source all food commodities associated with
Food & Staples Retailing
deforestation, as well as paper products for packaging and shipping.
Footwear and luxury goods companies source leather and rubber. Textiles
Textiles, Apparel &
and apparel industries use woven fiber from wood pulp, often sourced from
Luxury Goods
deforested areas, into rayon, viscose and modal fabrics.
Household Durables Home furnishings use leather and timber.
Hotels, Restaurants & Hotels, restaurants and resorts source paper and food commodities,
Leisure as well as timber used in furniture.
Tire manufacturers source over 70 percent of the world’s rubber.
Consumer Auto components
Leather is also used in automobile interiors.
discretionary
Internet and direct marketing retailers source products containing all commodities
Internet &
associated with deforestation, such as food products, footwear, apparel and furni-
Direct Marketing Retail
ture. They also use large amounts of paper packaging in their shipping operations.
Multiline retail; Retailers of shoes, apparel, office supplies, auto parts and home furnishings are ex-
Specialty retail posed to deforestation through products using leather, rubber, timber and paper.
Forest plantations for wood pulp (paper and cardboard) production,
Containers & Packaging
are a major driver of deforestation.
Materials
Forest plantations for wood pulp (paper and cardboard) and timber
Paper & Forest Products
are a major driver of deforestation.
Oil, Gas &
Energy Soybean oil and palm oil are used for production of biodiesel.
Consumable Fuels
Independent Power and Biomass power plants burn wood pellets. Claims that this process is
Utilities Renewable Electricity
Producers carbon neutral have been disputed by scientists.44
Finance institutions are exposed to deforestation through their financing
Financials Banks
of companies in all of the above industries.
16Geographic portfolio exposure to commodity-driven deforestation
Identifying investments in key sectors that source commodities associated with deforestation is an
important first step in assessing portfolio-level deforestation exposure. To further narrow securities for
engagement, investors should examine the countries where they are invested in these industries.
Most GHG emissions from tropical commodity-driven deforestation occur in emerging economies such as
Indonesia, Brazil and Malaysia. Investors may therefore have significant exposure through their investments
in these emerging markets. However, due to global trade of forest-risk commodities, emissions are also
embedded in the supply chains of companies in developed markets, as well as other emerging market
economies where deforestation is less prevalent. All told, up to 39 percent of deforestation-related GHG emis-
sions are driven by international trade. The top six economies—the United States, European Union, Japan,
China, India and Pakistan—collectively “import” about 17 percent of global GHG emissions from tropical
commodity-driven deforestation through their use of commodities produced on deforested land (Figure 6).45
Figure 6 Heatmap showing flow of deforestation-related GHG emissions from producing to importing countries, covering 50 percent of emission
flows embedded in trade. The importing country is not necessarily the country of final consumption, but rather where the agricultural or forest
commodity is used for manufacturing. Data from Pendrill et al. (2019).46 Data table available on the companion website.
The balance of exposure between emerging and developed economies varies by commodity. Beef from
tropical countries with high deforestation is primarily consumed domestically. Exposure to beef-related
deforestation in the food products, food retail and hotel industries is more likely to be concentrated in
emerging economies. The same holds true for timber and pulp products from tropical countries. (Developed
economies may be exposed to emissions related to forest degradation in northern latitudes, but that data
is not represented or used in this report.) Deforestation-related emissions from other commodities such as
soybeans and palm oil are primarily exported, and are more likely to be embedded in products sourced by
companies in developed markets.
Deforestation driven by domestic consumption, as well as exports to other emerging markets, may still
be a source of exposure for equities listed in developed markets. Companies based in the U.S. and EU have
manufacturing operations all over the globe, and produce food, beverages and other products for consump-
tion in emerging markets. For example, while most chocolate produced in Brazil is consumed domestically,
the Brazilian chocolate market is dominated by multinational companies such as Nestlé and Mondelez, which
are headquartered in Switzerland and the U.S., respectively. Data on the location of company headquarters
and operations may be available in 10-K filings.
17Company/security-level analysis
Once priority companies have been identified for engagement, investors can scrutinize the exposure of each
company in three ways: analyzing the company’s sourcing patterns; examining the company’s GHG inventory;
and evaluating the company’s deforestation mitigation strategy.
Sourcing analysis
In the previous section, we described how to assess portfolio-level exposure based on production and trade
patterns of forest-risk commodities. At the security level, investors can further assess company-specific
risks based on the countries—and even locations within those countries—from which companies source
particular commodities.
Commodities that drive deforestation-related emissions differ widely between countries. Information on
these commodity-country combinations can be used to conduct an initial screening for deforestation
exposure at the security level by examining from where companies are sourcing their commodities and
comparing it against the countries in which each commodity is a driver of deforestation (Figure 7). For exam-
ple, companies sourcing beef and soybeans from Brazil or palm oil from Indonesia are likely to have defor-
estation exposure; these commodity-country combinations are collectively responsible for about 37 percent
of GHG emissions from tropical commodity-driven deforestation.47 Companies sourcing soybeans from Brazil
are far more likely to be exposed to deforestation than companies sourcing soybeans from the United States.
Many companies, especially in the food and beverage sector, include a list of key commodities they source
in their 10-Ks and other financial filings. This data may also be available in sustainability reports and other
public sustainability disclosures such as CDP reports, as well as in materials that Ceres provides to its
investor network members.
While some companies disclose more detailed sourcing information—such as from what countries and
in what volumes they source these commodities—this information is not widely available. Disclosures are
often limited to direct (tier 1) suppliers that provide raw materials and inputs and fail to include indirect (tier 2)
suppliers—from whom their suppliers purchase raw materials and inputs—that are also sources of exposure.
Investors should consider seeking this tier 2 data to better understand a company’s sourcing patterns.
Figure 7 Geography of deforestation-related GHG emissions due to each of the major commodities that are drivers of deforestation. Countries
are shaded according to the total deforestation-related GHG emissions occurring in that country. Commodity icons are shown for each country
that contributes at least 5% of the total tropical deforestation-related emissions for that commodity. Data from Pendrill et al. (2019). 48
Data table available on the companion website to this guide.
18ENGAGEMENT OPPORTUNITIES TO REDUCE DEFORESTATION ON THE GROUND
Investors should urge companies that source commodities from high-risk countries to adopt and
implement a robust no-deforestation commitment and engage constructively with suppliers before
moving sourcing away from these regions. While moving sourcing away from high-risk areas reduc-
es company exposure to deforestation risk, it doesn’t always reduce deforestation on the ground
because producers involved in deforestation may simply find less scrupulous buyers—sometimes
called “leakage markets”—for their products. Engagements with traders and banks are a potentially
effective tool to address leakage markets.
Within supply chains, deforestation exposure is often concentrated with traders, meatpackers
(beef) and refiners (palm oil). Most traded commodities are handled by a relatively small group of
traders, many of whom are active in several commodities and in multiple countries. For example,
of the 2,500 traders exporting forest-risk commodities from Latin America, just three-dozen account
for over half of those exports.49 Because of their major role in supplying commodities to thousands
of companies, engagements with traders are an especially effective way to reduce demand for com-
modities from deforestation-sensitive areas. More information on this activity can be found in Ceres’
Engage the Chain website.
A banking engagement strategy is another way for investors to address leakage markets. Key
players in leakage markets, especially in the palm oil industry, tend to be debt-financed by banks.50
A 2019 study by Boston Common Asset Management found wide-ranging disparities in how 58 banks
were managing climate risk associated with deforestation and biodiversity loss. Only 16 percent of
the banks required clients to adopt no-deforestation policies and even fewer had expanded policies
covering all soft commodities beyond palm oil. The data showed a systematic reluctance by banks
to demand higher client standards.51
GHG inventory analysis
In line with recommendations of the Task Force on Climate-related Financial Disclosures, company disclo-
sure of GHG emissions has become a core baseline expectation of global investors. In theory, a company’s
GHG inventory should be a key source of information to understand its exposure to potential deforestation
risk. A full GHG inventory, including emissions from deforestation, would allow a company and its investors
to determine if deforestation-related emissions are a material risk. However, most company GHG inventories
that are reported to CDP and other organizations are inadequate for this purpose. Corporate accounting
and disclosure of GHG emissions from deforestation is currently extremely poor. As a result, analysis
of a company’s sourcing patterns, as described in the previous section, is currently a more accurate way to
gauge exposure. Nonetheless, it will be useful for investors to understand where to look for GHG emissions
from deforestation and conversion in a company’s GHG inventory, and how reporting expectations on these
emissions are changing.
Most companies use the framework of “scopes,” developed by the GHG Protocol,52 to track and report GHG
emissions (Figure 8). Scope 1 emissions are from sources owned or controlled by the company. Scope 2 are
emissions released in generating electricity, heating or cooling used by a company. Scope 3 are other indirect
emissions from a company’s supply chain, including emissions from agricultural and forest products. For
most companies—packers and processors, traders and distributors, food manufacturers and retailers—GHG
emissions from agricultural production, deforestation and conversion fall under scope 3. These emissions
would fall under scope 1 for companies owning or controlling agricultural and forestry operations. This is
especially relevant for the palm oil industry, which tends to be vertically integrated; traders and distributors
of palm oil generally own plantations as well as sourcing product from independent producers.
19Figure 8 How deforestation-related GHG emissions show up in corporate GHG inventories and disclosures. For most companies, GHG emissions
from agricultural production, deforestation and conversion would fall under purchased goods and services, with the exception of companies who
own their own agricultural production operations.
Existing standards for corporate GHG emissions disclosures do not provide detailed guidance for companies
to report emissions from deforestation and conversion. As a result, most companies do not include these
emissions in GHG inventory reporting. And even when companies include these emissions, the calculations
often rely on global or regional averages because they don’t have sufficient visibility into their supply chains
to estimate deforestation-related emissions embedded in their own sourcing. Part 5 further describes the
importance of supply chain traceability and how to engage companies on this topic.
Standardized methods to appropriately account for land-based emissions will be included in forthcoming
guidance from the GHG Protocol.53 The World Wildlife Fund (WWF) is also developing sector-specific guidance
for emissions from forests, land and agriculture as part of requirements for setting science-based
GHG targets validated by the Science-Based Targets Initiative (SBTi).54 (The SBTi is a partnership between
CDP, the UN Global Compact and other groups.) Together, these actions will help shift industry standard
towards inclusion of land-based emissions, including deforestation emissions, in science-based targets.
They will also ensure more consistent accounting and disclosure of deforestation-related GHG emissions.
Assessment of broader climate risk mitigation by companies
Deforestation-driven climate risk is a function of a company’s exposure to deforestation based on its com-
modity sourcing patterns and the way in which the company responds to manage exposure and mitigate
risk. To address the systemic risk of climate change, all companies should have a broader climate strategy
with ambitious greenhouse gas reduction targets for all of its emissions. For companies with direct exposure
to deforestation, a robust no-deforestation commitment must be a part of the overall strategy a company
employs to achieve its climate commitments. Investors can use the framework outlined in Part 5 to assess
whether a company’s climate and no-deforestation commitments and policies are sufficiently rigorous to
reduce overall climate and deforestation risks.
20PART 5
Evaluating Corporate Actions and Engaging
with Companies
Effective corporate response to climate change and deforestation should have three components:
ambitious, time-bound GHG reduction targets that include deforestation emissions; a no-deforestation policy
with strong supply chain implementation; and transparent disclosure of progress – or lack of progress –
on both no-deforestation and climate targets. A company’s policies and implementation plan for eliminating
deforestation from its supply chains must be a part of its overall climate strategy (Figure 9).
Figure 9 For companies with deforestation exposure, eliminating deforestation from supply chains should be a key component of corporate
actions to address climate risk. Companies should: (1) include emissions from deforestation in their climate targets; (2) set and implement
no-deforestation policies as part of their climate action plans; and (3) disclose on progress in eliminating deforestation and related emissions
along with overall progress on climate targets.
The following pages outline specific policies and actions companies should use to reduce overall GHG
emissions and eliminate deforestation in their supply chains. Investors can use this information to guide
their engagements with companies, whether in specific dialogues, letters, meetings or shareholder
resolutions focused on deforestation or climate change. The engagement framework and key performance
indicators were developed in collaboration with Principles for Responsible Investment (PRI) and the investors
participating in the Investor Initiative for Sustainable Forests.
21Company climate targets
Setting and implementing ambitious GHG reduction targets are key to addressing climate risk.
Key elements
Eliminate
Targets are science-based and in line with what is needed to limit warming
GHG emissions from to 1.5 degrees Celsius.
commodity driven Targets cover a company’s full scope of emissions.
deforestation Targets include emissions from land use change.
Science-based targets. A science-based target is a GHG emissions reduction target that aligns with
what climate science says is necessary to limit global warming to 1.5 or well-below 2 degrees Celsius above
pre-industrial levels. A company can ensure that its climate target aligns with global standards by seeking
validation from the Science Based Targets initiative (SBTi). Investors can also engage companies to set
interim reduction goals ahead of target deadlines to ensure they are on track.
Full scope of emissions. To be approved by SBTi, companies must set a target for scope 3 emissions if
the company’s scope 3 emissions represent more than 40 percent of its total emissions when calculated
using standards set by the GHG Protocol. For food and beverage companies, scope 3 sources are typically
closer to 90 percent of a company’s total emissions, primarily from sourcing agricultural products.55
Emissions from land use change. The GHG emission inventory should include any emissions from agricul-
ture and land use change associated with purchased raw materials, ingredients and services. This includes
GHG emissions from deforestation and other land conversions, fertilizer use, emissions from livestock and
rice production and other agricultural sources.
COMPANY CLIMATE TARGETS: KEY ENGAGEMENT QUESTIONS
• Does the company calculate scope 3 emissions including emissions from deforestation and
land use change?
• Are the company’s GHG reduction targets science-based and in line with a 1.5 degree scenario?
• Does the company have GHG reduction targets for scope 1, 2, and 3 emissions, including emissions
from deforestation land use changes?
BOARD LEVEL OVERSIGHT
As part of their role as stewards of long-term company performance, corporate boards have
a critical role to play in overseeing corporate sustainability strategies. The oversight should
be closely aligned with company business models and operations. To fulfill this role, company
boards should: include board members with sustainability expertise; establish committees with
formal mandates focused on climate risks and opportunities; and create incentive structures
linking executive compensation to performance on key sustainability commitments, including
climate change and deforestation. For more details on this topic, please see the report,
Climate Running the Risk: How Corporate Boards Can Oversee Environmental, Social and
Governance (ESG) Issues.
22Meeting climate targets requires addressing supply chain deforestation
Companies that source forest-risk commodities cannot meet full scope, science-based emissions
reductions targets, as recommended in the previous section, without implementing comprehensive
no-deforestation policies. Deforestation-related emissions contribute substantially to GHG emissions of
companies that produce or source forest-risk commodities. Beef processors or palm oil traders may have
deforestation-related emissions 8-10 times greater than their emissions from operations (scope 1) and
electricity use (scope 2).56 Emissions from deforestation are also significant for companies downstream in
the supply chain. Mars Inc., a U.S.-based food manufacturer, for example, estimated that 29 percent of the
company’s total emissions are from deforestation and conversion associated with sourcing of raw materials
from tropical countries.57
Sourcing decisions make a significant difference in a company’s deforestation-related GHG footprint.
Within key countries of concern, deforestation is often most prevalent within certain municipalities.
For example, 40 percent of deforestation-related GHG emissions from Brazilian soy production come
from just 1 percent of soy-producing municipalities (Figure 10).58 Being able to trace a commodity beyond the
country of origin allows companies to understand the actual GHG emissions associated with that commodity
(see “Supply Chain Implementation” below). For example, the estimated total GHG footprint of a kilogram
of soybeans varies dramatically depending on the deforestation in areas where it was grown. Eliminating
deforestation could reduce the GHG footprint of soybeans by 39 percent on average (Figure 10). With this
understanding, companies should engage suppliers in these crucial municipalities and work to enforce
no-deforestation policies. By targeting efforts to address deforestation in this way, companies could
dramatically reduce the deforestation-related GHG emissions from their sourcing.
Figure 10 GHG emissions per ton of soy traded from Brazil. The map on the left shows GHG emissions due to deforestation per ton of soy for
each soy-producing municipality in Brazil. The chart on the right shows the difference in the total GHG footprint (GHG emissions per ton of soy)
of soy produced with and without deforestation. The “without deforestation emissions” are due to transport, processing, and crop management
practices such as fertilizer application. Data from Escobar et al. 2020.59
23You can also read