Characterization of the radiative impact of aerosols on CO2 and energy fluxes in the Amazon deforestation arch using artificial neural networks ...
←
→
Page content transcription
If your browser does not render page correctly, please read the page content below
Atmos. Chem. Phys., 20, 3439–3458, 2020
https://doi.org/10.5194/acp-20-3439-2020
© Author(s) 2020. This work is distributed under
the Creative Commons Attribution 4.0 License.

Characterization of the radiative impact of aerosols on CO2 and
energy fluxes in the Amazon deforestation arch using
artificial neural networks
Renato Kerches Braghiere1,2,3,a , Marcia Akemi Yamasoe3 , Nilton Manuel Évora do Rosário4 ,
Humberto Ribeiro da Rocha3 , José de Souza Nogueira5 , and Alessandro Carioca de Araújo6,7
1 Jet Propulsion Laboratory, California Institute of Technology, 4800 Oak Grove Drive, Pasadena, CA 91109, USA
2 Joint Institute for Regional Earth System Science and Engineering, University of California at Los Angeles,
Los Angeles, CA 90095, USA
3 Departamento de Ciências Atmosféricas, Instituto de Astronomia, Geofísica e Ciências Atmosféricas,

Universidade de São Paulo, São Paulo, Brazil
4 Laboratório de Clima e Poluição do Ar (LabClip), Instituto de Ciências Ambientais, Químicas e Farmacêuticas,

Universidade Federal de São Paulo, Diadema, Brazil
5 Instituto de Física, Universidade Federal de Mato Grosso, Mato Grosso, Brazil
6 Embrapa Amazônia Oriental, Travessa Dr. Enéas Pinheiro, s/n, Marco, Caixa Postal 48, Belém, Pará 66095-100, Brazil
7 Instituto Nacional de Pesquisas da Amazônia (INPA), Large Scale Biosphere-Atmosphere Experiment in Amazonia (LBA),

Avenida André Araújo, 2936, Manaus, Amazonas, 69060-001, Brazil
a current address: NASA Jet Propulsion Laboratory, M/S 233-305F, 4800 Oak Grove Drive, Pasadena, CA 91109, USA

Correspondence: Renato Kerches Braghiere (renato.braghiere@gmail.com)

Received: 18 February 2019 – Discussion started: 7 June 2019
Revised: 18 January 2020 – Accepted: 30 January 2020 – Published: 24 March 2020

Abstract. In vegetation canopies with complex architec-           chitecture. A decrease of approximately 12 % was observed
tures, diffuse solar radiation can enhance carbon assimila-       for a site with shorter vegetation. Energy fluxes were nega-
tion through photosynthesis because isotropic light is able to    tively impacted by aerosols over all study sites.
reach deeper layers of the canopy. Although this effect has
been studied in the past decade, the mechanisms and impacts
of this enhancement over South America remain poorly un-
derstood. Over the Amazon deforestation arch large amounts        Copyright statement. This research was carried out in part at the
of aerosols are released into the atmosphere due to biomass       Jet Propulsion Laboratory, California Institute of Technology, un-
                                                                  der a contract with the National Aeronautics and Space Administra-
burning, which provides an ideal scenario for further investi-
                                                                  tion. California Institute of Technology. Government sponsorship
gation of this phenomenon in the presence of canopies with        acknowledged. © 2020.
complex architecture. In this paper, the relation of aerosol
optical depth and surface fluxes of mass and energy are eval-
uated over three study sites with artificial neural networks      1   Introduction
and radiative transfer modeling. Results indicate a significant
effect of the aerosol on the flux of carbon dioxide between       The composition of the atmosphere is determined by the
the vegetation and the atmosphere, as well as on energy ex-       emission and transport of gases and aerosols at different
change, including that surface fluxes are sensitive to second-    scales, chemical and microphysical processes, wet and dry
order radiative impacts of aerosols on temperature, humidity,     deposition, or by the distribution of the land surface and
and friction velocity. CO2 exchanges increased in the pres-       oceanic ecosystems around the globe. These processes are
ence of aerosol in up to 55 % in sites with complex canopy ar-    represented by the biogeochemical cycle, and they involve

Published by Copernicus Publications on behalf of the European Geosciences Union.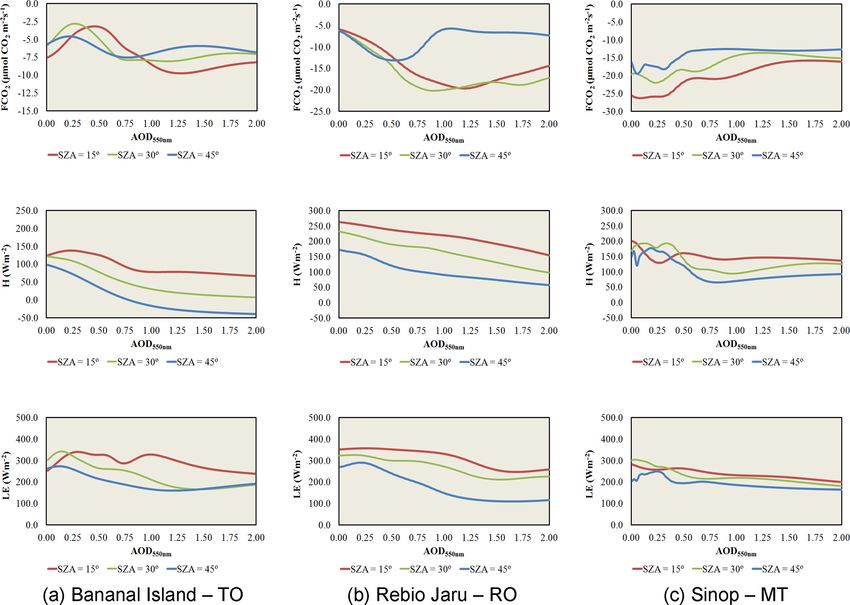
3440                           R. K. Braghiere et al.: Characterization of the radiative impacts of aerosols in the Amazon

interactions between different components of the Earth sys-        egories: particulate organic material and black carbon (Chin
tem. These interactions are generally nonlinear and might          et al., 2002).
produce negative or positive radiative forcing signals in the         The direct radiative effect of aerosols can absorb and
climate system (Forster et al., 2007).                             scatter radiation in the shortwave band and longwave band,
   The state of the climate system is governed by the en-          which directly impacts the radiative balance of the climate
ergy balance, which is defined as the amount of energy go-         system (Forster et al., 2007). The net impact of the direct ra-
ing into the climate system minus the amount of energy dis-        diative effect of aerosols decreases the available solar energy
sipated by it mostly through the emission of longwave ra-          at the surface. In the last decades, there has been a 2.7 % re-
diation. In the long term, the amount of solar radiation ab-       duction observed in the incident direct solar irradiance at the
sorbed by the Earth’s atmosphere and surface is balanced           surface, a phenomenon known as “global dimming” (Stan-
out by the same amount of longwave radiation emitted by            hill and Cohen, 2001). Although the mechanisms associated
them. About half of the solar radiation is absorbed by the         with the direct radiative effect of aerosols are well described
Earth’s surface. This energy is transferred to the atmosphere      in the literature, uncertainties are still significant, especially
by heating the air in contact with the surface, through evapo-     with respect to the spatial and temporal distribution of the
transpiration and longwave radiation emission, which can be        aerosols in the atmosphere (Forster et al., 2007; Fletcher et
absorbed by clouds and greenhouse gases. The atmosphere            al., 2018). In addition, the radiative effects of aerosols can
in turn emits longwave energy back to the surface as well as       impact different compartments of the climate system, such
to space (Kiehl and Trenberth, 1997; Trenberth, 2009).             as the biosphere, for example.
   The Earth’s climate system has undergone a number of               The biosphere interacts with the climate system through
changing processes considered “natural” throughout the his-        biogeophysical and biogeochemical processes, which can
tory of the planet. The average temperature of the planet          cause both positive and negative responses on the radiative
has always been directly linked to the amount of CO2 in            balance, and some of these responses, especially at a local
the atmosphere. The uncertainties on the energy balance            scale, can be quite significant (Wang et al., 2014; He et al.,
associated with greenhouse gases have been reduced over            2017; Persad and Caldeira, 2018).
the past years; however, uncertainties associated with atmo-          The overall reduction in incident radiation at the surface
spheric aerosols remain substantial, despite the various ad-       has negatively impacted gross primary productivity (GPP)
vances achieved since the first studies relating aerosols and      in light-limited ecosystems (Black et al., 2006; Unger et al.,
the climate system (Boucher et al., 2013). Aerosols are tech-      2017; Ezhova et al., 2018). In addition, a decrease in total
nically defined as solid or liquid particles suspended in the      solar radiation is followed by an increase in its diffuse com-
air (Seinfeld and Pandis, 2006), which can be emitted from         ponent, which in turn can increase plant productivity due
natural or anthropogenic sources. They can be found in dif-        to a higher production efficiency per unit of incident radi-
ferent shapes and chemical composition, which may vary ac-         ation in the canopy, an effect known as “the diffuse fertil-
cording to their source of emission and/or processes they          ization effect” (Kanniah et al., 2012). In ecosystems with
are subjected to once in the atmosphere. They can also be          densely vegetated canopies, the direct shortwave radiation
classified into primary, i.e., when they are directly emitted,     reaches the upper part of the vegetation canopy, while most
or secondary, i.e., when they are formed in the atmosphere         leaves at medium canopy height or at bottom canopy layers
through a physicochemical process known as gas–particle            remain shaded. Carbon assimilation increases under atmo-
conversion.                                                        spheric conditions with a moderate aerosol load and high
   The typical diameter of aerosols ranges from a few              fraction of diffuse radiation (Niyogi et al., 2004) and de-
nanometers to tens of micrometers (Seinfeld and Pandis,            creases as the concentration of aerosols increases to a level
2006), and it can impact their time spent in the atmosphere        where the overall radiation is substantially reduced (Yamasoe
and their ability to interact with radiation.                      et al., 2006).
   Aerosols can travel long distances which increase the              The spatial distribution and nature of the shortwave radi-
time they are exposed to radiation and the probability             ation is critical for the productivity of terrestrial ecosystems
of interaction with clouds. In addition, the accumulation          and further studies on the impacts of light limitation on veg-
mode (0.1 µm < particle size < 2.5 µm) interacts most effec-       etation productivity are needed. In light-limited ecosystems
tively with solar radiation, although the nuclei-mode aerosols     such as rainforests and temperate forests, the radiative impact
(0.1 µm > particle size) are mostly found over the continents      of aerosols on vegetation productivity must be evaluated in
and coastal areas, directly related to human activities. Nuclei-   combination with other environmental factors, such as tem-
mode aerosols account for about 10 % of the aerosols of            perature and water (O’Sullivan et al., 2016). With fieldwork
the globe (Textor et al., 2006). Aerosols emitted by natu-         and numerical studies in the Australian savannah, Whitley et
ral sources are the dominant type in the climate system. In        al. (2011) suggested that vegetation productivity was more
climate models, aerosols are generally divided into five gen-      influenced by light limitation than by water limitation. Ac-
eral categories: dust, marine spray, sulfur aerosols or sulfate,   tually, the response of photosynthetic capacity to an increase
and carbon compounds, which are divided into two subcat-           in the concentration of atmospheric aerosol has been exten-

Atmos. Chem. Phys., 20, 3439–3458, 2020                                              www.atmos-chem-phys.net/20/3439/2020/
R. K. Braghiere et al.: Characterization of the radiative impacts of aerosols in the Amazon                                   3441

sively studied over almost the past 2 decades (Roderick et          study of three specific experimental sites. The use of ANNs
al., 2001; Gu et al., 2002; Niyogi et al., 2004; Yamasoe et al.,    allows us to build up a statistical modeling framework relat-
2006; Oliveira et al., 2007; Mercado et al., 2009; Doughty          ing meteorological (i.e., temperature, humidity, friction ve-
et al., 2010; Kanniah et al., 2010, 2012, 2013; Zhang et al.,       locity) and radiative variables (i.e., incident photosyntheti-
2010; Li et al., 2014; Rap et al., 2015; Tang and Dubayah,          cally active radiation (PAR) at the top of the canopy, the per-
2017) through observations (Steiner et al., 2013) and model-        centage of diffuse PAR) to mass and energy fluxes in the
ing (Moreira et al., 2017) frameworks.                              forest, in a first approach to address the radiative impacts
   In this paper, however, we investigate the impact of at-         on mass and energy fluxes. The follow-up analysis is based
mospheric aerosols on the carbon balance over three sites in        on the derivation of a second group of ANNs relating radia-
South America in the deforestation arch of the Amazon for-          tive variables to meteorological ones in order to identify the
est, making use of a novel approach and combining two dif-          second-order effect of aerosols on surface fluxes. Finally, we
ferent types of modeling techniques. First, we make use of          make use of the radiative transfer (RT) theory with a process-
artificial neural networks (ANNs), a machine learning algo-         based RT model to create a hypothetical scenario without
rithm that can approximate any nonlinear deterministic func-        aerosols and estimate the potential fluxes of mass and en-
tion (Gentine et al., 2018), to build a new modeling frame-         ergy, not only considering the first-order impact of aerosols,
work from scratch relating a number of state variables (ra-         but also the second-order impact by making use of two dis-
diation, temperature, humidity, as well as the aerosol opti-        tinct groups of ANNs.
cal depth) to energy and mass fluxes for three study sites             With this approach, this study evaluates (i) the impacts of
representing a range of structurally different ecosystems in        aerosol optical depth at 550 nm on fluxes of heat, water, and
the Amazon; and second, we use a radiative transfer scheme          CO2 ; (ii) the characteristics of aerosol present in each of the
driven with a unique aerosol optical model developed in             experimental sites; and (iii) the isolated impact of aerosols
do Rosário et al. (2009) and described in do Rosário et             on mass and energy fluxes through statistical modeling with
al. (2011). A recent study has performed a modeling eval-           ANNs, in comparison to other environmental factors, such as
uation of the radiative impact of aerosols over a temperate         temperature, moisture, and turbulence.
forest with complex structure in the USA (Lee et al., 2018),
but the studies in the Amazon remain mostly observational.
   Machine learning has significantly advanced in the last          2     Materials and methods
decades, being applied to a number of different research ar-
                                                                    2.1     Sites
eas and more recently used in Earth system studies as a pow-
erful tool to link physical process models with data-driven re-     The deforestation arch consists of 248 municipalities in
lationships (Schneider et al., 2017; Huntingford et al., 2019;      Brazil going from the state of Rondônia to the state of Maran-
Reichstein et al., 2019; Watson-Parris et al., 2019). There         hão, across the Brazilian savannah and Amazonian biomes
are a number of different machine learning techniques that          (Araújo Junior et al., 1998), and it is about 3000 km long and
have been applied to Earth system studies including ran-            up to 600 km wide. Between July and October 1987, the re-
dom forests (Rodriguez-Galiano et al., 2012; Yang et al.,           gion of the deforestation arch lost approximately 50 000 km
2016; McGovern et al., 2017), model tree ensembles (Jung et         of forests in the states of Pará, Mato Grosso, Rondônia, and
al., 2010; Yang et al., 2016), empirical orthogonal functions       Acre and released more than 500×106 t of carbon into the at-
(Yang et al., 2019), principal components analysis (Gosh and        mosphere, 44×106 t of which were in the form of CO2 (Song
Mujumdar, 2008), and ANNs (Krasnopolsky et al., 2005;               et al., 2015). The three flux sites evaluated in this paper are
Goyal et al., 2014; Gentine et al., 2018; Nguyen et al., 2018;      in the Brazilian deforestation arch (Fig. 1).
Buckland et al., 2019; Wu et al., 2019).
   We have chosen ANNs over other machine learning meth-            2.1.1    Bananal Island
ods because once trained, they are computationally efficient,
as most of the computational demand is required during the          Bananal Island is the largest river island on the planet, with
training phase. Perhaps this is one of the main reasons for         approximately 2×10⁶ ha and measuring almost 360 km in the
their large applicability in several different studies, an advan-   north–south direction and 80 km in the east–west. Bananal
tage over more resource-demanding machine learning tech-            Island is a floodplain region. The flux tower of Bananal Is-
niques. Although ANNs are highly data dependent, some-              land was installed in the northern part of the island, within
times leading to problems of over-fitting and generalizations,      the boundaries of Canton State Park, by the Laboratory of
ANNs are a good approach for problems with large datasets           Climate and Biosphere of the Institute of Astronomy, Geo-
because they allow any number of input variables.                   physics, and Atmospheric Sciences of the University of São
   The main goal of this paper is to investigate, step by step,     Paulo. The average height of the canopy is approximately
the effects of the atmospheric aerosol on the variability of        between 15 to 18 m. The instrumental platform was mounted
CO2 and sensible (H ) and latent (LE) heat fluxes in the            in a 40 m high structure located approximately 2 km east of
Amazon region over the deforestation arch, based on the             the Araguaia River, at the geographic coordinates 9◦ 49.270 S,

www.atmos-chem-phys.net/20/3439/2020/                                                Atmos. Chem. Phys., 20, 3439–3458, 2020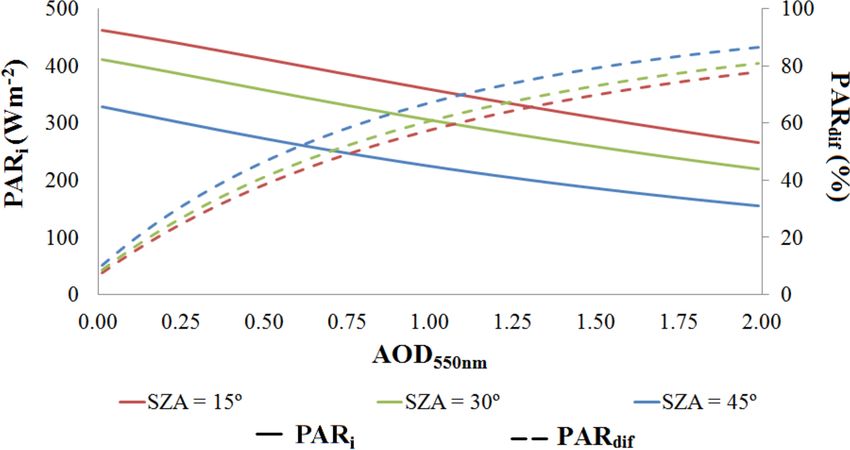
3442                            R. K. Braghiere et al.: Characterization of the radiative impacts of aerosols in the Amazon

Figure 1. Geographical representation of the northern region of Brazil. The darker green area represents remaining forest. The black dots
indicate the location of the study sites: Rebio Jaru, RO (west), Sinop, MT (center), and Bananal Island, TO (east). Boxes show the temporal
distribution of the aerosol optical depth at 550 nm over the three sites derived from MODIS from 2003 and 2008 and the monthly mean
values for the period, with the standard deviation represented by vertical bars.

50◦ 08.920 W, at 120 m a.s.l. The data monitoring started on            2.1.3    Sinop
the 27 October 2003 and the project was based on the facili-
ties of the Canguçú Research Centre of the Instituto Ecológ-            This study site is located in an area of logging with for-
ica – UFT, approximately 20 km south of the micrometeoro-               est management in Fazenda Maracaí. The farm is located
logical tower (Borma et al., 2009).                                     approximately 50 km to the northwest of the center of
                                                                        Sinop, Mato Grosso, Brazil, at coordinates 11◦ 24.700 S,
2.1.2   Rebio Jaru                                                      55◦ 19.390 W, at 423 m a.s.l. The Maracaí farm consists of a
                                                                        transitional tropical forest (between Brazilian savannah and
In the northeastern part of the state of Rondônia, Brazil, the
                                                                        open ombrophile forest) with a continuous canopy, com-
Jaru Biological Reserve has approximately 60 000 ha. The
                                                                        posed of trees 25 to 28 m in height (Vourlitis et al., 2008).
entire basin of the Tarumã river is in the reserve and covers
                                                                        The vegetation consists of perennial trees that are character-
about 75 % of the unit. The land has a large number of small
                                                                        istic of the transition forest in Mato Grosso. The diversity is
streams and springs keeping a moist vegetation throughout
                                                                        high, and there is no predominance of a single tree species.
the year. The vegetation is mainly characterized as an open
                                                                        There are approximately 80 species and 35 families of trees
tropical forest with some palm trees. There are also a few ar-
                                                                        with diameter at breast height around 10 cm. The climato-
eas with lianas and bamboo trees, as well as small spots of
                                                                        logical seasonality for the ecotone of the transition forest is
dense ombrophile forest, characteristic of the Amazon region
                                                                        similar to that of the tropical and closed forest. The sonic
(IBAMA, 2006). The average height of the canopy is approx-
                                                                        anemometer was installed at 42 m height. The site is part of
imately 35 m, but some trees can reach up to 45 m. The tower
                                                                        the LBA (Large Scale Biosphere-Atmosphere Experiment in
is located 1240 m from the river bank in a more preserved re-
                                                                        Amazonia) integrated project and has been carrying out mea-
gion (Gomes, 2011). Data from Rebio Jaru were collected
                                                                        surements of this nature since 1999.
from August to October 2007, at the geographic coordinates
10◦ 04.710 S, 61◦ 56.010 W, at 148 m a.s.l. Eddy covariance in-
struments were installed at 62 m in height (Bosveld and Bel-            2.2     Flux tower data
jaars, 2001).
                                                                        Surface fluxes of CO2 , sensible heat, and latent heat were ob-
                                                                        tained through the eddy covariance technique applied to data
                                                                        collected with sonic anemometers and infrared gas analyzers

Atmos. Chem. Phys., 20, 3439–3458, 2020                                                   www.atmos-chem-phys.net/20/3439/2020/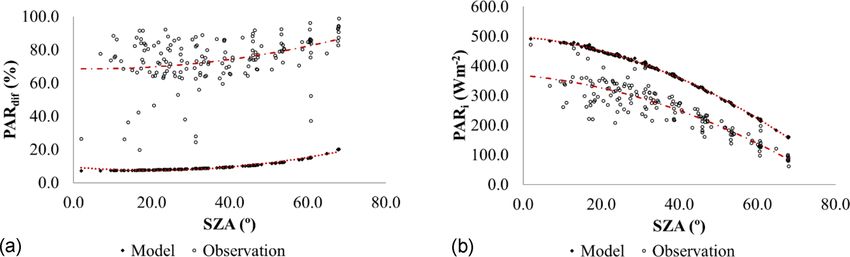
R. K. Braghiere et al.: Characterization of the radiative impacts of aerosols in the Amazon                                    3443

installed in flux towers located at Bananal Island, Sinop, and       and MYD04_L2, containing data from the Aqua platform.
the Jaru Biological Reserve (Rebio Jaru). Fluxes were ob-            The MODIS aerosol product is used to build the climatologi-
tained with a temporal resolution of 30 min. Measurements            cal variance of aerosols, sources and sinks of specific types of
of meteorological variables, such as temperature, relative hu-       aerosols (e.g., sulfate aerosols, biomass burning), the interac-
midity, and wind speed were collected. Except for the tower          tion of aerosols with clouds, and atmospheric corrections of
in Sinop, the other towers presented radiative measurements          surface reflectance obtained from remote sensing.
such as incident solar radiation and incident and reflected             Pre-assumptions about the general structure of aerosol size
PAR. For Sinop, these variables were calculated by a radia-          distribution are necessary for the inversion of the MODIS
tive transfer model, libRadtran, further described in Sect. 3.1.     data and the distribution is described as two log-normal
   Geographic coordinates, altitudes, flux tower heights, and        curves: a unique mode, to characterize the particles of ac-
the type of sensors used in each one of the three sites are          cumulation mode (aerosol radius < 0.5 µm) and a single
presented in Table 1. A Multifilter Rotating Shadowband Ra-          coarse mode to describe dust and salt particles (aerosol ra-
diometer data provided aerosol optical depth at 550 nm es-           dius > 1.0 µm). The aerosol parameters that are thus recov-
timates per minute, and 30 min averaged values were calcu-           ered are the relationship between the two modes (fine and
lated, available only for the Rebio Jaru site.                       coarse), spectral optical depth, and mean particle size. The
   The study period of this work was limited to the dry sea-         quality control of these products is based on the compari-
son for the following reasons: (a) the maximum numbers               son with terrestrial stations and climatology. We used instan-
of fire outbreaks occur in August, September, and October;           taneous and monthly fields of the aerosol optical depth at
(b) in terms of the temporal distribution of the aerosol op-         550 nm (AOD550nm), referring to collection 051 (Hubanks,
tical depth, there is a significant increase in the months of        2012), level 2. The pixels over the flux towers were consid-
August, September, and October; (c) the analysis of the in-          ered. Episodes contaminated by clouds were excluded from
trinsic properties of the aerosols becomes important because         the analysis.
it indicates the chemical composition and size of the parti-            The MODIS aerosol data were acquired at the moment of
cles. Only the months of August, September, and October              each satellite overpass (Terra and Aqua) over the site of in-
were considered in this analysis in order to keep consistency        terest, and a single point was used to represent the 30 min
of the type of aerosols being evaluated.                             interval. Uncertainties associated with each variable were es-
                                                                     timated from the standard deviations obtained for the 30 min
2.3   MODIS data                                                     intervals, except for the MODIS AOD550nm measurements,
                                                                     in which the uncertainty of the AOD550nm in an area of
The aerosol optical depth (AOD) at 550 nm used in this               10 × 10 km2 was estimated following Levy et al. (2009) as
study was obtained from the Moderate Resolution Imaging
Spectroradiometer (MODIS) for Bananal Island and Sinop.              στ = ±(0.05 + 0.15τ ).                                      (1)
In Rebio Jaru AOD values were obtained in situ with a
shadow band radiometer (Multifilter Rotating Shadowband              In Rebio Jaru, in situ AOD measurement was conducted in
Radiometer, MFRSR) (Table 1). MODIS is an instrument on              a relatively limited period of time, covering only part of the
board the Terra and Aqua satellites. Terra’s orbit around the        dry season of 2007, yet the high temporal resolution of the
globe is synchronized and runs from north to south across            aerosol optical depth data (every minute) enabled a more ro-
the Equator line in the morning (∼ 10:30 local time), while          bust analysis of the diurnal cycle. On the other hand, at Ba-
Aqua presents passages from south to north by the Equator            nanal Island and in Sinop, the time series of flux measure-
in the afternoon (∼ 13:30 local time). MODIS observes the            ment was longer (from 2003 to 2008 and from 2005 to 2008,
entire ocean surface of the Earth and almost the entire ter-         respectively). However, AOD data were limited to a maxi-
restrial surface in a period of 1 to 2 d and acquires data in        mum of two points a day from MODIS, but the analysis of
36 spectral bands. The aerosol product from MODIS is the             these experimental sites presented possibilities of characteri-
aerosol optical depth measured over the oceans and a portion         zation of the interannual cycles.
of the continents, globally. In addition, the aerosol size distri-
bution is derived over the oceans, and the aerosol type over
continents. Daily MODIS level-2 data are produced with a             3   Models
spatial resolution of 10×10 km2 over nadir. The level 2 prod-
uct was chosen due to its estimation of the aerosol retrieval        In this section, we discuss the two models used in this
uncertainty to assist with error analyses as well as a best esti-    study: a physical process-based atmospheric radiative trans-
mate of the aerosol optical depth data with quality assurance        fer model – libRadtran (Mayer and Kylling, 2005) – and
flags already applied. Although spatial resolution is coarser        a statistically based model – the artificial neural networks.
at level 2, lower product uncertainty improved our analysis.         First, we describe the radiative transfer model; second, we
   Two groups of MODIS aerosol data products were col-               present the machine learning technique (ANNs), and de-
lected: MOD04_L2, containing data from the Terra platform,           scribe the specific methodology used in our experiments. Fi-

www.atmos-chem-phys.net/20/3439/2020/                                                 Atmos. Chem. Phys., 20, 3439–3458, 2020
3444 R. K. Braghiere et al.: Characterization of the radiative impacts of aerosols in the Amazon
Table 1. Geographic coordinates, altitudes, flux tower height, and the sensors used in the three experimental sites.
Bananal Island Rebio Jaru Sinop
Coordinates 9◦ 49.30 S, 50◦ 08.90 W 10◦ 04.70 S, 61◦ 56.00 W 11◦ 24.70 S, 55◦ 19.40 W
Altitude 120 m 148 m 423 m
Flux tower height 40 m 62 m 40 m
Period Oct 2003–Dec 2008 Aug 2007–Oct 2007 Mar 2005–Aug 2008
Data storage system CR5000 & CR10X CR10X CR5000 & CR10X
(Campbell Sci.) (Campbell Sci.) (Campbell Sci.)
Fluxes
Sonic anemometer CSAT3; 10 Hz Solent 1012R2; 10.4 Hz SWS-211/3K; 10 Hz
Gas analyzer IRGA, Li-7500 IRGA, Li-7500 NOAA-ATDD
Meteorological variables
Temperature and humidity Psychrometer CSI HMP45C Thermohygrometer Vaisala (HMP45D) HMP-35 Vaisala
Precipitation Hydrological services Pluviometer EM ARG-100 2501, Sierra-Misco
Net radiation Net radiometer (Kipp&Zonen) Net radiometer (Kipp&Zonen) NR-LITE (Kipp&Zonen)
Radiation
Solar radiation Pyranometer (Kipp&Zonen) CM-21 (Kipp&Zonen) libRadtran1
PAR Radiometer (Kipp&Zonen) Skye SKE-510 libRadtran1
Aerosol
AOD550 nm MODIS MFRSR2 MODIS
1 Values obtained from the radiative transfer model. 2 Multifilter Rotating Shadowband Radiometer.
nally, we describe statistical metrics used to evaluate our re- use (Mayer et al., 2010). Four streams were used in the simu-
sults. lations performed in this paper. Previous studies have shown
that differences in incident irradiance at the surface with at
3.1 Radiative transfer model least four streams are minimal (Ma et al., 2011). The PAR
waveband ranges between 400 and 700 nm and total solar ra-
The radiative transfer model libRadtran1.6-beta (Mayer and diation between 280 and 4000 nm.
Kylling, 2005) was used to perform calculations with the in- The input data required to describe the intensive optical
cident solar radiation at the top of the atmosphere (TOA) properties of the aerosols were obtained from models cre-
specified for the Amazon region with a tropical atmosphere ated with the Mie theory from do Rosário (2011), derived
profile. Ozone concentrations were set to 300 DU based on from the Aerosol Robotic Network (AERONET) products
values obtained by do Rosário et al. (2009), who found an for three experimental sites: Alta Floresta, Abracos Hill, and
average value of integrated ozone content in the atmospheric Rio Branco. These models carry spectral information about
column of 257 DU. In this paper, surface albedos from the the linear extinction coefficient (Q) in km−1 , the single scat-
International Geosphere-Biosphere Programme (IGBP) clas- tering albedo (ω0 ), and the asymmetry factor for the phase
sification (Loveland and Belward, 1997) were used. function, calculated from the Henyey–Greenstein method
For the three sites, the surface type was set to a deciduous (Henyey and Greenstein, 1941). The spectral resolution of
broadleaf forest. The day of the year provides information the aerosol model in the PAR spectral region was 25 nm, and
about the Earth–Sun distance, which affects the amount of over the entire solar spectrum it varied from approximately
radiation incident at the TOA, and it was also used as input 10 nm at shorter wavelengths up to 700 nm at longer wave-
to the code. The correction for molecular absorption, param- lengths.
eterized from the LOWTRAN model (Pierluissi and Peng, Three optical models were developed for the biomass
1985) and adopted by the SBDART code (Ricchiazzi et al., burning aerosol emitted over Amazon, which are different
1998), was implemented. The resolution of the corrections in scattering and absorption properties: a more scattering, an
for molecular absorption was 0.5 nm at wavelengths below intermediate type, and a more absorbing aerosol type. Also,
350 and 1.0 nm above. The DISORT method (DIScrete OR- in this study, sensitivity analysis performed with data from
dinate Radiative Transfer Solvers) was used to solve the ra- the Biological Reserve of Jaru showed that the more scatter-
diative transfer equations because of its versatility and broad ing aerosol model is the one that best represented the biomass
Atmos. Chem. Phys., 20, 3439–3458, 2020 www.atmos-chem-phys.net/20/3439/2020/R. K. Braghiere et al.: Characterization of the radiative impacts of aerosols in the Amazon 3445
burning aerosols of that season, associated with higher values The MLP is a function f : R D → R L , where D is the size
of AOD550nm. Therefore, in this study, the aerosol model of the input vector x and L is the size of the output vector
used for all three study sites was the more scattering type. f (x), such that, in matrix notation,
The specific input parameters of the radiative transfer
equations are solar zenith angle and the aerosol optical depth f (x) = G(b(2) + W (2) (s(b(1) + W (1) x))), (2)
at 550 nm. The model provides the integrated value of the
with bias vectors b(1) , b(2) ; weight matrices W (1) , W (2) ,
downward direct irradiance, the downward diffuse irradi-
and activation functions G and s. W (1) is the weight ma-
ance, and the upward diffuse irradiance, at the altitude de-
trix connecting the input vector to the hidden layer. Choices
termined by the user. All calculations were determined at the
of s include tan h and the logistic sigmoid function with
surface. From these values, it is possible to obtain the de-
sigmoid(a) = 1/(1 + e−a ).
scending global irradiance (the sum of the contributions of
The RBF is a function with respect to the origin or a certain
the direct and diffuse irradiance incident at the surface) and
point c:
the diffuse fraction, i.e., the ratio between the diffuse and in-
cident global irradiance at the surface. f (x) = f (||x − c||). (3)
3.2 Artificial neural networks RBF neural networks are good for novelty detection because
each neuron is centered on a training example, and so inputs
ANNs have great potential because of their capacity to rep- far away from all neurons constitute novel patterns; but it is
resent the complexity of the phenomena that are analyzed not as good at extrapolation because it gives the same weight
through them. Traditionally, physical simulation systems to every attribute as they are considered equally in the dis-
have great difficulty in reproducing complex responses of tance computation.
natural events because unknown processes are often unre- For all ANNs used in this paper, 200 neural networks were
solved or represented through simplified approaches called generated for each one of the different output variables, from
“parameterization schemes”, which can limit forecast predic- all three study sites, and only the one with the smallest error
tive skill (Huntingford et al., 2019). ANNs can be considered between modeled and observed output was evaluated. From
a network of many relatively simple processors, called units the total dataset, 70 % of the data was randomly chosen and
or nodes, in which there is a small amount of local mem- used in the training process of the ANNs, 15 % in the vali-
ory. In ANNs, these basic local memory units are commonly dation process, and 15 % in the testing process. The set used
layered and communicate through channels or connections in the training process has the function of exemplifying rela-
and operate only on their own media, that is, with their local tions between inputs and outputs to the ANN. This data par-
data and their input parameters (Papale and Valentini, 2003). titioning was selected to allow the vast majority (> 2/3) of
They can be seen as robust parallel processors with a natu- the data to be used for training, and the remaining data (less
ral ability to store knowledge gained from experimentation than one-third) were equally partitioned between validation
and make this learning available for future use. This means and testing because both processes are thought to have the
that, with this method, it is possible to create hypothetical same importance in the ANN construction.
scenarios to evaluate the behavior of the output variables, in We have used the two most recommended back-
relation to possible modifications in the input variables. propagation algorithms for optimization of ANNs (Rojek,
ANNs are trained from examples contained in the total 2017) – the Broyden–Fletcher–Goldfarb–Shanno (BFGS)
set of input data. The “weights” are randomly provided at and radial basis function training algorithm (RBFT) – and
the beginning of the process and modified according to the the sum of squares (SOSs) to choose between MPL and RBF
rule used in the backpropagation method. In this paper, two by selecting the one which presented the smallest deviation
methods of resolution of ANNs were used. (i) The multilayer to the training data.
perceptron (MLP) is a direct and unidirectional power sup- The variables used to train the ANNs were incident photo-
ply model of artificial neural networks, which maps the in- synthetically active radiation at the top of the canopy (PARi )
put datasets to an appropriate set of output data. The MLP in watts per square meter, the partitioning of photosyntheti-
uses the backpropagation technique to train the networks. cally active radiation in its diffuse form (PARdif ) in percent-
The most commonly used functions in this method are both age, derived from the method of Reindl et al. (1990), the so-
sigmoid (Bayram et al., 2016). (ii) The radial basis function lar zenith angle (SZA) in degrees, the average air temper-
(RBF) uses functions of radial basis as a function of activa- ature in the canopy (T ) in degrees Celsius, the vapor pres-
tion of the nodes of the neural networks. The RBF method sure deficit (VPD) in kilopascal, the friction velocity (u∗ ) in
typically has three layers: the input, the intermediate, with meters per second, and the aerosol optical depth at 550 nm
a nonlinear activation function, and the output, with a linear (AOD550nm). Therefore, seven variables were used as in-
function. The input parameters are modeled as a vector com- puts of the ANN, and the flux of carbon dioxide (FCO2 ), in
posed of real numbers, and the outputs are scalar functions micromol of CO2 per square meter per second, was selected
with vector input values (Bayram et al., 2016). as output.
www.atmos-chem-phys.net/20/3439/2020/ Atmos. Chem. Phys., 20, 3439–3458, 20203446 R. K. Braghiere et al.: Characterization of the radiative impacts of aerosols in the Amazon
The best carbon flux ANN for all sites presented similari- face and the partition between direct and diffuse radiation.
ties such as all three being generated from the RBF training This, in turn, impacted surface temperature, and water vapor,
model, using a Gaussian function for the activation of the among other changes able to affect photosynthesis.
hidden units, and the identity function for the activation of Flux data were combined with meteorological and satel-
the output. However, the ANNs presented a different number lite data. It is important to emphasize that the flux data have a
of hidden units. The network generated for Bananal Island sample interval of 30 min, while the satellite data are a “snap-
presented 30 hidden units, the one generated for Sinop used shot” of the atmosphere when the passage occurs in a very
21, and that for Jaru 19. Basically, the larger the number of short time interval, which registers a value referred to in a
hidden units in a neural network, the more robust the model single minute but over a 10 × 10 km2 area.
is; i.e., the neural network has a greater capacity to model From the integration of the database it was possible to
more complex relationships. At the end, the number of hid- make an analysis using ANNs. Some precautions were taken
den units provides an indication that the database of the three in order to avoid a misleading analysis of the ANNs. For ex-
analyzed sites presented different complexities in the rela- ample, values of u∗ smaller or equal to 0.2 m s−1 were ex-
tionship between the variables introduced at the moment of cluded from the training, testing, and validation processes to
the construction of the networks. However, the functions that avoid uncertain CO2 flux data collected in episodes with less
best managed to describe these relations were the same and turbulence and therefore a less mixed atmosphere. All data
the difference between them is the error magnitude between points for all variables above or below three standard devi-
output data used for training and the model output. ations were excluded from the input datasets of the ANNs
The performance of the ANN results was evaluated using because they were considered to be outliers.
the coefficient of determination (r 2 ), which is the Pearson Seven variables were used as inputs of the ANNs: pho-
coefficient (r) squared, root mean square error (RMSE), and tosynthetically active radiation incident on surface (PARi),
mean absolute error (MAE), defined as in watts per square meter; the partition of photosynthetically
P
2
active radiation in diffuse form (PARdif ), in percent, derived
p (y − mean(y))(t − mean(t)) from the method of Reindl (1990); the solar zenith angle
r 2 = qP , (4)
(y − mean(y)) 2 (t − mean(t))2 (SZA), in degrees; the mean air temperature in the canopy
p
(T ) in degrees Celsius; the vapor pressure deficit (VPD) in
where p is the total number of data points used for validation kilopascal; the friction velocity (u∗ ), in meters per second;
only, excluding training and testing, y is the output values of and the aerosol optical depth at 550 nm (AOD550nm). The
the generated ANNs, and t is the values derived from the flux flux of carbon dioxide (FCO2 ) (in µmol CO2 m−2 s−1 ) was
tower data (FCO2 , H , and LE) or meteorological variables selected as output.
(T , VPD, and u∗ ). Figure 2 shows the FCO2 dataset used for validation, ob-
RMSE is used to evaluate differences between the values tained through the eddy covariance method on the x axis
predicted by a mathematical or physical model (y) and the (eddy) and the ones calculated by the generated ANN, on
observed values (t). RMSE is a good measure of the accu- the y axis, with the respective determination coefficient (r 2 ),
racy of a model, but only to compare calculations and obser- RMSE, and MAE, for all three sites.
vations of the same variable, since it is scale dependent. It is The Rebio Jaru site presented the highest r 2 (0.67) of the
obtained by the following equation: three evaluated sites, which represents a high correlation be-
sP tween the measured and modeled CO2 flux data. This site
2
p (y − t) presented continuous AOD550nm data coverage throughout
RMSE = . (5)
p the day. At the other two sites, a single day had a maximum
of two AOD550nm data points associated with the passages
Finally, the use of the MAE does not take into account
of the Terra and Aqua satellites. This result indicates that a
whether an error was overestimated or underestimated once
continuous daytime coverage of AOD generated a more ro-
it is characterized as the average of the errors committed by
bust ANN influencing FCO2 with more predictability.
a model and can be obtained from the following equation:
Figure 3 shows box and whisker plots for the diurnal
1X cycle of FCO2 (µmol CO2 m−2 s−1 ), H (W m−2 ), and LE
MAE = |y − t| . (6)
p p (W m−2 ) for flux tower data obtained through the eddy co-
variance (EC) method and modeled with ANNs for 6 d (23,
4 Results 24, 25 and 29 August and 1 and 10 September) over the
dry season of 2007 in Rebio Jaru. It is possible to see that
4.1 Evaluation of ANNs for CO2 , sensible heat, and on all evaluated days, the ANN results represent the mea-
latent heat fluxes sured data well. Although for the three fluxes (FCO2 , H , and
LE), the ANNs are not able to capture the extreme values of
In the absence of clouds, aerosols were responsible for the distribution (the 10th and 90th percentiles), the median
changing the amount of solar radiation available at the sur- and both quartiles are well represented. During the evaluated
Atmos. Chem. Phys., 20, 3439–3458, 2020 www.atmos-chem-phys.net/20/3439/2020/R. K. Braghiere et al.: Characterization of the radiative impacts of aerosols in the Amazon 3447 Figure 2. FCO2 (µmol CO2 m−2 s−1 ), H (W m−2 ), and LE (W m−2 ) calculated from flux tower data through eddy covariance (x axis) versus modeled by ANNs (y axis), with r 2 , RMSE, and MAE. The 1 : 1 straight line (thick) and the linear fit (thin) are also represented for the three study sites. Figure 3. Box and whisker plots with extreme data points added for the diurnal cycle of FCO2 (µmol CO2 m−2 s−1 ), H (W m−2 ), and LE (W m−2 ) calculated from flux tower data through eddy covariance (EC) (gray) and modeled by ANNs (red) for 6 d (23, 24, 25 and 29 August and 1 and 10 September) over the dry season of 2007 in Rebio Jaru. The height of the box portion is given by the interquartile range of the dataset and extends from the 25th to 75th percentile. The horizontal bar within the box denotes the median value. The ends of the whiskers are drawn to the10th and 90th percentile values. The extreme values are points at the maximum and minimum. period (August, September, and October 2007), the mean series, from October 2003 to December 2008, with 320 input value of FCO2 was −12.2 µmol CO2 m−2 s−1 , while the av- points, which was important to establish a more robust map- erage FCO2 generated by the ANN for the same period was ping of the intra-seasonal variability. Throughout the evalu- −12.4 µmol CO2 m−2 s−1 , a relative difference of 1.9 %. ated period, the mean observed FCO2 for Bananal Island was The Bananal Island site presented the lowest values of −7.0 µmol CO2 m−2 s−1 , while the average FCO2 generated RMSE (3.20) and MAE (2.43). because of its long temporal www.atmos-chem-phys.net/20/3439/2020/ Atmos. Chem. Phys., 20, 3439–3458, 2020
3448                           R. K. Braghiere et al.: Characterization of the radiative impacts of aerosols in the Amazon

by the ANN was −7.1 µmol CO2 m−2 s−1 , a relative differ-
ence of 1.3 %.
   The Sinop site presented the largest discrepancies be-
tween the model and observed FCO2 with an r 2 of 0.37,
RMSE of 5.69 µmol CO2 m−2 s−1 , and MAE of 4.78 µmol
CO2 m−2 s−1 . Because its database is of intermediate size
compared to the other sites (237 points) and no PAR mea-
surements were performed at Sinop, values were generated
with the radiative transfer model libRadtran. The errors asso-
ciated with the outputs of the radiative transfer model were
included in the neural network training process. The relative
difference between the mean observed and simulated FCO2
was 1.2 %.                                                         Figure 4. PARi (Wm−2 ) (continuous lines) and PARdif ( %)
                                                                   (dashed lines) versus AOD550nm, for three different SZAs (15, 30,
   In order to evaluate the radiative effects of aerosol optical
                                                                   and 45◦ ) calculated by the radiative transfer model, libRadtran, for
depth on turbulent energy fluxes, the same type of analysis        Bananal Island for a characteristic day of the dry season.
as performed for carbon dioxide flux was done for sensible
heat flux (H ) and latent heat flux (LE). The evaluated period
was also the same: August, September, and October, the dry         that a given ANN has low predictability. The evaluation of
and burning season in the region. For all three experimental       the relative deviation is a way of measuring the accuracy of
sites the ANNs were made from the same variables used in           an ANN. Although it is possible to note in Fig. 2b that the
the networks related to FCO2 .                                     ANN of H could better approximate the measured values,
   All data points above or below three standard deviations        the relative error associated with ANN of LE was around
were excluded from the input sets because they were consid-        4.6 % lower.
ered to be outliers and because of the choice of ANNs.                Bananal Island presented intermediate r 2 values (0.42 for
   As for FCO2 , Rebio Jaru presented the highest r 2 (0.87)       H and 0.35 for LE), which indicates an average correlation
for sensible heat flux results. However, the same behavior         between the observed and the modeled data. For relative de-
was not observed when evaluating latent heat flux, which           viations, the values were lower than 3 % for H data and lower
presented a relatively lower r 2 (0.58) in comparison. In gen-     than 1 % for LE.
eral, the overall results of LE compared to H presented rela-         For Sinop, the analyses of H presented an r 2 of 0.53, con-
tively smaller r 2 values. The diurnal cycle of H is more well-    sidered from medium to high performance of the ANN, and
behaved in relation to LE as it depends on the diurnal cycle       a relative deviation of 0.5 %. For LE, the r 2 was 0.27 and the
of temperature. Latent heat flux, on the other hand, is greatly    relative error was 1.2 %.
influenced by the advection of moisture coming from other
sources not exclusively related to stomatal opening by the lo-     4.2   Modeling CO2 fluxes with ANNs with constant
cal vegetation. The presence of springs nearby could explain             temperature and moisture
peaks in local maxima of latent heat flux. This can be seen
in Fig. S3 in the Supplement, which shows the diurnal cycle        From the generated ANNs, tests were performed to deter-
(for some days of the experiment) of measured H and LE             mine the behavior of FCO2 in different scenarios for all three
fluxes (black dots) and the respective curves calculated from      evaluated sites. In the first test, the values of T , VPD, and u∗
ANNs (red lines).                                                  were fixed in order to isolate aerosol radiative effect on the
   During the evaluated period (August, September, and Oc-         availability of photosynthetically active radiation at the sur-
tober 2007), the mean H observed was 117.4 Wm−2 , while            face and the partitioning of it in its direct and diffuse forms.
the average of H generated by ANN for the same period              This first test is hypothetical, since it is known that the fixed
was 111.7 Wm−2 , a relative difference of 4.9 %. For LE, the       variables also suffer influences of AOD550nm. In the test,
mean value of the observed data was 218.1 Wm−2 and the             AOD550nm varied from 0.0 to 2.0 and the radiative transfer
average value generated by ANN was 218.7 Wm−2 , a rela-            model libRadtran was used to estimate values of PARi and
tive difference of 0.3 %. Although the analyses performed be-      PARdif values for three different solar zenith angles (15, 30,
tween the validation data and those obtained through ANNs          and 45◦ ). The results related to Bananal Island can be seen in
presented better results for H , the relative difference between   Fig. 4. The other sites showed similar behavior.
the mean values of LE – calculated and observed – was                 The values of T , VPD, and u∗ were fixed at the “opti-
lower.                                                             mal point” of FCO2 , i.e., for which values of T , VPD, and
   It is important to emphasize that the analysis performed        u∗ FCO2 presented the largest absolute values. For the other
between the validation data and the modeled data generated         sites, arbitrary values were fixed close to those found at Ba-
by ANNs is a way of determining if the neural network is           nanal Island. Table 2 shows the values of T , VPD, and u∗
robust. This does not necessarily mean that a low r 2 indicates    fixed for each one of the evaluated sites. Figure 5 shows the

Atmos. Chem. Phys., 20, 3439–3458, 2020                                               www.atmos-chem-phys.net/20/3439/2020/
R. K. Braghiere et al.: Characterization of the radiative impacts of aerosols in the Amazon 3449
Table 2. Fixed values of temperature (T ), vapor pressure deficit 4.3 Modeling temperature, humidity, and wind with
(VPD), and friction velocity (u∗ ) for three sites evaluated in the ANNs
first test.
Bananal Island – Rebio Jaru – Sinop – In the first test, temperature, VPD, and u∗ were fixed as de-
TO RO MT scribed in Table 2, but these variables are directly related to
the available energy at the surface, and, therefore, these vari-
T (◦ C) 28.5 29.0 29.0 ables would also be impacted in the presence of aerosols.
VPD (kPa) 1.5 2.0 2.0
Artificial neural networks were built from the same database
u∗ (m s−1 ) 0.3 0.2 0.2
used to make the previous ANNs but varying its input and
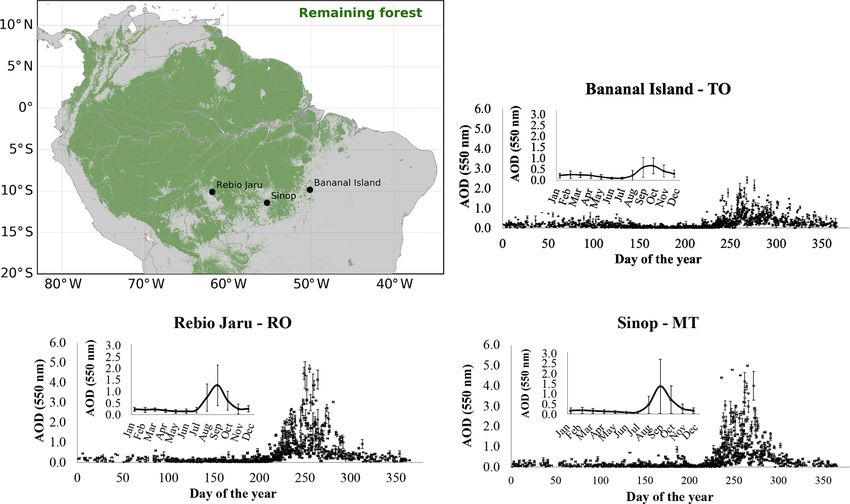
output values.
The first variable to be evaluated was the temperature.
variation in FCO2 in relation to AOD550nm for three differ- Three variables were used as input parameters in the training
ent SZAs (15, 30, and 45◦ ) at the three evaluated sites. For processes of the temperature ANN: PARi (Wm−2 ), PARdif
Bananal Island and Rebio Jaru, the increase in AOD550nm (%), and SZA (◦ ). These variables were chosen as inputs for
generates an initial decrease in the absolute values of FCO2 the neural network of temperature because radiation directly
for almost all SZAs, except for the solar zenith angle of 30◦ impact surface temperature. The available energy at the sur-
at Bananal Island, which appears to have no impact on CO2 face is proportional to PARi and PARdif , linked to the diurnal
flux until AOD550nm ∼ 0.25. However, from this value on, cycle.
the FCO2 values show a decreasing trend. The second evaluated variable was VPD. This variable is
The FCO2 at Bananal Island presents a minimum point related to temperature, which is related to PARi , PARdif , and
with the variation in AOD550nm, while in Rebio Jaru, FCO2 SZA. Thus, these four variables were used as input values in
presents a more stable behavior. At Bananal Island, after the the construction of the VPD ANN.
minimum point of the curve, FCO2 starts to increase with Finally, u∗ is also affected by energy available at the sur-
AOD550nm; i.e., there is an optimal range of AOD550nm, face but to a lower degree once it is directly dependent on
which is dependent on the SZA. For SZA = 15◦ , this inter- wind speed. All other variables (except for the AOD550nm
val is associated with AOD550nm between 0.59 and 0.93. itself, in order to avoid overtraining) were used as input val-
For SZA = 30◦ , the interval is narrower, with AOD550nm ues in the construction of the u∗ ANN.
ranging from 0.57 to 0.61. And for SZA = 45◦ , AOD550nm Figure 6 shows data used for the validation, i.e., without
is between 0.45 and 0.55. For higher values of AOD550nm interference in the construction of the networks. The values
(above 1.75), the behavior of FCO2 also stabilizes but at dif- of the x axis correspond to the observed values and those of
ferent points, dependent on SZA. the y axis to the values generated by the neural networks.
In Rebio Jaru, on the other hand, this behavior associ- The results for the neural networks of VPD, for all evaluated
ated with an “optimal range” of AOD550nm influence on sites, were the most compatible with the values observed,
the FCO2 curve is not observed. It is possible to identify and they presented an r 2 greater than 0.8. This is mainly
a value of AOD550nm where the value of FCO2 stabilizes because VPD is closely related to temperature. The expla-
and does not present significant variations anymore. This nation of the variance of VPD through the variables used as
value of AOD550nm, associated with the stabilization of inputs of the ANNs was mainly governed by temperature.
the curves, also appears correlated with the solar zenith an- At Bananal Island, temperature explained 50.5 % of the VPD
gle. For SZA = 15◦ , this value of AOD550nm is 0.98, for variance; in Rebio Jaru and Sinop, it explained 65.6 % and
SZA = 30◦ it is 0.88, and for SZA = 45◦ it is 0.65. When 38.1 %, respectively. Temperature and friction velocity pre-
analyzing the results for Sinop, this behavior of a decrease in sented a moderate value of r 2 (between 0.2 and 0.5) for all
the absolute value of FCO2 with the increase in AOD550nm cases. However, in the overall sensitivity analysis, PARi was
is not verified. The addition of AOD550nm values from 0.0 mostly responsible for the explanation of the variance of tem-
to 2.0 generates increases in absolute values, that is, the CO2 perature.
changes between the local vegetation and the atmosphere de-
crease with a higher aerosol load. This behavior is observed
up to a value of AOD550nm from where FCO2 value sta- 4.4 Isolating the radiative impact of aerosols on CO2 ,
bilizes, depending on the SZA. For SZA = 15◦ , this value sensible heat, and latent heat fluxes with ANN
of AOD550nm is 1.85, for SZA = 30◦ it is 1.70, and for modeling
SZA = 45◦ AOD550nm = 1.25.
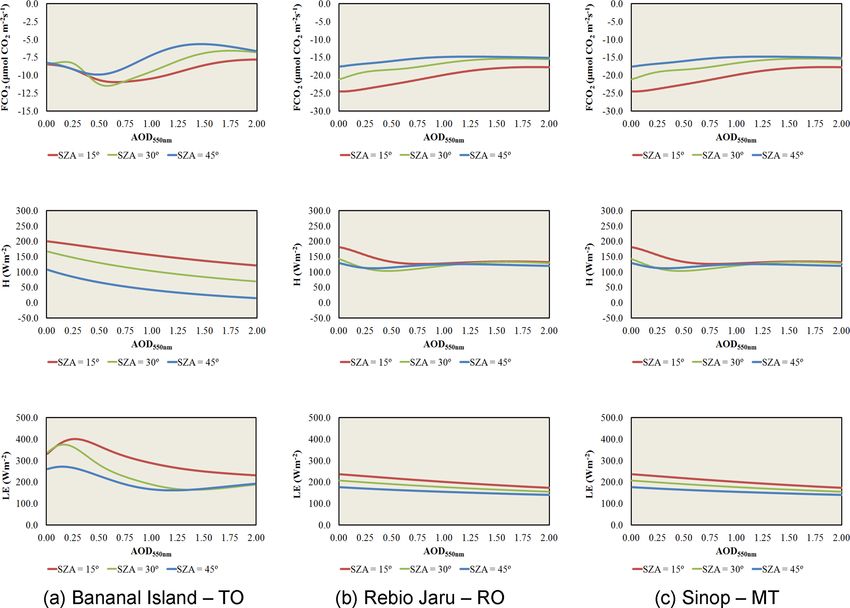
From the generated ANNs, a study was performed in order
to identify what the relative differences would be in FCO2 ,
H , and LE fluxes between real observed conditions and an
atmosphere without aerosols, i.e., with AOD550nm = 0.0 for
the evaluated cases.
www.atmos-chem-phys.net/20/3439/2020/ Atmos. Chem. Phys., 20, 3439–3458, 20203450 R. K. Braghiere et al.: Characterization of the radiative impacts of aerosols in the Amazon Figure 5. Modeled FCO2 (µmol CO2 m−2 s−1 ), H (W m−2 ), and LE (W m−2 ) via ANNs versus AOD550nm for three SZAs (15, 30, and 45◦ ) for three study sites. Values of temperature, VPD, and u∗ were kept constant. PARi and PARdif were obtained through libRadtran. First, the radiative transfer model, libRadtran, was used CO2 , H , and LE. Table 3 summarizes the results. The mean to obtain PARi and PARdif values for an atmosphere with real values and standard deviations of each of the variables AOD550nm = 0.0. For the calculations, the real values of of the initial set of data, the mean model values, and the re- SZA and day of the year were used. The results for the Rebio spective standard deviations are also shown for all variables. Jaru site can be visualized in Fig. 7. For the other study sites, The relative difference between the means of the actual val- the same behavior of the curves is observed. ues and the simulated ones indicates whether the model pre- It is possible to identify that the observed values of PARi sented values larger than the real ones (positive) or smaller are systematically lower than those obtained by the radiative (negative). transfer model, while the opposite is observed for PARdif . PARi and PARdif variables agreed over the three sites, Aerosol decreases the incident shortwave global radiation when comparing the actual and simulated values. The aver- at the surface by absorption and scattering processes, while age of the modeled PARi values, without aerosol, was 12.4 % it increases the percentage of diffuse radiation due to the higher than the average of the real values for the Bananal Is- scattering. From PARi and PARdif calculated for an aerosol- land site, 29.8 % higher for Rebio Jaru, and 26.3 % higher for free atmosphere, temperature, VPD, and u∗ were calculated Sinop. On the other hand, the average of the model values of through the ANNs. The SZA values used as input in the li- PARdif was 35.9 % lower than the average of the real values bRadtran were the same as those used in the ANNs. for Bananal Island, 52.0 % lower for Rebio Jaru, and 38.0 % All variables obtained by both models (libRadtran and lower for Sinop. ANNs) – except for the values of AOD550nm, which were Temperature also showed agreement regarding the in- set to zero, and SZAs, which were kept the same as in the crease in the mean values modeled in relation to the mean original database – were used in calculations of fluxes of real values. At Bananal Island, the increase was 11.3 %, in Atmos. Chem. Phys., 20, 3439–3458, 2020 www.atmos-chem-phys.net/20/3439/2020/
R. K. Braghiere et al.: Characterization of the radiative impacts of aerosols in the Amazon                                        3451

Figure 6. Temperature (◦ C), VPD (kPa), and u∗ (m s−1 ) obtained from ANNs generated with observed values for the three study sites, with
respective r 2 , MAE, and RMSE. The 1 : 1 line (thick) and the best linear fit (thin) are also shown.

Rebio Jaru it was 7.4 %, and in Sinop the relative difference          erties of canopies (Zhang et al., 2010; Kanniah et al., 2012;
was 1.7 %. The relative difference between the actual and              Tang and Dubayah, 2017). Niyogi (2004) showed that carbon
modeled mean values of VPD and u∗ did not show agree-                  assimilation grows with an increase in aerosol concentration
ment for the three experimental sites. However, Bananal Is-            in the case of forests and cultivated areas and decreases over
land presented a significant increase in VPD (∼ 50 %) for an           pastures.
atmosphere with no aerosols.                                              The surrounding areas of the flux tower in Sinop show
   As demonstrated by Doughty et al. (2010) for a tropical             several regions of pasture, which later became soy or maize
forest, there is a decrease of approximately 13 % in the FCO2          plantations. For this reason, the less complex canopy struc-
for every 1 ◦ C increase in temperature, when it is above              tures in the region (with lower vegetation and more homo-
28 ◦ C. Due to the high correlation between VPD and T , the            geneity in the vertical and horizontal distribution) have op-
results of the model without aerosols agree with the authors.          posite responses to that proposed by the “diffuse fertilization
   For FCO2 , Bananal Island and Rebio Jaru presented higher           effect” theory. The complexity of the canopies at Bananal Is-
mean modeled values; i.e., a lower exchange of CO2 with the            land and Rebio Jaru confirms the effect.
atmosphere is expected under the effect of episodes with-                 The same type of test was performed in order to evaluate
out aerosols. Sinop presented the opposite effect. This is             the relative differences in H and LE under conditions of an
mainly due to the differences in structural local character-           observed aerosol concentration and a simulated atmosphere
istics of each site. The response of photosynthetic capacity           without aerosols, with AOD550nm = 0.0. In this test, energy
to an increase in diffuse radiation may vary between differ-           (H and LE) fluxes were obtained using variables calculated
ent ecosystems and seems to be related to the different prop-          by the models (libRadtran and ANNs), except for the values

www.atmos-chem-phys.net/20/3439/2020/                                                    Atmos. Chem. Phys., 20, 3439–3458, 2020
You can also read