Glacial limitation of tropical mountain height - Earth Surface ...
←
→
Page content transcription
If your browser does not render page correctly, please read the page content below
Earth Surf. Dynam., 7, 147–169, 2019
https://doi.org/10.5194/esurf-7-147-2019
© Author(s) 2019. This work is distributed under
the Creative Commons Attribution 4.0 License.

                      Glacial limitation of tropical mountain height
               Maxwell T. Cunningham1,2 , Colin P. Stark2 , Michael R. Kaplan2 , and Joerg M. Schaefer1,2
            1 Dept.   of Earth and Environmental Sciences, Columbia University, New York, New York 10027, USA
               2 Lamont-Doherty     Earth Observatory of Columbia University, Palisades, New York 10964, USA
                          Correspondence: Maxwell T. Cunningham (maxwellc@ldeo.columbia.edu)

                                       Received: 1 May 2018 – Discussion started: 15 May 2018
                        Revised: 22 November 2018 – Accepted: 21 December 2018 – Published: 31 January 2019

       Abstract. Absent glacial erosion, mountain range height is limited by the rate of bedrock river incision and is
       thought to asymptote to a steady-state elevation as erosion and rock uplift rates converge. For glaciated moun-
       tains, there is evidence that range height is limited by glacial erosion rates, which vary cyclically with glaciations.
       The strongest evidence for glacial limitation is at midlatitudes, where range-scale hypsometric maxima (modal
       elevations) lie within the bounds of Late Pleistocene snow line variation. In the tropics, where mountain glacia-
       tion is sparse, range elevation is generally considered to be fluvially limited and glacial limitation is discounted.
       Here we present topographic evidence to the contrary. By applying both old and new methods of hypsometric
       analysis to high mountains in the tropics, we show that (a) the majority are subject to glacial erosion linked to a
       perched base level set by the snow line or equilibrium line altitude (ELA) and (b) many truncate through glacial
       erosion towards the cold-phase ELA. Evaluation of the hypsometric analyses at two field sites where glacial
       limitation is seemingly marginal reveals how glaciofluvial processes act in tandem to accelerate erosion near the
       cold-phase ELA during warm phases and to reduce their preservation potential. We conclude that glacial erosion
       truncates high tropical mountains on a cyclic basis: zones of glacial erosion expand during cold periods and
       contract during warm periods as fluvially driven escarpments encroach and destroy evidence of glacial action.
       The inherent disequilibrium of this glaciofluvial limitation complicates the concept of time-averaged erosional
       steady state, making it meaningful only on long timescales far exceeding the interval between major glaciations.

1   Introduction                                                        For well over a century (Penck, 1905), it has been thought
                                                                     that such glacial limitation of mountain height is widespread.
The height of non-glaciated mountain ranges is limited by            In the late 20th century, the concept of glacial limitation was
erosion along rivers, with rock uplift steepening channels           taken to an extreme and reframed as the “glacial buzz saw”
and accelerating channel incision until, in principle, both          hypothesis (Brozović et al., 1996). The hypothesis is rooted
rates match. This mechanism ties mountain erosion to a low-          in the observation that mountain ranges high enough for
elevation base level, and channel incision abruptly switches         Pleistocene glaciation do not usually rise much higher than
to deposition at this elevation. However, in many mountains          the ELA (Fig. 1), and it claims that glacial erosion imposes
there is a transition at high elevations from fluvial to glacial     a near-global topographic ceiling by cutting large swaths of
conditions, which introduces a second base level perched             terrain down to this elevation. It has been an important contri-
close to the glacial equilibrium line altitude (ELA). Above          bution to the broader realization that landscapes evolve under
the ELA, rates of glacier incision and coupled supra-ice rock-       the interacting influence of tectonically driven crustal defor-
slope erosion may match or exceed rock uplift rates; be-             mation and climatically modulated erosion (e.g., Molnar and
low the ELA, in the ablation zone, subglacial incision rates         England, 1990; Willett et al., 2006). Debate over the preva-
asymptote to zero while fluvial erosion is suppressed. Un-           lence (or even existence) of a glacial buzz saw cuts to the core
der these conditions, erosion towards the perched glacial base       challenge of disentangling climatic and tectonic imprints on
level is the essential height-limiting mechanism.                    landscapes.

Published by Copernicus Publications on behalf of the European Geosciences Union.
148                                                        M. T. Cunningham et al.: Glacial limitation of tropical mountain height

                                                                      most marginally glaciated ranges, such as the Central Range
                                                                      of Taiwan and the Talamanca Range of Costa Rica, glacial
                                                                      and fluvial erosion work in tandem to limit range height to
                                                                      the ELA – a process we term “glaciofluvial limitation”. In
                                                                      contrast, the perched glacial base level is fully developed in
                                                                      those ranges where the most rock mass has been advected
                                                                      through the ELA. This surprising result adds new context
                                                                      to the concept of glacial limitation by showing that a high-
                                                                      elevation, glacial base level has been periodically introduced
                                                                      even in the warmest places.

                                                                      1.1   What does “glacial limitation of mountain height”
                                                                            mean?
Figure 1. Hypsometric maximum of glaciated 1◦ × 1◦ SRTM tiles
(adapted from Fig. 2 of Egholm et al., 2009, data provided courtesy   Glacial limitation refers to the presence of an erosional base
of Vivi Pedersen). Each tile is plotted by its approximate warm-      level at the ELA and the disconnection of glaciated terrain
phase (modern) ELA (wpELA; x axis) and its hypsometric maxi-          from fluvial base-level forcing (Egholm et al., 2009). The in-
mum relative to (after subtraction by) the cold-phase ELA (cpELA;     troduction of this perched base level results in the widening
y axis); zero on the y axis therefore indicates a hypsometric maxi-   of glacial terrain near the ELA and does not necessarily af-
mum at the cpELA. Glacial limitation is inferred for all SRTM tiles   fect the distribution of peak heights, which are often found
with a hypsometric maximum between the wpELA and cpELA.               on isolated spires far above the ELA (e.g., Brozović et al.,
The tiles of tropical mountain ranges analyzed in this study are
                                                                      1997; Ward et al., 2012). The concept of base level is usu-
in green and labeled according to the scheme used in Figs. 3 and
8: (a) Leuser Range, Aceh (omitted here); (b) Central Range, Tai-
                                                                      ally associated with fluvial erosion, in which the rate of river
wan; (c) Talamanca Range, Costa Rica; (d) Crocker Range, Borneo       incision undergoes a zero crossing, typically at an elevation
(omitted here); (e) Finisterre Range, Papua New Guinea; (f) Owen      where channelized flow becomes unconfined and spreads lat-
Stanley Range, Papua New Guinea; (g) Merauke Range, Papua;            erally, such as at sea/lake level or at a piedmont-alluvial fan
(h) Mérida Range, Venezuela; (i) Sierra Nevada de Santa Marta,        apex (Fig. 2a). Above fluvial base level, river channel inci-
Colombia (omitted here); (j) Rwenzori, East Africa. The Leuser        sion drives hillslope erosion and competes with rock uplift
Range, Crocker Range, and Sierra Nevada de Santa Marta were not       to set range relief. Erosional behavior above and below the
included in the analysis by Egholm et al. (2009).                     perched, glacial base level is analogous. Below the ELA, ice
                                                                      flow spreads laterally, ablates, and slows, driving subglacial
                                                                      erosion rates to zero. The (near-) ELA acts as an erosional
   The strongest proponents of a global glacial buzz saw              base level, above which ice-driven erosion pushes headward
have implied that erosion can outpace strong tectonic forc-           into the landscape (Fig. 2b). Glacial erosion ultimately dis-
ing once uplifted rock mass reaches the ELA – a climatically          connects these landscapes from fluvial base level by blocking
determined elevation. Detractors claim that the power of the          channel incision above the glacier terminus – an elevation
glacial buzz saw has been overstated and instead suggest that         where glacial erosion is also least effective. During glacia-
in most cases glaciations have ornamented, rather than sub-           tions, continued channel incision below the glacier terminus
stantially cut, uplifted terrain, which remains at high eleva-        amplifies the disconnection between fluvial and glacial land-
tions precisely because erosion is unable to remove it (van           scapes.
der Beek et al., 2009; Hall and Kleman, 2014).                           In mountains thought to be glacially limited, it is common
   Here, we present a new test of the hypothesis that the             to find peaks that rise more than 1 km above the ELA (Bro-
height of mountains with terrain above the ELA is set by              zović et al., 1997). Glacial limitation allows such high peaks
a perched de facto glacial base level. We focus on a group            if they are coupled to cirque/valley glacier incision that is
of tropical mountains whose erosion is dominated by fluvial           effectively controlled by the ELA. The concept is similar
processes driven by and tightly linked to tectonic uplift, that       to fluvial limitation, such that high peaks rise several kilo-
are unaffected by recent volcanic construction and free of            meters above fluvial base level but are ultimately limited in
broad areas of internal drainage, and that only encounter the         height by the efficacy of erosion. In the glacially limited case,
ELA at high elevations. Our rationale is that these mountains         glacial erosion introduced near the ELA lowers mountains
will be particularly sensitive recorders of glacial limitation        that would otherwise reach higher elevations in fluvially lim-
precisely because non-glacial erosion processes have been             ited conditions.
imprinted on them so strongly. In other words, we assess the
potential for glacial limitation in places where fluvial limita-
tion is, a priori, more likely. We ultimately find evidence in
nine ranges that glacial erosion limits mountain height. In the

Earth Surf. Dynam., 7, 147–169, 2019                                                      www.earth-surf-dynam.net/7/147/2019/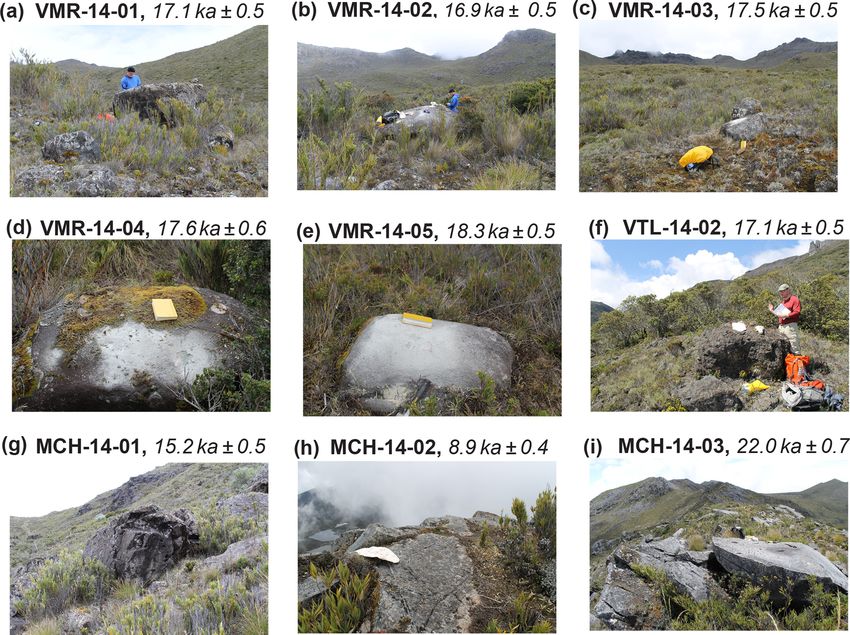
M. T. Cunningham et al.: Glacial limitation of tropical mountain height                                                                     149

Figure 2. (a) Fluvial limitation: vertical erosion rate vs. elevation in a steady-state, fluvially limited regime. Black line: slow rock uplift;
red line: fast rock uplift. The rate of rock uplift sets steady-state peak elevations (closed circle) at different elevations. Warm-phase ELA
(wpELA) and cold-phase ELA (cpELA) are indicated for reference but are irrelevant in this scenario. (b) Glacial limitation, with glacial base
level below the cpELA. Black line: erosion rate profile, with significant glacial influence at high elevations. Peak elevations reach above the
cpELA but are tied to glacial incision near this elevation. (c) Glaciofluvial limitation. Blue line: erosion rate profile during glacial periods,
similar to panel (b). Red line: interglacial erosion rate profile, characterized by headward migrating escarpment (along dashed line above
erosion rate profile). During interglacials, erosion in previously glaciated landscapes is ineffective (dashed line, left-hand side).

1.2   Motivation: Does glacial erosion limit tropical                      the Central Range of Taiwan. These two ranges were cho-
      mountain height?                                                     sen because of the seemingly marginal influence of glacial
                                                                           erosion in limiting their height. We find evidence to the con-
Tropical mountains have traditionally been considered to be                trary: the data suggest that glacial erosion has played a ma-
fluvially limited. Their high rates of rainfall drive high rates           jor role in the long-term evolution of both landscapes, but
of fluvial incision and coupled hillslope erosion, and these               that evidence of its role has been compromised by the head-
processes are generally thought to dominate landscape evo-                 ward encroachment of surrounding fluvial terrain during in-
lution. Although such mountain ranges have been glaciated                  terglacials. The poor preservation potential of glacial mor-
repeatedly throughout the Pleistocene (Porter, 1989; Has-                  phology in the tropics has led to an underestimation of its
tenrath, 2009), the erosional consequences of snowfall and                 importance in limiting range height.
glacial ice have typically been deemed negligible and lim-
ited to very high elevations. Glacial erosion has therefore
been discounted as a factor in limiting the height of tropical             2     Evidence for glacial limitation: a review
mountain ranges – with only a few exceptions (e.g., Ring,
2008; Margirier et al., 2016). Our goal in this paper is to as-            2.1    First reports
sess the possibility of glacial limitation in tropical ranges and
by extension to reevaluate the efficacy of glacial limitation in           The first articulation of the idea that ice-driven erosion could
general.                                                                   limit mountain range height came over a century ago, when
                                                                           Dawson (1895) asserted that frost cracking had kept the
1.3   Structure of this paper
                                                                           ridgeline of Kamloops, British Columbia, at a relatively con-
                                                                           stant elevation. His claim was speculative and called atten-
We explore the possibility that glacial erosion has limited the            tion to a striking similarity in the elevation of mountain sum-
rise of tropical mountains by looking closely at the morphol-              mits and their apparent correlation with the bottom of the
ogy of tropical highlands. First, we review the evidence for               frost-cracking window. Penck (1905) put forth a more formal
glacial limitation globally and highlight how hypsometry has               argument for glacial limitation of mountain height around
been the tool of choice in assessing glacial limitation. We                the same time but instead focused on subglacial erosion. In
then focus on the tropics and undertake topographic and geo-               this remarkable paper, Penck described the differences be-
morphic analyses of a broad selection of high tropical moun-               tween glacial and fluvial valleys in the Western Alps and
tain ranges. We carry out range-scale hypsometric analysis                 proposed that glacial erosion had flattened and widened pre-
of 10 such ranges to evaluate signs of correlation between                 existing fluvial valleys to accommodate ice flux. Penck rea-
mountain height, the ELA, and glacial erosion. Next, we de-                soned that the topographic structure of the Western Alps is
velop a new methodology for analyzing catchment hypsom-                    geologically young and (in the absence of any plate tectonics
etry in a progressive, nested fashion, which helps with the                framework) hypothesized that glacial erosion had outpaced
comparison of hypsometry in mountain ranges of very differ-                the rate of rock uplift and limited the height of the range. It
ent sizes. Armed with insights from these analyses, we evalu-              was not until the late 20th century, however, that the potential
ate them in detail in the Talamanca Range of Costa Rica and                for the widespread limitation of mountain height by glacial

www.earth-surf-dynam.net/7/147/2019/                                                              Earth Surf. Dynam., 7, 147–169, 2019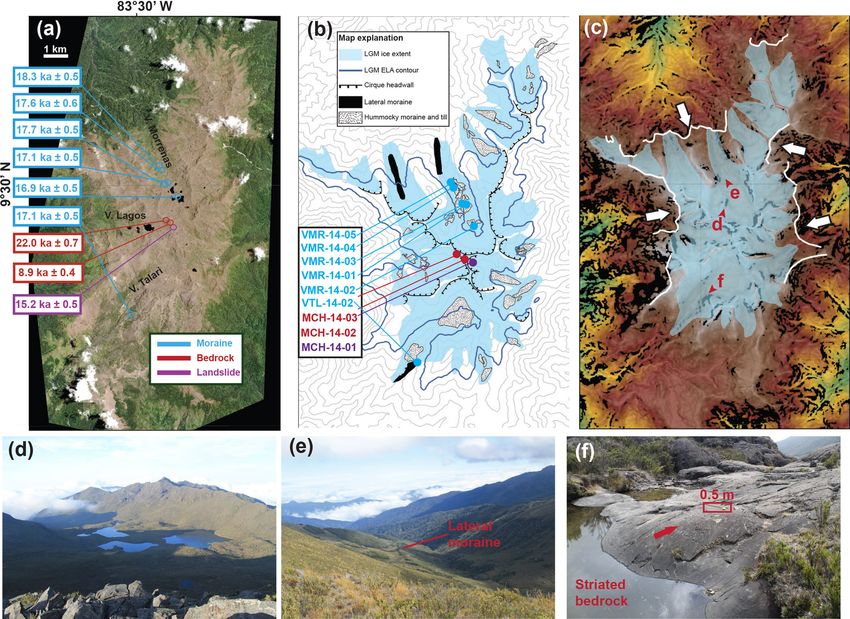
150                                                     M. T. Cunningham et al.: Glacial limitation of tropical mountain height

erosion was considered, when Porter (1977) and Broecker            tent with a lengthening of the ELA contour by headward
and Denton (1989) used a compilation of ELA estimates (pa-         cirque erosion as well the presence of low-gradient terrain at
leo and modern) from the length of the American Cordillera         this elevation. In most cases, the hypsometric maxima found
to demonstrate a qualitative match between peak mountain           at the ELA probably arise both from contour width (low-
height and the bounds of Pleistocene ELA fluctuation.              gradient terrain) and contour length (erosional penetration)
                                                                   at the ELA.
2.2   Emphasis on midlatitudes
                                                                      The strongest empirical evidence for widespread glacial
                                                                   limitation comes from the global analysis of Egholm et
The modern form of this idea is the glacial buzz saw hy-           al. (2009), who analyzed large swaths of topography (1◦ ×1◦
pothesis, which was first articulated by Brozović et al. (1996,   tiles of Shuttle Radar Topography Mission (SRTM) digital
1997). They found that hypsometric maxima (modal average           elevation) to show that on the scale of a mountain range,
elevations) of large (∼ 1000 km2 ) physiographic provinces in      hypsometric maxima almost never lie above the upper limit
the northwest Himalaya lie just below the modern snow line         of Late Pleistocene ELA fluctuation. They showed that most
(used as a proxy for the modern ELA), despite major differ-        mountain ranges affected by Pleistocene glaciation have a
ences in erosion rate, geologic structure, and local climate.      hypsometric maximum between the upper and lower bounds
Brozović et al. (1997) made the important conceptual ad-          of ELA variation (Fig. 1), similar to the observations made by
vance of defining mountain height as the hypsometric maxi-         Brozović et al. (1997) in the northwest Himalaya. It is strik-
mum of a large region and showed that even though peak ele-        ing how widely this bound is observed over an ELA span of
vations of different physiographic provinces in the northwest      ∼ 5 km.
Himalaya differ by more than 1 km, the hypsometric maxima             Another line of evidence for glacial limitation has been
of these provinces are similar and match the altitude of the       an apparent acceleration in exhumation rate that coincides
ELA. They attributed this topographic pattern to headward          with the onset of Pleistocene glaciation. The thought is that
erosion focused at the ELA by cirque glaciers, a process that      if mountain ranges around the world have been subject to
leaves low-gradient topography near the ELA and, in many           glacial limitation, a corresponding increase in exhumation
cases, large rock spires that rise above cirque floors.            rate should be apparent close to the onset of global glacia-
   In the years since, this hypothesis has gained widespread       tion in the thermo-chronometric record. This signal has been
although incomplete acceptance. A hypsometric maximum              borne out on a regional level, such as in the Southern An-
within the bounds of Late Pleistocene ELA variation is now         des (Thomson et al., 2010), Western Alps (Fox et al., 2015),
widely regarded as the signature of the glacial buzz saw (e.g.,    and Cordillera Blanca (Margirier et al., 2016). Thus, the
Brozović et al., 1997; Brocklehurst and Whipple, 2004; Os-        evidence for glacial limitation consists of both an appar-
kin and Burbank, 2005; Mitchell and Montgomery, 2006;              ent glacially driven increase in exhumation rate recorded
Egholm et al., 2009; Mitchell and Humphries, 2015), al-            in thermo-chronometry as well as a near-global topographic
though how glacial erosion produces this hypsometric maxi-         signature.
mum is debated. There is broad agreement (Anderson et al.,            The idea that glacial erosion limits mountain height and
2006; Egholm et al., 2009; MacGregor et al., 2009; Pedersen        that mountains would generally be higher in an ice-free world
and Egholm, 2013) that cirque glacier erosion is ultimately        is not universally accepted. A key problem is that it is diffi-
responsible. Egholm et al. (2009) demonstrated that the small      cult to disentangle the topographic signatures of non-glacial
drainage area of cirque glaciers ultimately limits their ability   versus glacial processes (e.g., Hall and Kleman, 2014). Iron-
to incise below the ELA, even if the large trunk glaciers they     ically, one of the most problematic cases comes from the
feed can erode far below this elevation (Valla et al., 2011).      birthplace of the glacial buzz saw hypothesis, the northwest
The ELA thus acts as an erosional base level for tributary         Himalaya, where Van der Beek et al. (2009) used a combina-
cirque glaciers. When the glacial base level is effective over     tion of thermo-chronometry and topographic analysis to pro-
a large area, it is recorded in the landscape as a hypsometric     pose that Pleistocene glaciation took advantage of a preexist-
maximum near the ELA.                                              ing eroded surface – and that the correlation between region-
   The interpretation of the match between landscape hyp-          scale hypsometric maxima and the Pleistocene ELA is sim-
sometric maximum and the ELA often links the hypsomet-             ply a coincidence of low-gradient topography near the ELA.
ric maximum to low-gradient terrain left near the ELA by           It has been proposed that this kind of topographic inheri-
cirque-driven headward erosion (e.g., Brozović et al., 1997;      tance may comprise the majority of the global signature of
Egholm et al., 2009). It should be noted, however, that hyp-       glacial limitation (Hall and Kleman, 2014). Another matter
sometry is simply a measure of the fraction of the terrain         of significant controversy is whether mountain ranges were
covered by each contour band. A hypsometric maximum                actually subject to enhanced erosion rates during the Pleis-
is not uniquely determined by topographic gradient: rather,        tocene. Schildgen et al. (2018) analyzed 30 locations where
the hypsometric maximum should be thought of as a con-             enhanced Pleistocene exhumation rates had been inferred
tour whose combined length and thickness exceeds all other         from thermo-chronometric data (Herman et al., 2013) and
contours. A hypsometric maximum at the ELA is consis-              found that the signal of enhanced exhumation in 27 of those

Earth Surf. Dynam., 7, 147–169, 2019                                                   www.earth-surf-dynam.net/7/147/2019/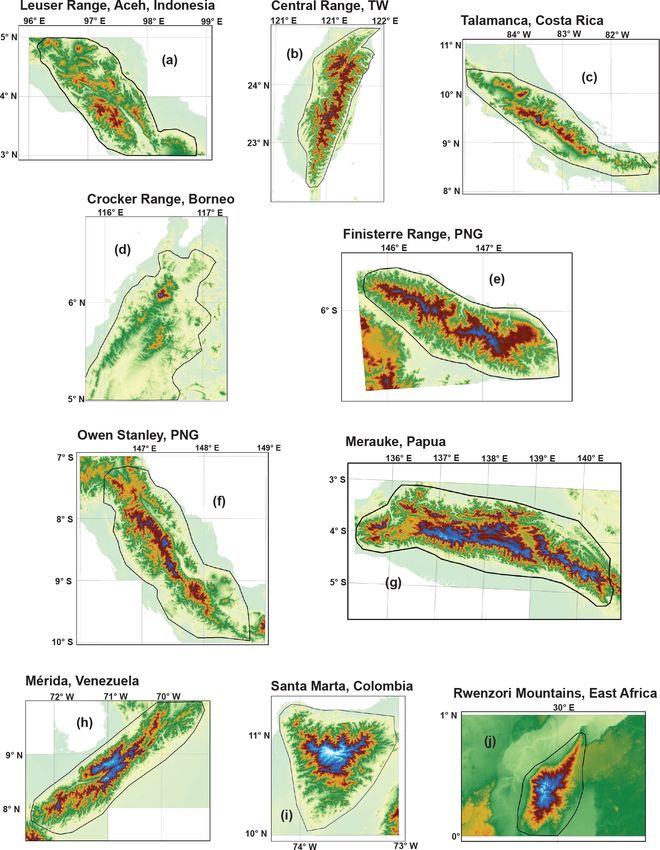
M. T. Cunningham et al.: Glacial limitation of tropical mountain height                                                      151

sites could be explained either by bias introduced by inappro-     1. Leuser Range, Aceh, Indonesia
priate sampling or by a change in tectonic boundary condi-
tions rather than by climate change. Inferences about global-      2. Central Range, Taiwan
scale exhumation patterns thus merit reevaluation. Our paper       3. Talamanca Range, Costa Rica
does not directly address these issues and instead evaluates
the topographic imprint of glacial erosion, focusing on loca-      4. Crocker Range, Borneo
tions where it has not been recognized before.
                                                                   5. Finisterre Range, Papua New Guinea
2.3     In the tropics                                             6. Owen Stanley Range, Papua New Guinea
The principal reason for skepticism of glacial limitation in       7. Merauke Range, Papua
the tropics is that regional hypsometry shows (a) very lit-
tle area near the lower-limit of the Pleistocene ELA and           8. Mérida Range, Venezuela
(b) significant hypsometric maxima several kilometers be-
low it (Fig. 1). Since most of these mountains are ridge-and-      9. Sierra Nevada de Santa Marta, Colombia
valley landscapes dominated by fluvial incision, it is reason-
                                                                 10. Rwenzori, East Africa
able to assume that if glacial erosion has taken place at all,
it has only affected isolated portions of the mountain range.
A similar rationale is that these ranges need to be well above   3.1.2    Comparing the ELA across tropical mountains
3000 m for cold-phase glacial erosion at all, and thus most      For our tropics-wide comparison we used an ELA range
glacial landscapes in the tropics sit above quickly eroding      of 3400–4000 m, which represents the approximate vertical
highlands whose height is thought to be controlled by the        span of the Last Glacial Maximum (LGM) ELA estimated
rate of fluvial incision. Nevertheless, the observation that     around the tropics (e.g., Mark et al., 2005; Hastenrath, 2009)
mountain height rarely exceeds the ELA includes the trop-        and is similar to the vertical range of LGM ELA in partic-
ics (Broecker and Denton, 1989; Egholm et al., 2009).            ularly wide mountain ranges with strong spatial variation in
                                                                 local climate (e.g., Merauke Range, Papua: Prentice et al.,
3     Study areas                                                2005; Mérida Range, Colombia: Stansell et al., 2007). We
                                                                 adopt the term cold-phase ELA (cpELA) to emphasize that
3.1     Global analysis                                          the ELA has repeatedly descended to roughly this elevation
                                                                 in tropical mountain ranges during glacial periods in the Late
3.1.1     Site selection
                                                                 Pleistocene (e.g., Farber et al., 2005; Barrows et al., 2011),
Seeking to broadly assess the potential for glacial limi-        regardless of whether mountains were high enough to inter-
tation in tropical mountain ranges, we reviewed all those        sect it. Importantly, the cpELA is not strictly interchangeable
ranges close to the height of the cold-phase ELA (cpELA).        with the global LGM (gLGM) ELA, since the timing of the
Within this broad selection, we sought a subset uncontami-       local LGM appears to have varied (by 10–20 kyr) in the trop-
nated by processes that would distort or complicate any sig-     ics and subtropics (e.g., Ono et al., 2004). Furthermore, ELA
nal of glacial limitation. In particular, we wanted to avoid     estimates are based on geomorphic reconstructions that ig-
any confusion between the passive uplift of low-relief ter-      nore tectonics: as such they are potentially biased towards
rain from that of in situ glacial erosion. The potential for     higher elevations by postglacial rock uplift. Where glacial
such confusion is strongest in the Peruvian/Bolivian Andes,      landforms are dated to the LGM such bias is likely negligi-
the Sierra Madre of Mexico and Guatemala, and the cen-           ble. When age constraints are lacking and an LGM age for
tral highlands of Papua New Guinea, all of which are char-       the glacial landscape is in doubt, ELA estimates may be in-
acterized by large, internally drained plateaus disconnected     fluenced by pre-LGM glacial landforms subject to rock uplift
from external base level; as such, these regions were ex-        for longer periods of time: in these cases, the risk of bias to-
cluded from our analysis. Volcanism is another complicating      wards higher elevations (> 100 m) is significant. However,
factor, in that glaciated volcanoes have undergone a mix of      our goal is to assess whether mountains prone to glaciation
construction and erosion that cannot easily be disentangled.     have been limited by glacial erosion, regardless of when or
Therefore, glaciated volcanoes such as those in East Africa      at what elevation such erosion took place. As long as the
(Mt. Kilimanjaro and Mt. Kenya) and Papua New Guinea             cpELA has repeatedly descended to a similar elevation dur-
(Mt. Giluwe) were excluded from our analysis. A final con-       ing the Late Pleistocene, error in its estimation on the scale of
straint was that each range must be circumferentially well-      hundreds of meters is too small to compromise an assessment
connected to external base level (sea level or lake level) by    of whether mountain height has been limited at an elevation
relatively short fluvial links.                                  of several kilometers.
   The following 10 tropical mountain ranges remain and             On a global basis, the ELA of interglacial periods (which
were selected for analysis (Fig. 3):                             for convenience we term the “warm-phase” ELA or wpELA)

www.earth-surf-dynam.net/7/147/2019/                                                  Earth Surf. Dynam., 7, 147–169, 2019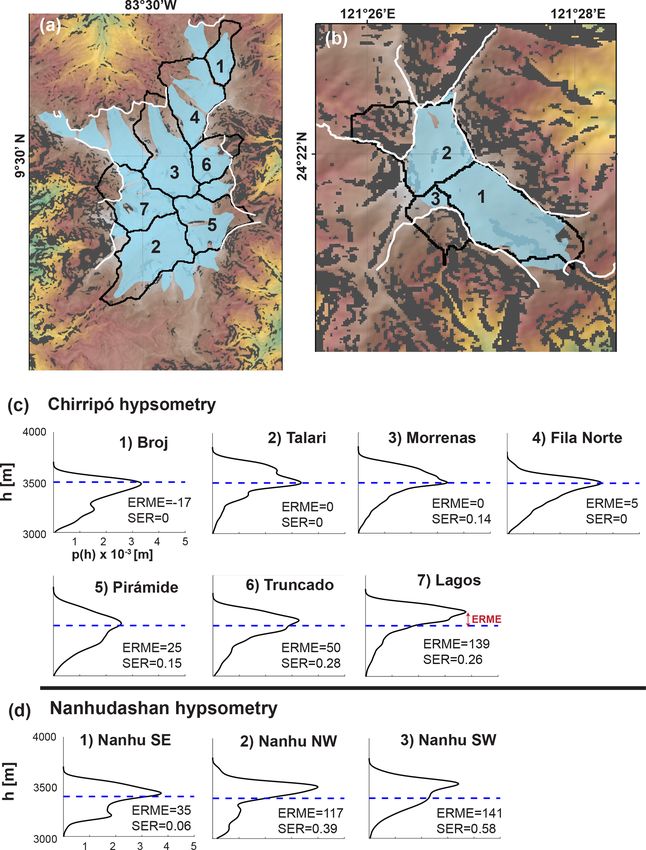
152                                                     M. T. Cunningham et al.: Glacial limitation of tropical mountain height

Figure 3. (a–j) SRTM DEMs of selected tropical mountain belts. Yellow-green through red spans elevations 0–3400 m. Dark blue to light
blue is 3400–4500 m (tropical cpELA to wpELA). Black polygons circumscribing each range indicate bounds for hypsometric analysis in
Fig. 8.

has generally been 800–1000 m above the cpELA (Porter,               ern ELA of 4650 m using aerial photographs (Prentice et al.
1989; Broecker and Denton, 1989). We consider the wpELA              (2005) found that ice loss has accelerated at the Carstensz
to be broadly interchangeable with the modern ELA, al-               Glacier since the 1970s and suggested that the most reliable
though warming and commensurate glacier retreat during               modern ELA estimate was based on 1972 imagery). In the
the late 20th century complicates the definition of the mod-         Rwenzori Mountains, Kaser and Osmaston (2002) compiled
ern ELA. Four of our 10 selected mountain ranges are cur-            aerial photographs and observations from several field expe-
rently glaciated and thus intersect the wpELA: the Merauke           ditions to map changes in glacier extent between 1955 and
Range, the Rwenzori, the Sierra Nevada de Santa Marta,               1990. They used field mapping and aerial photographs from
and the Mérida Range. In the Merauke Range, the only re-             the 1950s and 1960s to estimate a modern ELA of 4600–
maining glacier is the Carstensz Glacier, where Allison and          4700 m. They noted that ice loss has also accelerated in the
Kruss (1977) and Prentice et al. (2005) both estimated a mod-        Rwenzori during the study period. Less work on wpELA es-

Earth Surf. Dynam., 7, 147–169, 2019                                                     www.earth-surf-dynam.net/7/147/2019/
M. T. Cunningham et al.: Glacial limitation of tropical mountain height                                                          153

timation has been done in the Sierra Nevada de Santa Marta.        Ridge is thought to have contributed to the onset of rapid
Wood (1970) mapped glacier extent there using aerial pho-          rock uplift, the development of a bivergent wedge, and the
tographs acquired in 1969. He compared his results to the          cessation of arc volcanism in the Talamanca (Morell et al.,
mapping efforts of the 1939 Cabot Expedition (Cabot et al.,        2012). Recently, several authors have come to the conclusion
1939) and demonstrated significant ice retreat during this         that Cocos Ridge subduction initiated sometime after 3 Ma
time. No wpELA estimate was provided. Modern glaciers are          and that the extinct arc has been uplifted by a minimum of
presently less than 2 km2 in the Mérida Range (Stansell et al.,    ∼ 2 km in this time (Morell et al., 2012; Zeumann and Ham-
2007) and have been steadily shrinking throughout the 20th         pel, 2017).
century (Schubert, 1992). Stansell et al. (2007) used the ele-        Several studies have attempted to link the erosional history
vation of the 0◦ isotherm to broadly constrain the wpELA in        of the Talamanca Range to the onset of Cocos Ridge subduc-
the Mérida Range to 4470–5040 m.                                   tion (Morell et al., 2012; Zeumann and Hampel, 2017). A
                                                                   significant disequilibrium observed in Talamanca river net-
3.2     Detailed study sites
                                                                   works is thought to record a switch to an (ongoing) higher
                                                                   rate of rock uplift during the last 3 Myr. Zones of anoma-
We conducted a detailed geomorphic study of two mountain           lously low-relief topography found at moderately high eleva-
ranges: the Talamanca Range of Costa Rica and the Central          tions (between 2000 and 3000 m), which are thought to rep-
Range of Taiwan. The most recent research has converged            resent an eroded surface that has been advected to its present-
on the hypothesis that high elevations were attained in both       day elevation, have been cited as further evidence of a Plio-
ranges after a rapid Plio–Pleistocene acceleration in rock up-     Pleistocene switch in rock uplift rate (Morell et al., 2012).
lift rate (Morell et al., 2012; Zeumann and Hampel, 2017;          Importantly, this prior work has excluded glacial erosion as a
Hsu et al., 2016). This explanation leaves room for only inci-     factor in the long-term evolution of the mountain range. Our
dental glacial erosion, despite the long history of glacial geo-   work does not address the interpretation that low-relief land-
morphic study in both places (e.g., Kano, 1932, 1935; Panzer,      scapes found between 2000 and 3000 m elevation are part of
1935; Weyl, 1955). A similar case can be made for other trop-      an uplifted, eroded landscape, and neither do our results con-
ical mountain ranges, such as the Finisterre Range of Papua        tradict the claim that a major shift in the rate of rock uplift has
New Guinea, where proposed patterns of landscape evolu-            occurred recently in the Talamanca. Rather, we make a case
tion have not considered the influence of glacial erosion (Ab-     that sufficient rock mass existed above the ELA for glacia-
bott et al., 1997; Hovius et al., 1998), despite early – but not   tion to occur during LGM and possibly during cold stages
widely recognized – reports of glacial remnants there (e.g.,       prior to the LGM.
Loeffler, 1971). We ultimately narrowed our foci to the Ta-           The highest landscape of the Talamanca Range is the
lamanca Range and the Central Range – both because of the          Chirripó massif, a low-relief terrain spanning an area of
extensive prior studies of their geodynamics and glacial geo-      ∼ 75 km2 , perched above ∼ 3000 m above sea level, and
morphology and because of the apparent disconnect between          surrounded by rugged, high-relief, ridge-and-valley, flu-
these two lines of research. In the Talamanca Range, de-           vially driven topography. Glacial landforms – such as lat-
spite extensive geomorphic mapping carried out over several        eral moraines, glacially striated bedrock, rôches moutonnées,
decades (Weyl, 1955; Hastenrath, 1973; Bergoeing, 1978;            overdeepened lakes, cirques, and U-shaped valleys – were
Barquero and Ellenberg, 1986; Shimizu, 1992; Orvis and             first reported on Chirripó in the 1950s and have been stud-
Horn, 2000; Lachniet and Seltzer, 2002), the glacial chronol-      ied episodically since then (Weyl, 1955; Barquero and El-
ogy has been poorly constrained (Orvis and Horn, 2000);            lenberg, 1986; Bergoeing, 1978; Hastenrath, 1973; Shimizu,
to address this issue, we targeted Cerro Chirripó for 10 Be        1992; Lachniet and Seltzer, 2002; Orvis and Horn, 2000).
surface-exposure age dating. In contrast, the glacial chronol-     The most prominent cirques cut into the Cerro Chirripó peak,
ogy of the Central Range is reasonably well constrained by         but smaller cirques are also scattered around the massif. Lat-
such methods (Siame et al., 2007; Hebenstreit et al., 2011).       eral moraines have been mapped at elevations as low as
                                                                   ∼ 3150 m and as high as 3450 m in Valle de las Morrenas
3.2.1    Talamanca Range, Costa Rica
                                                                   and Valle Talari, and hummocky recessional moraines can
                                                                   be found on cirque floors as high as 3500 m.
The Talamanca Range is a high section of the Central Amer-            Orvis and Horn (2000) provided the first rigorous ELA es-
ican Volcanic Arc that stretches for ∼ 175 km from central         timate for maximum ice extent at Chirripó. They suggested
Costa Rica to western Panama. The range largely comprises          an ELA of ∼ 3500 m, based on standard ice surface recon-
Miocene volcanics and intermediate plutonics that intruded         struction and a combination of balance ratio (BR) and accu-
volcanic rocks around 8 Ma (Drummond et al., 1995) and             mulation area ratio (AAR) methods. This estimate corrobo-
cooled to < 65 ◦ C by 5 Ma (Morell et al., 2012). The cen-         rates earlier estimates by Weyl (1955) and Hastenrath (1973),
tral Talamanca coincides with the subduction of the aseismic       who also suggested an ELA of 3500 m based on the elevation
Cocos Ridge, one of the most striking features of the Cen-         of cirque floors. Lachniet and Seltzer (2002) independently
tral American convergent margin. Subduction of the Cocos           estimated a similar ELA using both AAR methods and the

www.earth-surf-dynam.net/7/147/2019/                                                     Earth Surf. Dynam., 7, 147–169, 2019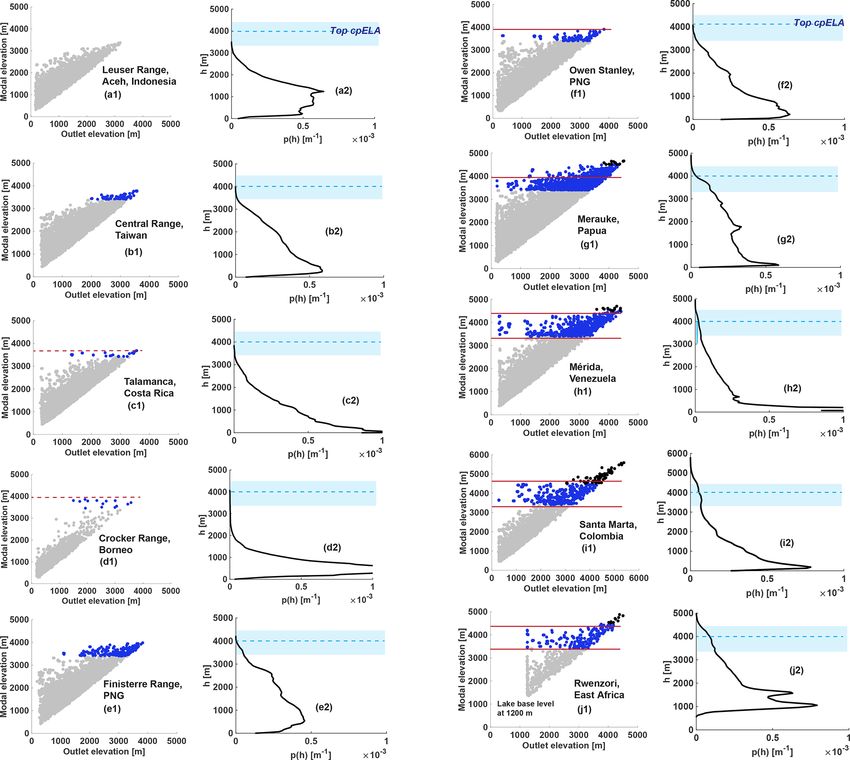
154                                                     M. T. Cunningham et al.: Glacial limitation of tropical mountain height

maximum elevation of lateral moraines. Although multiple           lated luminescence (OSL) and reported exposure ages of 14–
authors have converged on a consistent ELA estimate using a        44 ka. The timing of the local LGM is thus rather uncertain
variety of methods, the only age constraints for glacial timing    in Taiwan, and glacial ice appears to have persisted in some
available are minimum-limiting bulk 14 C dating of organic         places as late as the Holocene.
material in postglacial lakes (Orvis and Horn, 2000). Today,          ELA estimation in Taiwan has been a challenge for a num-
Costa Rica contains no glaciers, and snow has never been           ber of reasons. One reason is that fluvial erosion of glaciated
reported even at the highest elevations. Prior studies also in-    landscapes has been severe in places, which makes the max-
ferred a lack of glacial activity during the Holocene.             imum extent of glaciation in Taiwan difficult to ascertain.
                                                                   Previous work has indicated the presence of a glacial di-
3.2.2   Central Range, Taiwan
                                                                   amict at 2250 m in a valley flanking Nanhudashan, far be-
                                                                   low unambiguous glacial valleys (Hebenstreit et al., 2006).
The Central Range of Taiwan is the product of the oblique          Using the relict configuration of glaciated valleys, Heben-
collision of the Luzon Arc and Eurasia, and it is comprised        streit (2006) estimated an ELA of 3355 m at Nanhudashan,
of metamorphosed marine sediments and pre-Cenozoic base-           specifically employing the terminal-to-summit altitudinal
ment (Suppe, 1981). Due to the oblique nature of collision,        method (TSAM). Hebenstreit (2006) also used TSAM to es-
it is thought that deformation has propagated from north           timate an undated ELA of 3400 m at Yushan, a third glaciated
to south for 5–7 Ma (Byrne and Liu, 2002). The northern            massif in southwest Taiwan. Other work has used the maxi-
150 km of the Central Range have long been considered a            mum vertical extent of lateral moraines in both Xueshan (Cui
type example of a fluvially driven, steady-state mountain belt     et al., 2002) and at Yushan (Böse, 2004) to propose an ELA
(Willett and Brandon, 2002; Stolar et al., 2007). Recent work      of ∼ 3400 m.
has countered this idea by putting forth the case that a rapid
increase in exhumation rate occurred along the entire strike       4     Data
of the range starting between 1 and 2 Ma (Hsu et al., 2016).
Low-relief surfaces found at high elevations (2800–3000 m)         The principal data sets used in this study are digital topogra-
in Taiwan are thought to be remnants of an eroded surface          phy, high-resolution satellite imagery, and rock samples col-
formed sometime prior to 1–2 Ma (Ouimet et al., 2015).             lected from Cerro Chirripó for 10 Be exposure age analysis.
   Despite contemporary skepticism that glacial erosion has        All topographic analysis was performed on 1 arcsec (pro-
affected Taiwan, evidence supporting this contention has a         jected at 30 m resolution) Shuttle Radar Topography Mission
long and well-established history, with the first observations     digital topography (Farr et al., 2007). SRTM data were ac-
dating back to the early 20th century (Kano, 1932, 1935;           quired from the U.S. Geological Survey Earth Explorer web-
Panzer, 1935). Several groups have reported glacial remnants       site (available at https://earthexplorer.usgs.gov, last access:
near the highest peaks of Taiwan’s Central Range (Chu et al.,      21 November 2018). Worldview-2 imagery (50 cm resolu-
2000; Cui et al., 2002; Hebenstreit and Böse, 2003; Böse,          tion) of Cerro Chirripó, Costa Rica, taken in March 2012 was
2004; Hebenstreit, 2006; Hebenstreit et al. 2011; Ono et al.,      used to aid field mapping. Rock samples for 10 Be exposure
2005; Carcaillet et al., 2007; Siame et al., 2007) which lie       age analysis were collected at Cerro Chirripó in June 2014.
within ∼ 500 m of the estimated LGM ELA of ∼ 3400 m
(Hebenstreit et al., 2011). Glacial erosion features have been
reported in three separate massifs, including Nanhudashan          5     Methods
(also romanized as Nanhutashan; rendered as Nankotaisan
                                                                   5.1    DEM processing
in Japanese by Kano; Hebenstreit and Böse, 2003; Carcail-
let et al., 2007; Siame et al., 2007; Hebenstreit et al., 2011),   We generated a contiguous digital elevation model (DEM) of
Xueshan (also romanized as Sheshan, Hsueshan, Hsuehshan,           each tropical mountain range by mosaicking tiles of 1 arcsec
etc.; rendered as Tsugitakayama in the early literature; Cui et    SRTM digital topography. Voids were patched with a 3 arcsec
al., 2002) and Yushan (rendered in Japanese as Niitakayama         void-filled SRTM DEM. Each DEM was projected using
in the early literature; Böse, 2004; Hebenstreit, 2006). The       a local Lambert azimuthal equal-area projection. Pit filling
best preserved of these remnants are found at Nanhudashan          and drainage delineation were then performed on each DEM
and Xueshan, and include recessional moraines, polished            using the TopoToolbox (version 2.1) package in MATLAB
(striated) bedrock, erratics, and cirques (Cui et al., 2002;       (Schwanghart and Kuhn, 2010; Schwanghart and Scherler,
Hebenstreit and Böse, 2003; Hebenstreit, 2006; Hebenstreit         2014).
et al. 2011; Siame et al., 2007). Carcaillet et al. (2007),
Siame et al. (2007), and Hebenstreit et al. (2011) carried out
10 Be analysis of scoured bedrock and boulders perched on          5.2    Hypsometry
moraines at Nanhudashan and found relatively young (15–            Hypsometry refers to the frequency distribution of eleva-
9 ka) glacier retreat ages. At Xueshan, Cui et al. (2002) sam-     tion. With normalization, it becomes the probability distri-
pled moraines between 3300 and 3500 m for optically stimu-         bution of elevation (also known as the altitude–area distribu-

Earth Surf. Dynam., 7, 147–169, 2019                                                   www.earth-surf-dynam.net/7/147/2019/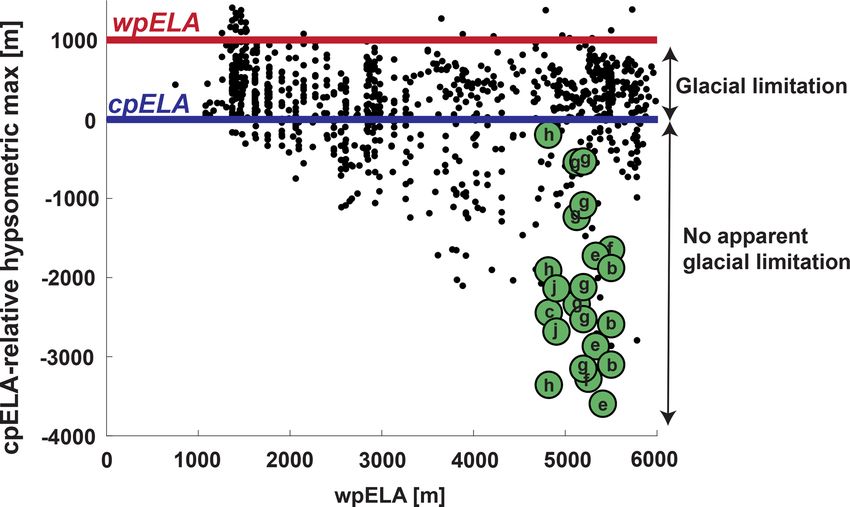
M. T. Cunningham et al.: Glacial limitation of tropical mountain height                                                    155

tion: e.g., Strahler, 1952; Mitchell and Montgomery, 2006).       catchments, hereafter referred to as “super-catchments”, de-
It has traditionally been represented as a “hypsometric inte-     lineated on the condition that they link the main divide to
gral”, which is equivalent to a cumulative distribution func-     a low-reference elevation. This method typically segments
tion (CDF) (Strahler, 1952; Montgomery et al., 2001). When        each mountain range into 30–60 super-catchments. We then
represented as a probability density function or PDF (e.g.,       do the following.
Egholm et al., 2009), it is typically computed as a histogram.
Here we instead use kernel density estimation to compute           1. Map channel network:
the elevation PDF. This standard technique in statistics takes          a. define a channel network in each super-catchment
account of sampling (counting) uncertainty and generates a                 using an arbitrary flow accumulation area threshold
smooth function that is easier to interpret. Specifically, hyp-            A_c – this thins the set of all possible flow paths;
sometry is calculated as follows:
                                                                        b. traverse downstream from each channel head i =
         1 Xn
                   h − hi
                                                                          1. . .N to the catchment exit to define a set of N
p (h) =        K            ,                              (1)             along-channel pixel chains;
        nw i=1       w
                                                                        c. extend each chain i upstream from its channel head
where the frequency distribution of elevation h is estimated               to the drainage divide by following the path of
by summing component smoothing functions of form K                         greatest flow accumulation area, ensuring that each
(here a Gaussian) and bandwidth w (a function of the sample                pixel chain spans the full range of elevation from
standard deviation) centered at sample elevations hi .                     ridge to exit.
                                                                   2. Map PH along the network (Fig. 4):
5.2.1   Range-scale hypsometry
                                                                        a. traverse each chain i upstream from the exit (shared
Hypsometry has been a popular but rather blunt instrument                  by all chains);
for assessing the influence of glacial erosion on landscapes.
The advent of SRTM digital topography, first at 3 arcsec and            b. map along each chain a nested series of subcatch-
then at 1 arcsec resolution, has facilitated the global deploy-            ments, one at every channel pixel j (i);
ment of hypsometry; it has also entailed the need to set a              c. for each nested subcatchment, estimate its elevation
meaningful scale at which to segment the data. One approach                PDF, its modal elevation h_mode_j (where the PDF
(Egholm et al., 2009) is to compute the elevation distribution             peaks), and its outlet elevation h_out_j;
for each 1◦ × 1◦ tile, which has the advantages of simplic-             d. record as a set of i = 1. . .N sequences of
ity and objectivity. It has the disadvantage that tile bound-              [h_out_j(i),h_mode_j(i)] pairs.
aries often segment mountain ranges across major drainage
divides, which sometimes results in spurious hypsometric           3. Identify all PH “benches”, characteristic nested-
maxima. To address this problem, we clipped the DEM of                catchment modal elevations (Fig. 5):
each mountain range by manually tracing a bounding poly-
gon along each range front, ensuring that both flanks of each           a. perform change-point detection along each chain
range were included in the domain of analysis (Fig. 3), and                i = 1. . .N to locate and define large jumps in
calculated the hypsometry of each.                                         h_mode at each h_out;
                                                                        b. define the outlet elevation h_out at each jump as
5.2.2   Progressive hypsometry
                                                                           h_change;
                                                                        c. designate the groups of between-jump modal eleva-
We designed an algorithm that concisely describes how hyp-                 tions {h_mode} as benches;
sometry varies with the scale of analysis. The development
of this algorithm was motivated by the observation that the             d. define each bench modal elevation h_bench =
hypsometric maximum of large regions can shift by several                  min{h_mode};
kilometers depending on the boundaries of analysis. The al-             e. record as a set of i = 1. . .N sequences (one per
gorithm, which we term “progressive hypsometry” (PH), in-                  chain) of [h_change_k(i),h_bench_k(i)] pairs, each
volves the measurement of hypsometric maxima in nested                     of length k(i) = 1. . .n(i);
catchments whose outlets span from the lowest to the high-              f. concatenate     all    N          sequences       of
est elevations in a mountain range. Progressive hypsometry                 [h_change_k(i),h_bench_k(i)].
consists of three major components: (i) segmentation of the
landscape into large catchments; (ii) calculation of hypsome-     We performed progressive hypsometry on the 10 selected
try along flow paths; (iii) segmentation into nested subcatch-    mountain belts, using a low-elevation reference level of 150–
ments characterized by a shared modal elevation. We first         250 m in each mountain range. This reference elevation fo-
segment the targeted mountain range into large (∼ 1000 km2 )      cuses the analysis just above large depositional plains, which

www.earth-surf-dynam.net/7/147/2019/                                                  Earth Surf. Dynam., 7, 147–169, 2019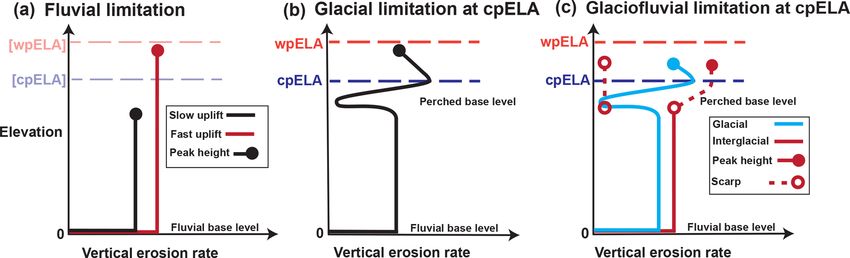
156 M. T. Cunningham et al.: Glacial limitation of tropical mountain height
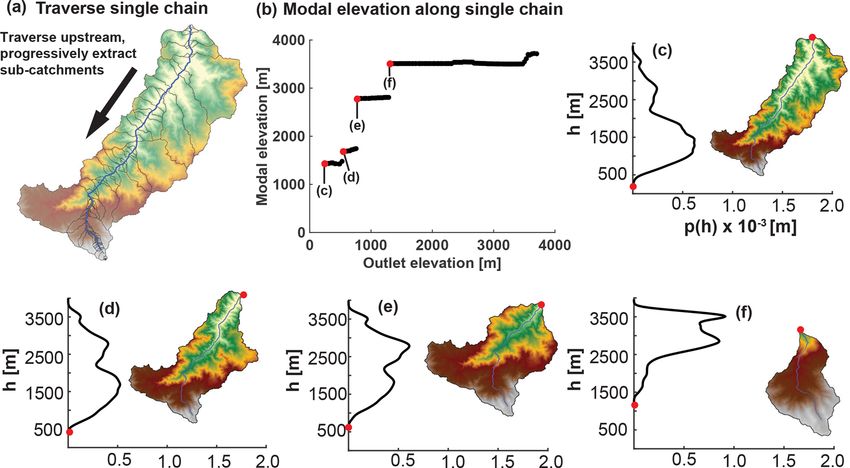
Figure 4. Progressive hypsometry in detail. (a) DEM of one super-catchment from the Talamanca Range. Elevation 0–4000 m is yellow
through white. The dark blue streamline is an example of one chain along which progressive hypsometry is performed. The bounds of each
progressively delineated catchment are drawn in black. (b) Modal elevation (hypsometric maximum) of catchments draining to progressively
higher outlet elevations along dark blue streamline in panel (a). Each subcatchment in panel (a) is represented in panel (b). The stepped
pattern in catchment modal elevation is commonly observed in all landscapes. (c–f) Elevation PDF and DEM of catchments at each jump
in modal elevation in panel (b). Red dots indicate the catchment outlet on both the PDF and DEM and are also represented as red dots in
panel (b).
improves the efficiency of the algorithm. The Rwenzori are air photographs and were confirmed in the field. There have
an exception, since they are more than 1000 km from the been no direct measurements of erosion rate in these flu-
nearest coast and rise sharply above lowlands with several vial catchments, but it is thought that a fluvial erosion rate
large lakes at 1200 m. We used a low-elevation reference of ∼ 1 mm yr−1 has been sustained in parts of Costa Rica
level of 1200 m for the Rwenzori. for > 2 Myr (Morrell et al., 2012). The boundary between
the fluvial and glacial domain in these landscapes usually
5.3 Focus sites gives rise to an erosion front: that is, a pronounced topo-
graphic break between the slowly eroding, relatively low-
5.3.1 Assessment of glacial and postglacial morphology sloping glacial valleys and steep, quickly eroding fluvial val-
We compiled observations made during field campaigns leys. We mapped in detail the erosion fronts in both places.
at Cerro Chirripó (in 2014, 2016) and Nanhudashan (in This mapping was guided by sharp changes in slope as well
2015), satellite/aerial imagery, and maps produced by pre- as by the abrupt disappearance of glacial deposits and the
vious workers to map glacial landforms and estimate maxi- transition to non-glaciated bedrock cliff faces (Fig. 6). Delin-
mum ice extent in both the Talamanca Range and the Central eation of erosion fronts was qualitative and subjective, since
Range. Glacial landscapes are only present at Cerro Chirripó no objective metrics are available for distinguishing perched
in the Talamanca Range; in Taiwan, glacial remnants are glaciated valleys from headward-propagating fluvial valleys.
best preserved at Nanhudashan: we focused on these two Fluvially based metrics such as normalized channel steep-
massifs. We also selected glaciated catchments to compare ness are not particularly useful for our purposes, since the
glacial geomorphic mapping with detailed hypsometric anal- effects of significant glaciation have altered the landscape be-
ysis. Glacial advances at both focus sites terminated near yond any meaningful application of these metrics.
3000 m, so for ease of comparison all glaciated catchments To guide our qualitative assessment, we developed a set
were extracted and delineated (in a GIS) using a common of rules. First, we used a binary slope map (with a thresh-
3000 m outlet elevation. old of 35◦ ) to identify places where low-sloping glacial val-
Glacial valleys at Chirripó generally have a much lower ley floors made a hard transition to a fluvially linked escarp-
gradient than the fluvial valleys flanking them, and the very ment. Where these escarpments where linked to amphitheater
presence of well-preserved glacial landforms, such as sharp- heads, we mapped the entire amphitheater head; the initial
crested moraines, together with the apparent absence of roughness of erosion front boundaries was thus set by the
Holocene landsliding, indicates that postglacial erosion has 30 m resolution DEM and not by the sub-meter-resolution
been slow in these glaciated zones. In contrast, signs of rel- imagery. Next, we used the imagery to check that all mapped
atively fast erosion, such as frequent landsliding, are appar- erosion fronts coincided with the disappearance of glacial
ent in the surrounding fluvial valleys in satellite imagery and features or with clear signs of ongoing erosion such as mul-
Earth Surf. Dynam., 7, 147–169, 2019 www.earth-surf-dynam.net/7/147/2019/M. T. Cunningham et al.: Glacial limitation of tropical mountain height 157
Figure 5. Mapping single progressive hypsometry chains on the mountain range scale. (a) Same as Fig. 4b. Modal elevation is calculated for
subcatchments progressively extracted along single chain. (b) On the scale of a super-catchment (e.g., Fig. 4a), jumps in modal elevation for
each chain are plotted corresponding to the outlet elevation at which the jump occurs (h_change). Red points are the same as panel (a) and
correspond to catchments in Fig. 4c–f. (c) Same as panel (b), except for all chains in entire mountain range (Talamanca Range, Costa Rica).
tiple, recent landslide scars. Finally, we excluded mapped
zones that appear to be related to isolated events, such as
single landslide scars that are not unambiguously linked to
the ongoing propagation of the fluvial network into glaciated
terrain.
To quantitatively describe the pattern of fluvial scarp en-
croachment into glaciated terrain, we define two new met-
rics. The first, which we term the ELA-relative modal ele-
vation (ERME), measures the difference between hypsomet-
ric maxima of glaciated catchments and the estimated LGM
ELA. At both Cerro Chirripó and Nanhudashan, this met-
ric is calculated using the local estimate of the LGM ELA.
Both massifs are small enough that large climatic gradients
are not likely to drive substantial differences in the position
of the ELA, as has been documented in much larger tropical
mountain ranges (Prentice et al., 2005; Stansell et al., 2007).
We hypothesized that the duration and intensity of glacial
erosion in all glaciated catchments was similar during the
LGM and that glacial erosion would thus leave a character-
istic modal elevation at the ELA in all glaciated catchments.
We further hypothesized that fluvial scarp encroachment of
glaciated terrain would bias hypsometric maxima at the ELA
to higher elevations.
The second metric, which we call the scarp encroachment Figure 6. Scarp encroachment ratio (SER) calculation. (a) Aerial
ratio (SER), is an approximation of the headward distance image of Valle de los Lagos, Chirripó, Costa Rica. Mapped escarp-
traveled by the fluvial escarpment into each glaciated catch- ment in white. Boundary of catchment draining to 3000 m outlet in
ment (Fig. 6). This distance is expressed as a ratio of scarp- black. (b) Mapped LGM ice extent in light blue draped over DEM
affected terrain to all terrain in glaciated catchments. In each of Valle de los Lagos (same bounds as in panel a). Length scales
glaciated catchment, we found the area below and above the Lc and Lg correspond to area below and above escarpment, respec-
escarpment, Ac and Ag , respectively, and calculated a corre- tively. SER calculation is presented in Eq. (2). (c–f) Field photos of
sponding length scale for each: Lc and Lg . SER is the relative mapped escarpment. Blue and red zones in panels (d) and (f) corre-
spond to glaciated zone and escarpment. White line is the same as
length scale:
in panels (a)–(b). (e) Vantage point for panels (c) and (d) labeled
Lc with red arrow.
SER = . (2)
Lc + Lg
At its core, SER is a quantification of the qualitative observa- since glacial erosion converges towards zero near this eleva-
tion that fluvial erosion encroaches (destroys) glaciated ter- tion and simultaneously blocks fluvial incision. To measure
rain. At peak glacial conditions, both glacial and fluvial ero- the elevation gain of the postglacial scarp, we assume that
sion would have been ineffective near the glacial terminus, each scarp originated near the LGM glacial terminus. We
www.earth-surf-dynam.net/7/147/2019/ Earth Surf. Dynam., 7, 147–169, 2019158 M. T. Cunningham et al.: Glacial limitation of tropical mountain height
thus choose to compare SER in glaciated catchments above
the 3000 m benchmark.
5.3.2 Surface-exposure age dating of deglaciation
Six samples were collected for 10 Be exposure dating from
boulders embedded in both lateral and frontal recessional
moraines at 3400–3500 m elevation in Valle de las Mor-
renas and Valle Talari, two samples from scoured bedrock
within ∼ 15 m of the Chirripó summit, and one sample from
a landslide boulder sourced from a cirque headwall (Fig. 7).
Processing at Lamont-Doherty Earth Observatory and mea-
surement at Lawrence Livermore National Laboratory fol-
lowed standard procedures (e.g., Schaefer et al., 2009), and
10 Be ages were calculated with the CRONUS-Earth online
calculator (Balco et al., 2008) v.2.2, using a low-latitude,
high-elevation production rate obtained in Peru by Kelly et Figure 7. 10 Be sample locations for Cerro Chirripó. (a–e) Boulders
al. (2013) and the scaling scheme (St) of Lal (1991) and (diorite) perched on recessional moraines in Valle de las Morrenas.
Stone (2000) (Tables S1 and S2 in the Supplement). (f) Boulder (andesite with quartz veins) perched on lateral moraine
in Valle Talari. (g) Postglacial landslide boulder. (h–i) Scoured
bedrock along divide separating Valle de las Morrenas from Valle
6 Results de los Lagos.
6.1 Range-scale hypsometry
In Fig. 8a2–j2 we compare the range-scale hypsometry of with a modal elevation within the bounds of the cpELA are
each of the selected mountain ranges to the tropics-wide only found above ∼ 2000 m. Only the Leuser Range shows
cpELA band at 3400–4000 m. Most of the selected ranges no apparent signs of glacial action.
show that the fractional area occupied by each elevation band These results stand in contrast to range-scale hypsome-
decreases steadily with increasing altitude, although in some try, which indicates minor glacial influence across all of the
cases, such as the Finisterre Range (Fig. 8e2), topographic selected mountain ranges. Progressive hypsometry instead
plateaus are evident at high elevations and are recorded as highlights variability in the prevalence of glaciated terrain
secondary hypsometric maxima. In some cases, the highest and points to glacial erosion having had an influence in most
elevations fall within the bounds of the tropical cpELA, and of these mountain ranges and a particularly significant role in
in other cases peaks extend far above it, but none of these some. Our two focus sites in Costa Rica and Taiwan are ex-
mountain ranges has a significant hypsometric maximum at amples of the former – where glacial erosion has apparently
or above the cpELA. In other words, each range was high had only a marginal influence.
enough for cold-phase glacial erosion (with the exception
of the Leuser Range), and yet the extent and prevalence of
glaciated landscapes in all of them appears small relative to 6.3 Focus site no. 1: Cerro Chirripó, Talamanca Range,
the size of fluvial landscapes. Costa Rica
6.2 Progressive hypsometry
Classic examples of glacial landforms are found at Cerro
Chirripó (Fig. 9). Several valleys host kilometer-scale lateral
Nine of the 10 selected mountain ranges have catchments moraines, and most valleys are blanketed by glacial till and
with a PH modal elevation at the cpELA, which we consider recessional moraines. Striated and scoured bedrock is preva-
a record of those catchments having established a perched lent in the paleo-accumulation zone in the major valleys em-
glacial base level (Fig. 8b1–j1). Variability in glacial influ- anating from the Chirripó peak. Most glaciated catchments at
ence between each range is best assessed on the basis of Chirripó have a modal elevation within several meters of the
paired outlet and modal elevations. For example, catchments estimated local LGM ELA of 3500 m (Fig. 11c). Two high
in some ranges have an outlet elevation as low as 150 m and catchments have a modal elevation that is somewhat higher
a modal elevation between the cpELA and wpELA. In these than the local ELA. An important feature is that these catch-
mountain ranges, the progressive hypsometry of the largest ments appear to be heavily modified by scarp encroachment,
catchments is thus dominated by glacial erosion. In Fig. 8f1– which leads us to infer that fluvial scarp encroachment has
j1, these large catchments are represented by a left spread erased the lower portion of their glacially eroded topogra-
of points within the ELA band. In other ranges, catchments phy and has biased their hypsometric maxima to higher el-
Earth Surf. Dynam., 7, 147–169, 2019 www.earth-surf-dynam.net/7/147/2019/You can also read