Using flow cytometry and light-induced fluorescence to characterize the variability and characteristics of bioaerosols in springtime in Metro ...
←
→
Page content transcription
If your browser does not render page correctly, please read the page content below
Atmos. Chem. Phys., 20, 1817–1838, 2020
https://doi.org/10.5194/acp-20-1817-2020
© Author(s) 2020. This work is distributed under
the Creative Commons Attribution 4.0 License.

Using flow cytometry and light-induced fluorescence to characterize
the variability and characteristics of bioaerosols in springtime in
Metro Atlanta, Georgia
Arnaldo Negron1,2 , Natasha DeLeon-Rodriguez3,a , Samantha M. Waters1,b , Luke D. Ziemba4 , Bruce Anderson4 ,
Michael Bergin5 , Konstantinos T. Konstantinidis6,3 , and Athanasios Nenes1,7,8
1 School  of Earth and Atmospheric Sciences, Georgia Institute of Technology, Atlanta, GA 30332, USA
2 School  of Chemical and Biomolecular Engineering, Georgia Institute of Technology, Atlanta, GA 30332, USA
3 School of Biology, Georgia Institute of Technology, Atlanta, GA 30332, USA
4 School of Biological Sciences, Chemistry and Dynamics Branch/Science Directorate, National Aeronautics and Space

Administration Langley Research Center, Hampton, VA 23681, USA
5 Department of Civil and Environmental Engineering, Duke University, Durham, NC 2770, USA
6 School of Civil and Environmental Engineering, Georgia Institute of Technology, Atlanta, GA 30332, USA
7 Institute for Chemical Engineering Science, Foundation for Research and Technology Hellas, Patra, 26504, Greece
8 Laboratory of Atmospheric Processes and their Impacts (LAPI), School of Architecture, Civil & Environmental Engineering,

Ecole Polytechnique Fédérale de Lausanne, Lausanne, 1015, Switzerland
a currently at: Puerto Rico Science, Technology and Research Trust, Rio Piedras, 00927, Puerto Rico
b currently at: Department of Marine Sciences, University of Georgia, Athens, GA 30602-3636, USA

Correspondence: Konstantinos T. Konstantinidis (kostas.konstantinidis@gatech.edu)
and Athanasios Nenes (athanasios.nenes@epfl.ch)

Received: 9 October 2018 – Discussion started: 30 October 2018
Revised: 12 September 2019 – Accepted: 22 September 2019 – Published: 14 February 2020

Abstract. The abundance and speciation of primary biolog-       HNA dominated the PBAP during humid days and follow-
ical aerosol particles (PBAP) is important for understanding    ing rain events, where HNA comprised up to 92 % of the
their impacts on human health, cloud formation, and ecosys-     PBAP number. Concurrent measurements with a Wideband
tems. Towards this, we have developed a protocol for quan-      Integrated Bioaerosol Sensor (WIBS-4A) showed that fluo-
tifying PBAP collected from large volumes of air with a         rescent biological aerosol particles (FBAP) and total FCM
portable wet-walled cyclone bioaerosol sampler. A flow cy-      counts are similar; HNA (from FCM) moderately correlated
tometry (FCM) protocol was then developed to quantify and       with ABC-type FBAP concentrations throughout the sam-
characterize the PBAP populations from the sampler, which       pling period (and for the same particle size range, 1–5 µm
were confirmed against epifluorescence microscopy. The          diameter). However, the FCM LNA-AT population, possibly
sampling system and FCM analysis were used to study PBAP        containing bacterial cells, did not correlate with any FBAP
in Atlanta, GA, over a 2-month period and showed clearly        type. The lack of correlation of any WIBS FBAP type with
defined populations of nucleic-acid-containing particles: low   the LNA-AT suggests that airborne bacterial cells may be
nucleic acid-content particles above threshold (LNA-AT) and     more difficult to unambiguously detect with autofluorescence
high nucleic acid-content particles (HNA) likely containing     than currently thought. Identification of bacterial cells even
wet-ejected fungal spores and pollen. We find that the daily-   in the FCM (LNA-AT population) is challenging, given that
average springtime PBAP concentration (1 to 5 µm diameter)      the fluorescence level of stained cells at times may be com-
ranged between 1.4 × 10⁴ and 1.1 × 10⁵ m−3 . The LNA-AT         parable to that seen from abiotic particles. HNA and ABC
population dominated PBAP during dry days (72 ± 18 %);          displayed the highest concentration on a humid and warm

Published by Copernicus Publications on behalf of the European Geosciences Union.
1818                                                      A. Negron et al.: Characterization of bioaerosols in Metro Atlanta

day after a rain event (14 April 2015), suggesting that both       molecules (e.g., DNA/RNA) which subsequently fluoresce
populations correspond to wet-ejected fungal spores. Over-         when excited by the FCM lasers. The resulting scattering and
all, information from both instruments combined reveals a          fluorescent light emissions are then detected by an array of
highly dynamic airborne bioaerosol community over Atlanta,         sensors to allow the differentiation of biological and abiotic
with a considerable presence of fungal spores during humid         (e.g., dust) particles according to the characteristic specific
days and an LNA-AT population dominating the bioaerosol            to the stain used. FCM has proven to be as reliable as EPM,
community during dry days.                                         but with the advantage of lower uncertainty, higher quantifi-
                                                                   cation efficiency, and requiring considerably less time and
                                                                   effort than EPM per sample (Lange et al., 1997). FCM is
                                                                   frequently used in biomedical research to quantify eukary-
1   Introduction                                                   otic cell populations and in microbiology to quantify a wide
                                                                   variety of yeast and bacterial cells (Nir et al., 1990; Van
Primary biological aerosol particles (PBAP), also called           Dilla et al., 1983). FCM is also used to study environmental
bioaerosols, are comprised of airborne microbial cells (e.g.,      samples, e.g., to differentiate low nucleic acid (LNA) from
bacteria, diatoms), reproductive entities (e.g., pollen, fun-      high nucleic acid (HNA) phytoplankton in aquatic environ-
gal spores), viruses, and biological fragments. Bioaerosols        ments (Y. Wang et al., 2010; Müller and Nebe-von-Caron,
are ubiquitous, with potentially important impacts on human        2010). Despite its advantages, FCM has seen little use in the
health, cloud formation, precipitation, and biogeochemical         bioaerosol field to date, owing in part to the challenges asso-
cycles (Pöschl, 2005; Hoose et al., 2010; DeLeon-Rodriguez         ciated with collecting sufficient PBAP mass for robust count-
et al., 2013; Morris et al., 2014; Longo et al., 2014; Fröhlich-   ing statistics to be obtained (Chen and Li, 2005; Liang et al.,
Nowoisky et al., 2016; Myriokefalitakis et al., 2016). Despite     2013). Chen and Li (2005) determined that, for counting pur-
their low number concentration relative to abiotic particles,      poses, the SYTO-13 nucleic acid stain is the most effective
PBAP possess unique functional and compositional charac-           (among five different nucleic acid stains studied) for deter-
teristics that differentiate them from abiotic aerosol. For ex-    mining reliable concentration of bioaerosols.
ample, certain PBAP constitute the most efficient of atmo-            Light-induced fluorescence (LIF) is an increasingly uti-
spheric ice nucleators, affecting the microphysics of mixed        lized technique for bioaerosol quantification, and it relies
phase clouds and precipitation (Hoose and Möhler, 2012;            on measuring the autofluorescence intensity of specific high-
Sullivan et al., 2018). The mass and nutrient content of PBAP      yield fluorophores (e.g., nicotinamide adenine dinucleotide
may suffice to comprise an important supply of bioavailable        – NADH co-enzyme – flavins, and amino acids like trypto-
phosphorous to oligotrophic marine ecosystems (Longo et            phan and tyrosine) present in PBAP. The major advantage of
al., 2014; Myriokefalitakis et al., 2016). In addition, the con-   the technique is that it is fully automated, does not require a
currence of disease outbreaks during dust storms has been at-      liquid suspension (i.e., it directly senses particles suspended
tributed to pathogenic microbes attached to airborne dust that     in air), and provides high-frequency measurements (∼ 1 Hz),
are subsequently inhaled (Griffin et al., 2003; Ortiz-Martínez     making it ideal for continuous monitoring and operation in
et al., 2015; Goudie, 2014).                                       highly variable environments (e.g., aircraft operation). Par-
   Quantification of the concentration and size of PBAP is         ticles detected by LIF, called fluorescent biological aerosol
critical for understanding their environmental impacts. Mea-       particles (FBAP), although not equal to PBAP, may still con-
suring PBAP however poses a challenge for established mi-          stitute a large fraction of the biological particles (Healy et
crobiology tools, owing to their low atmospheric concentra-        al., 2014; Gosselin et al., 2016). Using LIF, FBAP diurnal
tion (103 –106 cells m−3 air; Fröhlich-Nowoisky et al., 2016)      cycles showing maximum concentrations during evenings
and wide diversity of airborne particle types and sizes. For in-   and minima around middays, especially in heavily vege-
stance, only a fraction of microorganisms (an estimated 5 %;       tated environments, have been observed. This behavior has
Chi and Li, 2007) can be cultured, and cultivation cannot          been related to known temperature and relative humidity re-
be used to quantify dead organisms, viruses, or fragments,         lease mechanisms of certain fungal spore species (Wu et
while most culture-independent methods are optimized for           al., 2007; Gabey et al., 2010; Tropak and Schnaiter, 2013).
more abundant microbial populations. Epifluorescence mi-           Huffman et al. (2010) used a Ultraviolet-Aerodynamic Par-
croscopy (EPM) is the standard for bioaerosol quantification,      ticle Sizer (UV-APS) to show that the concentration and fre-
but is not high throughput and requires considerable time for      quency of occurrence of 3 µm FBAP particles at Mainz, Ger-
quantification of a concentration per sample. Flow cytome-         many (semi-urban environment), exhibited a strong diurnal
try (FCM) is an analysis technique based on the concurrent         cycle from August through November, with a first peak at
measurement of light scattering and fluorescence intensity         mid-morning (06:00–08:00; ∼ 1.6 × 10⁴ m−3 ) followed by
from single particles (Wang et al., 2010). FCM requires a          a constant profile (∼ 2–4 × 10⁴ m3 ) throughout the rest of
liquid suspension of bioparticles that flows through an opti-      the day. Similar studies in urban and densely vegetated en-
cal cell and is interrogated with a series of laser beams. Each    vironments suggest a notable difference in the size distri-
sample is pretreated with stains that target specific macro-       butions, diurnal behavior, and FBAP loading between the

Atmos. Chem. Phys., 20, 1817–1838, 2020                                             www.atmos-chem-phys.net/20/1817/2020/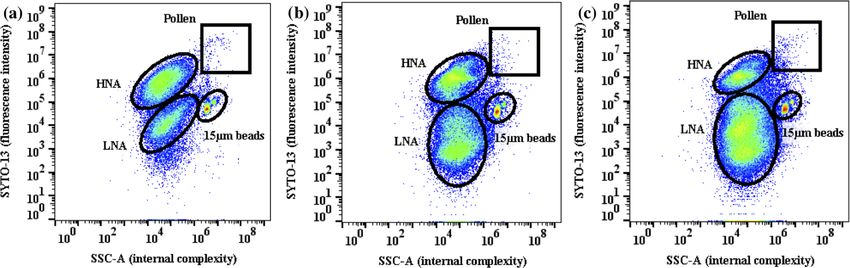
A. Negron et al.: Characterization of bioaerosols in Metro Atlanta                                                         1819

two environments. Gabey et al. (2011) found that the FBAP         than non-biologicals in the LIF detection range, interfer-
in Manchester, UK, follow a characteristic bimodal distri-        ences from non-biological compounds (e.g., polycyclic aro-
bution with peaks at 1.2 and 1.5–3.0 µm. As in Mainz, the         matic hydrocarbons, and soot) from combustion emissions
concentration of larger particles peaks in the mid-morning        can influence LIF detection (Pöhlker et al., 2012). Consid-
and ranges from 0 to 300 L−1 , and the 1.2 µm peak is linked      erable work remains on determining which detector(s) or
to traffic activity. However, at the Borneo tropical rainforest   combination thereof provides an unambiguous identification
FBAP concentrations peak during the evening with a robust         of bioaerosols and related subgroups (e.g., bacteria, fungal
2–3 µm population and concentrations ranging from 100 to          spores, pollen). Towards this, an aerobiology catalog of pure
2000 L−1 (Gabey et al., 2010).                                    cultures has been developed for the WIBS-4, showing that
   LIF-based observations (e.g., UV-APS, WIBS), combined          instrument-to-instrument variability in fluorescence detec-
with measurements of molecular tracers (e.g., mannitol and        tion poses a considerable challenge, as applying common de-
arabitol) and endotoxin measurements, provide a more com-         tection thresholds across instruments leads to considerable
plete picture of PBAP emissions. Gosselin et al. (2016) ap-       differences in PBAP concentration and composition (Her-
plied this approach during the BEACHON-RoMBAS field               nandez et al., 2016).
campaign. A clear correlation between FBAP and the molec-            Another important issue for LIF-based quantification of
ular markers is seen, indicating an increase in fungal spores     PBAP is the impact of atmospheric oxidants, UV, and other
during rain events. FBAP concentrations and molecular             stressors on the fluorescence intensity of PBAP. Pan et
marker-inferred (arabitol and mannitol; Bauer et al., 2008a       al. (2014) tested the effect of relative humidity and ozone ex-
approach) fungal spore concentrations were within the same        posure on the autofluorescence spectra of octapeptide aerosol
order of magnitude. The WIBS-3 cluster (determined using          particles using an UV-APS connected to a rotating drum. Oc-
Crawford et al., 2015) linked to fungal spores gave con-          tapeptides, organic molecules containing eight amino acids
centrations 13 % lower than those derived from molecular          and present in cells, were used as a proxy to study the ag-
marker concentrations during rain events. During dry events,      ing of tryptophan, and results suggest that bioaerosol ex-
FBAP and molecular marker-derived fungal spore concentra-         posure to high but atmospherically relevant levels of ozone
tions were poorly correlated. The degree to which all types of    (∼ 150 ppb) decreases tryptophan fluorescence intensity and
PBAP are consistently detected by LIF over different times        PBAP detection. Multiple stressors can affect bioaerosol LIF
of the year and different environments is currently unknown;      detection, so such issues need to be thoroughly explored to
it is likely, however, that for certain classes of bioparticles   understand PBAP detection efficiency over the wide range of
(e.g., pollen and fungi) the detection efficiency using LIF is    atmospheric conditions and PBAP population composition
relatively high. However, the low intrinsic fluorescence in-      (Tropak and Schnaiter, 2013; Hernandez et al., 2016).
tensity of bacteria and high variability thereof in relation to      The aims of the study are to (i) develop an effective
metabolic state may lead to their misclassification as non-       and reliable FCM detection and quantification protocol for
biological particles (Hernandez et al., 2016).                    bioaerosol; (ii) apply the protocol to understand bioaerosol
   For LIF-based quantification of PBAP to be effective, it       populations and their variability during different meteorolog-
requires the intrinsic fluorescence of biological material to     ical conditions; and (iii) compare FCM and WIBS-4A results
exceed that of non-biological matter. Depending on the type,      to have a better understanding of PBAP day-to-day variabil-
metabolic state, and species, PBAP autofluorescence may           ity. To our knowledge, this study is the first to develop a
vary by orders of magnitude, and therefore LIF may not            FCM protocol to identify and quantify well-defined speciated
always be able to differentiate between biological and abi-       bioaerosol populations from samples collected from a mod-
otic particles. For example, Tropak and Schnaiter (2013)          ified state-of-the-art biosampler. LIF sampling of bioaerosol
showed that laboratory-generated mineral dust, soot, and am-      side by side with established and quantitative biology tools
monium sulfate may be misclassified as FBAP. To address           (FCM and EPM) was conducted to assess the LIF detection
misclassification, excitation emission matrices (EEMs) have       capabilities toward different bioaerosol populations and un-
been developed for biomolecules (e.g., tryptophan, tyro-          der atmospherically relevant conditions during this study. At-
sine, riboflavin) and non-biological molecules (e.g., pyrene,     lanta is selected as a case study for PBAP sampling, as it pro-
naphthalene, humic acid). EEMs provide the wavelength-            vides a highly populated urban environment surrounded by
dependent fluorescence emission spectra as a function of          vast vegetative areas; this and the broad range of temperature
the excitation wavelength and are used to assign spectral         and humidity ensure a wide range of PBAP population com-
modes to known fluorophores. The structure of EEMs is im-         position, state, and concentrations. All the samples collected
portant for identifying molecules that are unique to PBAP         are compared side by side to concurrent WIBS-4A data col-
and allows their identification by LIF; it is this principle      lected over the same time period.
upon which detectors in commercial FBAP measurements
(e.g., WIBS, UV-APS) are based. Comparison of EEMs from
biological and non-biological molecules shows that even
when biomolecules have higher autofluorescence intensity

www.atmos-chem-phys.net/20/1817/2020/                                              Atmos. Chem. Phys., 20, 1817–1838, 2020
1820 A. Negron et al.: Characterization of bioaerosols in Metro Atlanta
2 Instrumentation and methodology cleaned with ethanol 70 wt %. Then, the instrument inlet
and outlet and the inside of the collector/concentrator were
2.1 Bioaerosol sampler cleaned with ethanol 70 wt %. In the second phase, the Spin-
Con II inlet was connected to a HEPA filter to provide a
Sampling was performed using the SpinCon II (InnovaPrep particle-free source of air to the sampling system; the in-
LLC, Inc.) portable wet-walled cyclone aerosol sampler. strument was then washed with ethanol 70 wt %, 10 wt %
Aerosol is collected by inertial impaction with a recirculat- bleach solution, PBS, and Milli-Q H2 O, respectively. The
ing liquid film in the cyclone; evaporative losses are com- wash consisted of a rinse, a 2 min sample, and filling the
pensated so that the sample volume is kept constant during instrument collector/concentrator with the fluid in use (i.e.,
a sample cycle. The particle collection efficiency for 1, 3, bleach solution, ethanol, PBS, and Milli-Q H2 O). The col-
3.5, and 5.0 µm particles is about 47.3 ± 2.1 %, 56.1 ± 3.9 %, lector/concentrator was drained after 1 min. The above steps
14.6 ± 0.6 %, and 13.8 ± 2.2 %, respectively (Kesavan and were repeated for the remaining fluids, taking 5 min per fluid.
Sagripanti, 2015). However, the experiments conducted us- Overall, the CP requires 45 min; upon completion, a blank is
ing 1 and 3 µm polystyrene latex (PSL) beads, 3.5 µm oleic obtained to constrain the residual contamination levels af-
acid and 5.0 µm oleic acid particles do not necessarily quan- ter cleaning (described below). Finally, the HEPA filter was
tify the collection efficiency of biological particles in this disconnected, instrument inlets and outlets were sealed, and
size range. Even with a lower collection efficiency than any the inlet tube was cleaned with ethanol 70 wt % to be ready
impingement sampler, SpinCon effectively collects larger for rooftop sampling. SpinCon II was rinsed with ethanol
amounts of biological particles owing to its high volumet- 70 wt % after each sampling episode and the cleaning pro-
ric flow rate, which is a considerable advantage (Kesavan tocol was applied before each sample.
and Sagripanti, 2015). However, the stress caused by the Several blanks were obtained to quantify the levels of
high flow rate of the SpinCon may affect cell viability. Šantl- PBAP contamination in the fluids and sampler and to ensure
Temkiv et al. (2017) recently studied the SpinCon retention that they were sufficiently low to not bias the detection, iden-
efficiency from seawater samples and for P. agglomerans tification, and quantification of the PBAP. Furthermore, an
populations from pure cultures (∼ 105 cells mL−1 ). After 1 h instrument blank was obtained after a CP to constrain resid-
of sampling, the SpinCon was found to retain 20.6 ± 5.8 % ual particles, by running the sampler for 2 min, while sam-
of the P. agglomerans concentration and 55.3 ± 2.1 % of the pling air with a HEPA filter connected to the inlet of the
seawater microbial concentration. SpinCon II. Another blank was collected to characterize any
In our study, the biosampler was run at 478 L min−1 for 4 h contamination of biological particles from the supply of PBS
sampling cycles. Phosphate-buffered saline (PBS) 1X pH 7.4 and water in the SpinCon II. This was done by operating the
solution was used and the instrument compensated for water SpinCon II for a 4 h period with a HEPA filter connected to
evaporation by supplying Milli-Q water to keep the PBS con- the inlet which completely cleans the air entering the wet
centration constant. Upon termination of each sampling cy- cyclone from any bioparticles. All blanks were analyzed di-
cle, the instrument was programmed to dispense the sample rectly via FCM (Sect. 2.3) and EPM.
in a 15 mL centrifuge tube. Then, 10 µL of formalin (37 wt % The volumetric flow rate within the SpinCon II was rou-
formaldehyde) per mL of solution was added to every sam- tinely calibrated by a VT100 Hotwire Thermo-anemometer
ple for preservation, and samples were stored at 4 ◦ C. Given (Cole Palmer Inc.) using a three-hole round duct transverse
the long sampling times and the low concentration of PBAP, approach. A 1 1/4 in. OD tube with the same diameter as the
the fluid supply system of the instrument was modified, and SpinCon II inlet was designed with three holes. Each hole
a cleaning protocol (CP) has been developed which is de- was 60◦ apart from the other and the holes were perpendic-
scribed below. ular to the axial air flow direction of the tube (Supplement,
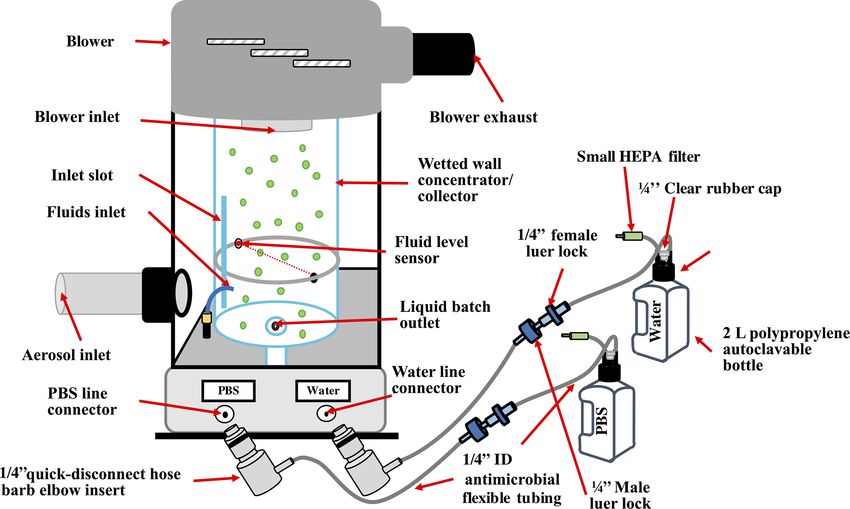
The SpinCon II water and PBS supply bags used in Fig. S1). Triplicates of flow rate measurements were taken in
the commercial instrument were replaced by two 2 L auto- each hole at the center of the tube and averaged to determine
clavable Nalgene bottles (Thermo Scientific Inc.) with an- the SpinCon II volumetric flow rate (478.0 ± 6.4 L min−1 ).
timicrobial tubing, connectors, and a small HEPA filter con-
nected to vent and prevent coarse and submicron particle 2.2 Flow cytometry
contamination (Fig. 1). Bottles were autoclaved and filled
with Milli-Q water and PBS, beforehand sterilized with During this study, a BD Accuri C6 flow cytometer (BD
0.2 µm pore bottle top filters (Thermo Fisher Inc.), and trans- Bioscience Inc.) was used for flow cytometry. The instru-
ferred inside a biosafety cabinet. An aliquot of each fluid ob- ment quantifies suspended cells in aqueous medium at three
tained after preparation was evaluated for sterility by EPM flow velocity modes (slow, medium, and fast flow at 14, 35,
and FCM. and 66 µL min−1 , respectively). It excites particles with a
The cleaning protocol (CP) of the biosampling system 488 nm laser and possesses four fluorescence detectors, FL1
consists of two phases. During phase one, all acrylic win- (533±30 nm), FL2 (585±40 nm), FL3 (> 670 nm), and FL4
dows and the outside of the collector/concentrator were (675 ± 25 nm), which make it possible to analyze the flu-
Atmos. Chem. Phys., 20, 1817–1838, 2020 www.atmos-chem-phys.net/20/1817/2020/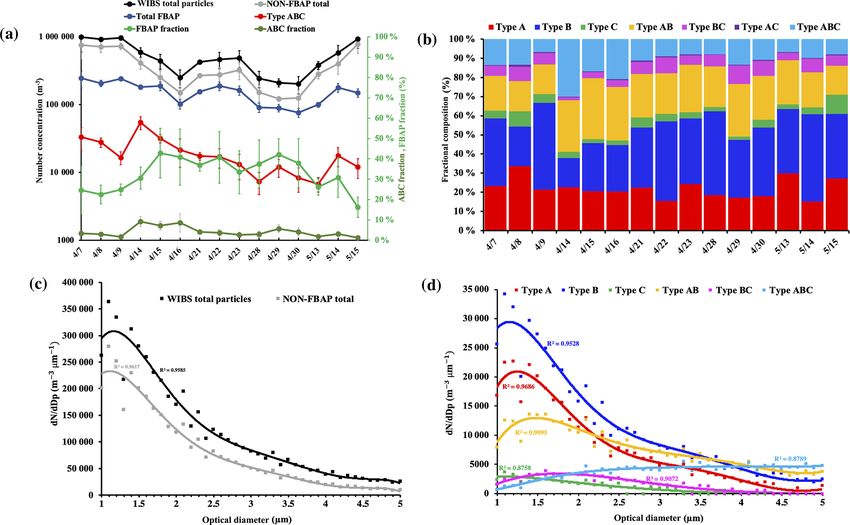
A. Negron et al.: Characterization of bioaerosols in Metro Atlanta                                                                      1821

Figure 1. SpinCon II sampling setup including a modified fluid supply system with anti-microbial tubing and 2 L autoclavable bottles.

orescence from multiple dyes concurrently. In this study, a             mately depends on the refractive index of each cell (Müller
2.5 µM SYTO-13 nucleic acid probe was added to the fixed                and Neben-von-Caron, 2010). Side scattering has been ef-
samples and incubated for 15 min in the dark at room tem-               fective at distinguishing cells of different complexities (e.g.,
perature to stain biological particles. Additionally, 10 µL of          monocytes and granulocytes; Shapiro, 2005).
15 µm polystyrene bead suspension was added to the 1 mL                    An 80 000 unit intensity FSC-H threshold (default FSC-
total volume samples as an internal standard for PBAP con-              H threshold value suggested by the manufacturer to mini-
centration and size quantification. The BD Accuri C6 was                mize the effect of noise) was set in the instrument during
cleansed before each use with 0.2 µm filtered Milli-Q wa-               data acquisition to minimize the effects of noise on biopar-
ter in fast mode for 10 min; background particle counts were            ticle counts. The FSC-H channel (where H denotes height)
typically reduced to 1 µL−1 . At the beginning of every ex-             measures single-particle forward-scattering (FSC) intensity
periment, a 1 mL blank of the atmospheric sample without                based on the peak (maximum point) of the voltage pulse
SYTO-13 and beads was analyzed, used in quantification cal-             curve recorded when a single particle goes through the inter-
culations (Sect. 3.1). Each sample was run in slow mode for             rogation point in the flow cytometer, whereas FSC-A, where
5 min. After each sample, the instrument was flushed with               A denotes area, measures single-particle FSC intensity based
0.2 µm filtered Milli-Q water in slow flow for 1 min (impor-            on the area below the curve of the recorder pulse. When the
tant for robust quantification of the typically low concentra-          80 000 unit FSC-H threshold is defined, only signals with
tions of the atmospheric samples). SYTO-13 fluorescence                 an intensity greater than or equal to the threshold value will
intensity was quantified by the FL1-A detector and used in              be processed, and this could affect the statistics and detec-
combination with other parameters (FSC-A and SSC-A) to                  tion efficiency of the flow cytometer toward small particles
constrain the PBAP populations present. FSC-A measured                  (≤ 1 µm). Experiments conducted with 1.0 µm polystyrene
forward (0 ± 13◦ ) scattering and is used to characterize the           bead suspension (Supplement; Fig. S16) have shown that
size of particles; SSC-A measured the side (90 ± 13◦ ) scat-            1.0 µm beads have FSC-H intensities above the 80 k thresh-
tering and is used to characterize the internal complexity of           old, no particle losses are observed, and beads’ estimated
particles. The SSC-A scattering intensity is a function of the          concentration agrees with that reported by the manufacturer
cellular granularity or density of the internal structures (e.g.,       (∼ 6 × 10⁷ mL−1 ; Life Technologies, Inc.). The FCM data
nucleus, mitochondria, ribosomes), the sphericity, and the              from each sample were analyzed using the FlowJo soft-
size of the particles. Compared to spherical particles of the           ware (https://www.flowjo.com/solutions/flowjo, last access:
same size, elongated particles tend to yield a broader distri-          22 August 2018) to gate and quantify the bioparticle pop-
bution of side-scattering intensities (Mage et al., 2019; Math-         ulation. The same procedure was used to analyze the PBS,
aes et al., 2013). Although side-scattering intensity increases         Milli-Q water, and blanks.
with particle size, it has not been commonly used to measure
cell size (Tzur et al., 2011). Overall, SSC-A scattering inten-
sity will be proportional to the amount of scattering caused
by the internal structures and the cell membrane, which ulti-

www.atmos-chem-phys.net/20/1817/2020/                                                     Atmos. Chem. Phys., 20, 1817–1838, 2020
1822                                                      A. Negron et al.: Characterization of bioaerosols in Metro Atlanta

2.3    LIF detection of PBAP                                       defined above. This approach was applied by Hernandez et
                                                                   al. (2016) to pure culture PBAP (bacteria, fungal spores,
The WIBS-4A (referred to henceforth as “WIBS”) is a single         pollen) to study their correspondence to FBAP types; bacte-
biological particle real-time sensor, which measures parti-        ria tend to be detected by type A and fungal spores and pollen
cle light scattering and autofluorescence in an approximately      by types AB and ABC. However, bioaerosol classification is
0.5–15 µm particle range (http://www.dropletmeasurement.           instrument-specific and particle-size-dependent (Hernandez
com, last access: 22 August 2018). Particles are initially         et al., 2016; Savage et al., 2017). Multiple environments have
sized using the 90◦ side-scattering signal from a 635 nm           been studied using the Perring et al. (2015) FBAP types, in-
continuous-wave diode laser. The scattering intensity is di-       cluding rural, urban, and highly vegetated locations. In the
rectly related to particle diameter and was calibrated prior to    southeastern US, the total FBAP concentrations range from
deployment using polystyrene latex sphere calibration stan-        2×10⁴ to 8×10⁴ m−3 , constituting 3 %–24 % of the total su-
dards (PSL with 0.8, 0.9, 1.0, 1.3, 2.0, and 3.0 µm diame-         permicron particle number between 1 and 10 µm diameter. In
ters, Thermo Scientific Inc.). The WIBS optical size there-        the highly vegetated Rocky Mountains, ABC-type particles
fore refers to PSL material with a real refractive index of        are enhanced during rainy days (during or post rain events) to
1.59. Healy et al. (2012) determined WIBS-4 counting ef-           ∼ 65 % of the total FBAP, owing to the release of wet-ejected
ficiency by aerosolizing standardized concentrations of the        fungal spores following precipitation (Gosselin et al., 2016).
PSL sphere of specific sizes (e.g., 0.3, 0.4, 0.56, 0.7, 0.9,      By contrast, in the highly populated city of Nanjing, China,
and 1.3 µm) and compared WIBS-4 total counts against PSL           all FBAP types, except type C, correlated with black carbon
counts detected by the condensation particle counter (CPC).        concentrations, suggesting a strong interference by combus-
Results show WIBS-4 possesses a 50 % counting efficiency           tion sources (Yu et al., 2016). A detailed explanation of the
for 0.5 µm particles and detects 100 % of the PSL parti-           above-mentioned studies using the Perring et al. (2015) ap-
cles above 0.7 µm when it is compared to the CPC counts.           proach is also included in Sect. S20 of the Supplement.
The 280 and 370 nm pulsed Xenon flashtube UV lights
in the WIBS cause the particles to autofluoresce (i.e., ex-        2.4    Location of sampling site and sampling frequency
cite the chromophores preexisting in the PBAP and do not
rely on a fluorescent dye as done in FCM). Then, fluores-          Bioaerosol sampling was conducted between 7 April and
cent emissions are measured at three wavelength channels,          15 May 2015 at the rooftop sampling platform of the Ford
which following the nomenclature of Perring et al. (2015)          Environmental Sciences and Technology (ES&T) building
are (i) channel A (“FL1_280” in previous studies; Robinson         at the Georgia Institute of Technology campus in Atlanta,
et al., 2013), which refers to the detected emission between       GA. The site, which was located at the heart of a major ur-
310 and 400 nm after excitation at 280 nm, (ii) channel B          ban environment, is surrounded by densely forested areas in
(“FL2_280” in previous studies), which refers to the detected      the southeastern USA: the Oconee National Forest (south-
emission between 420 and 650 nm after excitation at 280 nm,        east), the Chattahoochee National Forest (north), and the Tal-
and (iii) channel C (“FL2_370” in previous studies), which         ladega National Forest (west). The WIBS operated continu-
refers to the detected emission between 420 and 650 nm af-         ously throughout the same period, sampling bioaerosol from
ter excitation at 370 nm. The resulting autofluorescence from      a 15 ft (∼ 4.6 m) long and 1/4 in. ID conductive tubing in-
280 nm excitation is affected by the presence of tryptophan,       let fixed 8 ft (∼ 2.4 m) above the sampling platform floor.
tyrosine, and phenylalanine amino acids in the PBAP (Pöh-          The SpinCon II was placed in the platform during sampling
lker et al., 2012). Similarly, the resulting autofluorescence      episodes with its inlet facing south. Three 4 h samples per
from the 370 nm excitation is influenced by the presence of        week were collected with the Spincon II sampler over the
riboflavin and co-enzyme nicotinamide adenine dinucleotide         5-week period (4 h sampling between 10:00 and 17:00; Ta-
phosphate (NAD(P)H) within the cells.                              ble 1). Meteorological data acquired from the same platform
   Biological and non-biological particles can be discrimi-        provided wind speed, wind direction, relative humidity (RH),
nated by using a fluorescent intensity threshold; here the         temperature, total hourly rain, and UV radiation index with a
threshold is determined with the Gabey et al. (2010) method        1 min resolution.
and with modifications by Perring et al. (2015) as follows.
Particles with fluorescence intensities below the fluorescence     3     Data processing and analysis
threshold in all channels are categorized as non-fluorescent
(NON-FBAP). Particles that fluoresce above the threshold in        3.1    FCM data processing
only one channel are named with a single letter (e.g., A, B,
or C); particles that fluoresce in two channels are named with     All blanks collected showed contamination levels that did not
the two channel letters (e.g., AB, AC, or BC), while par-          exceed 1 % of the PBAP quantified in the subsequent atmo-
ticles that fluoresce in all channels are categorized as type      spheric samples. The 2 min instrument blanks obtained after
ABC. Furthermore, the total FBAP concentration is defined          the CP and the HEPA filter washes were 1.06 × 10³ ± 7.37 ×
as the sum of the concentration in the seven FBAP categories       102 and 9.22×10² ±1.24×10² mL−1 , respectively, which are

Atmos. Chem. Phys., 20, 1817–1838, 2020                                             www.atmos-chem-phys.net/20/1817/2020/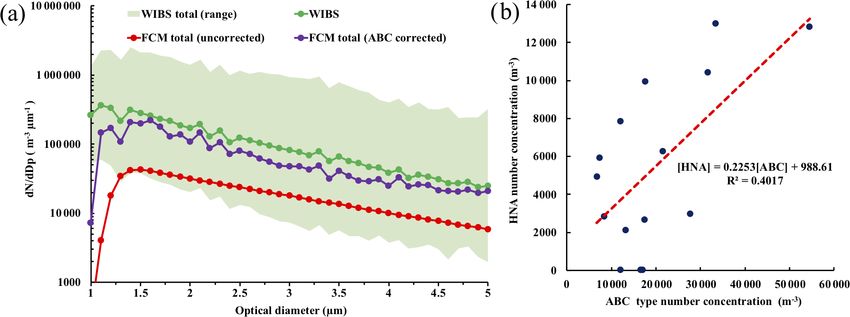
A. Negron et al.: Characterization of bioaerosols in Metro Atlanta                                                                              1823

Table 1. Summary of the SpinCon II sampling events, the 24 h averaged RH, ambient temperature, the assigned meteorological category
(using Sect. 4.4 definitions), and the corrected FCM-derived PBAP number concentration (1 to 5 µm) for each sample collected during this
study.

                  Date                                       RH       Temperature         Meteorological     PBAP concentration (m−3 )
                  (starting–ending time)                     (%)            (◦ C)         category             1 to 5 µm diameter range
                  7 April 2015 (11:17–15:17)a               70.9                21.4      Humid, warm                      9.282 × 10⁴
                  8 April 2015 (11:10–15:10)                53.6                24.9      Dry, warm                        5.203 × 10⁵
                  9 April 2015 (11:15–15:15)                53.8                25.3      Dry, warm                        1.254 × 10⁵
                  14 April 2015 (11:30–15:30)a              76.8                22.5      Humid, warm                      8.253 × 10⁴
                  15 April 2015 (11:40–15:40)a              83.6                18.9      Humid, warm                      1.234 × 10⁵
                  16 April 2015 (10:55–14:55)               86.3                12.5      Humid, cold                      3.399 × 10⁵
                  21 April 2015 (13:15–17:15)               43.2                16.6      Dry, cold                        4.741 × 10⁵
                  22 April 2015 (11:25–15:25)               38.1                18.8      Dry, warm                        3.351 × 10⁵
                  23 April 2015 (11:35–15:35)               48.1                16.8      Dry, cold                        1.708 × 10⁶
                  28 April 2015 (12:25–16:25)               45.3                17.0      Dry, cold                        4.899 × 10⁵
                  29 April 2015 (11:55–15:55)b              79.4                14.2      Humid, cold                      4.591 × 10⁵
                  30 April 2015 (12:10–16:10)               57.3                17.4      Dry, cold                        9.603 × 10⁵
                  13 May 2015 (10:50–14:50)                 40.1                23.5      Dry, warm                        3.680 × 10⁵
                  14 May 2015 (11:50–15:50)                 52.3                23.0      Dry, warm                        4.851 × 10⁵
                  15 May 2015 (10:19–14:19)                 64.4                23.1      Dry, warm                        1.656 × 10⁶
                a Sampling occurred post rain event. b Sampling occurred during a rain event.

negligible accumulations compared to the 2.55×10⁵ ±1.14×                               non-biological particles, including those that may be subject
105 mL−1 average PBAP concentration quantified in the at-                              to background fluorescence or unspecific binding of SYTO-
mospheric samples. The concentration of PBAP in the blanks                             13 (Díaz et al., 2010; Müller and Nebe-von-Caron, 2010). We
was also confirmed with microscopy (not shown). Based on                               found out that threshold values for the 99.9 % approach were
this, we are confident that the CP protocol and procedure to                           substantially higher than the 99.5 % approach in multiple
replace the working fluids ensured sterility of the biosampler                         sampling events and comparable to the fluorescence inten-
before each sampling.                                                                  sities observed for stained pure cultures (∼ 105 units), which
   FCM analysis of the samples was carried out as fol-                                 means that the 99.9 % threshold values will miscount pure
lows. We obtain the fluorescence intensity (from each of                               cultures as non-biological. Consequently, we set the fluores-
the four fluorescence detectors) and forward-scattering and                            cence threshold to the highest fluorescence intensity value
side-scattering intensity for all the particles suspended in                           observed by the 99.5 % approach (41 839 units; Supplement,
the samples. A gating procedure was used to determine the                              Fig. S2b) and applied it to all collected samples, henceforth
fluorescence levels associated with detecting only particles                           named the 42 k FL1-A threshold. The 42 k threshold value
containing SYTO-13 (hence, a PBAP) and background flu-                                 aims to minimize any abiotic interference as it maximizes bi-
orescence from non-stained particles. The procedure (Sup-                              ological particle quantification. A fixed value has been cho-
plement, Sects. 2 and 3) consists of three steps: (a) flu-                             sen and applied to all samples given that having a different
orescence threshold determination, (b) population gating,                              threshold value for each sampling event may result in quan-
and (c) biological/non-biological particle discrimination in                           tification biases as bioaerosols with strong autofluorescence
the population(s) within the threshold (e.g., LNA PBAP,                                (e.g., pollen, fungal spores) can increase the threshold value
Sect. 4.1). The fluorescence threshold was determined using                            and affect PBAP quantification in the population(s) within
an atmospheric sample without SYTO-13 collected before                                 the threshold. The BD Accuri C6 flow cytometer used for
each FCM analysis, as a blank. Based on the fluorescence re-                           the analysis of the samples maintains constant pre-optimized
sponses obtained, we determine the FL1-A fluorescence in-                              photomultiplier voltages and amplifier gain settings. As a
tensity value for which 99.5 % or 99.9 % of the (unstained)                            result, the fluorescence intensity of particles is consistent
particles of the blank autofluoresce below the chosen value.                           from day to day, and the fluorescence intensity of a spe-
This FL1-A intensity, called the “fluorescence threshold”,                             cific biological particle population with the same metabolic
was determined for each sample (Supplement, Fig. S2a and                               state and physiological characteristics must not show day-to-
b). The determination of the fluorescence threshold involved                           day variability (http://www.bdbiosciences.com, last access:
selecting the most conservative value that maximizes the in-                           9 August 2018). Under the 42 k threshold approach PBAP
clusion of biological particles and minimizes the inclusion of                         concentrations in the population(s) within the threshold (e.g.,

www.atmos-chem-phys.net/20/1817/2020/                                                                      Atmos. Chem. Phys., 20, 1817–1838, 2020
1824 A. Negron et al.: Characterization of bioaerosols in Metro Atlanta
LNA, Sect. 4.1) can be overestimated by up to 0.5 %. Further- forming the force trigger (FT) calibration which consists in
more, FCM experiments conducted with unprocessed Ari- operating the WIBS without flowing air through the sys-
zona Test Dust (ATD) show that the FL1-A intensity distri- tem. The FT calibration, carried out every 24 h, is critical
bution of ATD particles stained with SYTO-13 is very simi- for determining the lowest particle autofluorescence levels
lar to unstained ATD particles, and 100 % of the SYTO-13- that robustly exceed instrument electronic noise. FT calibra-
stained ATD particles stay below the 42 k threshold (Supple- tions measured the particle-free air background autofluores-
ment, Fig. S14a and b), supporting the 42 k threshold effec- cence in the three WIBS channels (e.g., A, B, C), and mea-
tiveness in filtering out abiotic particles. surements recorded the fluorescence intensity for 500 excita-
Once the FL1-A threshold was determined, plots of FL1-A tion flash events (Ziemba et al., 2016; Tropak and Schnaiter,
vs. SSC-A and FL1-A vs. FSC-A were used to define clus- 2013; Gabey et al., 2010). The threshold for each detector is
ters of bioparticles with fluorescence that exceed the FL1-A then equal to the average fluorescence plus 2.5 times its stan-
threshold and a characteristic optical size (obtained from the dard deviation; particles with fluorescence intensities above
FSC-A intensity) or particle internal complexity (obtained this threshold value are classified as FBAP. Then, the Perring
from the SSC-A intensity). FL1-A vs. SSC-A plots were used et al. (2015) approach (Sect. 2.3) is applied to determine the
to define the populations of bioparticles for PBAP quantifi- combination of thresholds that provide the maximum con-
cation as clusters using the SSC-A parameter were more de- centration of PBAP and minimal interference from abiotic
fined and showed better spatial resolution than when using particles, which still remains an area of active research. It is
the FSC-A parameter. The limits of each population were important to note that the Gabey et al. (2010) threshold ap-
also determined with FlowJo (https://www.flowjo.com, last proach and the Perring et al. (2015) FBAP types were applied
access: 22 August 2018), using 2 % contour plots (Supple- to the WIBS-4A data and should not be directly compared to
ment Fig. S3) generated by equal probability contouring (i.e., FBAP quantifications performed by the WIBS-3 in previous
50 contour levels so that the same number of cells fall be- studies, owing to the channel A and B overlap on the latter. A
tween each pair of contour lines). Populations above the FL1- detailed comparison between the WIBS-3 and WIBS-4 mod-
A threshold value (41 839 FL1-A units) were considered bio- els, as well as PBAP detection by both models, is further
logical (Sect. 4.1; e.g., HNA); the particles in the population discussed in the Supplement (Sect. S21).
within the threshold value (Sect. 4.1; e.g., LNA) with a FL1- In this study, thresholds for each channel were determined
A intensity greater than 41 839 units were counted as biologi- daily, and the total particle concentration, FBAP type (e.g.,
cal to determine the PBAP counts in the population. The total A, B, C, AB, BC, AC, and ABC) concentrations, and total
PBAP counts were considered to be all particle counts with FBAP concentration (sum of the seven FBAP types) were
FL1-A fluorescence intensity above the determined threshold used. From the data, 4 h averaged size distributions (us-
value minus the 15 µm beads’ internal standard with FL1-A ing 15 min average data) were generated for the total par-
fluorescence intensity above the determined threshold value. ticles and all FBAP types in the 1–10 µm range during the
The 15 µm beads of known concentration and particle size al- SpinCon II run. Subsequently, WIBS overall sampling effi-
low for calibration of the optical size (Supplement Sect. S7) ciency (aspiration efficiency + transport efficiency) was cal-
of the bioparticles as well as their concentration and depar- culated using the Particle Losses Calculator (Von der Wei-
ture from sphericity. The 15 µm bead population showed flu- den et al., 2009) and applied to the 1–10 µm size distri-
orescence intensities comparable to the determined fluores- butions for the sampling characteristics in our setup (15 ft
cence threshold after been stained with SYTO-13, as it is (∼ 4.6 m) sampling line with 1/4 in. ID and 2.3 L min−1 flow
known that molecular stains can be adsorbed on the surface rate; Fig. S4a). The sampling efficiency was calculated to
of polystyrene beads (Eckenrode et al., 2005; Rödiger et al., be 67 % for 5 µm particles, with larger losses as size in-
2011). The relatively high fluorescence intensity of the 15 µm creased to 10 µm (Supplement, Fig. S4b). FCM and WIBS
beads shows that populations within the threshold value (e.g., total particles and PBAP comparison was constrained to the
LNA, Sect. 4.1) cannot be ruled out as being affected by un- 1 to 5 µm range being the size overlap of both techniques.
specific staining of abiotic particles. However, populations Also, the fractional composition of FBAP (based on number
above the threshold value (e.g., HNA, Sect. 4.1) should not concentrations) was calculated to characterize its daily vari-
be affected by such abiotic interferences. ability (Sect. 4.2), and compared against the daily variability
of PBAP from the FCM analysis (Sect. 4.4).
3.2 WIBS data processing
Fifteen minute average total aerosol and FBAP size distribu-
tions were obtained from the WIBS. FBAP was distinguished
from the total aerosol using the Gabey et al. (2010) “trigger
threshold” approach, which is applied as follows. First, the
average “electronic fluorescence noise” and its standard de-
viation are determined for each channel (A, B, C) by per-
Atmos. Chem. Phys., 20, 1817–1838, 2020 www.atmos-chem-phys.net/20/1817/2020/A. Negron et al.: Characterization of bioaerosols in Metro Atlanta 1825
4 Results and discussion
4.1 FCM biopopulation identification and
quantification
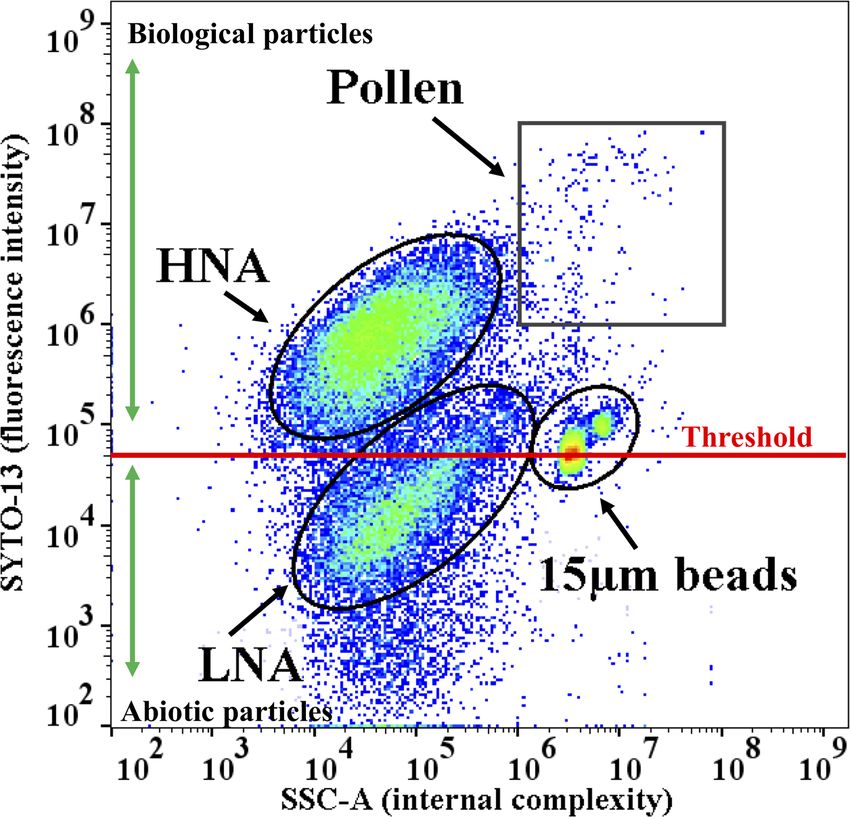
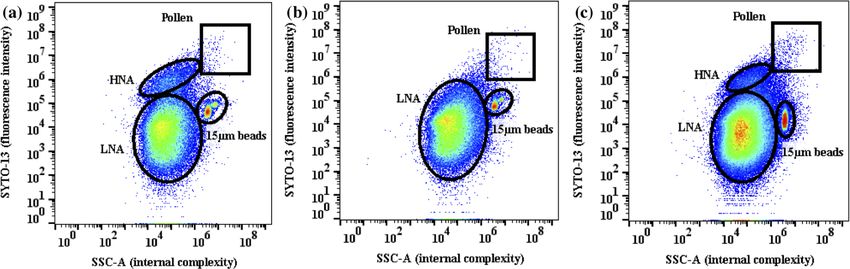
When the FCM results are plotted in terms of FL1-A fluo-
rescence intensity vs. SSC-A scattering intensity, four popu-
lations (Fig. 2) emerge above the detection thresholds: LNA
particles, HNA particles, pollen, and the 15 µm internal stan-
dard beads. EPM and SEM pictures (Supplement Figs. S5,
S6, and S7) confirm the presence of these heterogeneous
populations. SYTO-13 stains DNA and RNA, and the result-
ing single-cell FL1-A fluorescence intensity (Fig. 2) is di-
rectly proportional to its nucleic acid content (Lebaron et al.,
2001; Troussellier et al., 1999; Comas-Riu and Vives-Rego,
2002). Previously, SYTO-13 has effectively distinguish be-
tween HNA and LNA bacterioplankton and phytoplankton Figure 2. FL1-A vs. SSC-A plot used to identify populations in
populations in fresh and seawater samples, and results are the 14 April 2015 sample, including the 42 k threshold line in red
and abiotic particle (below threshold) and biological particle (above
comparable to SYBR green II and SYBR green I, more spe-
threshold) designated regions. In the density plot green and red
cific DNA probes (Wang et al., 2010; Bouvier et al., 2007;
zones denote the most populated regions. FL1-A on the y axis
Lebaron et al., 2001). However, corresponding populations shows the fluorescence intensity of each particle in the plot stained
in atmospheric PBAP have not been identified before. The with SYTO-13, and SSC-A on the x axis measures 90◦ light scat-
SSC-A scattering intensity in Fig. 2 changes as a function of tering related to the internal complexity (e.g., granularity or num-
the size, composition (e.g., cell refractive index), and com- ber of internal structures) of the particles. The fraction of the LNA
plexity of the cell (e.g., internal structures or surface irregu- population above the threshold line is referred to as the “LNA-AT”
larities) and the strongest SSC-A intensity corresponding to population.
the largest, most complex particles. Below we focus on each
population to further understand the identified populations of
biological particles. and Bacillus anthracis: 3–10 µm), supporting LNA popula-
The HNA size distributions are dominated by 3–5 µm par- tion may represent single or agglomerated bacterial cells.
ticles (mean diameter: 4.15±0.06 µm; Supplement Fig. S10) However, it is clear that heterogeneous populations will prob-
and the total concentration moderately correlated with RH. ably contain multiple types of microorganisms, and that may
HNA were virtually non-existent during several extended dry be the case in the LNA population.
periods (days with average RH < 70 % during sampling, e.g., It is known that pollen may burst into tiny fragments
9 April, 22 April, and 15 May) and well defined during peri- when is suspended in water (e.g., Augustin et al., 2013;
ods of high humidity, especially after rain events (days with Taylor et al., 2007), potentially increasing the concentration
average RH > 70 % and T > 18 ◦ C during sampling episode; of LNA particles and biasing concentrations. Although 0.2–
e.g., 7, 14, and 15 April). Both of these characteristics sug- 5 µm pollen fragments can be generated upon rupture, pollen
gest that HNA particles correspond to wet-ejected fungal (e.g., birch, ryegrass, oak, olive) mainly breaks apart into
spores (e.g., from the Ascospores and Basidiospores genus; submicron fragments by hydrolysis and favors fragmenta-
Oliveira et al., 2009; Li and Kendrick, 1995). The LNA size tion into small submicron (< 1 µm) particles (Taylor et al.,
distributions are dominated by 2–4 µm particles (mean diam- 2007; Bacsi et al., 2006; Grote et al., 2003) not considered
eter: 2.99 ± 0.06 µm; Supplement, Table S1) and dominated in our FCM analysis. An additional factor to consider in
Atlanta PBAP composition during dry days. Many individ- pollen fragmentation is the number of fragments generated
ual bacteria are likely in around 1 µm, but the observed LNA per pollen grain. FCM applied to ragweed pollen suggests
particles are within the median aerodynamic diameter of cul- a 1 : 2 pollen-to-pollen fragment concentration ratio (Sup-
turable bacteria (∼ 4 µm) in continental sites (Després et al., plement, Table S2). Also, calculations based upon FCM-
2012). Bacteria in the atmosphere can be co-emitted together derived ragweed pollen and pollen fragments concentrations
with larger particles (e.g., soil, plant fragments), and occa- during this study (considering the total pollen mass added
sionally they are observed as clumps of bacteria cells (Bur- to the sample, the 15 µm mean diameter previously deter-
rows et al., 2009). In addition, several bacterial species ob- mined by Lin et al., 2013, and unit density) suggest that
served in the atmosphere (Delort and Amato, 2018; Monier approximately 67 % of the ragweed pollen grains were in-
and Lindow, 2003; Baillie and Read, 2001) are within this tact after hydration and that each fragmented grain generates
sizes range (e.g., Sphingomonas spp.: 1.0–2.7 µm; Methy- ∼ 5 pollen fragments. Results agree with Bacsi et al. (2006)
lobacterium spp.: 1–8 µm, Pseudomona syringae: ∼ 2.5 µm, observations, where 35 % of the ragweed pollen grains frag-
www.atmos-chem-phys.net/20/1817/2020/ Atmos. Chem. Phys., 20, 1817–1838, 20201826 A. Negron et al.: Characterization of bioaerosols in Metro Atlanta ment upon hydration. Overall, ragweed pollen results sug- 2013; Hill et al., 2009). The pollen population was not well gest that FCM experiments do not have a considerable im- defined during all sampling events. Whenever present, pollen pact on pollen fragmentation and that pollen fragmentation was characterized by concentrations (∼ 102 m−3 ) consistent will have a negligible effect on LNA concentrations. Rag- with reported values (Després et al., 2012), which are also weed pollen is one of the most abundant wind-driven pollen much lower than LNA-AT and HNA concentrations. As a species in the United States and its emission peaks during result, pollen population was systematically gated using a fall, but can be also present during late spring and sum- perfect square between 106 and 108 intensity units in the mer. It is representative of the pollen species we see in the FL1-A vs. SSC-A plot for each atmospheric sample. LNA- Atlanta area (Darrow et al., 2012), and results suggest that AT, HNA, and pollen counts acquired by the 42 k threshold pollen fragmentation would not generate a substantial num- approach were used to calculate liquid-based (mL−1 of sam- ber of fragments. The low collection efficiency of SpinCon ple solution) and air-based (m−3 of air) concentrations for toward large particles (< 14 % for diameters above 5 µm) and each bioaerosol population as detailed in the Supplement. that pollen concentrations in our samples are generally 2 or- The total PBAP concentration on each sample consisted of ders of magnitude lower than LNA concentrations (Fig. S22; all non-bead particles above the 42 k fluorescence thresh- Supplement) suggest a negligible effect of pollen fragments old given that a non-negligible biological particle concen- on LNA biological particle quantification. Pollen concentra- tration was not constrained in the gated populations. Even tions are 100–1000 times lower than bacteria concentrations though the 2 % contour plots effectively allowed population in the atmosphere (Hoose et al., 2010). At least 100 supermi- gating, 16.5 ± 7.3 % of the total PBAP are not attributed to cron (> 1 µm) pollen fragments will have to be released per the identified populations. The biological particles not con- pollen grain to considerably influence the LNA population, strained by FlowJo 2 % gating, henceforth named the “un- which has not been observed. Also, EPM results showed in- classified” bioparticles, showed the highest concentrations tact pollen and limited amounts of small debris among the when both HNA and LNA populations are densely populated particles identified in the atmospheric samples collected for (16 April, 28 April, and 14 May; Fig. 5). The lowest con- this study. Particles with fluorescence intensities above the centrations were observed when just the LNA population is FL1-A threshold value in the LNA population were counted identified (9 April, 22 April, 15 May; Fig. 5) and when the as biological, giving us the PBAP counts within the LNA LNA and HNA populations are identified after the rain event population, and will be referred to henceforth as the “LNA- on 14 April. The observed behavior shows that the unclas- AT” population (Fig. 2), where “AT” refers to the above sified bioparticle concentrations is linked to the heterogene- threshold. ity of the biological populations and the concentration of the The LNA population shows SYTO-13 fluorescence inten- gated populations (e.g., HNA, LNA, and pollen). The “un- sities that are about 1 order of magnitude lower than the classified” bioparticle concentration ranges from 8.1 × 10² HNA population, and the fluorescence intensity difference to 1.3 × 10⁴ m−3 (average 4.2 × 10³ ± 3.3 × 10³ ), and they is consistent across all sampling events. Based on Bouvier et are not constrained to a specific size range. Most of the un- al. (2007), cell populations with different metabolic activity classified bioparticles are far from the centroids of the gated (e.g., active and non-active), when detected by FCM, should populations. They can indeed be formed by fragmentation observe a decrease in fluorescence intensity in consecutive or accretion, or also be related to plant debris (i.e., irregular sampling events when transitioning from the HNA to the bioparticles) that are characterized by a very broad size, in- LNA population or vice versa when transitioning from the ternal complexity and nucleic acid content distributions. In LNA to HNA population. The fluorescence intensity of the addition, we must note that additional concentration correc- LNA and HNA populations shows small variation through- tions are required owing to the sampling efficiency of the out the sampling events (LNA-AT: 7.38 × 10⁴ ± 1.39 × 10⁴ ; SpinCon II, but will be considered in Sect. 4.3 and 4.4. HNA: 6.72 × 10⁵ ± 2.30 × 10⁵ ; Table S3), and no anticorre- Before SpinCon II sampling efficiency corrections are ap- lation is observed in the studied parameters (FSC-A, SSC-A, plied, FCM total particle concentrations range from 2.6×10⁴ FL1-A), which suggests that we have in fact two distinctive to 2.9 × 10⁵ m−3 , with increasing concentrations toward the populations of bioaerosols (Supplement; Figs. S23 and S15). end of the sampling period. In addition, total PBAP con- A population of strongly fluorescing and very large par- centration averaged 2.4 × 10⁴ ± 1.1 × 10⁴ m−3 (coefficient ticles (10–20 µm, average geometric mean diameter 12.3 ± of variation, CV, 13 %; defined as the standard deviation 1.7 µm) was identified (Fig. 2). This population also strongly over a triplicate FCM measurements over the average con- autofluoresces in the FCM when SYTO-13 was not added centration). LNA-AT ranged between 6.8 × 10² and 2.9 × to the sample (Sect. 8, Fig. S11). All together this indi- 104 m−3 (average: 1.1 × 10⁴ m−3 ; CV: 20 %), HNA (fun- cates a population of pollen particles, as they are known gal spores) between 4.7 × 10³ and 1.9 × 10⁴ m−3 (average: to contain cell wall compounds (i.e., phenolic compounds, 1.1 × 10⁴ m−3 ; CV: 15 %) when above the detection limit carotenoid pigments, Phenylcoumarin) that fluoresce more (n = 12), and pollen from 1.3 × 10² to 1.2 × 10³ m−3 (aver- strongly than the proteins and cytosolic compounds responsi- age: 3.6 × 10² m−3 ; CV: 21 %). These concentration levels ble for bacteria/fungi autofluorescence (Pöhlker et al., 2012, are consistent with microscopy-based studies in urban en- Atmos. Chem. Phys., 20, 1817–1838, 2020 www.atmos-chem-phys.net/20/1817/2020/
A. Negron et al.: Characterization of bioaerosols in Metro Atlanta 1827
vironments for bacteria (e.g., 1.7 × 10⁴ ± 1.3 × 10⁴ m−3 in HNA and LNA-AT (fraction of LNA above threshold; Fig. 2)
springtime Birmingham, UK; Harrison et al., 2005); fungal populations, respectively (Fig. 2; Table S4). Guindulain et
spores (1.8×10⁴ ±1.1×10⁴ m−3 in Vienna, Austria, between al. (1997) FCM results with starved bacterioplankton from
April and June; Bauer et al., 2008b); and pollen (between seawater samples treated with DNase/RNase showed SYTO-
5.69 × 10² m−3 and 6.144 × 10³ m−3 in Medellin, Colom- 13 fluorescence intensity can be related to the DNA con-
bia; Guarín et al., 2015). Also, additional experiments per- tent of starved bacterioplankton due to the low amount of
formed in September 2015, described in Fig. S7 of the Sup- RNA enclosed in starved cells. Taking into consideration
plement (Sect. 6), showed that EPM and FCM-based quan- our results and previous studies, we can suggest that pollen,
tifications agree within an order of magnitude. This is consis- LNA-AT, and HNA populations in the atmospheric samples
tent with Lange et al. (1997), who also found that FCM gives are distinguished by their DNA content, which can in part
higher quantifications than EPM microscopy when studying explain the SYTO-13 fluorescence intensity difference be-
P. aeruginosa pure cultures and airborne bacteria collected tween them. We also acknowledge that DNA sequestration
from a swine confinement building in Iowa, USA. by bacteria, fungal spores, and pollen may differ, and their
To better understand SYTO-13 fluorescence intensity dif- cell membrane characteristics will ultimately determine how
ferences between the identified (e.g., LNA-AT, HNA, and much stress the cells will sustain before they completely
pollen) populations in the atmospheric samples and their rupture. SYTO-13 is a highly permeable stain and effec-
metabolic/stress state, FCM experiments were conducted tively detects nucleic acids (DNA and RNA) of bacteria en-
with air-isolated bacteria (F8 strain; DeLeon-Rodriguez, dospores and vegetative cells (Comas-Riu and Vives-Rego,
2015), ragweed pollen, and yeast (S. cerevisiae; Y55 strain) 2002). Fungal spores have also been effectively stained by
mixtures to compare the SYTO-13 fluorescence intensity and DNA/RNA probes (Bochdansky et al., 2016; Chen and Li
the scattering properties of the pure cultures to those seen in et al., 2005), but some fungal spores might not be equally
the atmospheric samples. Pure culture experiments aimed to stained due to their harder cell wall and chromatin binding of
(1) serve as positive controls to ensure SYTO-13 effectively DNA (Standaert-Vitse et al., 2015). Future work is needed to
stains bacteria, fungi, and pollen and (2) acquire reference study this further.
fluorescence and scattering properties on each pure culture
population. Pure cultures and atmospheric samples are sum- 4.2 WIBS total concentration and FBAP daily
marized in Tables S3 and S4 (Supplement; FCM pure culture variability
experiments), respectively. The LNA-AT population showed
SYTO-13 fluorescence intensity up to 2 orders of magnitude WIBS-4A collected data continuously throughout the period;
lower than F8 bacteria. The HNA population showed an or- for comparison against the SpinCon II 4 h liquid batch sam-
der of magnitude lower SYTO-13 fluorescence intensity than ples, WIBS data were averaged to the SpinCon II sampling
Y55 HNA yeast and within the same magnitude for the LNA times (Table 1). WIBS total particle concentration (1–5 µm
Y55 yeast. The HNA and LNA yeast populations in the pure diameter) ranged from 2.0 × 10⁵ to 1.0 × 10⁶ m−3 , in agree-
culture experiments (Fig. S13a) have 1 order of magnitude ment with observed particle concentrations in previously
difference in FL1-A fluorescence intensity and may repre- studied urban environments during spring/summer months
sent yeast populations with different metabolic states. Atmo- like Helsinki, Finland (UV-APS average 1.6×10⁵ m−3 ; Saari
spheric and ragweed pollen populations had similar SYTO- et al., 2014), and Karlsruhe, Germany (WIBS-4 average
13 fluorescence intensities and Fig. S13c shows pollen flu- 6.9 × 10⁵ m−3 ; Tropak and Schnaiter, 2013); 4 h average to-
orescence intensity may go up to 108 . The lower SYTO-13 tal particle concentrations in Fig. 3a show particle concentra-
fluorescence intensity of the atmospheric populations may be tions declined during rain episodes (during or post rain: e.g.,
related to genetic material degradation from exposure to at- 15, 16, 28, 29, and 30 April) as wet removal of PBAP is most
mospheric stressors; depending on the physiological charac- efficient. However, during dry (no rain) episodes total parti-
teristics of each population (Zhen et al., 2013; Amato et al., cle concentrations built up in the atmosphere. To better un-
2015). Our results also agree with Guindulain et al. (1997), derstand the day-to-day variability of different FBAP types,
showing that E. coli overnight cultures have higher SYTO-13 the seven Perring et al. (2015) FBAP categories (i.e., types A,
fluorescence intensity than starved E. coli populations. Over- B, C, AB, AC, BC, and ABC) were studied plus the NON-
all, FCM pure culture results suggest that microbes starve in FBAP type constituting particles that do not fluoresce in any
the atmosphere, leading to a possible reduction or leakage of channel (e.g., channels A, B, and C). NON-FBAP concen-
the amount genetic material enclosed within each cell. Sam- trations are 1 order of magnitude higher than FBAP concen-
pling can also stress cells, even disrupt the wall/membrane trations, and NON-FBAP hence traced WIBS total particles
of the cell, and lead to genetic material leakage (Zhen et al., throughout all sampling events (Fig. 3a). Total FBAP con-
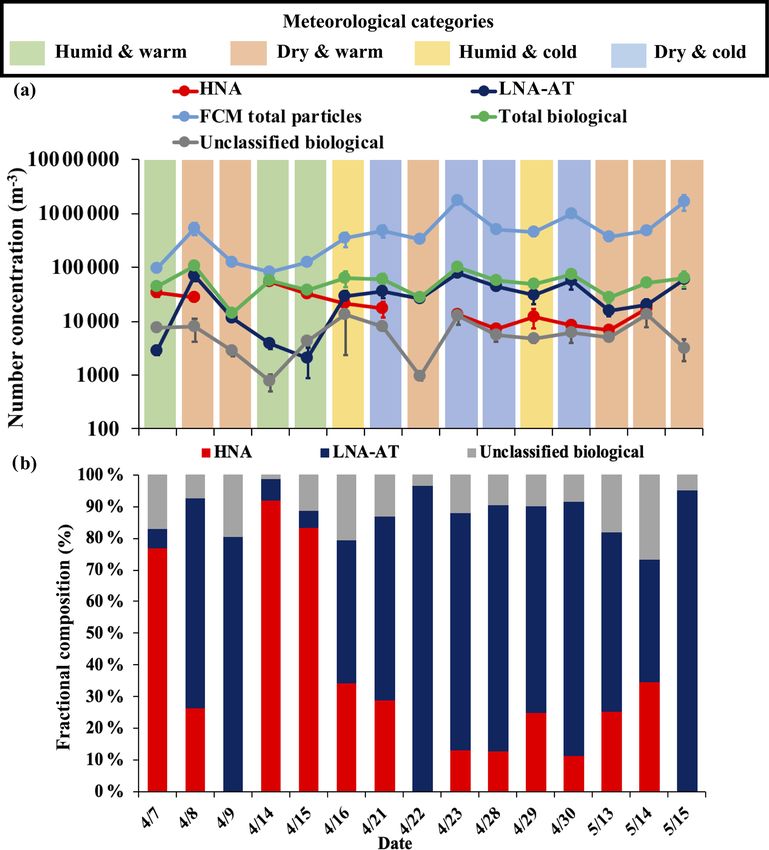
2013). centrations also show similar behavior to the total particle
Pollen, HNA, and LNA-AT atmospheric populations concentration (Fig. 3a), which suggests that non-biological
showed different SYTO-13 fluorescence intensities. Pollen particles can be biasing the total FBAP concentration. The
showed the highest fluorescence intensity, followed by the variability of the total FBAP concentration is mainly linked
www.atmos-chem-phys.net/20/1817/2020/ Atmos. Chem. Phys., 20, 1817–1838, 2020You can also read