OVERVIEW OF THE FIRST HYMEX SPECIAL OBSERVATION PERIOD OVER ITALY: OBSERVATIONS AND MODEL RESULTS - CORE
←
→
Page content transcription
If your browser does not render page correctly, please read the page content below
Hydrol. Earth Syst. Sci., 18, 1953–1977, 2014
www.hydrol-earth-syst-sci.net/18/1953/2014/
doi:10.5194/hess-18-1953-2014
© Author(s) 2014. CC Attribution 3.0 License.

Overview of the first HyMeX Special Observation Period over Italy:
observations and model results
R. Ferretti1 , E. Pichelli1 , S. Gentile1 , I. Maiello1 , D. Cimini2,1 , S. Davolio3 , M. M. Miglietta4 , G. Panegrossi5 ,
L. Baldini5 , F. Pasi6,10 , F. S. Marzano1,7 , A. Zinzi8 , S. Mariani9 , M. Casaioli9 , G. Bartolini10 , N. Loglisci11 ,
A. Montani12 , C. Marsigli12 , A. Manzato13 , A. Pucillo13 , M. E. Ferrario14 , V. Colaiuda1 , and R. Rotunno15
1 CETEMPS,      Department of Physics, University of L’Aquila, L’Aquila, Italy
2 Institute of Methodologies for Environmental Analysis, CNR IMAA, Potenza, Italy
3 Institute of Atmospheric Sciences and Climate, CNR ISAC, Bologna, Italy
4 Institute of Atmospheric Sciences and Climate, CNR ISAC, Lecce, Italy
5 Institute of Atmospheric Sciences and Climate, CNR ISAC, Rome, Italy
6 Institute of Biometeorology, CNR IBIMET, Florence, Italy
7 Department of Information Engineering, Electronics and Telecommunications DIET, Sapienza University, Rome, Italy
8 ASI Science Data Center (ASDC), Rome, INAF-OAR, Monte Porzio Catone (Rome) Italy, University of Naples

“Parthenope”, Naples, Italy
9 Institute for Environmental Protection and Research, ISPRA, Rome, Italy
10 LaMMA Consortium, Florence, Italy
11 ARPA Piemonte – Weather Forecasting Department, Turin, Italy
12 ARPA Emilia Romagna – SIMC, Bologna, Italy
13 ARPA Friuli Venezia Giulia – OSMER, Visco (Udine), Italy
14 ARPA Veneto, Servizio Meteorologico, Teolo (Padua), Italy
15 NCAR, Boulder, (CO), USA

Correspondence to: R. Ferretti (rossella.ferretti@aquila.infn.it)

Received: 31 July 2013 – Published in Hydrol. Earth Syst. Sci. Discuss.: 23 September 2013
Revised: 3 April 2014 – Accepted: 9 April 2014 – Published: 26 May 2014

Abstract. The Special Observation Period (SOP1), part of             Observation Periods (IOPs) are described. A significant event
the HyMeX campaign (Hydrological cycle in the Mediter-               for each Italian target area is chosen for this analysis: IOP2
ranean Experiments, 5 September–6 November 2012), was                (12–13 September 2012) in northeastern Italy, IOP13 (15–
dedicated to heavy precipitation events and flash floods             16 October 2012) in central Italy and IOP19 (3–5 Novem-
in the western Mediterranean, and three Italian hydro-               ber 2012) in Liguria and Tuscany. For each IOP the mete-
meteorological monitoring sites were identified: Liguria–            orological characteristics, together with special observations
Tuscany, northeastern Italy and central Italy. The extraordi-        and weather forecasts, are analyzed with the aim of high-
nary deployment of advanced instrumentation, including in-           lighting strengths and weaknesses of the forecast modeling
strumented aircrafts, and the use of several different opera-        systems, including the hydrological impacts. The usefulness
tional weather forecast models, including hydrological mod-          of having different weather forecast operational chains char-
els and marine models, allowed an unprecedented monitoring           acterized by different numerical weather prediction models
and analysis of high-impact weather events around the Ital-          and/or different model set up or initial conditions is finally
ian hydro-meteorological sites. This activity has seen strong        shown for one of the events (IOP19).
collaboration between the Italian scientific and operational
communities. In this paper an overview of the Italian or-
ganization during SOP1 is provided, and selected Intensive

Published by Copernicus Publications on behalf of the European Geosciences Union.
1954 R. Ferretti et al.: First HyMeX Special Observation Period over Italy
Figure 1. HyMeX target areas (TA) in the Mediterranean basin
and hydro-meteorological sites. Liguria–Tuscany (LT), northeast-
ern Italy (NEI) and central Italy (CI) are located within the Italian
territory. After Ducrocq et al.,2010
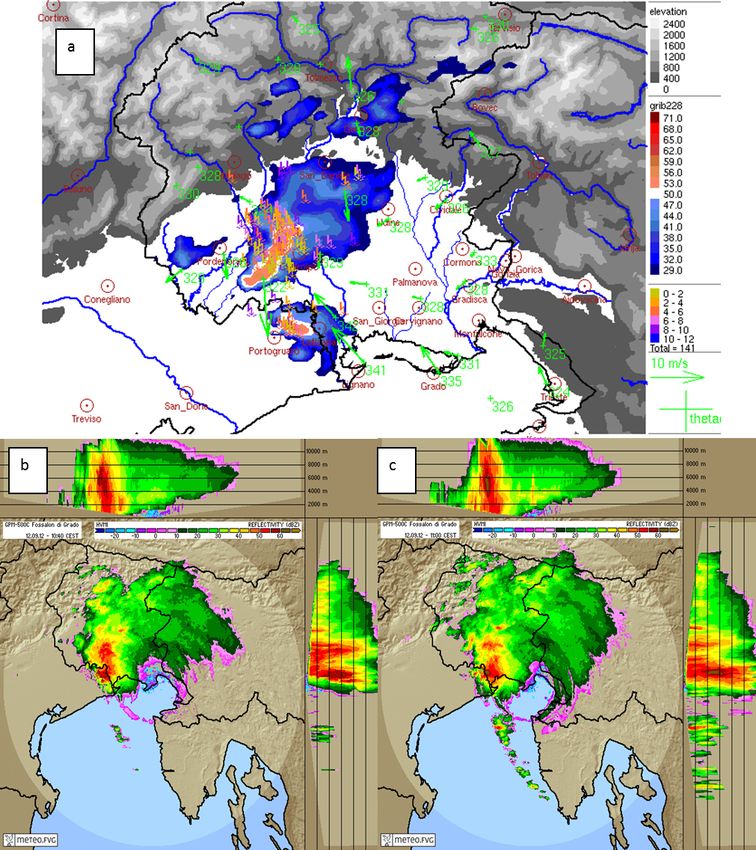
Figure 2. Synoptic analysis over the western Mediterranean region
1 Introduction at 06:00 UTC, 12 September 2012: ECMWF 500 hPa geopotential
height (green lines), 700 hPa temperature advection (red warm and
The HYdrological cycle in the Mediterranean Experiment blue cold), MSG SEVIRI AirMass RGB composite EumetSat prod-
(HyMeX, http://www.hymex.org; Drobinski et al., 2013) uct and enhanced IR 10.8 µm temperature, ranging between 200 K
is an international experimental program that aims to ad- (red) and 240 K (blue). Source: http://www.eumetrain.org.
vance scientific knowledge of water cycle variability in the
Mediterranean basin. This goal is pursued through monitor-
ing, analysis and modeling of the regional hydrological cycle sponsible for most of the heavy precipitation and flood events
in a seamless approach. Its multidisciplinary research activ- affecting the Italian territory, which can be related to specific
ity investigates phenomena on different temporal and spa- large-scale patterns (Tartaglione et al., 2009). For example,
tial scales, from the inter-annual/decadal variability of the the severe weather events that occurred over the Alps in re-
Mediterranean coupled system (atmosphere–land–ocean) to cent years (Rotunno and Houze, 2007; Mariani et al., 2009;
the single event of severe weather. In this context special Barbi et al., 2012) or in Liguria and Lazio during the au-
emphasis is given to the topics of Special Observation Pe- tumn of 2011 (Buzzi et al., 2012; Ferretti et al., 2012; Par-
riod (SOP1), that is the occurrence of heavy precipitation and odi et al., 2012; Rebora et al., 2013), are directly (e.g., by
floods, and the associated impacts on society. orographic precipitation) or indirectly (e.g., by cyclogenesis:
The intense sea–atmosphere interactions were the specific see Tibaldi et al., 1990) related to the influence of mountain
topic of SOP2, which is not addressed in this paper. The ranges on atmospheric motions. The steep slopes of the Alps
characteristics of the Mediterranean region, a nearly closed and the Apennines in the vicinity of large coastal areas of the
basin surrounded by both highly urbanized and complex ter- Mediterranean, and the sea itself that acts as a large source
rain close to the coast, makes the Mediterranean area prone of moisture and heat, are the key factors in determining the
to natural hazards related to the water cycle. These are the convergence and the rapid uplift of moist and unstable air re-
reasons for improving our understanding and the predictabil- sponsible for triggering condensation and convective insta-
ity of hydro-meteorological hazards in this region. In par- bility processes (Benzi et al., 1997; Rotunno and Ferretti,
ticular, during the autumn season, when the sea is still rel- 2001). Heavy rainfall events are often associated with the
atively warm, the large thermal gradient between the atmo- development of intense convective systems (Davolio et al.,
sphere and the sea favors intense heat and moisture fluxes 2009; Melani et al., 2012), which are still not completely un-
(Duffourg and Ducrocq, 2011, 2013), which are the energy derstood and are notoriously difficult to predict (Weisman et
source for storms. That is why the Mediterranean is often al., 2008; Ducrocq et al., 2008; Bresson et al., 2012; Migli-
affected by heavy rainfall and floods in autumn, which are etta and Rotunno, 2012). Moreover, within several small
responsible for most of the natural disasters in the region. and densely urbanized watersheds with steep slopes, which
Hence the interest in improving knowledge and forecasting characterize the Italian area, precipitation events that persist
of disastrous severe weather events is clear for both scien- over the same area for several hours can become devastating
tific research and operational activities. Consistent with the floods in a relatively short time (Silvestro et al., 2012; Vulpi-
HyMeX program, within the Western Mediterranean Target ani et al., 2012). In addition, it is worth recalling that the
Area (TA) three hydro-meteorological sites were identified national socio-economic impact of these kinds of events is
over Italy (Fig. 1): Liguria–Tuscany (LT), northeastern Italy quite important, as indicated by the number of casualties and
(NEI) and central Italy (CI). These sites were selected be- damages reported (see, e.g., Guzzetti et al., 2005; Lastoria et
cause they have weather systems representative of those re- al., 2006; Salvati et al., 2010, and references therein).
Hydrol. Earth Syst. Sci., 18, 1953–1977, 2014 www.hydrol-earth-syst-sci.net/18/1953/2014/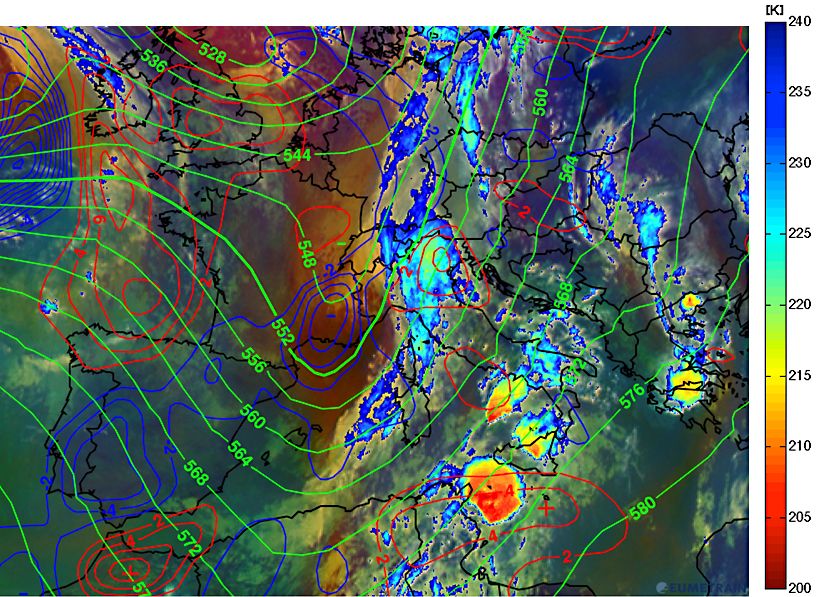
R. Ferretti et al.: First HyMeX Special Observation Period over Italy                                                      1955

   A key component of HyMeX is the experimental activ-             2     HyMeX SOP1 activity in Italy: observations and
ity based on atmospheric, oceanic and hydrological monitor-              models
ing for a period of ten years, from 2010 to 2020. Within this
time frame, shorter periods of intensive monitoring, named         This section summarizes the instrumentation collecting ob-
Special Observation Periods (SOPs), were planned. The first        servations and the forecasting modeling chains producing
field campaign, SOP1 (Ducrocq et al., 2014), dedicated to          numerical weather predictions during SOP1 in Italy. It must
heavy precipitation and flash floods, took place in autumn         be noted that these include both operational and research in-
2012 (5 September–6 November) over the western Mediter-            strumentation/models in some cases specifically deployed or
ranean. The second field campaign, named SOP2, was ded-            implemented for SOP1.
icated to intense air–sea exchanges and dense water for-
mation, and took place in winter 2013 (February–March).            2.1    Observations
SOP1 was characterized by an extraordinary deployment of
advanced instrumentation, including instrumented aircrafts.        Three hydro-meteorological sites of interest were identi-
In order to prevent or reduce societal losses, progress in         fied over Italy (Fig. 1) in the HyMeX Implementation Plan
the monitoring of and predictive capability for these se-          (Ducrocq et al., 2010). The CI hydro-meteorological site is
vere events are needed. This requirement represented the           located at the eastern boundary of the HyMeX North West
strong motivation that resulted in the large and active par-       Mediterranean TA and at the western boundary of the Adri-
ticipation of the Italian community in the first HyMeX SOP.        atic TA (Fig. 1, CI). The area is densely populated and in-
The activities carried out during the field campaign as well       cludes the urban area of Rome, with 4 million inhabitants.
as those planned for the upcoming years represent an im-           The orography of CI is quite complex, going from sea level
portant opportunity for exploiting the synergy between a           to nearly 3000 m in less than 150 km. The CI area involves
unique database of observations and model simulations, for         many rivers, including two major basins: the Aniene–Tiber
the study of intense orographic precipitation. Therefore, im-      basin (1000 km long) and the Aterno–Pescara basin (300 km
provements in the knowledge and forecasting ability of high-       long), respectively on the western and eastern side of the
impact weather events are expected in the near future. The         Apennines ridge. The instrumentation deployed over the CI
present study represents a first step towards understanding        area belongs to several institutions, including the CEnter
the scientific issues and coordinating the activity of the large   of integration of remote sensing TEchniques and numerical
Italian scientific and operational communities in the field.       Modeling for the Prediction of Severe weather (CETEMPS),
   In this paper SOP1 is presented together with some results.     the National Department of Civil Protection (DPC), the De-
The aim of the paper is twofold:                                   partment of Information Engineering, Sapienza University
                                                                   of Rome (DIETSap), the Institute of Atmospheric Sciences
  – to provide a scientific overview of the events that af-        and Climate of the National Research Council of Italy (CNR
    fected the Italian area during SOP1 (Sect. 3) highlight-       ISAC), HIMET (High Innovation in Meteorology and En-
    ing the hydrological response to the heavy precipitation       vironmental Tech., L’Aquila), the University of Ferrara, the
    as well as the full forecast chain (meteo–hydro) and the       National Observatory of Athens (NOA), the US National
    socio-economic impact;                                         Aeronautics and Space Agency (NASA), the Abruzzo Re-
  – to investigate the response of the different operational       gional Government (RegAb), and finally the Italian National
    chains to extreme events for three case studies.               Agency for New Technologies, Energy and Sustainable Eco-
                                                                   nomic Development (ENEA). The instrumentation deployed
Extraordinary monitoring activities, an outstanding number         over the CI area during SOP1 is summarized in Table 1. Part
of implemented weather forecasting modeling chains, and            of this instrumentation is permanent and run operationally.
one meteo–hydro and two meteo–hydro–marine chains are              Conversely, several instruments were specifically deployed
described in Sect. 2, highlighting the large Italian commu-        for the period of SOP1 as a consequence of specific inter-
nity effort for the field campaign in terms of coordination        national agreements, such as with NASA and NOA. These
and logistics. The paper by Davolio et al. (2014) describes        include an X-band polarimetric mini-radar, a K-band micro-
the organizational efforts and activities of the Italian scien-    rain radar and several disdrometers of three kinds, namely,
tific and operational communities at the Virtual Operational       a 2-D video disdrometer, PLUDIX, and laser Parsivel-2
Center, hosted by CETEMPS in L’Aquila during the HyMeX             disdrometers (see Table 1).
SOP1 campaign, and the consequent impacts in the context              The LT hydro-meteorological site is located at the east-
of the peculiar organization of meteorology in Italy.              ern boundary of the HyMeX North West Mediterranean TA
    The SOP1 IOPs are presented in Sect. 3 together with ob-       (Fig. 1), in a coastal region where the Alpine–Apennine
servations and forecast results for three selected IOPs. Per-      chain is close to the Mediterranean Sea. The high elevation
spectives for future work are given in Sect. 4.                    of the mountains – more than 2000 m a.m.s.l. (above mean
                                                                   sea level) – at a few tens of kilometers from the coast illus-
                                                                   trates the complex orography of this area, with many densely

www.hydrol-earth-syst-sci.net/18/1953/2014/                                      Hydrol. Earth Syst. Sci., 18, 1953–1977, 2014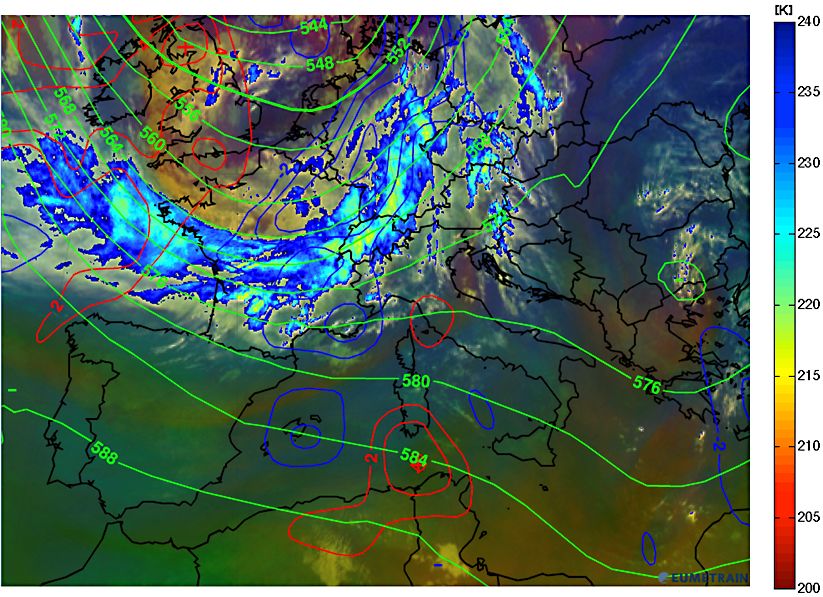
1956                                                      R. Ferretti et al.: First HyMeX Special Observation Period over Italy

Table 1. Instrumentation deployed over the CI area during SOP1 (in parentheses the responsible institutions).

                     Radars           – 1 C-band single-polarization radar, Monte Midia, Abruzzo (CETEMPS,
                                      RegAb)
                                      – 1 C-band polarimetric radar, Il Monte, Abruzzo (DPC)
                                      – 1 C-band single-polarization radar, Monte Serano, Umbria (DPC)
                                      – 1 C-band dual-polarization radar, ISAC Atmospheric Observatory, Rome
                                      (CNR ISAC)
                                      – 1 X-band single-polarization radar, Rome (DIETSap)
                                      – 1 X-band polarimetric mini-radar, L’Aquila (HIMET, CETEMPS)
                                      – 1 X-band polarimetric mini-radar, Rome (HIMET)
                     Rain gauges      ∼ 200 telemetered rain gauges and thermometers (Regional authorities)
                     Disdro           – 1 Parsivel laser disdrometer (DIETSap)
                     meters           – 1 Parsivel laser disdrometer (CNR ISAC)
                                      – 1 K-band micro-rain radar in Rome (DIETSap, NASA)
                                      – 1 bidimensional video-disdrometers 2DVD in Rome (DIETSap, NASA)
                                      – 2 PLUDIX disdrometers at DIETSap and CNR ISAC (University of Ferrara)
                                      – 5 Parsivel-2 laser disdrometers (Pescara, L’Aquila, Avezzano, CNR ISAC,
                                      CNR-INSEAN) (NASA)
                     Soundings        – 1 research sounding station at L’Aquila (CETEMPS)
                                      – 1 tether sounding (CNR ISAC)
                                      – 1 operational sounding site at Pratica di Mare, Rome (CNMCA, Air Force)
                     Other            – 1 Raman lidar and 1 ceilometer, located in L’Aquila (CETEMPS)
                                      – 1 meteo station and VLF lightning sensor in Rome (DIETSap)
                                      – 2 SODAR (CNR ISAC) at the ISAC Atmospheric Observatory and in the
                                      Castel Porziano Presidential Park
                                      – Micrometeorological surface layer sensors (CNR ISAC)
                                      – AWS surface station (CNR ISAC)
                                      – 1 aerosol lidar and 1 ceilometer (CNR ISAC)
                                      – 3 sunphotometers (CNR ISAC)
                                      – 1 microwave radiometer (CNR ISAC)
                                      – LINET VLF/LF lightning detection network station (CNR ISAC)
                                      – Weather station near Rome (ENEA)

populated catchments characterized by steep slopes and lim-             rized in Table 3 and belongs to several institutions, including
ited extents. The Liguria Region Meteo Hydrological Ob-                 OSMER – ARPA FVG, Ufficio Idrologico of Bolzano, Me-
servatory (OMIRL) deployed a ground observation opera-                  teoTrentino, ARPAV – Servizio Meteorologico, Areonautica
tional network that includes meteorological parameter sen-              Militare, and Regional Civil Protection in Friuli Venezia Giu-
sors. ARPA Piemonte and ARPA Liguria manage the C-dual                  lia. Most of the instruments run operationally, whereas a few
band radar. Over Tuscany, the Hydrological Service, Con-                of them were specifically deployed for the period of SOP1,
sorzio LaMMA, and DPC manage a dense network of mete-                   including the mobile X-band polarimetric radar from NOA, a
orological stations. All the instruments over the LT area were          K-band micro-rain radar from NASA, and five disdrometers
operational during SOP1 and the Intensive Observation Peri-             of two kinds (2DVD and Parsivel) from NOA.
ods (IOPs), and they are summarized in Table 2.                            For the whole Italian territory and the three hydro-
   The northeastern Italy hydro-meteorological site covers an           meteorological sites in particular, measurements from the
area of almost 40 000 km2 , including three regions (Veneto,            LINET VLF/LF lightning detection network (Betz et al.,
Trentino-Alto Adige, and Friuli Venezia Giulia; Fig. 1, NEI),           2009) with 12 sensors located in Italy were made available by
and is characterized by a multiple river system with the                CNR ISAC (Rome branch), providing high-precision three-
longest rivers of Italy (Po and Adige), a wide flood plain              dimensional location and time of occurrence of intra-cloud
area, and the eastern Alpine range. The orography in this               and cloud-to-ground strokes in real time during the IOPs
region has a steep terrain with mountain peaks of nearly                discussed below.
4000 m a.m.s.l., and this type of variable terrain plays a ma-             During the campaign, DPC made available approximately
jor role in extreme meteorological events. The instrumen-               2600 rain gauges in real time; most of them were opera-
tation deployed over the NEI area during SOP1 is summa-                 tional over Italy, producing an exceptionally well-distributed

Hydrol. Earth Syst. Sci., 18, 1953–1977, 2014                                          www.hydrol-earth-syst-sci.net/18/1953/2014/
R. Ferretti et al.: First HyMeX Special Observation Period over Italy                                                                 1957

Table 2. Instrumentation deployed over the LT area during SOP1 (in parentheses the responsible institutions).

             Radars          – 1 C-band dual polarization radar, Monte Settepani, Liguria (ARPA Piemonte & ARPA Liguria)
                             – 1 C-band single-polarization radar, Monte Crocione, Tuscany (DPC)
             Rain gauges     ∼ 520 telemetered rain gauges (Consorzio LaMMA, OMIRL)
             Soundings
             Other           – 1 RASS (radio acoustic sounding system), Florence (Consorzio LaMMA)
                             – 45 stream level gauges (OMIRL)
                             – 131 hydrometers (Consorzio LaMMA)
                             – 190 thermometers (Consorzio LaMMA)
                             – 209 anemometers (Consorzio LaMMA)
                             – 156 hygrometers (Consorzio LaMMA)
                             – 21 barometers (Consorzio LaMMA)

Table 3. Instrumentation deployed over the NEI area during SOP1 (in parentheses the responsible institutions). FVG stands for Friuli Venezia
Giulia.

              Radars           – 1 C-band dual-polarization radar, Fossalon di Grado, FVG (FVG Regional Civil Protection)
                               – 1 C-band single-polarization radar, Monte Macaion, Trentino-Alto Adige (Meteotrentino)
                               – 1 C-band single-polarization radar, Monte Grande, Veneto (ARPAV)
                               – 1 C-band single-polarization radar, Concordia Sagittaria, Veneto (ARPAV)
                               – 1 mobile X-band polarimetric radar, Trafoi, Trentino-Alto Adige (NOA)
              Rain gauges      ∼ 400 telemetered tipping bucket rain gauges (FVG Regional Civil Protection, ARPAV)
              Disdrometers     – 5 disdrometers: 3 Parsivels, 1 2DVD (NOA) and 1 micro-rain radar (NASA)
              Soundings        – 1 operational sounding site at Campoformido, Udine (CNMCA)
              Other            – 2 microwave radiometers in Padua and Rovigo (ARPAV)
                               – 4 SODAR (ARPA Veneto)
                               –55 hydrometric stations (FVG Regional Civil Protection, ARSO Slovenia)

coverage for the rain measurements (see Fig. 2 in Davolio et               – SAFIRE FALCON 20 (France) (F20 hereinafter)
al., 2014). Such a richness of surface stations had never been
available before in a monitoring and forecasting campaign.                      – Payloads: RASTA radar, cloud microphysics
   To complement the ground-based observations, instru-                           sensors, dropsondes
mented aircrafts were deployed by the HyMeX international
                                                                           – SAFIRE ATR-42 (France)
team. This is a crucial element of the HyMeX observational
strategy for various reasons: (i) heavy precipitation events                    – Water vapor lidar, cloud microphysics sensors,
(HPE) may occur outside the hydro-meteorological sites and                        aerosol probe
may not be adequately observed without aircraft, (ii) HPE are
often related to offshore events and/or synoptic-scale systems             – KIT 128 (Germany) (DO128 hereinafter)
extending at least partially over the sea, (iii) in situ measure-
ments are critically needed to assess and/or validate some                      – In situ sensors, turbulent fluxes, radiation,
of the products derived from the ground-based observation                         dropsondes
systems, (iv) while ground-based systems provide continu-
ity in time, aircraft allow high temporal and spatial resolu-           The DO128 and ATR42 were used to sample the upwind
tion measurements. Therefore, three instrumented aircrafts              low-level flow, focusing on the pre-convective environment
were deployed by the HyMeX French and German teams,                     during the initiation phase. The F20 was used to observe the
and thus airborne measurements were available occasionally              precipitating systems during the mature phase with its micro-
during IOPs over Italy. The following aircraft were available           physical probes and radar systems.
for the North Western Mediterranean TA:                                    Within the northwestern Mediterranean domain, the
                                                                        airspace is controlled by several distinct authorities with dif-
                                                                        ferent constraints with respect to the HyMeX aircraft flights.
                                                                        Well in advance of SOP1, the procedures for each aircraft

www.hydrol-earth-syst-sci.net/18/1953/2014/                                           Hydrol. Earth Syst. Sci., 18, 1953–1977, 2014
1958                                                   R. Ferretti et al.: First HyMeX Special Observation Period over Italy

were defined with the respective air traffic control authorities   is the result of a joint effort between different research in-
(HyMeX Operation Plan SOP1, 2012). In the flight informa-          stitutes coordinated by the National Center for Atmospheric
tion regions (FIR) over Italy, these included four flight plans    Research (NCAR, http://www.wrf-model.org). It solves the
for ATR42 and two flight plans for F20, while twelve flight        fully compressible, non-hydrostatic Euler equations, using
patterns for the DO128 over Corsica (within the French FIR)        the terrain-following, hydrostatic-pressure vertical coordi-
were also of some interest for soundings of the upstream flow      nate with vertical grid stretching. It is based on time-split in-
over Italy.                                                        tegration using a second- or third-order Runge–Kutta scheme
                                                                   with smaller time steps for acoustic and gravity-wave modes.
2.2     Numerical weather prediction models                        The horizontal grid is a staggered Arakawa-C. A variety of
                                                                   schemes are provided for the model physics. For further de-
In the framework of HyMeX SOP1 a common platform has               tails, the reader is referred to Skamarock et al. (2008).
been implemented to upload products from different nu-                CETEMPS, CNR ISAC and Consorzio LaMMA use
merical weather prediction (NWP) and hydrological models           WRF-ARW, but different operational chains are imple-
(available online at http://sop.hymex.org). These have been        mented. A nest-down configuration with two domains run-
a fundamental means for the forecasting activity during the        ning independently and 37 vertical levels, with the first
campaign, allowing for planning with adequate advance no-          level at approximately 30 m above the ground and unequally
tice the observation strategy of the events of interest.           spaced distribution to achieve higher density in the PBL,
   The Italian community made available several models in          is used at CETEMPS (http://skynet.phys.uniroma1.it/Main_
use by the different groups participating in the experiment.       index.htm). The low-resolution domain (12 km) covers Italy
This provided the possibility of having many products avail-       and part of the Mediterranean basin; it is initialized us-
able to refer to during the forecasting phase at the Italian       ing ECMWF analysis at 0.125 degrees. The highest reso-
operational center organized in L’Aquila that supported the        lution domain (3 km) covers Italy and is initialized by the
HyMeX Operational Center (HOC) in Montpellier (France),            WRF simulation at 12 km. The new Thompson microphysics
as well as to compare performances of different models and         scheme with six different hydrometeor categories is used
thus investigate their strengths or deficiencies.                  (Thompson et al., 2008) together with a Mellor–Yamada 2.5
   The abundance of operational weather prediction models          turbulence closure scheme (Janjic, 2002; Mellor and Ya-
turned out to be of great help especially for the most diffi-      mada, 1982) for the planetary boundary layer (PBL) pa-
cult task, i.e., making decisions on the take-off time for the     rameterization. No cumulus parametization is used at the
flights measuring hydro particles in well-developed convec-        finer resolution. Details of the chain configuration are in Ta-
tive cells.                                                        ble 4. Moreover, specifically for the campaign, the output
   Basically three different weather forecast operational          of WRF-ARW was used to force the Cetemps Hydrologi-
chains based on the following high-resolution models were          cal model (CHyM, Coppola et al., 2007), implemented over
used: the Advanced Research version of the Weather Re-             several major Italian river catchments. This meteorological–
search and Forecasting (WRF-ARW) used by CETEMPS                   hydrological model chain was used operationally to issue se-
(WRF-CETEMPS), by CNR ISAC (WRF-ISAC) and by                       vere weather and hydrological alerts. For example, the severe
LaMMA (WRF-LaMMA); the BOlogna Limited Area                        conditions forecast for 14 September, which one day ahead
Model (BOLAM) and the MOLOCH model both used by                    led to a call for the IOP4 briefly described in the next section,
CNR ISAC (respectively BOLAM-ISAC and MOLOCH-                      caused major flash floods in central Italy.
ISAC), by ISPRA (respectively BOLAM-ISPRA and                         Two daily runs (00:00 and 12:00 UTC) with a two-domain,
MOLOCH-ISPRA) and by ARPA Liguria; and the COSMO                   one-way nested configuration initialized using GFS forecasts
model used by ARPA – SIMC producing the only limited-              are operational at CNR ISAC. The parent domain has a hor-
area ensemble forecasts available for Italy. In addition, one      izontal resolution of 15 km, 3 km for the innermost one; 40
meteo–hydro chain and two hydro–meteo–marine chains                vertical levels are used with the first level at approximately
were operational during the campaign forced by WRF-ARW             25 m above the ground and unequally spaced distribution to
and BOLAM output, respectively.                                    achieve higher density in the PBL. The same microphysical
   A short description of the model characteristics and the        and boundary layer schemes as WRF-CETEMPS are used.
different implementation schemes used during SOP1 is given         The Kain (2004) cumulus parameterization is used only for
in the next sections.                                              the coarser grid (http://meteo.le.isac.cnr.it), that is, no cumu-
                                                                   lus convective scheme is used for the innermost domain.
2.2.1    WRF-ARW                                                      At Consorzio LaMMA two independent configurations
                                                                   are run daily at 12 and 3 km resolutions. The coarse do-
Several operational chains using the WRF-ARW model were            main (configuration 1 in Table 4) is initialized at 00:00
implemented during HyMeX; they differ either by physical           and 12:00 UTC using GFS analysis and the boundary con-
model configuration or domains and resolution. The WRF-            ditions are upgraded every 6 h. The domain covers cen-
ARW model is a numerical weather prediction system that            tral Europe (200 × 300 grid points); 40 vertical levels and

Hydrol. Earth Syst. Sci., 18, 1953–1977, 2014                                    www.hydrol-earth-syst-sci.net/18/1953/2014/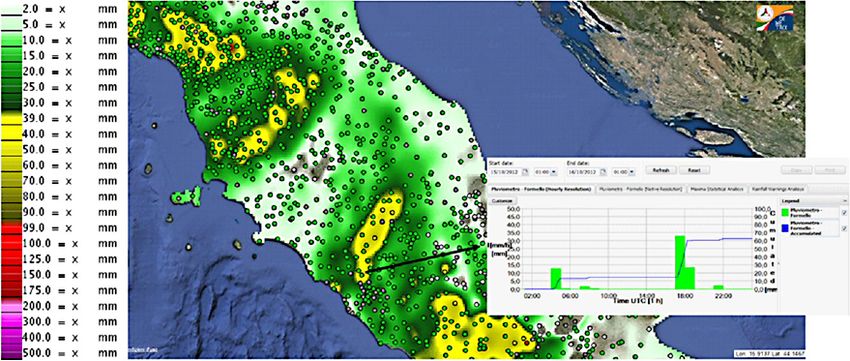
R. Ferretti et al.: First HyMeX Special Observation Period over Italy                                                                   1959

Table 4. Summary of the main characteristics of the model chains used by the different institutions for SOP1. The COSMO number of mem-
bers is given in the brackets. The last column indicates whether the model calculates the convection explicitly (“Yes”) or uses a convective
scheme (“No”).

                                           Grid   Initial                       Boundary                       Forecast         Explicit
  Model [Chain]                    spacing (km)   conditions                    conditions                      range          convection
  WRF-CETEMPS [1]                            12   ECMWF 12:00 UTC               ECMWF forecasts                 96 h              No
  WRF-CETEMPS [1]                             3   WRF 12 km 00:00 UTC           WRF 12 km forecasts             48 h              Yes
  WRF-ISAC [1 & 2]                           15   GFS 00:00 & 12:00 UTC         GFS forecasts                   48 h              No
  WRF-ISAC [1 & 2]                            3   GFS 00:00 & 12:00 UTC         WRF 15 km forecasts             48 h              Yes
  WRF-LAMMA [1]                              12   GFS 00:00 & 12:00 UTC         GFS forecasts                   120 h             No
  WRF-LAMMA [2]                               3   ECMWF 00:00 & 12:00 UTC       ECMWF forecasts                 60 h              Yes
  BOLAM-ISAC [1]                             11   GFS 00:00 UTC                 GFS forecasts                   72 h              No
  MOLOCH-ISAC [1]                           2.3   BOLAM 03:00 UTC               BOLAM forecasts                  45 h             Yes
  BOLAM-ISAC [2]                              9   GFS 18:00 UTC                 GFS forecasts                   54 h              No
  MOLOCH-ISAC [2]                           1.5   BOLAM 00:00 UTC               BOLAM forecasts                  48 h             Yes
  BOLAM-ISPRA [1]                            33   ECMWF 12:00 UTC of d-1        ECMWF forecasts          84 h (+12 to +96 h)      No
  BOLAM-ISPRA [1]                            11   BOLAM 00:00 UTC               BOLAM forecasts                  84 h             No
  BOLAM-ISPRA [2]                           7.8   ECMWF 12:00 UTC of d-1        ECMWF forecasts          48 h (+12 to +60 h)      No
  MOLOCH-ISPRA [2]                          2.5   BOLAM 00:00 UTC               BOLAM forecasts                  48 h             Yes
  COSMO-LEPS (members: 16)                    7   ECMWF-EPS members             ECMWF-EPS members               132 h             No
                                                  (00:00 and 12:00 UTC)
  COSMO-H2-EPS (members: 10)                2.8   COSMO-LEPS members            COSMO-LEPS members               36 h             Yes
                                                  (12:00 UTC)

a convective scheme are used; it provides 120 h forecasts.              mented in BOLAM for cumulus convection, whereas con-
The fine-resolution domain (3 km) is initialized at 00:00 and           vection is explicitly computed in MOLOCH. Further de-
12:00 UTC using ECMWF high-resolution (0.125◦ ) analysis                tails are available at http://www.isac.cnr.it/dinamica/projects/
and the boundary conditions are upgraded every 6 h. It cov-             forecasts.
ers the Italian area (400 × 440 grid points) using 35 equally              Several forecasting chains based on BOLAM–MOLOCH
spaced vertical levels, the first level being at 35 m; no con-          have been implemented for SOP1. At CNR ISAC two dif-
vective scheme is used at this resolution. The same micro-              ferent chains, having different horizontal grid spacings (Ta-
physical and boundary layer schemes as WRF-CETEMPS                      ble 4), were initialized at 18:00 and 00:00 UTC, both driven
are used. The 3 km domain provides a 60 h forecast (http:               by the GFS global model. At ISPRA, a BOLAM–MOLOCH
//www.lamma.rete.toscana.it/meteo/modelli).                             chain was specifically implemented for SOP1 (Table 4).
                                                                        This chain was initialized using 0.15◦ ECMWF analyses and
2.2.2   BOLAM and MOLOCH                                                forecasts at 12:00 UTC. In addition, the ISPRA chain cur-
                                                                        rently operational within the SIMM (Sistema Idro-Meteo-
The BOLAM hydrostatic model (Buzzi et al., 1994; Mal-                   Mare) forecasting system (Speranza et al., 2007; Casaioli et
guzzi and Tartaglione, 1999) and the MOLOCH non-                        al., 2013b; http://www.isprambiente.gov.it/pre_meteo/simm.
hydrostatic model (Malguzzi et al., 2006) were developed                html) was also provided. This chain is based on BOLAM us-
at CNR ISAC and together constitute a forecasting chain,                ing two (one-way) nested domains (Table 4) and is driven
with MOLOCH nested (one-way) into BOLAM. The hori-                      by ECMWF analysis at 0.5◦ resolution at 12:00 UTC. Al-
zontal grid is a staggered Arakawa-C; MOLOCH integrates                 though different, all the BOLAM domains deployed in the
the fully compressible set of equations, with an explicit rep-          ISPRA chains include the whole Mediterranean basin. Both
resentation of convective phenomena, deploying a hybrid                 ISAC-CNR and ISPRA meteorological suites were also used
terrain-following coordinate, relaxing smoothly to horizon-             to force two versions of the Shallow water HYdrodynamic
tal surfaces. Fifty vertical levels are used with the first one         Finite Element Model (SHYFEM, Umgiesser et al., 2004)
at 72 m above the ground with approximately eight layers                that were operational within the ISMAR-CNR KASSAN-
within the PBL.                                                         DRA (Ferrarin et al., 2012) and the ISPRA Hydro-Meteo-
   The physical schemes for the two models are almost the               Marine Forecasting System (SIMM), respectively, to produce
same for atmospheric radiation (a combination of the Ritter             storm surge forecasts for the Mediterranean Sea. In addi-
and Geleyn and ECMWF schemes), sub-grid turbulence (E-                  tion, outputs of the two ISPRA meteorological suites were
l closure), water cycle microphysics (Drofa and Malguzzi,               deployed for feeding the SIMM Mediterranean-embedded
2004), a soil model with vegetation, as well as the same 3-D            Costal WAve Forecasting system (Mc-WAF, Inghilesi et al.,
Eulerian weighted averaged flux (WAF) scheme for advec-                 2012), which has been operational since September 2012.
tion. The Kain–Fritsch parameterization scheme is imple-

www.hydrol-earth-syst-sci.net/18/1953/2014/                                           Hydrol. Earth Syst. Sci., 18, 1953–1977, 2014
1960                                                  R. Ferretti et al.: First HyMeX Special Observation Period over Italy

2.2.3    COSMO                                                    year to year and this variation is known as the NAO. The
                                                                  station-based index of the NAO has been based on the dif-
COSMO is the limited-area model used by the COSMO con-            ference in normalized sea level pressure (SLP) between Lis-
sortium (http://www.cosmo-model.org) and is based on the          bon, Portugal (or Ponta Delgada, Azores) and Stykkishol-
primitive hydro-thermodynamical equations for a compress-         mur/Reykjavik, Iceland since 1864. Through east–west os-
ible non-hydrostatic flow in a moist atmosphere with no scale     cillation motions of the Icelandic Low and the Azores High,
approximations (for an overview of COSMO, the reader is           it controls the strength and direction of westerly winds and
referred to Steppeler et al., 2003).                              storm tracks across the North Atlantic. A large difference in
   In the framework of HyMeX, two ensemble systems based          the pressure at the two stations (NAO+) leads to increased
on the COSMO model were provided by ARPA – SIMC:                  westerlies and, consequently, cool summers and mild and
    – COSMO-LEPS (COSMO Limited-area Ensemble Pre-                wet winters in central Europe and its surrounding Atlantic
      diction System) is the operational limited-area ensem-      area. If the index is low (NAO−), westerlies are suppressed.
      ble prediction system of the COSMO consortium, run-         Hence, central Europe and the surrounding areas suffer from
      ning on a daily basis since 2002 (Montani et al., 2011).    cold winters and storms tracks are shifted south toward the
      It is a convective-parameterized ensemble and is run        Mediterranean Sea, increasing storm activity and rainfall in
      twice a day (starting at 00:00 and 12:00 UTC) at 7 km       southern Europe and North Africa.
      using 40 vertical levels, with the first levels approxi-       During SOP1, a small positive or generally negative NAO
      mately 20 m above the ground, and a forecast range of       made the weather regime favorable for precipitating systems
      132 h. It is composed of 16 members, with initial and       over southern Europe, whereas Hurricane Nadine strongly
      boundary conditions taken from elements of ECMWF            reduced the long-term predictability for the first month of the
      EPS selected via a clustering analysis-selection tech-      campaign. From the water vapor supply point of view, all the
      nique.                                                      events were characterized by a prevailing cyclonic condition
                                                                  before the events. Based on Duffourg and Ducrocq (2011,
    – COSMO-H2-EPS (COSMO HyMeX 2.8 km Ensem-                     2013), the contribution to the water supply from the sea sur-
      ble Prediction System) is a research ensemble sys-          face evaporation is expected to be reduced with respect to
      tem designed for the HyMeX program (Marsigli et al.,        anticyclonic conditions.
      2013); COSMO-H2-EPS is an atmospheric convection-              During the campaign several troughs entered the western
      permitting ensemble (i.e., no convective scheme is used)    Mediterranean and swept through the Italian regions after
      and is run once a day (starting at 12:00 UTC) at 2.8 km     having affected Spain and/or France; only a few events pro-
      using 50 vertical levels, with the first level approxi-     duced cyclogenesis over the Gulf of Genoa or a deep trough
      mately 20 m above the ground, and a forecast range of       over the Tyrrhenian Sea (IOP13, IOP16c, IOP18). Smooth
      36 h. It is composed of 10 members, which take ini-         troughs entering the western Mediterranean Sea were of-
      tial and boundary conditions from the first 10 COSMO-       ten observed producing a westerly–southwesterly flow over
      LEPS members.                                               Italy (IOP2, IOP6, IOP7b, IOP12, IOP19); occasionally a
                                                                  mesoscale low-pressure system developed associated with a
Both COSMO-LEPS and COSMO-H2-EPS also benefit
                                                                  potential vorticity (PV) anomaly (IOP4, IOP16a). It is well
from model perturbations applied by varying a few param-
                                                                  known that the lateral translation of an elongated north–south
eters of the COSMO physical schemes.
                                                                  aligned PV streamer produces favorable conditions for heavy
                                                                  precipitation on the southern side of the Alpine ridge (Mas-
3    SOP1: the intense observing periods                          sacand et al., 1998). Similarly to most of the events, IOP4
                                                                  and IOP16a were fairly well forecast; however, IOP4 (14
The first field campaign (SOP1, Ducrocq et al., 2013) of the      September 2012) was characterized by low predictability of
HyMeX project was dedicated to heavy precipitation and            the exact position of the heaviest precipitation, which was
flash floods; it took place in autumn 2012 (5 September–          highlighted by the large variability among the model fore-
6 November) over the western Mediterranean area. During           casts. A cut-off low over the Tyrrhenian Sea and a Bora
SOP1 twenty IOPs were declared, 9 of which occurred in            wind on the Adriatic Sea produced persistent rain through-
Italy (Table 5), and one of them caused floods on the eastern     out the day, reaching maxima of over 150–200 mm/24 h dur-
coast of CI. During the campaign two main features affected       ing 14 September. More than 150 mm was registered in a few
the large-scale regime of the Mediterranean region: a nega-       hours over coastal areas, causing several river overflows and
tive North Atlantic Oscillation (NAO) index for most of the       the flooding of dense urban areas (Pescara, including the city
time and the long-lasting life of Hurricane Nadine (Calas et      hospital). The hydro-meteorological chain by CHyM fore-
al., 2013).                                                       cast the event well a few days in advance. Note that the re-
   The permanent Icelandic Low and Azores High control the        gional branch of DPC, which was part of the Italian opera-
direction and strength of westerly winds into Europe. The         tional center in L’Aquila, included this event in their guide-
relative strengths and positions of these systems vary from       lines for a hydro-meteorological decision support system

Hydrol. Earth Syst. Sci., 18, 1953–1977, 2014                                  www.hydrol-earth-syst-sci.net/18/1953/2014/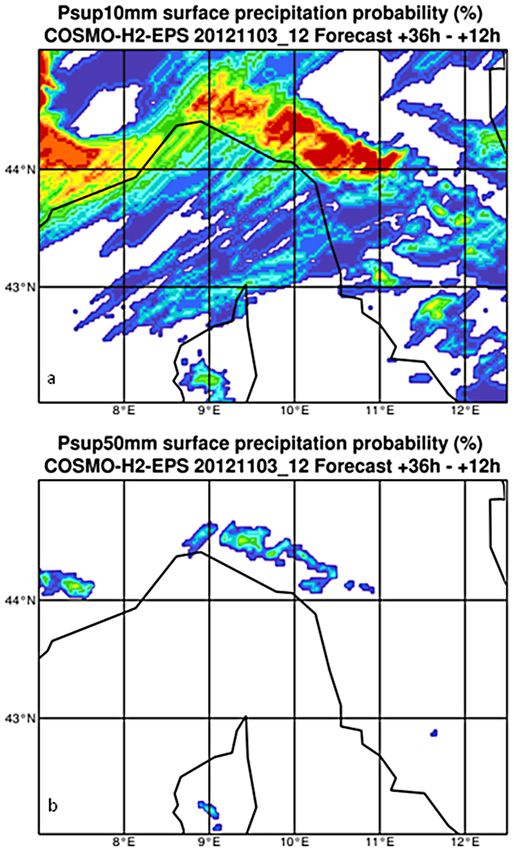
R. Ferretti et al.: First HyMeX Special Observation Period over Italy                                                              1961

Table 5. Summary of the Italian IOPs during SOP1. In the table the affected hydro-meteorological sites, the duration, the instruments
specifically activated, and the flight and extra soundings (RS) are reported.

  IOPs     Target area         Duration       Instruments             Flight                 Extra RadioSoundings
                                              (except operational)
  IOP2     NEI (HPE)           12–13 Sep      Disdrometer and         ATR42 (Italy4)         Bologna
           LT (ORP)                           X-band radar                                   Udine 12 Sep at 05:30 UTC
  IOP4     CI                  14 Sep         Radar, sodar and        Dornier Flight         L’Aquila 13 Sep at 18:00 UTC,
           (HPE/FFE)                          microwave sensor        (Corsica 5)            14 Sep at 12:00 and 18:00 UTC
  IOP6     LT & NEI            23–24 Sep      Disdrometer and         Dornier Flight         Data targeting system (DTS)
           (ORP)                              X-band radar            (Corsica 9)            23/09:00–18:00 UTC Milan, Rome,
                                                                                             Trapani, Cagliari, Udine
                                                                                             24/09:00–06:00 UTC: Milan, Trapani,
                                                                                             Cagliari
                                                                                             24/09:00–18:00 UTC: Udine, Milan,
                                                                                             Rome, Trapani
  IOP7b    LT (HPE)            26–27 Sep      Disdrometer and                                Data targeting system (DTS)
           NEI (ORP)                          X-band radar                                   25/09:00–18:00 UTC: Cagliari
                                                                                             26/09:00–06:00 UTC: Cagliari
                                                                                             26/09:00–18:00 UTC Udine
                                                                                             27/09:00–06:00 UTC Udine
  IOP12a   LT & CI             11–12 Oct      Radar Polar 55          Falcon-DLR             Bologna 11 at 12:00 UTC and 12
           (HPE)                              (Rome Tor Vergata       ATR42 (Italy3)         at 12:00 UTC
                                              – CNR ISAC), sodar,                            L’Aquila 11 at 16:00 UTC and 12
                                              MW sensors                                     at 09:00 UTC
  IOP13    LT, NEI &CI         15–16 Oct      Radar Polar 55          ATR42 (Italy1) &       L’Aquila 15 Oct at 12:00 UTC
           (HPE)                              (Rome Tor Vergata       FALCON (CI)            Udine 15 Oct at 06:00 and 18:00 UTC
                                              – CNR ISAC), sodar,                            Bologna 15 Oct at 12:00 UTC
                                              MW sensors
  IOP16a– LT, NEI & CI         26–29 Oct      Radar Polar 55          ATR42 (Italy1) &       L’Aquila 25 Oct at 16:00 UTC
          (HPE/ORP)                           (Rome Tor Vergata       FALCON (CI)            28 at 18:00 UTC
  IOP16c                                      – CNR ISAC), sodar,                            Udine every 6 h from 25 Oct at
                                              MW sensors                                     18:00 UTC till 28 Oct at 12:00 UTC
                                                                                             Bologna at 00:00 UTC and 12:00 UTC
                                                                                             from 26 to 29 Oct at 00:00 UTC
  IOP18    LT, NEI & CI        31 Oct–1 Nov   Radar Polar 55 (Rome    ATR42 (modified        L’Aquila 31 Oct at 12:30 UTC
           (HPE)                              Tor Vergata             Italy3) &              16:30 UTC (ending quickly)
                                              – CNR ISAC), sodar,     FALCON (CI)            20:30 UTC
                                              MW sensors                                     Udine, Bologna
  IOP19    LT(ORP/HPE) &       3–5 Nov        2 BLP balloon           ATR42 (Hymex 10) &     Udine 4 Nov at 18:00 UTC
           NEI (ORP)                                                  FALCON (LT)            5 Nov at 06:00 UTC

(AdriaRadNet REPORT ACTION 3.1, 2013). The hydrolog-                    Several events were characterized by convection over the
ical aspects of this event are discussed in more detail by a         sea followed by orographic precipitation: during IOP2 (12–
paper currently in preparation (Tomassetti et al., 2014). The        13 September 2012) convection developed over the north-
SHYFEM forecasts were useful to investigate the tide peak            ern Adriatic, then warm and moist advection from the south
events that occurred over the Venice Lagoon (“acqua alta”            produced precipitation inland; during IOP13 (14–16 October
or high water) during IOP16, where the sea level exceeded            2012) convection associated with a convergence line entered
twice the warning level (more than 120 cm on 27–28 Octo-             CI from the Tyrrhenian Sea; during IOP19 (3–5 November
ber 2012), and IOP18, where the sea level exceeded once the          2012) southerly advection of warm and humid air produced
alarm level (more than 140 cm on 1 November 2012). Prelim-           both convection over the Ligurian Sea and orographic pre-
inary results on the SHYFEM performance during IOP16 and             cipitation along the Maritime Alps. In this study, these three
IOP18 are presented in the studies by Casaioli et al. (2013a)        events will be analyzed from both observing and modeling
and Mariani et al. (2014).                                           points of view. These IOPs have been chosen because of the

www.hydrol-earth-syst-sci.net/18/1953/2014/                                       Hydrol. Earth Syst. Sci., 18, 1953–1977, 2014
1962                                                    R. Ferretti et al.: First HyMeX Special Observation Period over Italy

Figure 3. 24 h accumulated precipitation (color bar in mm) for
12 September 2012, obtained from hourly raingauge data analyzed
with the natural neighbor method: 163 stations in the Veneto re-
gion (ARPAV) and 111 stations in the Friuli Venezia Giulia region
(OSMER-ARPA FVG). The figure is courtesy of A. Cicogna (OS-
MER – ARPA FVG).

density of observations. Specifically, flights from ATR42 and
Falcon took place for each of them, providing measurements          Figure 4. Radar measurements on 12 September 2012: (a) verti-
of the PBL and the cloud microphysics.                              cal maximum intensity (VMI, filled colors grib228) of the reflec-
                                                                    tivity by the Fossalon di Grado radar at 08:20 UTC with surface
                                                                    observations (wind vectors and 2e in green) at 08:25 UTC and the
3.1     IOP 2 – NEI
                                                                    C2G lightning (color) strikes in the previous 12 minutes (courtesy
                                                                    of CESI-SIRF), terrain elevation in shaded grey color; (b) VMI with
IOP2 occurred on 12–13 September 2012, involving mostly
                                                                    lateral projections at 08:40 UTC; (c) VMI with lateral projections at
northeastern Italy. The event was characterized by an NAO           09:00 UTC.
index close to zero (0.2); consequently weaker westerlies oc-
curred favoring the storm tracks to cross the Mediterranean
area. In the following sections the meteorological character-       cold advection on the northern side of the Alps, which trig-
istics of the event are described.                                  gered northerly winds descending along the Alpine slopes
                                                                    and spreading into the eastern Po Valley during the passage
3.1.1    Synoptic situation                                         of the cold front. Most of the operational high-resolution
                                                                    weather forecasts predicted (not shown) this scenario. It is
A smooth ridge extending from Scandinavia to the entire             worth noting that in the three previous days a positive sea
Mediterranean basin characterized the days before IOP2 (10          surface temperature anomaly of 1.5 ◦ C was recorded over the
- 11 September 2012). During the following two days, the            northern Adriatic Sea (as observed at the Trieste meteorolog-
intrusion of a North Atlantic trough from the west weakened         ical station).
and pushed eastward the ridge, producing moist and cold po-
lar air advection toward northern Italy. On 12 September, at        3.1.2   Observations
06:00 UTC, a shallow cyclone developed over the Gulf of
Genoa and moved northeastward. At the same time on the              During 12 September 2012, several convective cells de-
eastern side of NEI the potential instability increased be-         veloped in the eastern part of Veneto and in the plain of
cause of dry air aloft, as shown by the reddish area in the         Friuli Venezia Giulia (FVG hereafter). Figure 3 shows the
northern Adriatic Sea (Fig. 2), and warm and moist air at           areal distribution of the accumulated daily rainfall recorded
the surface advected by a moderate southerly surface wind           in the Veneto region (source ARPAV) and in the FVG re-
on the Adriatic Sea blowing toward the eastern part of the          gion (source OSMER – FVG): a maximum of 97 mm/24 h
Po Valley (Fig. 4a). Indeed, the lower layer of the atmo-           (53 mm h−1 between 13:00 and 14:00 UTC) was recorded
sphere was destabilized, as confirmed by both observations          at Crespano del Grappa (45.5028◦ N, 11.5027◦ E). On the
(Fig. 4) and high-resolution weather forecasts (Fig. 5a, b). In     mountain side a small area (Fig. 3, dark red) of precipitation
the afternoon, a significant pressure gradient, associated with     exceeding 150 mm in 24 h is clearly shown, whereas the sur-
a surface depression, occurred because of a low-tropospheric        face rain intensity (SRI) retrieved by the Fossalon di Grado

Hydrol. Earth Syst. Sci., 18, 1953–1977, 2014                                      www.hydrol-earth-syst-sci.net/18/1953/2014/
R. Ferretti et al.: First HyMeX Special Observation Period over Italy 1963
Figure 6. 7 km vertical time series (from 10 to 13 September 2012)
of all the Udine soundings made by CNMCA with horizontal winds,
2e (k) in shaded colors and overlapping CAPE (J kg−1 ) and CIN
(J kg−1 ) estimations.
Figure 5. (a) CAPE (J kg−1 ) and horizontal wind at 10 m by the Figure 7. Hourly accumulated precipitation on 12 September: (a):
WRF-ISAC run driven by GFS forecasts starting at 12:00 UTC, 11 at 10:00 UTC, forecast by MOLOCH-ISAC; (b): at 11:00 UTC,
September; (b) equivalent potential temperature (K) and wind at forecast by WRF-ISAC.
950 hPa by MOLOCH-ISAC at the 2.3 km run driven by GFS fore-
casts starting at 00:00 UTC, 12 September.
Grado at 08:20 UTC and the surface station measurements
at 08:25 UTC overlapped with the cloud-to-ground lightning
(45.73◦ N, 13.49◦ E) radar detected two small areas of pre- (source CESI-SIRF) clearly show (Fig. 4a) the moist flow.
cipitation exceeding 150 mm in 24 h (not shown). The daily The high values of equivalent potential temperature (2e )
accumulated precipitation reached up to 106 mm at Palaz- along the coast (Lignano, 45.70◦ N, 13.14◦ E) and inland
zolo (45.81◦ N, 13.05◦ E, Fig. 3b), with a detected hourly (Palazzolo), respectively 341 and 342 K, support the hypoth-
maximum of 52 and 13 mm in only 5 min. In the following, esis of a localized high-2e flux feeding the storms (Figs. 4
the hailstorm that hit Latisana (45.78◦ N, 12.99◦ E) at about and 5a, b). A sudden reinforcement of the Southern Storm
09:00 UTC will be analyzed in more detail. as shown by the radar (Fig. 4b and c, 08:40 and 09:00 UTC,
In the morning of 12 September 2012, two thunderstorms respectively) suggests the convergence of the southeasterly
developed in the area, hereafter called the “Northern Storm” low-level wind with the downdraft produced by the Northern
(affecting the Rauscedo area at 46.04◦ N, 12.83◦ E) and the Storm (Fig. 4) as the mechanism for its reinforcement. This
“Southern Storm” (affecting the area west of Latisana). The led to the formation of a storm with supercell features. High-
Northern Storm was active by 06:30 UTC (08:30 local time) resolution forecasts (WRF-ISAC and MOLOCH-ISAC) fur-
over the western part of FVG and moved southeastward; ther support this hypothesis, showing a weak convergence
the Southern Storm started later (08:00 UTC) on the north- between the downdraft produced by the cells and the south-
ern Adriatic coast of Veneto and moved inland toward the easterly flow (not shown) at the time of the reinforcement of
northeast. The southeasterly low-level wind feeding mois- the Southern Storm. The supercell features are further con-
ture toward the orographic barrier of the Carnic Pre-Alps firmed by the radar image (Fig. 4c): the maximum reflectivity
is probably one of the factors leading to the development values (above 60 dBZ) are located at about 5 km a.m.s.l., with
of the Northern Storm (Kerkmann et al., 2012). The verti- a very low cloud base (about 500 m high) and a top above
cal maximum intensity (VMI) of the radar in Fossalon di 13 km. Moreover, a meso-cyclone signature in the Doppler
www.hydrol-earth-syst-sci.net/18/1953/2014/ Hydrol. Earth Syst. Sci., 18, 1953–1977, 20141964 R. Ferretti et al.: First HyMeX Special Observation Period over Italy
northeasterly barrier flow just inshore the FVG coast (Fig. 5a,
b). This convergence was responsible for the convective trig-
gering. A strong gradient of 2e over the Adriatic was pro-
duced by the warm and moist air associated with the LLJ and
the dry SW airflow. The northern part of the LLJ reached
the coasts of FVG, producing a tongue of high values of
2e and CAPE (Fig. 5a, b). Although the mesoscale environ-
ment is correctly reproduced, the exact location and timing
of cells depended weakly on both the model and the initial
condition. Indeed, small differences had a strong impact on
the simulation of the convective cells that crossed the NEI
area during the entire day. Focusing on the morning event,
no model simulation was able to reproduce the evolution of
both storms correctly. For example, the 2.3 km MOLOCH-
ISAC run (initialized through the GFS forecasts starting
Figure 8. As in Fig. 2, but at 12:00 UTC, 15 October 2012. Source: at 00:00 UTC, 12 September) reproduced the southern cell
http://www.eumetrain.org. fairly well (Fig. 7a) but missed the northern one, while the
WRF run (initial conditions at 12:00 UTC, 11 September)
captured only the northern cell (Fig. 7b).
field (not shown) was detected. Finally, at 09:00 UTC strong In summary, the local observations associated with radar
hail was reported on the A14 highway near Latisana. At the measurements and model output allow for depiction of the
same time a “convergence line” developed in the northern local dynamics and thermodynamics structure of this event.
Adriatic as most of the operational high-resolution models Both the observed and modeled surface flow suggest warm
had predicted (not shown). Afterward, the “Southern” cell and moist advection as one of the mechanisms feeding
moved eastward, dissipating nearby Trieste at 11:00 UTC. the storm. Moreover, observations confirm that the conver-
The Udine–Campoformido (46.03◦ N, 13.18◦ E) extra- gence of the southeasterly low-level wind with the down-
soundings at 06:00 and 18:00 UTC allowed for profiles avail- draft produced by the Northern Storm is the mechanism for
able every 6 h. During the morning, very high values of po- developing deep convection.
tential instability with a 2e maximum above 330 K between
500 and 1000 m in altitude (Fig. 6) were detected. A strong 3.2 IOP 13 – CI
rotation of the low-level winds between the 06:00 UTC and
the 18:00 UTC was also found, confirming a suitable envi- IOP13 occurred on 15–16 October 2012 and was charac-
ronment for strong convective activity. The 06:00 UTC Udine terized by an NAO index of approximately zero (0.13 and
sounding exhibited a lifted index of only −0.7 ◦ C, but the 0.6, respectively, during 15 and 16 October). Similarly to
difference in temperature between the most unstable parcel IOP2, weak westerlies allowed for the transition of heavy
(2e = 336 K) lifted pseudo-adiabatically at 500 hPa and the rain storms over the Mediterranean area. All of the three Ital-
environmental air (DT500) was as low as −5.0 ◦ C. CAPE ian target areas were involved. An overview of the event over
was almost 1680 J kg−1 and the precipitable water (PWE) the CI area is presented in the following sections.
was 34 mm. These values of potential instability indices were
very high for this time of year in FVG (mid-September).
3.2.1 Synoptic situation
Finally, the ATR42 flew over the northern Adriatic Sea,
detecting the low-level southerly flow by midday, that is af-
ter the supercell ended. LIDAR measurements (not shown) This IOP was selected as a typical situation of frontal precip-
documented a well-developed PBL (up to 2 km) over the itation affecting central and northeastern Italy. The precipi-
Adriatic Sea characterized by high values of the water vapor tating events were associated with a wide upper-level trough
mixing ratio. extending from northern Europe to Spain (Fig. 8) in the early
morning of 15 October 2012. A cold front moved eastward,
3.1.3 Peculiarities and model simulations advecting low-level moist air towards Corsica and Italy. The
main convective activity was located in the warm air ahead
Short-range forecasts reproduced fairly well the large-scale of the front, in the narrow cold frontal rainband and behind,
and mesoscale features responsible for the event. In fact, all under the upper cold low. During the morning of that day a
the investigated high-resolution operational models capture secondary V-shaped trough started to form over France and
the convergence among the low-level jet (LLJ) close to the moved eastward. A strong PV anomaly (the reddish area in
east coast of the northern Adriatic, the southwesterly flow Fig. 8) associated with the deep trough and the warm tem-
across the Apennines (similar to alpine Foehn), and the east– perature advection at 700 hPa allowed the development of
Hydrol. Earth Syst. Sci., 18, 1953–1977, 2014 www.hydrol-earth-syst-sci.net/18/1953/2014/R. Ferretti et al.: First HyMeX Special Observation Period over Italy 1965
Figure 10. Reflectivity images at different times (17:00, 17:30 and
Figure 9. Daily accumulated rainfall recorded by rain gauges (green
18:00 UTC) collected by Polar 55C radar in Rome during 15 Octo-
dots on the map) on 15 October 2012; the inset shows the hourly ac-
ber 2012 (elevation 1.6◦ ).
cumulated precipitation for the station of Formello (north of Rome)
– courtesy of the DPC (DEWETRA system).
ones of the operational rain gauges available in downtown
Rome.
several MCSs in the central and southern Tyrrhenian Sea In addition to the operational soundings available from
(Fig. 8). the Global Telecomunication System (GTS), dedicated ex-
In the following hours the upper level trough deepened, tra soundings were launched by the HyMeX Italian team as
moving eastward, and by 18:00 UTC of 15 October a cyclone listed in Table 5. Two instrumented aircrafts (ATR42 and
had developed over the Gulf of Genoa (not shown). The asso- F20) were used to provide evidence of the moist southwest-
ciated frontal system moved rapidly toward the Italian penin- erly flow and the vertical cloud structure. The ATR42 flew on
sula, causing moist air advection over the Tyrrhenian Sea and 15 October over the Tyrrhenian Sea; the earlier flight (take-
consequent deep convection on the Tyrrhenian coast, east of off at 05:00 UTC from Montpellier to Bastia) crossed the
Rome. In the evening a cut-off low developed over northern cold front; the later one (take-off at 08:00 UTC from Bas-
Italy, moving eastward and crossing the northeastern part of tia to Sicily and back) crossed the southwesterly flow. The
the Italian peninsula by the early morning of 16 October. return flight took place from Bastia to Montpellier at the end
of the morning. The flight was successful except for return-
3.2.2 Observations ing early (before reaching Palermo) because of the presence
of cumulonimbus clouds over Sicily.
During this IOP all the operational instruments and the ones The F20 flight was dedicated to documenting the cloud
purposely deployed over the CI site were operational, with properties of the precipitation systems, exploiting the joint
the exception of the Monte Midia weather radar, which had coverage of X- and C-band radars in central Italy, and mea-
been out of order since 13 October. Figure 9 shows the surements collected by the RASTA (Radar Aéroporté et
24 h accumulated precipitation on 15 October recorded by Sol de Télédétection des propriétés nuageuses; Protat et al.,
the Italian rain gauge networks: a maximum of 60 mm/24 h 2009) 94 GHz Doppler radar onboard the F20 aircraft. The
was reached. The inset in Fig. 9 shows the hourly precip- main objectives of these joint observations were (i) to inter-
itation recorded by one of the rain gauges located north compare the capabilities of dual polarized radars at C- and
of Rome (Formello, 12◦ 230 55.3400 E, 42◦ 040 41.4000 N). It X-bands having different specifications (i.e., different beam
clearly shows that most of the precipitation occurred in the widths, peak powers, central wavelengths, scanning modes)
late afternoon (from 17:00 to 19:00 UTC), with a remark- and (ii) to compare the radar-derived microphysical retrievals
able maximum of rainfall rate of 35 mm h−1 at 18:00 UTC, with a ground-based network of disdrometers in terms of par-
whereas light precipitation was recorded during the night ticle size distributions and precipitation rates. Preliminary re-
and in the morning. The spatial distribution and the evolu- sults (Marzano et al., 2013) show that path attenuation cor-
tion of precipitation can be inferred from the radar reflec- rection and clutter removal are critical steps in radar data pro-
tivity pattern (Fig. 10). Most of the precipitation occurred cessing, especially at X-band, whereas good agreements have
on the western slope of the Apennines. Indeed, the NASA been found between radar products and disdrometer data for
Parsivel disdrometers purposely installed at L’Aquila (on the the particle concentration and mean diameter estimation, es-
eastern slope) and Pescara (on the east coast of CI) recorded pecially for stratiform rainfall.
only 9.8 and 5.0 mm, respectively, on that day. Conversely, The Polar 55C CNR radar was available during this IOP
at “La Sapienza” University of Rome, the NASA 2-D video to provide, from the Rome site, both conventional volumes
disdrometer recorded a total amount of 25 mm. An hourly cu- scanning made of sweeps at different elevations and RHI
mulated rainfall of 20 mm was recorded between 17:40 and mode that scans with an increasing elevation angle at a fixed
18:40 LST, but 114 mm h−1 being the highest rain rate esti- azimuth direction, along both the directions of the HyMeX
mated in 1 min. Such measurements are consistent with the instrumented sites and along the F20 route. The reflectivity
www.hydrol-earth-syst-sci.net/18/1953/2014/ Hydrol. Earth Syst. Sci., 18, 1953–1977, 2014You can also read