PLAYGROUNDS - GUIDE TO CLIMATE-SMART - RESEARCH FINDINGS AND APPLICATION 2021 - ResearchDirect
←
→
Page content transcription
If your browser does not render page correctly, please read the page content below
GUIDE TO

CLIMATE-SMART
PLAYGROUNDS –
RESEARCH FINDINGS AND APPLICATION
2021
WESTERN SYDNEY UNIVERSITY

                     AUTHORS
                     Associate Professor Sebastian Pfautsch, Dr Agnieszka Wujeska-Klause

                     Urban Studies
                     School of Social Sciences
                     Western Sydney University, Parramatta, NSW 2150, Australia

                     Warami wellamabamiyui, yura! We pay our respect to the Darug people, the
                     traditional custodians of the land on which this work has taken place. For many
                     thousands of years, the Darug have known about the importance of shade. This
                     is indicated by at least three different phrases in their rich language to describe
                     ‘shadow’ (bawuwan, buwari buwa and gugubuwari). Its linguistic brother ‘shade’
                     provides us with comfort and protection. We hope the present work on heat and
                     UV in playgrounds – places for meeting and learning, of and for community –
                     will help promote shadow and shade, comfort and protection. This will not only
                     increase our resilience against increasing heat but demonstrate our respect and
                     care for country and its people.

                     This research project was funded by LG New South Wales and Cumberland
                     City Council.

                     In-kind contributions by Alfersco Shade, Gale Pacific Ltd, Polysoft Pty Ltd,
                     Andreasens Green Wholesale Nursery, Kidsafe NSW, Cancer Council NSW, Cancer
                     Institute NSW, Health NSW (WSHD) and WSROC are acknowledged.

                     SUGGESTED CITATION:
                     Pfautsch S., Wujeska-Klause A. (2021) Guide to climate-smart playgrounds –
                     research findings and application. Western Sydney University, 60 p.

                     DOI: 10.26183/2bgz-d714
                     URL: https://doi.org/10.26183/2bgz-d714

                     ©Western Sydney University.

                     www.westernsydney.edu.au

                     June 2021.

                     Cover image and pages 54 and 58: istock.com; page 5: pexels.com; page 50: S. Tsoutas;
                     all other images © S. Pfautsch, unless otherwise indicated in captions.

                     Design: Atomic47

2                                                                                                            Western Sydney University
PRÉCIS
                       This report has two parts. Part 1 provides a systematic assessment of surface
                       temperatures found in playgrounds during hot summer days. Part 2 applies
                       the findings of Part 1 to design and build Australia’s first dedicated UV-smart
                       Cool Playground. Since October 2020, the playground is enjoyed by the local
                       community of Merrylands in Western Sydney.

                       The following recommendations are the                6.   Consider rubber softfall material –
                       quintessence of physical measurements                     cheaper products, even in lighter
                       (Part 1) and lessons-learned (Part 2) during this         colours are likely to have higher surface
                       exciting project.                                         temperatures when unshaded.
                                                                            7.   Avoid synthetic turf in unshaded
                       1.   Prioritise interventions that mitigate
                                                                                 playgrounds. Regardless of the light
                            heat and UV radiation when designing
                                                                                 conditions, broader environmental
                            new or upgrading existing playgrounds.
                                                                                 impacts (i.e., capacity to recycle, escape
                       2.   Expand shade where it is absent.                     of microplastic) should always be
                            Shade is the most important element to               considered when selecting or replacing
                            make playgrounds climate-smart. Shade                synthetic turf in playgrounds.
                            will markedly cool surfaces and play
                                                                            8.   Provide access to drinking water.
                            equipment. It will reduce radiant heat
                                                                                 Keeping children and their parents
                            loads and block harmful UV radiation.
                                                                                 and carers well hydrated during active
                       3.   The most cost-effective and climate-                 outdoor play is key to prevent heat-
                            responsible approach to improve                      related health issues.
                            playground microclimate is planting
                                                                            9.   Educate parents and carers about
                            large canopy trees that block midday
                                                                                 the risks associated with hot surfaces
                            and afternoon solar irradiance. Tree
                                                                                 and exposure to UV radiation in your
                            plantings will increase community
                                                                                 playground.
                            resilience.
                                                                            10. Promote climate-smart playgrounds to
                       4.   Consider the thermal comfort of
                                                                                your community.
                            parents and carers when introducing
                            or expanding shade. If resting places
                            for adults are unshaded, they will spend
                            less time at a playground even if shade is
                            provided over the play equipment.
                       5.   Avoid dark rubber softfall in unshaded
                            playgrounds. This material can lead to
                            burn injuries. In direct sun, lighter colours
                            (or light-coloured speckled mixes) will
                            have lower surface temperatures, but
                            higher quantities of reflected radiation
                            will lead to lower human thermal comfort
                            (Trojan Effect).

westernsydney.edu.au                                                                                                          3
WESTERN SYDNEY UNIVERSITY

CONTENTS
PRÉCIS                                          3    PART 2 AUSTRALIA’S FIRST
                                                     UV-SMART COOL PLAYGROUND                                 33
CONTENTS                                        4    2.1 INTRODUCTION                                          34
                                                     2.2 SCIENCE TRANSLATION                                   35
PART 1 THERMAL ASSESSMENTS                      5    2.3 MEMORIAL PARK PLAYGROUND                              35
1.1 INTRODUCTION                                6    2.4 PROJECT TEAM                                          36
    1.1.1 HEAT ACROSS CUMBERLAND CITY COUNCIL    7
    1.1.2 PLAYGROUND MICROCLIMATE                7   2.5 PROJECT TIMELINE                                      38
    1.1.3 PROJECT AIMS                           8   2.6 IMPORTANT INNOVATIONS                                 39
1.2 METHODS                                      8   2.7 ‘BEFORE-AFTER’ ENVIRONMENTAL
    1.2.1 SELECTED PLAYGROUNDS                   8
    1.2.2 ENVIRONMENTAL MONITORING              10
                                                          MONITORING                                           41
                                                       2.7.1 COOLING ACROSS THE PLAYGROUND                      41
1.3 RESULTS                                     12     2.7.2 THE TROJAN EFFECT                                  44
    1.3.1 TEMPERATURES IN DIRECT SUN            12     2.7.3 REDUCTION OF UV RADIATION                          46
    1.3.2 THE COOLING EFFECT OF SHADE           19
    1.3.3 SURFACE REPAIRS AND AGING             24
                                                     2.8 COMMUNICATION OF THE PROJECT                          49
    1.3.4 PLAY EQUIPMENT                        26   2.9 ADDITIONAL PROJECT BENEFITS                           52
    1.3.5 REST AREAS                            28
1.4 S YSTEMATIC TESTING OF                          3. REFERENCES                                            53
     SURFACE TEMPERATURE                        29
1.5. E
      VIDENCE-BASED CLIMATE-RESPONSIVE              4. LINKS TO PROJECT-RELEVANT
     PLAYGROUND DESIGN                          32       INFORMATION                                          54
                                                     CUMBERLAND CITY COUNCIL                                   54
                                                     LOCAL GOVERNMENT NSW                                      54
                                                     WESTERN SYDNEY REGIONAL ORGANISATION OF
                                                     COUNCILS (WSROC)                                          54
                                                     WESTERN SYDNEY UNIVERSITY                                 54

                                                     5. UV-SMART COOL PLAYGROUND
                                                         CASE STUDY                                           56

4                                                                                            Western Sydney University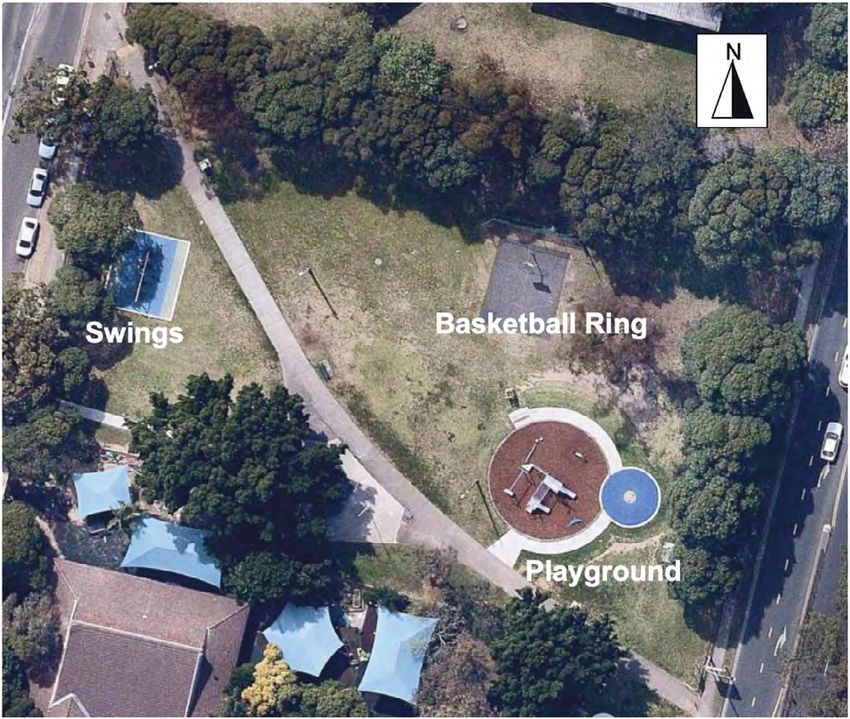
CLIMATE-SMART PLAYGROUNDS

  PART 1

  THERMAL
  ASSESSMENTS
  Part 1 of this report documents surface, air and feels like
  temperatures in public playgrounds across the Cumberland
  Local Government Area. All playgrounds were visited
  repeatedly during warm and hot conditions in the summer of
  2019/20 and 2020/21. While data collections were impacted
  by smoke haze from the Black Summer bushfires during the
  summer of 2019/20, they were not impacted by playground
  closures in response to COVID-19 safety measures in 2020.

westernsydney.edu.au                                                                    5
WESTERN SYDNEY UNIVERSITY

1.1 INTRODUCTION
Outdoor play is vital for positive socialisation and development of children including cognitive, psychological, and
physiological benefits (Brockman et al., 2011). Playing outdoors increases attention, creative thought processes and
problem-solving skills as well as combating obesity, mental health problems and improving social skills of children
(Bundy et al., 2011). Encouraging and supporting outdoor play is particularly important today, where the daily time
interval children are engaging in physical activity is contracting (Ridgers et al., 2013).

The decline in time spent outdoors by children     children will spend on average 3-4 hours in           validated climate models indicate that
has several reasons. In short, these can be        front of a television or mobile device by the         planetary warming and localised urban heat
attributed to three main subject areas: (1)        time they are 12 years old (Yu and Baxter,            phenomena will continue to intensify over
centre of life, (2) contemporary lifestyle,        2016). As screen time of children is increasing,      the coming decades. These predictions
and (3) unsuitable outdoor environmental           time spent outdoors in a park or playground is        demand adequate responses at all levels
conditions. Across the world, the centre of        declining.                                            of intervention – from multilateral climate
life for humans is increasingly urban where                                                              agreements down to cooling initiatives at the
                                                   Even if the local park or playground is nearby
overall access to green space can be limited.                                                            local street, park and playground.
                                                   and children are off screen, increasing summer
At our own doorstep, the metropolitan region
                                                   heat is limiting the time available for safe          Shade in the form of mature trees or other
of Sydney, the issue of limited access to green
                                                   outdoor play. Here we define summer heat              structures provides good protection against
space, and the lack of it more broadly, has
                                                   as days with maximum air temperatures at              harmful ultraviolet (UV) radiation (Parisi and
raised concerns in local and state government
                                                   or above 35°C. On average, Western Sydney             Turnbull, 2014), but is often missing in public
organisations. The issue was sufficiently severe
                                                   experienced 11 days each summer where the             playgrounds. A recent national survey in New
to be captured in two of the 14 Premier’s
                                                   mercury climbed past 35°C between 1981                Zealand found that 60% of all playgrounds had
Priorities, Greener Public Spaces and Greening
                                                   and 2010 (Ogge et al., 2018). According to            no shade at all and in many playgrounds shade
our City. To address the lack of urban green
                                                   modelling from CSIRO (reported in Ogge                it was inadequate (Gage et al., 2019). The lack
space, the State Government has committed
                                                   et al., 2018), the number of days that this           of shade will leave children and their parents or
substantial resources to plant 1 million new
                                                   temperature threshold is reached in Western           carers exposed to direct solar radiation, which
trees by 2022 and improve access to green
                                                   Sydney could increase to 60 or more per year          not only increases thermal discomfort and the
space for 230,000 homes by 2023 across
                                                   by 2090. And even in the cooler coastal parts         risk of overheating but overexposes them to
metropolitan Sydney. These actions reflect the
                                                   of Eastern Sydney, the number of intense              harmful UV radiation. High exposure to UV
importance of access to public green space,
                                                   summer heat could increase more than five-            during childhood and adolescence seems to
including playgrounds.
                                                   fold from 4 (mean of 1981-2010) to 22 days per        increase the risk of developing skin cancer later
There is strong evidence that, as part of          year by 2090.                                         in life (Green, 2011; Whiteman et al., 2001). In
contemporary lifestyles, screen time of children                                                         Australia, where the intensity of solar and UV
                                                   Increasing urban heat is not restricted to
has significantly increased (Chen and Adler,                                                             radiation is very high for most of the year, up
                                                   Sydney but impacts cities and their populations
2019). Without doubt, regular use of electronic                                                          to 95% of melanomas and 99% of keratinocyte
                                                   around the world. Urban expansion and
screens has become an integral part of modern                                                            carcinomas are likely the result of overexposure
                                                   densification lead to the loss of green spaces
life. It is estimated that 95% of households in                                                          to UV (Gage et al., 2019). Hence, protection of
                                                   which reduces the cooling capacity inside
the United States and the United Kingdom                                                                 children against UV is paramount to increase
                                                   our cities. More people in a city simply leads
have at least one television and one smart                                                               their chances of a life without skin cancer.
                                                   to more heat. The impacts of climate change
phone (Ribner and McHarg, 2021). Similar
                                                   further accelerate this effect. All internationally
numbers can be expected for Australia where

6                                                                                                                                 Western Sydney University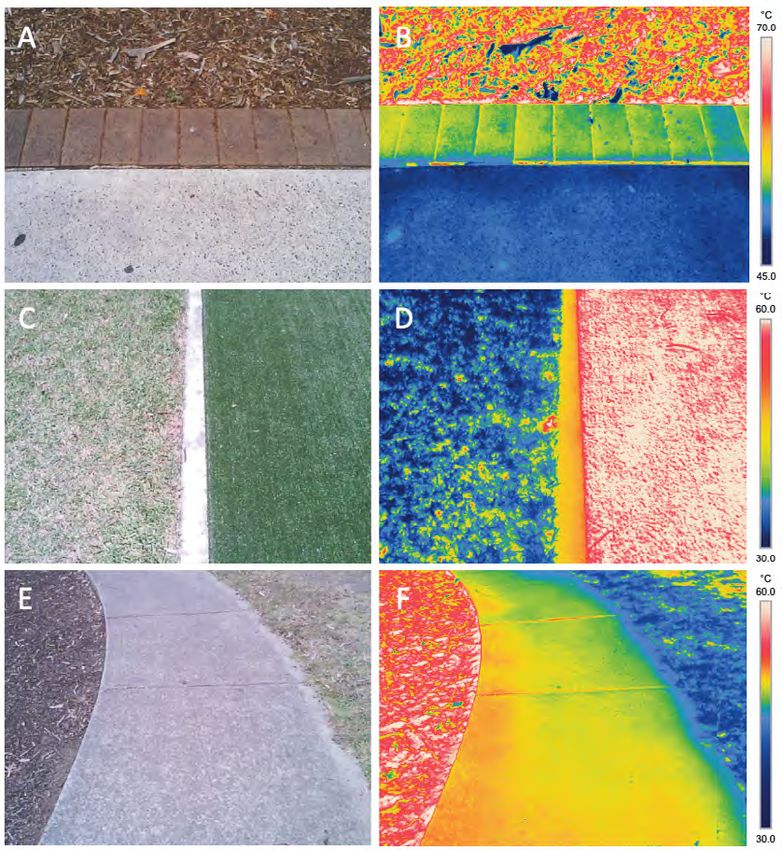
CLIMATE-SMART PLAYGROUNDS

Shade in playgrounds will also result in lower      Cumberland City Council engaged Western            1.1.2 PLAYGROUND MICROCLIMATE
temperatures of surfaces and play equipment.        Sydney University to document and map air          As emphasised by the work of Pfautsch
Reports of severe skin burns from children in       temperatures across the 72 km2 of the Local        and Rouillard (2019), microclimate across
playgrounds are documented in the scientific        Government Area (LGA), including commercial        Cumberland varies markedly. This also
literature (e.g., Strong et al., 2007) and recent   centres, industrial zones, residential streets,    applies to the playgrounds within the LGA.
work in the United States and Canada has            parks and other green spaces. The necessary        Their microclimates are influenced by the
highlighted the health hazards that arise when      field-based research took place in the summer      configuration of the surrounding landscape
playing in unshaded playgrounds (Vanos, 2016;       of 2018/19, where air temperatures were            where distance to roads and buildings, air flows
Vanos et al., 2016, 2017; Kennedy et al., 2020).    recorded at very high frequency for more than      and the size, quality and hydration status of
A central question in Everyone Can Play, the        two months in 97 locations inside and outside      adjacent green space will influence site climate.
reference guide of the NSW Government on            the boundary of the LGA of Cumberland.
                                                                                                       The thermal experience of humans spending
how to create world-class play spaces (NSW
                                                    Results of this research project revealed that     time at a playground will largely depend on
Government, 2019), is “Can I stay?”. The answer
                                                    heat across the council area was much more         the configuration of the playground itself. The
to that question is “Only if good shade is
                                                    intense than previously known (Pfautsch            proportion of sunlit (or shaded) ground area
provided”.
                                                    and Rouillard, 2019). Measurements from the        as well as materials used for surfacing and
1.1.1 HEAT ACROSS CUMBERLAND                        nearest official weather station at Sydney         play equipment will influence this experience.
CITY COUNCIL                                        Olympic Park recorded 10 days with maximum         The combined effects of physical properties of
Prior to the formation of Cumberland City           daily air temperatures above 35°C during           surface and play equipment, especially their
Council in 2016, most towns and suburbs             December 2018, January and February 2019.          thermal mass, and the reflectance, absorbance
of the region in the geographical centre of         In contrast, analyses of the locally acquired      and emission of solar irradiance will result in
metropolitan Sydney were managed by the             measurements showed that maximum daily             the ‘thermal performance’ of a playground.
Cities of Holroyd and Auburn. The Climate           air temperatures at or above 35°C occurred         During clear summer days, these characteristics
Change Risk Assessments of both former local        on 41 days during the same time period.            can result in gradients of surface temperatures
governments identified urban heat, heatwaves        Summer daytime temperatures, the average air       of 50°C or more over short distances (Figure 1).
and/or extreme temperatures as important            temperature between 10:00 and 18:00, differed
                                                                                                       Playgrounds are predominately designed to
risks to local communities. Once Cumberland         by 6°C across the LGA and varied by more than
                                                                                                       stimulate safe play and learning experiences. To
City Council became operational, the identified     10°C during heatwaves.
                                                                                                       date, their thermal performance is not central
risks and associated mitigation approaches
                                                    Some of the 97 measurement locations of the        to design considerations, which in increasingly
were reviewed. In 2018, the Western Sydney
                                                    project were at or near playgrounds where          hotter summers will lead to a reduction in
Regional Organisation of Councils released its
                                                    very high temperatures were recorded. Given        time when playgrounds can be used safely.
Turn Down the Heat Strategy (WSROC, 2018)
                                                    the strategic recommendations in the Turn          They will simply be too hot for children to use.
which provided local governments in Western
                                                    Down the Heat Strategy (WSROC, 2018),              A first step towards good thermal design of
Sydney Councils, including Cumberland, with
                                                    the importance of playgrounds as public            playgrounds is sound information about surface
a strategic framework and action plan around
                                                    green spaces and the need to prioritise heat       temperatures of widely used playground
the issue of urban heat. Cumberland City
                                                    mitigation actions gave rise to the work           materials and how shade can reduce these
Council adopted the framework and began
                                                    captured in this report. Public playgrounds        temperatures and improve microclimate.
planning and implementing initiatives to better
                                                    across the LGA are important assets to Council
understand the extend and variability of local
                                                    as they represent a vital resource for learning,
heat across its jurisdiction.
                                                    social coherence, and well-being of the
                                                    community.

westernsydney.edu.au                                                                                                                                   7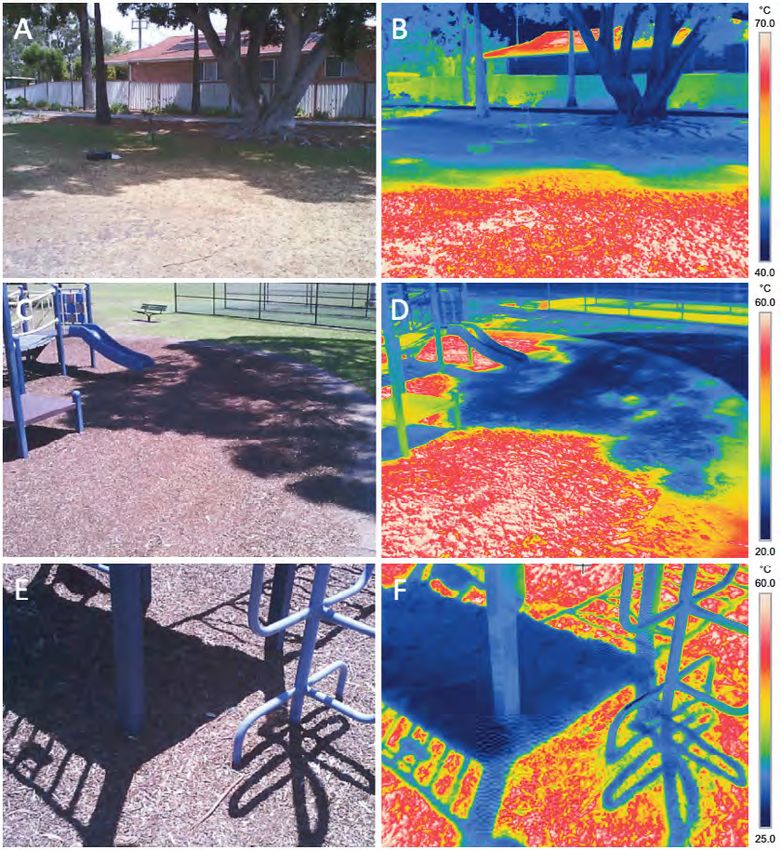
WESTERN SYDNEY UNIVERSITY

FIGURE 1: Normal (left) and infrared (right)         1.1.3 PROJECT AIMS                                  surface materials and shade status. Location
views of the playground at Auburn Park,              1.   Systematically assess the effect of solar      was especially important, because the heat
Auburn. The infrared image shows surface                  irradiance on surface temperatures             mapping across the LGA by Pfautsch and
temperature by colour. The colour scale is                of common materials used in the                Rouillard (2019) showed that temperature
provided on the right side of the image. Surface
                                                          playgrounds of Cumberland.                     regimes varied across the Cumberland LGA
temperatures change nearly 50°C within a
                                                     2.   Document the cooling capacity of               in summer. The selection of playgrounds
short distance from the lawn to the playground.
                                                          shade and its impact on human thermal          aimed to incorporate this variation. The size
Large differences in surface temperature of
different materials exposed to the sun are                comfort.                                       criteria ensured that only neighbourhood
visible (i.e., grass, concrete, different-coloured                                                       playgrounds were included. These small
                                                     3.   Collate sound evidence that will
rubber softfall). The image was taken at 15:00                                                           to medium size playgrounds make up the
                                                          inform climate-responsible design of
on 4 January 2020.                                                                                       majority of playgrounds across the LGA.
                                                          playgrounds that mitigates heat and
                                                                                                         Larger ‘destination’ playgrounds or splash
                                                          exposure to UV radiation.
                                                                                                         parks were excluded. Lastly, it was imperative
                                                                                                         for the study to cover a large range of surface
                                                     1.2 METHODS                                         materials and colours to provide a wider
                                                                                                         overview of how summer conditions impact
                                                     1.2.1 SELECTED PLAYGROUNDS
                                                                                                         surface temperatures and thermal regimes in
                                                     Cumberland City Council owns and manages
                                                                                                         playgrounds.
                                                     220 public playgrounds. They range in size
                                                     from very small neighbourhood play spaces           At the end of the selection process, six
                                                     with a slide and a swing to large playgrounds       playgrounds were identified in Auburn,
                                                     with adjacent recreational and picnic facilities.   Granville, South Granville, Greystanes,
                                                     In most of these playgrounds, the council           Merrylands and Toongabbie (Figure 2). Surface
                                                     uses bark mulch as surface material. The            materials included bark mulch, rubber softfall
                                                     second most surface material is rubber softfall.    and synthetic turf (Table 1). The shade status
                                                     Synthetic turf as a surface material is used in     of playgrounds, especially if shade was cast
                                                     less than 10% of all playgrounds.                   over the play area during daytime hours where
                                                                                                         heat and UV radiation would be most intense,
                                                     Six playgrounds were selected across the
                                                                                                         varied widely (Table 1).
                                                     Cumberland City Council LGA. Selection
                                                     criteria included geographic location, size,

8                                                                                                                                 Western Sydney University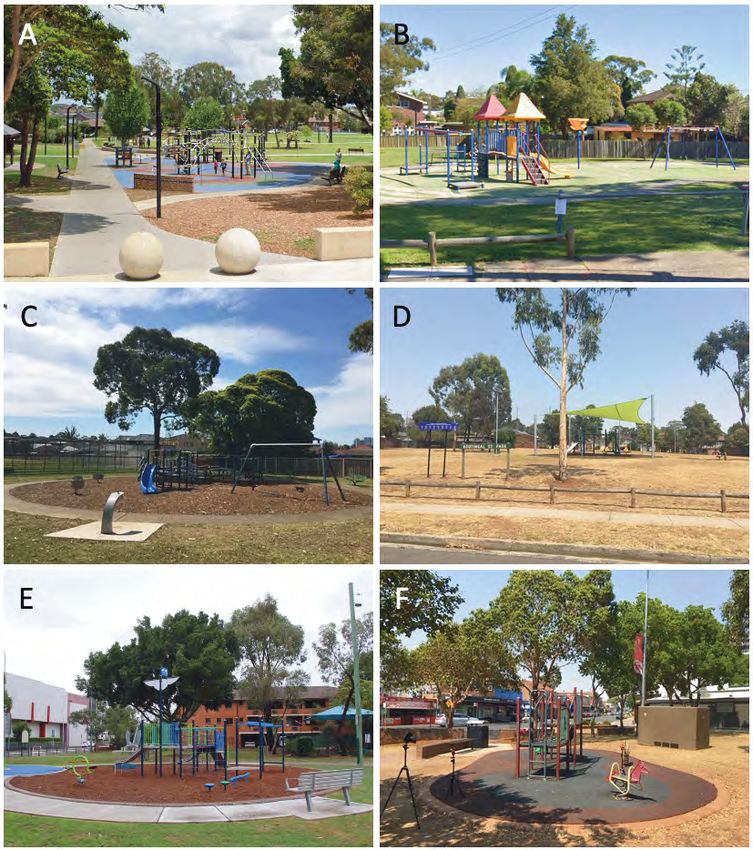
CLIMATE-SMART PLAYGROUNDS

                              FIGURE 2: Public
                              playgrounds used
                              in the research
                              project. (A) Auburn
                              Park, Auburn. (B)
                              Bennelong Park,
                              Granville. (C)
                              Colquhoun Park,
                              South Granville. (D)
                              Kootingal Reserve,
                              Greystanes. (E)
                              Memorial Park,
                              Merrylands. (F)
                              The Portico Park,
                              Toongabbie. Images
                              shown in A and B
                              were extracted from
                              Google Street View.

westernsydney.edu.au                             9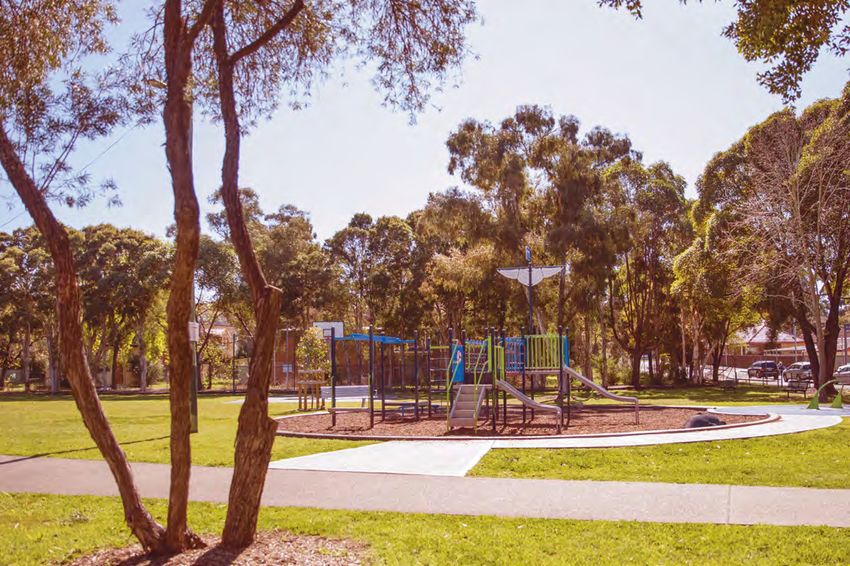
WESTERN SYDNEY UNIVERSITY

TABLE 1: Selected playgrounds for thermal and environmental monitoring. Shade status was                 1.2.2 ENVIRONMENTAL MONITORING
related to the presence or absence of shade during midday and afternoon where playground                 The playgrounds were visited on 18, 19 and 21
visitors would experience high air temperature and intense UV radiation.                                 December 2019, 4 January, 28 November and 6
                                                                                                         December 2020 and 10 and 16 January 2021. As
                                                              PREDOMINANT                                a result of intensive smoke haze from bushfires
NAME                STREET ADDRESS       SUBURB               SURFACE TYPE SHADE STATUS
                                                                                                         burning in the Blue Mountains, the campaigns
Auburn Park         Macquarie Road       Auburn               rubber softfall    some tree shade         on 18 and 19 December 2019 were stopped
Bennelong Park      William Street       Granville            synthetic turf     no shade                during the early afternoon. At these times, the
Colquhoun Park      Blaxce ll Street     South Granville      bark mulch         some tree shade         partial or total absence of direct solar radiation
Kootingal Reserve Kootingal Street       Greystanes           bark mulch         green shade sail        did not permit an objective assessment
Memorial Park       Windsor Road         Merrylands           bark mulch         no shade                of cooling effects from shade on surface
The Portico Park    Aurelia Street       Toongabbie           rubber softfall    some tree shade         temperatures. Environmental conditions during
                                                                                                         all other days were sunny without cloud cover.
                                                                                                         Air temperature during these summer days
Of the six playgrounds selected, only the            cover factor of 95%, a mean UPF of 15 and a
                                                                                                         ranged from 25°C to 48°C.
playground at the Kootingal Reserve had a            shade factor of 82%. As shown in Figure 3, the
shade sail. The sail was lime green made from        size of the sail was large enough to provide full   SURFACE TEMPERATURE
Architect 400® (Polyfab Australia, Carrum            coverage of the play equipment during midday.       The temperature of surface materials and
Downs, VIC, Australia). According to the                                                                 play equipment was measured using a
manufacture, the shade cloth material had a                                                              radiometric infrared camera (T540, FLIR
                                                                                                         Systems, Wilsonville, OR, United States). Over
                                                                                                         the duration of the project, a total of 480
                                                                                                         infrared images were collected. The camera
                                                                                                         simultaneously took RGB (red-blue-green) as
                                                                                                         well as infrared images, which supported very
                                                                                                         clear post-identification of objects, materials,
                                                                                                         colours, light conditions and locations. The
                                                                                                         FLIR Tools software was used to extract
                                                                                                         surface temperatures from individual images.
                                                                                                         In each image, five individual random spot
                                                                                                         measurements were recorded and averaged for
                                                                                                         each target surface. For the analyses of surface
                                                                                                         temperatures, we extracted 1055 individual
                                                                                                         measurements from 332 images collected at the
                                                                                                         six playgrounds. The images and resulting data
                                                                                                         covered a wide range of surface materials and
                                                                                                         play equipment in the full sun and under shade.

                                                                                                         MICROCLIMATE
                                                                                                         Air and black globe temperatures were
                                                                                                         measured at each playground. Two tripod-
                                                                                                         mounted portable weather stations (Model
                                                                                                         5400, Kestrel Instruments, Melbourne,
                                                                                                         VIC, Australia) with integrated black globe
                                                                                                         thermometers (a 25 mm diameter copper
                                                                                                         sphere with a matt black surface) were used
                                                                                                         to record ambient environmental conditions in
FIGURE 3: Shade sail at Kootingal Reserve, Greystanes. The image was taken at noon on                    the sun and where possible in the shade over
04.01.2020. All play equipment is shaded.                                                                different surface materials. Accuracy of the air
                                                                                                         temperature sensors was ±0.5°C and ±1.4°C for

10                                                                                                                                 Western Sydney University
CLIMATE-SMART PLAYGROUNDS
the black globe thermometers. Each weather measurements were collected during the early
station was positioned 1 m above ground. afternoon hours when the sky was clear and
Instruments were allowed to equilibrate to solar irradiance measurements in the full sun
ambient conditions before data were recorded were unobstructed by clouds or other objects
at 30-second intervals for 5 minutes. Data were blocking light. Spectra were recorded on 6
stored on the instrument and downloaded for December 2020, and on 10, 14 and 16 January
analyses. Measurements for each 5-minute 2021. A total of 20 spectra were recorded
interval were averaged and ±1 Standard at Kootingal Reserve and 120 spectra were
Deviation (SD) was calculated. Microclimate recorded at Memorial Park.
measurements were recorded at the same time
1.2.3 SYSTEMATIC TESTS
when surfaces were imaged.
In addition to collection of field data, a
The black globe thermometer was used to systematic assessment of surface temperatures
document a ‘feels like’ temperature that of common playground materials was done.
represents the thermal sensation of a human Materials included styrene butadiene rubber
under the simultaneous influence of several (SBR), ethylene propylene diene polymer
important environmental factors. A black globe rubber (EPDM) and thermoplastic polyolefin
thermometer can capture these combined (TOP), synthetic and real turf. All materials
effects and is commonly used to track heat were provided as square tiles (30 cm x 30 cm).
stress in work health and safety applications. SBR, EPDM and TOP samples were 12-15 mm
The instrument is designed to represent thick, mounted on a base layer (40 mm) of
the temperature of a seated adult human. It black rubber granules. All sides of the rubber
provides a composite measure of ambient air tiles were covered with white fabric tape to
temperature, heat transfer by incident solar prevent heating of the black rubber base from
radiation and convection of heat between the direct sunshine. Synthetic turf was placed
globe and the environment, as well as wind on foam pads (15 mm thickness). Real turf
speed (Olivera et al. 2019). (Kikuyu) was backed by a layer of soil and was
standard material from a hardware store.
UV RADIATION
A portable spectroradiometer (Stellar Rad The assessment was done on 11 January 2021
UV-VIS, Stellar Net Inc, Tampa, FL, United in a special facility at the Solar Institute of
States) was used to estimate the reduction of Western Sydney University. The facility is a
UV radiation under shade sails. The effective rectangular space with large glass windows
bandwidth of the instrument captured and no sealing/roof to allow maximum solar
ultraviolet light, starting at 250 nm through exposure (Figure 4). Placing the samples in
to near infrared, ending at 1150 nm. Data this room ensured that they were exposed
were recorded at 1 nm resolution. For this to the same environmental conditions. The
study, we defined UV-A radiation to cover day of the experiment was sunny without
wavelengths of light between 350 and 400 clouds and maximum air temperature inside
nm, and UV-B between 280-350 nm. Solar the room peaked early at 45°C around 10:00
irradiance was recorded in W m-2. Between and stabilised at 35°C at midday and during
three and five individual measurements were the afternoon. Outside the room, ambient air
taken under different shade conditions at temperatures peaked at 36°C around 16:00.
Kootingal Reserve and after the transformation Solar radiation was 1000 W m-2 at midday and
of the playground at Memorial Park (see Part black globe (i.e., feels like) temperatures were
2 of this report). These measurements were between 47°C and 51°C inside and outside the
averaged and compared to the same number room during the afternoon. Average windspeed
of measurements taken in full sunlight to was 0.1 m s-1 inside and 0.7 m s-1 outside the
estimate how much UV-radiation was blocked room.
by the shade sails under field conditions. All
westernsydney.edu.au 11WESTERN SYDNEY UNIVERSITY
FIGURE 4: Systematic assessment of 1.3 RESULTS 1.3.1 TEMPERATURES IN DIRECT SUN
playground surface materials. The images show In and around the playgrounds investigated,
Surface temperatures in playgrounds can
a wide range of surface materials, including surface materials included pine bark mulch,
vary widely, depending on material, colour,
different rubber softfall materials and colours rubber softfall, synthetic and real turf,
as well as synthetic turf samples with different orientation towards the sun, environmental
conditions such as intensity of solar irradiance concrete, bare soil and bricks for delineation
pile heights. The materials were exposed to
and air temperature. and other variables. of playground surfaces and pathways. When
continuous sunshine in a testing facility of the
Solar Institute at the Hawkesbury Campus, Some of these variables can be controlled unshaded, these surface materials had very
Western Sydney University, Richmond, NSW. while others cannot. For environmental different temperatures and, depending on
monitoring of playgrounds, we focussed on the materials, could differ by more than 30°C.
surface temperature, air temperature and feels General trends were observed for some surface
like temperature measured in the sun and materials in the sun and are summarised as:
shade during warm and hot summer days in (a). Bark mulch was always hotter than bricks
the suburbs of Auburn, Greystanes, Granville, or concrete (Fig. 5A, B)
Merrylands, South Granville and Toongabbie in
(b). Old and new concrete was always cooler
Western Sydney.
than red bricks (Fig. 5A, B)
(c). Synthetic turf was always hotter than real
turf (Fig. 5C, D)
(d). Real turf was always cooler than concrete
or bark mulch (Fig. 5E, F)
(e). Surface temperatures could change
abrupt (Fig. 5A-D) or gradually
(Fig. 5E, F)
12 Western Sydney UniversityCLIMATE-SMART PLAYGROUNDS
FIGURE 5: Surface
temperatures of
different unshaded
materials in summer.
Panels on the left
show the normal
view, while those
on the right show
the infrared view
where temperature
is represented by
colour (see scale
on the right of each
panel). (A, B) Bark
mulch (top), red
bricks (middle)
and new concrete
(bottom). (C, D)
Natural turf (left) and
synthetic turf (right).
(E, F) Bark mulch
(left), old concrete
(middle) and natural
turf (right).
westernsydney.edu.au 13WESTERN SYDNEY UNIVERSITY
The absolute highest individual surface 90 ●
● ●
temperatures were measured on 4 January ●
● ●
●
2020, a day of extreme heat with air
temperatures well above 40°C throughout ●
●
Cumberland. The highest single air temperature 70
● ●
Tsurface (°C )
measurement was 49.4°C, recorded at 13:33 ●
in the playground of Bennelong Park. During
● ●
that day, we measured a maximum surface
temperature of 93.7°C on old synthetic turf ●
●
50 ●
●
in the same playground. The hottest surface ●
temperature of play equipment was detected
30 minutes earlier in Memorial Park where ●
the top of a blue rubber dolphin showed a
surface temperature of 91.8°C. At the time 30
RS 1
ST 1
RS 3
RS 2
ST 2
bark mulch
dry turf
red brick
old concrete
new concrete
turf
these measurements were recorded, surfaces
and play equipment of both playgrounds
were unshaded. The combined effects of
hot ambient air temperatures and additional
radiant heat from the unshaded surfaces
resulted in feels like temperatures (measured FIGURE 6: Surface temperatures (Tsurface) in summer of a range of sunlit materials found in and
using black globe thermometers) of 64.1°C at around public playgrounds. RS 1 (black rubber softfall): n = 25. ST 1 (old synthetic turf): n = 15. RS
Bennelong Park and 61.9°C at Memorial Park. 3 (dark blue rubber softfall at Memorial Park): n = 35. RS 2 (green, blue, red and dark-speckled
Although the playgrounds were not being used rubber softfall): n = 110. ST 2 (new synthetic turf): n = 40. Bark mulch: n = 75. Dry turf (i.e., real turf
by children during these temperature extremes, that is yellow/brown): n = 40. Red brick: n = 10. Old concrete: n = 35. New concrete: n = 85. Turf
(i.e., real turf that is green): n = 75. Red dots show the mean Tsurface, black lines the median, top and
the measurements are important because they
bottom of the box represents 75th and 25th percentiles, whiskers show maximum and minimum
demonstrate the potential hazards in unshaded
values and black dots depict potential outliers. Data were collected during the early afternoon on
playgrounds during summer. clear days during the summer of 2019/20 and 2020/21. See Section 1.2 for more details about data
Very hot surface temperatures around 90°C collection.
were also measured on black rubber softfall.
Rubber softfall surfaces and those covered with
synthetic turf had the highest average surface
temperature (70-75°C; Fig. 6). Side-by-side
comparisons at the playground in Bennelong When assessing natural surface materials in increased sharply. During very hot summer
Park revealed that newer synthetic turf had and around playgrounds, real turf, especially days, unshaded dry turf reached surface
always lower surface temperatures compared when irrigated, usually had the coolest surface temperatures of 60°C and above (Fig. 7).
to older synthetic turf. The lowest average temperatures in direct sunshine. When air
surface temperature of a material exposed Regardless of warm or hot air temperatures,
temperatures increased above 40°C, unshaded
to full sun was 37°C, measured on real turf unshaded bark mulch had the highest
real turf remained cool and its surface
(Fig. 6). surface temperatures of all three natural
temperature mirrored air temperature (Fig. 7).
surface materials. On a clear day when the
However, when real turf was not irrigated, it
air temperature was 28°C, the surface of
yellowed and appeared dead (dry turf). This
unshaded bark mulch was already 50-60°C.
resulted in exposure of dry patches of bare
When air temperatures increased, the surface
soil, which dramatically increased surface
temperature of unshaded bark mulch increased
temperature. With increasing air temperature,
to nearly 80°C (Fig. 7).
surface temperature of unshaded dry turf
14 Western Sydney UniversityCLIMATE-SMART PLAYGROUNDS
With increasing surface temperatures of the
three natural materials, the associated feels 80 ● turf FIGURE 7:
like temperature (black globe temperature, ● Relationship
● dry turf
Tglobe) increased. While surface temperatures ● between ambient air
● bark mulch temperature (Tair) and
of irrigated turf rarely increased above 40°C, ●
● surface temperature
very high temperatures during the summer
●● (Tsurface) on natural
of 2019/20 resulted in feels like temperatures ●● materials in full
Tsurface (°C )
60 ●
of more than 50°C over this material (Fig. sunlight. Turf: n = 40.
8). However, emission of heat from the hot ● Dry turf: n = 30. Bark
●
surfaces of dry turf and bark mulch increased ● ● mulch: n = 45. Data
feels like temperatures even more, producing ● were collected during
●
feels like temperatures of above 60°C (Fig. 8). the early afternoon
●
● ● on clear days during
40
Rubber softfall and synthetic turf were ● the summer of
generally the hottest surface materials to ●● ● 2019/20 and 2020/21.
be found in playgrounds. When unshaded, ● See Section 1.2 for
and regardless of ambient temperatures, more details about
these surface materials always had very high data collection.
mean temperatures and the highest absolute 20
maximum temperatures. Examples of high 20 40 60 80
surface temperatures of rubber softfall are
provided in Figure 9. Large differences in Tair (°C )
surface temperatures as result of different
materials, but not colour, were also visible when
comparing red rubber softfall with red concrete 80
FIGURE 8:
pavers (Fig. 9D). ● turf
Relationship between
● dry turf surface temperature
70 ● bark mulch (Tsurface) and black
globe temperature
(Tglobe) on natural
● materials in full
●● ●
Tglobe (°C )
60 sunlight. Turf: n = 40.
● ●● ● Dry turf: n = 30. Bark
● ● mulch: n = 45. Data
● ●
were collected during
50 the early afternoon
on clear days during
●●
● the summer of
● ● ●● ●
40 ● ● 2019/20 and 2020/21.
● See Section 1.2 for
more details about
data collection.
30
30 40 50 60 70 80
Tsurface (°C )
westernsydney.edu.au 15WESTERN SYDNEY UNIVERSITY
FIGURE 9: Surface
temperatures of
unshaded rubber
softfall in summer.
Panels on the left
show the normal
view, while those
on the right show
the infrared view
where temperature is
represented by colour
(see scale on the
right of each panel).
(A, B) Blue and
green rubber softfall
in Memorial Park
(4 January 2020).
(C, D) Blue and red
rubber softfall in
Auburn Park (16
January 2021). (E,
F) Black impact tile
at the end of a slide
in Holroyd Gardens
(17 January 2019);
this image is added
for demonstration
purpose only; surface
temperatures shown
in the image were
not included in the
analyses presented in
this report, because
the playground
was not part of the
monitoring program.
16 Western Sydney UniversityCLIMATE-SMART PLAYGROUNDS As evident in Figure 9D, the colour of rubber FIGURE 10: Example of the effect of colour on surface temperature of unshaded rubber softfall. softfall affects its surface temperature. The panel on the left shows the normal view, while the panel on the right shows the infrared view According to the infrared image, the dark red where surface temperature is represented by colour (see scale on the right side of the panel). The and green rubber surface had a temperature image was taken at Memorial Park, Merrylands on 4 January 2020. of 70°C, while the surrounding light blue surface was up to 6°C cooler. A side-by-side comparison of blue and green rubber softfall Unshaded, non-natural surface materials materials were as high as 65-75°C (Fig. 11). from Memorial Park is used here to further like synthetic turf and rubber softfall With increasing air temperatures, surface demonstrate the effect of surface colour on had very high temperatures, even when temperatures of all non-natural materials rose surface temperature (Fig. 10). The darker blue ambient temperatures were not particularly further. This increase in surface temperature surface had a mean surface temperature of warm. Measurements from three different was least on new concrete, and the most on red 85°C, while the slightly lighter green surface playgrounds showed that during clear coloured rubber softfall. Surface temperatures had a mean surface temperature of 83°C, which summer days with ambient air temperatures of all materials, except concrete, increased was still very hot. below 30°C, surface temperatures of these much faster compared to air temperatures. Different surface temperatures were also measured on speckled rubber softfall surfaces represented in the playground at Auburn Park. A surface with a mix of green, orange and red rubber granules was 5°C hotter (66°C) compared with a surface that had a mix of blue, beige and white granules (61°C). The surface temperature of the same mix of green, orange and red rubber granules was also up to 3°C hotter (81°C) compared to a surface made using predominately orange and light brown granules (78°C). westernsydney.edu.au 17
WESTERN SYDNEY UNIVERSITY
The relationship between surface FIGURE 11: Relationship
temperature and feels like temperature was ● between ambient air
● temperature (Tair) and
positive for all non-natural materials (Figure
80
12). However, feels like temperature above ●● surface temperature
● ● ● (Tsurface) on unshaded
materials that already had high surface
non-natural surface
temperatures tended to also be higher. This ●
materials found in and
was particularly true for synthetic turf at ● around playgrounds.
Tsurface (°C )
Bennelong Park and blue rubber softfall at New concrete: n = 10.
60
Memorial Park. For concrete, a small change ● ST 1 (old synthetic
in surface temperature (from 48 to 55°C, ● ● turf): n = 15. RS 2 (blue
7°C increase) resulted in a large change in rubber softfall only): n
●
feels like temperature (from 46 to 59°C, 13°C = 15. RS 2 (red rubber
increase). The proportional increase in surface softfall only): n = 15. RS
40 ● new concrete 3 (blue rubber softfall
and feels like temperatures was reversed for
● ST 1 at Memorial Park): n =
synthetic turf and rubber softfall materials,
● RS 2 15. Data were collected
showing a much smaller increase in feels
● RS 2 during the early
like temperature compared to the measured
RS 3 afternoon on clear days
increase in surface temperature. ●
during the summer of
20
2019/20 and 2020/21.
The different responses of non-natural 20 40 60 80
See Section 1.2 for
materials (concrete vs synthetic turf
and rubber softfall) shed light on their Tair (°C ) more details about data
collection.
thermal properties related to reflection
and absorption of solar radiation. The high
density of concrete caused this material to
heat up slowly and its light surface colour
allowed it to absorb less solar radiation.
Instead, solar radiation was reflected which 90 FIGURE 12:
● new concrete Relationship between
led to much warmer feels like temperatures.
surface temperature
On the other hand, less dense synthetic ● ST 1
(Tsurface) and black
turf and rubber softfall had less reflective 80 ● RS 2
globe temperature
surfaces. As consequence, solar radiation was ● RS 2 (Tglobe) on unshaded
absorbed more by these materials resulting in ● RS 3 non-natural surface
greater surface temperatures and, when days materials found in and
Tglobe (°C )
became hotter, the feels like temperature 70 around playgrounds.
above these surfaces increased less New concrete: n = 10.
compared to the more reflective concrete. ST 1 (old synthetic
A similar effect is illustrated in Figures 8 and ● ● turf): n = 15. RS 2 (blue
60 ● rubber softfall only): n
9 where the surface temperature of real turf ●
= 15. RS 2 (red rubber
was less compared to dry turf and bark mulch ● softfall only): n = 15. RS
when air temperatures increase. However, ●● 3 (blue rubber softfall
feels like temperatures increase more steeply 50 at Memorial Park): n =
over warming real turf compared to the other ● ● 15. Data were collected
● ● ●
two natural surfaces because they absorbed during the early
●
more solar radiation (resulting in higher afternoon on clear days
40
surface temperatures) and reflected less during the summer of
40 50 60 70 80 90
(resulting in a smaller increase in feels like 2019/20 and 2020/21.
temperatures over warming surfaces). Tsurface (°C ) See Section 1.2 for
more details about data
collection.
18 Western Sydney UniversityCLIMATE-SMART PLAYGROUNDS
80
●
● FIGURE 13: Surface temperatures (Tsurface) in summer of a range of
●
●
● shaded materials found in and around public playgrounds. RS 2 (green,
Tsurface (°C )
60 blue, red and dark-speckled rubber softfall): n = 60. RS 3 (dark blue
rubber softfall at Memorial Park): n = 20. Dry turf: n = 40. Red brick: n
= 5. Bark mulch: n = 55. ST 1 (old synthetic turf): n = 15. New concrete: n
= 45. Old concrete: n = 10. Turf: n = 45. Red dots show the mean Tsurface,
●
● ● black lines the median, top and bottom of the box represents 75th and
● ●
40 25th percentiles, whiskers show maximum and minimum values and
●
● black dots are potential outliers. Data were collected during the early
●
●
afternoon on clear days during the summer of 2019/20 and 2020/21. See
Section 1.2 for more details about data collection.
20
RS 2
RS 3
dry turf
red brick
bark mulch
ST 1
new concrete
old concrete
turf
1.3.2 THE COOLING EFFECT OF SHADE although reduced by shade, the mean surface In and around playgrounds, shade was
Shade markedly reduced the surface temperatures of these materials remained the provided by trees, play equipment and, in
temperature of all materials. On average, high in the shade (Fig. 13). The mean surface one playground, by a shade sail. Tree shade
across synthetic and natural surface materials, temperature of darker rubber softfall was 46°C reduced the mean surface temperature of dry
surface temperatures were 20°C cooler when in the shade. turf from 71°C to 45°C (Fig. 14A, B). In the same
measured in the shade. The cooling effect of playground, tree shade reduced the surface
Shading bark mulch reduced mean surface
shade was greater for surface materials that temperature of real turf by 10°C and bark
temperatures from 60°C to 41°C, and when
had high temperatures in the sun. Hence, mulch from 58°C to 24°C (Fig. 14C, D). A similar
bricks were shaded their mean surface
shading synthetic turf reduced mean surface cooling effect on surface temperatures was
temperature dropped by 12°C. As a result of
temperature of this material by nearly 40°C, provided by shade cast from play equipment
having a relatively low surface temperature
from 73°C to 35°C (Fig. 13). Shading darker (Fig. 14E, F). Although shade from these solid
in the sun, shade reduced the mean surface
rubber softfall surfaces reduced mean surface objects was very effective and not as patchy as
temperature of real turf by 8°C from 37°C to
temperatures between 26°C and 29°C. It is some tree shade (compare images in Fig. 15C
29°C.
worth noting, that rubber softfall had high and E for example), the resulting shaded areas
surface temperatures in the full sun and were always small and often inaccessible.
westernsydney.edu.au 19WESTERN SYDNEY UNIVERSITY
FIGURE 14: Cooling
effect of shade on
surface temperature
of natural materials.
Panels on the left
show the normal
view, while those
on the right show
the infrared view
where temperature
is represented by
colour (see scale
on the right of each
panel). (A, B) Shade
of a mature fig tree
cooling the surface
temperature of dry
turf (Colquhoun Park,
4 January 2020).
(C, D) Shade of a
mature gum tree
cooling the surface
temperature of turf,
concrete and bark
mulch (Colquhoun
Park, 16 January
2021). (E, F) Shade
of play equipment
cooling the surface
temperature of bark
mulch (Colquhoun
Park, 16 January
2021).
20 Western Sydney UniversityCLIMATE-SMART PLAYGROUNDS
Shading natural surface materials during
summer was the most effective way of reducing ● turf FIGURE 15:
surface temperatures on real turf. Surface 50 ● Relationship
● dry turf between ambient air
temperatures on dry turf and bark mulch ● ●
● bark mulch temperature (Tair) and
remained hotter compared to green grass even
●● surface temperature
when shaded (Fig. 15). The difference in surface ●
●● (Tsurface) on natural
temperature between these materials was less
● materials in the
Tsurface (°C )
than 10°C during days where air temperatures ●
40 shade. Turf: n = 15.
were below 30°C. Once air temperatures were Dry turf: n = 35. Bark
very hot, the difference in surface temperatures ● ● mulch: n = 35. Data
increased to more than 12°C, demonstrating the were collected during
natural cooling effect of green grass particularly
●
● the early afternoon
during hot summer days. on clear days during
30 the summer of
The lower surface temperatures of shaded ● 2019/20 and 2020/21.
real turf did not translate to lower feels like See Section 1.2 for
temperatures. These temperatures were similar ● more details about
for all three natural materials during warm and ● data collection.
hot summer days (Fig. 16). Regardless of surface 20
temperature differences of more than 10°C 20 30 40 50
between real turf and dry turf or bark mulch,
feels like temperatures were the same. This result Tair (°C )
highlights that shading has a much larger cooling
effect on a body compared to the warming effect
of heat being emitted from a surface.
60
Shading rubber softfall and synthetic turf FIGURE 16:
had the greatest cooling effect on surface ● turf
Relationship between
temperatures (see Figs. 6 and 13). Some ● dry turf surface temperature
examples are used here to demonstrate the ● bark mulch (Tsurface) and black
cooling effect of tree shade on non-natural 50 ● globe temperature
surface materials. During a warm summer day ● ● ●●● (Tglobe) on natural
(16 January 2021), tree shade in Auburn Park ● ● materials in the
T globe (°C )
● shade. Turf: n = 15.
reduced surface temperatures of speckled light
● Dry turf: n = 35. Bark
blue and a darker red rubber softfall by 51°C 40 ● mulch: n = 35. Data
(from 74°C to 23°C; Fig. 17A, B). This remarkable were collected during
cooling effect was realised within just 2 m
●
the early afternoon
of distance from full sunshine to dense tree on clear days during
shade provided by a fig tree. A young Chinese ● the summer of
30
elm nearby effectively reduced the surface ● ● 2019/20 and 2020/21.
temperature of light-coloured concrete from ● ● See Section 1.2 for
50°C to 25°C (Fig. 17C, D). On 4 January 2020, more details about
shade from play equipment in The Portico Park data collection.
in Toongabbie cooled dark blue rubber softfall 20
from 82°C to 43°C (Fig. 17E, F). The image at 20 30 40 50 60
Portico Park was taken at 11:00, indicating that
surface temperatures were elevated in full sun. Tsurface (°C )
The reduction of very high surface temperatures
over incredibly short distance underlines
the effectiveness of shade to reduce surface
temperatures in playgrounds.
westernsydney.edu.au 21WESTERN SYDNEY UNIVERSITY FIGURE 17: Cooling effect of shade on rubber softfall and concrete in summer. Panels on the left show the normal view, while those on the right show the infrared view where temperature is represented by colour (see scale on the right of each panel). (A, B) Shade of a mature gum tree cooling the surface temperature of blue and red rubber softfall and new concrete (Auburn Park, 16 January 2021). (C, D) Shade of a young Chinese elm cooling the surface temperature of new concrete (Auburn Park, 16 January 2021). (E, F) Shade of play equipment cooling the surface temperature of rubber softfall (The Portico Park, 4 January 2020). 22 Western Sydney University
CLIMATE-SMART PLAYGROUNDS

                                                                                                                                FIGURE 18: Cooling
                                                                                                                                effect of the shade
                                                                                                                                sail at Kootingal
                                                                                                                                Reserve on (A, B)
                                                                                                                                play equipment
                                                                                                                                and (C, D) bark
                                                                                                                                mulch surface
                                                                                                                                temperatures of
                                                                                                                                unshaded playground
                                                                                                                                equipment in
                                                                                                                                summer. Panels
                                                                                                                                on the left show
                                                                                                                                the normal view,
                                                                                                                                while those on
                                                                                                                                the right show the
                                                                                                                                infrared view where
                                                                                                                                temperature is
                                                                                                                                represented by colour
                                                                                                                                (see scale on the
                                                                                                                                right of each panel).
                                                                                                                                Images were taken on
                                                                                                                                16 January 2021 (A, B)
                                                                                                                                and 4 January 2020
                                                                                                                                (C, D).

The rectangular shade sail at Kootingal Reserve     the sail. During the afternoon of 16 January      indicating that 94% was blocked (Fig. 19B). Of
in Greystanes covered most of the play space        2021, reduction of solar radiation under the      the 46 W m-2 UV light in the full sun, 33 W m-2
during the day. Shade was not cast on the           sail reduced feels like temperatures from 43°C    was in the UV-A and 13 W m-2 was in the UV-B
swings at the western end of the playground         in the sun to 31°C in the shade. However, the     spectral range. Underneath the shade sail, the
only during the late afternoon (Fig. 18A, B).       shade sail did not provide greater cooling        measured UV light intensity was reduced by
The surface of the playground was covered           benefits for air and feels like temperatures      93% of full sun light and by 95% in the UV-A
with bark mulch. Sections of the mulch that         during 40°C+ days. For example, on 4 January,     spectral range. These UV blocking levels equate
were unshaded reached surface temperatures          air and feels like temperatures on unshaded       to a ranking of ‘moderate’ to ‘high’ according to
between 60°C and 80°C and peaked with               mulch were 43°C and 58°C, while they were         the guidelines provided by the Cancer Council
a maximum temperature of 86°C (12:00, 4             42°C and 48°C on shaded mulch.                    NSW.
January 2020). Shade cast by the sail reduced
                                                    Total irradiance (i.e., the amount of power       The manufacturer rated the sail fabric with
the surface temperature of the bark mulch
                                                    from sunshine received by a surface in per unit   an Ultraviolet Protection Factor (UPF) of
by 25-40°C (Fig. 18C, D). Surface cooling was
                                                    area) ranged between 917 and 1056 W m-2           15. According to AS 4399:1996 (Australian
particularly effective during very hot days.
                                                    during light measurements at the playground       Standards, 1996) a UPF rating between 15 and
The shade sail also influenced air and feels like   (Fig. 19A). Measurements using the portable       24 is equivalent to 93.3-95.9% UV blockage.
temperatures in the playground. Simultaneous        spectrophotometer showed that only 13% of         Hence, measurements from the playground
measurements on the sunlit and shaded               all light measured was transmitted through        at the Kootingal Reserve reflect the light
bark mulch about 8 m apart showed that air          the lime green shade sail, effectively blocking   transmission characteristics reported by the
temperatures were nearly 1°C cooler under           87%. Only 6% of UV-radiation was transmitted,     manufacturer of the fabric. We acknowledge

westernsydney.edu.au                                                                                                                                23
WESTERN SYDNEY UNIVERSITY
2.5
(A) full sun
)
2.0
2
green sail
Irradiance (Wm
1.5
FIGURE 19: Effect of shade
cloth on light conditions in
1.0 a playground. Panels show
irradiance (A) and light
0.5 blocked (B) by the shade
sail at Kootingal Reserve
during the early afternoon
0.0
on 16 January 2021. Light
100 spectra are means of three
Reduction: 94%
(B ) individual measurements.
Light blocked (%)
The grey area in panels
90 A and B indicate ±1 SD.
The purple area in panel B
indicates the spectrum of
UV-B and UV-A radiation
80 (280-400 nm). The
reduction of 94% relates to
UV-A + UV-B radiation only.
70
250 400 550 700 850 1000
Wavelength (nm)
that the Australian Radiation Protection 1.3.3 SURFACE REPAIRS AND AGING repaired using a coarse black rubber granulate
and Nuclear Safety Agency (ARPANSA) Installation of non-natural surfaces in which, on a sunny day in January 2021, was
recommends using the Ultraviolet Effectiveness playgrounds requires highly trained 8-15°C hotter compared to the original surface
(UVE%) rating, based on the newer standard professionals, not only to meet regulations for material. Similarly, at a playground in Ropes
AS 4174:2018. However, this rating was not impact attenuation of surfaces according to fall Crossing where a defect in light-coloured
available from the manufacturer for the sail height, but also to ensure the installation itself rubber softfall was repaired using black rubber,
fabric used in the playground. If the UVE% lasts many years of use. For several reasons surface temperatures increased from 64°C
would be applied, the fabric would fall into the (e.g., tree roots, vandalism, high impact use, to 77°C. The age of synthetic turf made a
‘very effective’ and ‘most effective’ categories. UV breakdown) synthetic turf and rubber noticeable difference in surface temperatures
ARPANSA recommends using only shade softfall surfaces can fail and need repair work. at Bennelong Park (Fig. 20E, F). The surface
sail materials that fall into the highest UVE% These tasks also require professional skills and temperature of old synthetic turf with a pile
category (i.e., greater than 97.5% UV block) for a sound understanding how to restore the height less than 2 mm, was 6°C warmer
effective protection from UV radiation. integrity of the playground surface. During compared to a newer synthetic turf patch that
visits to playgrounds in Cumberland, and had a pile height of at least 4 mm. Throughout
other locations, we found examples of poor the playground, three different types of
craftsmanship when repairing rubber softfall synthetic turf was used, and all had slightly
surfaces. Not only were these repairs visually different surface temperatures.
and technically unsatisfactory, but they also
added more surface heat to the playgrounds
(Fig. 20A-D). For example, at the playground at
Auburn Park, a hole in red rubber softfall was
24 Western Sydney UniversityCLIMATE-SMART PLAYGROUNDS
FIGURE 20: Effect
of inappropriate
patching of rubber
softfall (A-D) and
wear of synthetic
turf (E, F) on surface
temperatures. All
depicted surfaces
were unshaded.
Panels on the left
show the normal
view, while those
on the right show
the infrared view
where temperature
is represented by
colour (see scale
on the right of
each panel). (A, B)
Patch at Auburn
Park (Auburn Park,
16 January 2021).
(C, D) Shade of
a young Chinese
elm cooling the
surface temperature
of new concrete
(Barinya Park,
Ropes Crossing,
20 March 2020);
this image is added
for demonstration
purpose
only; surface
temperatures
shown in the image
were not included
in the analyses
presented in this
report, because
the playground
was not part of the
monitoring program.
(E, F) Old (top)
and new (bottom)
synthetic turf at
Bennelong Park (16
January 2021).
westernsydney.edu.au 25WESTERN SYDNEY UNIVERSITY
1.3.4 PLAY EQUIPMENT TABLE 2: Burn thresholds of skin (modified from ISO 13732).
High surface temperatures are not only an
issue for unshaded ground surfaces, but BURN THRESHOLD (°C)
also for unshaded play equipment. In the six MATERIAL Contact time: Contact time: Contact time:
playgrounds investigated, play equipment was MATERIAL CHARACTERISTICS 3 seconds 5 seconds 1 minute
made from coated and uncoated metal and Metal uncoated 60 57 51
were composed from a range of different types Coated metal Powder: 90 µm 65 60 51
and colours of plastic. Surface temperatures Stone material Concrete, granite, asphalt 73 60 56
of more than 90°C were recorded during this Plastic Polyamide, acryl, duroplastic 77 74 60
project. Wood Bare, low moisture 99 93 60
The ISO Standard 13732-1 (2006) lists contact
times and surface temperatures of burn Examples of surface temperatures of play this surface for three seconds caused great
thresholds for a range of materials commonly equipment are provided in Figure 21. The thermal discomfort. However, the reduction of
used in the manufacturing of playground infamous blue rubber dolphin (Fig. 21A, B) surface temperature by 6°C demonstrates the
equipment. Table 2 shows that these contact had a maximum surface temperature of 91.8°C high heat conductance capacity of this plastic
times and surface temperatures are much (note: the transformation of the playground material. While time spent on a slide is usually
lower than the temperatures reported here for at Memorial Park resulted in shading the short, children are inclined to spend longer
surfaces and play equipment. Contact times to dolphin). High-density plastic materials can time intervals on swings. The modern black
avoid skin burns are very short and threshold conduct heat well. The sun-exposed sidewall plastic bowl swing represents a great asset at
temperatures especially for metal and plastics of the green plastic slide in the playground Auburn Park and allows inclusive play (Fig. 21E,
are relatively low. The differences in threshold at Portico Park had a surface temperature F). However, as it was unshaded, its surface
temperatures and contact times are related to of 73°C at 11:20 on 4 January 2020 (Fig. 21C, temperature was up to 82°C, representing a
the thermal conductance of different materials. D). The part of the slide where a child would potential burn hazard.
play was only slightly cooler (67°C). Touching
26 Western Sydney UniversityYou can also read