Heterogeneous Expression of Nuclear Encoded Mitochondrial Genes Distinguishes Inhibitory and Excitatory Neurons
←
→
Page content transcription
If your browser does not render page correctly, please read the page content below
Research Article: New Research

Neuronal Excitability

Heterogeneous Expression of Nuclear Encoded
Mitochondrial Genes Distinguishes Inhibitory and
Excitatory Neurons
Meghan E. Wynne,1,p Alicia R. Lane,1,p Kaela S. Singleton,1,p Stephanie A. Zlatic,1 Avanti Gokhale,1
Erica Werner,1 Duc Duong,2 Jennifer Q. Kwong,3 Amanda J. Crocker,4 and Victor Faundez1

https://doi.org/10.1523/ENEURO.0232-21.2021
1
 Department of Cell Biology, Emory University, Atlanta, GA 30322, 2Department of Biochemistry, Emory University,
Atlanta, GA 30322, 3Department of Pediatrics, Emory University, Atlanta, GA 30322, and 4Program in Neuroscience,
Middlebury College, Middlebury, VT 05753

Abstract
Mitochondrial composition varies by organ and their constituent cell types. This mitochondrial diversity likely
determines variations in mitochondrial function. However, the heterogeneity of mitochondria in the brain re-
mains underexplored despite the large diversity of cell types in neuronal tissue. Here, we used molecular sys-
tems biology tools to address whether mitochondrial composition varies by brain region and neuronal cell type
in mice. We reasoned that proteomics and transcriptomics of microdissected brain regions combined with
analysis of single-cell mRNA sequencing (scRNAseq) could reveal the extent of mitochondrial compositional
diversity. We selected nuclear encoded gene products forming complexes of fixed stoichiometry, such as the
respiratory chain complexes and the mitochondrial ribosome, as well as molecules likely to perform their func-
tion as monomers, such as the family of SLC25 transporters. We found that the proteome encompassing
these nuclear-encoded mitochondrial genes and obtained from microdissected brain tissue segregated the
hippocampus, striatum, and cortex from each other. Nuclear-encoded mitochondrial transcripts could only
segregate cell types and brain regions when the analysis was performed at the single-cell level. In fact, single-
cell mitochondrial transcriptomes were able to distinguish glutamatergic and distinct types of GABAergic neu-
rons from one another. Within these cell categories, unique SLC25A transporters were able to identify distinct
cell subpopulations. Our results demonstrate heterogeneous mitochondrial composition across brain regions
and cell types. We postulate that mitochondrial heterogeneity influences regional and cell type-specific mecha-
nisms in health and disease.
Key words: GABA; glutamate; mitochondria; mitochondrial ribosome; respiratory chain; solute transporter

    Significance Statement
    Mitochondria are important organelles for maintaining brain health. The composition of proteins making up
    mitochondria is essential for their function. Disturbances to mitochondria are thought to contribute to neuro-
    degeneration and neurodevelopmental disorders. These conditions typically affect specific brain regions or
    cell types. Despite the link between mitochondria and diseases with distinct anatomic and cellular patterns,
    how mitochondrial composition varies across brain regions and cell types remains poorly explored. Here,
    we analyze mitochondrial composition in different brain regions and cell types in adult mice, showing com-
    position differs by region and cell lineage. Our work provides a resource of genes enriched in certain cell
    types or regions that improves our understanding of how mitochondrial composition influences brain func-
    tion in health and disease.

July/August 2021, 8(4) ENEURO.0232-21.2021 1–15
Research Article: New Research      2 of 15

Introduction                                                                     components of mitochondria that have a fixed stoichi-
   The mitochondrion is classically depicted as the power-                       ometry (Vafai and Mootha, 2012), as well as the
house of the cell despite performing a variety of functions                      SLC25A transporter family, as molecules of variable ex-
outside of ATP production (Spinelli and Haigis, 2018). From                      pression among tissues (Cunningham and Rutter, 2020;
a purely bioenergetic perspective, some of these functions                       Palmieri et al., 2020; Rath et al., 2021). Collectively, this
are necessary for energy requirements to maintain plasma                         set of genes encompasses 18% of the mitochondria-
membrane potential, synaptic activity, and actin cytoskele-                      annotated proteome (Rath et al., 2021). Notably, while
ton dynamics (Attwell and Laughlin, 2001; Bernstein and                          the expression of this selected set of nuclear encoded
Bamburg, 2003; Harris et al., 2012). However, additional                         mitochondrial genes produced distinct regional clusters
roles for mitochondria have been identified in behavior, syn-                    differentiating the cortex, hippocampus, and striatum at
aptic plasticity, neuronal migration, neurodevelopment, cal-                     the proteome level, analysis of the transcript expression of
cium buffering, lipid metabolism, and cell death (Kann and                       these nuclear encoded mitochondrial genes could not distin-
Kovács, 2007; Mattson et al., 2008; Mann et al., 2021). The                      guish between these three different brain regions. However,
requirement of functional mitochondria for neuronal tissue is                    at the single-cell level, distinct cortical and hippocampal
perhaps best demonstrated by the family of mitochondrial                         regions could be distinguished by differential expression of
diseases, which share a high prevalence of neurologic                            mitochondrial ribosome, SLC25A (inner mitochondrial mem-
symptoms despite being otherwise clinically heterogeneous                        brane transporters), or individual respiratory chain complex
(Chinnery, 1993; Vafai and Mootha, 2012; Gorman et al.,                          transcripts. Expression of mitochondrial genes could promi-
2016).                                                                           nently distinguish excitatory and inhibitory neurons, as well as
   Mitochondria are dynamic organelles and vary pheno-                           different classes of GABAergic interneurons.
typically by organ, cell type, and even within the cell                             The present study demonstrates that nuclear encoded
(Pagliarini et al., 2008; Aryaman et al., 2018; Fecher et al.,                   mitochondrial transcripts and proteins are differentially
2019; Rath et al., 2021). These differences in phenotypes                        expressed across brain regions and cell types, informing
may emerge because of variation in mitochondrial com-                            our understanding of the molecular diversity and hetero-
position across cell types and/or within a single cell. This                     geneity within the brain. Our work expands recent findings
concept has been poorly considered and explored to                               demonstrating that mitochondria differ in composition
date, as most studies of mitochondrial biology involve                           among cell populations in the cerebellum (Fecher et al.,
bulk purification of mitochondria from diverse organs                            2019) and between fast-spiking and regular spiking neu-
(Pagliarini et al., 2008; Fecher et al., 2019; Rath et al.,                      rons (Cserép et al., 2018). We postulate that cell lineage-
2021). Cell type-specific differences in mitochondrial                           specific mitochondrial composition and metabolism are
composition could determine differential cellular sus-                           poised to contribute to the susceptibility of certain cell
ceptibility to neurodevelopmental disorders and neu-                             types to damage and/or cell death in diseases of the nerv-
rodegenerative diseases. Here, we address whether                                ous system.
mitochondrial composition varies across cell types
and brain regions. We take advantage of systems biol-
ogy gene expression analyses in microdissected brain                             Materials and Methods
tissue and single-cell mRNA sequencing (mRNAseq)                                 Animals and tissue dissection
datasets. We analyzed the transcriptome and proteome                                Animal husbandry and euthanasia was conducted as ap-
in microdissected mouse cortex, hippocampus, and                                 proved by our Institutional Animal Care and Use Committees.
striatum. We focused on the five respiratory chain com-                          C57BL/6J male mice (The Jackson Laboratory #000664),
plexes and the mitochondrial ribosome, as necessary                              six weeks of age, were euthanized with CO2 asphyxiation
                                                                                 and decapitated. Whole brain was removed, rinsed in
                                                                                 ice-cold phosphate buffered saline and placed in a pre-
Received May 21, 2021; accepted July 17, 2021; First published July 26, 2021.
                                                                                 chilled adult mouse coronal slicing matrix with 1.0-mm
  The authors declare no competing financial interests.
  Author contributions: V.F. designed research; S.A.Z., D.D., and V.F.           slice interval (Zivic catalog #BSMAS001-1). Chilled
performed research; M.E.W., A.R.L., K.S.S., A.G., E.W., D.D., J.Q.K., A.J.C.,    blades were placed in the matrix channels according to
and V.F. analyzed data; M.E.W., A.R.L., K.S.S., A.J.C., and V.F. wrote the       manufactures recommendations and slices laid out on
paper.                                                                           an ice-cold aluminum block for punch microdissection.
  This work was supported by National Institutes of Health (NIH) Grants
1RF1AG060285 (to V.F.) and 4K00NS108539 (to K.S.S.). M.E.W. was                  Hippocampal regions were identified in sections #2 and
supported by NIH Grants F31AG067623 and 5T32NS007480. V.F. was                   #3 of the slices corresponding to sections 21–22 of the
supported by the Rett Syndrome Research Trust.                                   C57BL/6J Atlas (http://www.mbl.org/atlas170/atlas170_
  *M.E.W., K.S.S., and A.R.L. contributed equally to this work.                  frame.html). Cortex punches were taken adjacent to the
  Acknowledgements: We thank Maria Olga Gonzalez for providing
mitochondria.
                                                                                 hippocampal regions. Striatum was dissected from slice
  Correspondence should be addressed to Victor Faundez at vfaunde@               #6 or #7 corresponding to sections 15–16 of the C57BL/
emory.edu or Amanda J. Crocker at acrocker@middlebury.edu.                       6J Atlas. Punches of the brain tissue were taken using a
  https://doi.org/10.1523/ENEURO.0232-21.2021                                    chilled punch set with 1.00-mm diameter punches
Copyright © 2021 Wynne et al.
                                                                                 (Stoelting catalog #57401): six punches were taken from
This is an open-access article distributed under the terms of the Creative
Commons Attribution 4.0 International license, which permits unrestricted use,
                                                                                 each of the hippocampus, cortex, and striatum brain re-
distribution and reproduction in any medium provided that the original work is   gions (three from the left hemisphere and three from the
properly attributed.                                                             right hemisphere; Barr et al., 2004). Punches were

July/August 2021, 8(4) ENEURO.0232-21.2021                                                                                              eNeuro.org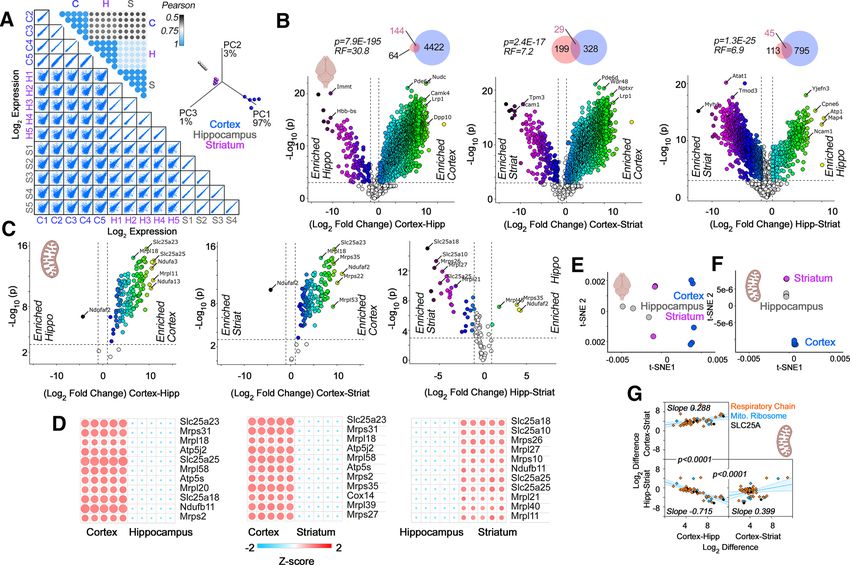
Research Article: New Research      3 of 15

ejected, transferred to a microcentrifuge tube using for-       output files and raw read files are publicly available
ceps, and flash frozen in liquid nitrogen until processing      (GEO with accession GSE140054). The FeatureCounts
for RNAseq or mass spectrometry (MS).                           compiled file is GSE140054_AllTissueFeatureCounts.
                                                                txt.gz. Gene counts were normalized using DESeq2
RNAseq                                                          (Love et al., 2014) followed by a regularized log trans-
   RNA extraction, library construction, and sequencing         formation. Differential Expression was determined
were done by BGI and are briefly described below. Total         using DESeq2 with the following settings: factors were
RNA was extracted with TRIzol and quality control was           tissue type, pairwise comparisons across tissues was
performed with the Agilent 2100 Bio analyzer (Agilent           done, output all normalized tables, size estimation was
RNA 6000 Nano kit) to do the total RNA sample QC: RNA           the standard median ratio, fit type was parametric,
concentration, RIN value, 28S/18S, and the fragment             outliers were filtered using a Cook’s distance cutoff.
length distribution.                                               We compared the top 100 genes whose expression
   For library construction, poly-A containing mRNA mole-       was different between cortex and hippocampus data from
cules were isolated using poly-T oligo-attached magnetic        our RNAseq study to the quantitative in situ hybridization
beads. Following purification, the mRNA was fragmented          data from the mouse brain atlas at the Allen Institute.
into small pieces using divalent cations under elevated         Correlation analysis was performed with Prism 9 for
temperature. The cleaved RNA fragments were copied              macOS version 9.1.1 (223), see Fig. 1.
into first strand cDNA using reverse transcriptase and ran-
dom primers. This was followed by second strand cDNA            MS
synthesis using DNA Polymerase I and RNase H. cDNA              Sample processing
fragments underwent addition of a single “A” base and              Each tissue piece was individually homogenized in
subsequent ligation of the adapter. The products were           500 ml of urea lysis buffer (8 M urea and 100 mM NaHPO4,
then purified and enriched with PCR amplification. We           pH 8.5), including 5 ml (100 stock) HALT protease and
quantified the PCR yield by Qubit and pooled samples to-        phosphatase inhibitor cocktail (Pierce). All homogeniza-
gether to make a single strand DNA circle (ssDNA circle),       tion was performed using a Bullet Blender (Next Advance)
which gave the final library. DNA nanoballs (DNBs) were         according to manufacturer protocols. Briefly, each tissue
generated with the ssDNA circle by rolling circle replication   piece was added to urea lysis buffer in a 1.5 ml Rino tube
(RCR) to enlarge the fluorescent signals at the sequencing      (Next Advance) harboring 750-mg stainless steel beads
process. The DNBs were loaded into the patterned nanoar-        (0.9–2 mm in diameter) and blended twice for 5-min inter-
rays and pair-end reads of 100 bp were read through on          vals at 4°C. Protein supernatants were transferred to 1.5-
the BGISEQ-500 platform for data analysis. For this step,       ml Eppendorf tubes and sonicated (Sonic Dismembrator,
the BGISEQ-500 platform combined the DNB-based nano-            Fisher Scientific) three times for 5 s with 15-s intervals of
arrays and stepwise sequencing using combinational              rest at 30% amplitude to disrupt nucleic acids and subse-
probe-anchor synthesis sequencing method. On average,           quently vortexed. Protein concentration was determined
we generated ;5.64 Gb bases per sample. The average             by the bicinchoninic acid (BCA) method, and samples
mapping ratio with reference genome was 93.47%, the av-         were frozen in aliquots at 80°C. Protein homogenates
erage mapping ratio with gene was 67.04%; 19,972 genes          (100 mg) were diluted with 50 mM NH4HCO3 to a final con-
were identified in which 19,972 of them are known genes         centration of less than 2 M urea and then treated with 1
and 2659 of them are novel genes; 29,781 novel transcripts      mM dithiothreitol (DTT) at 25°C for 30 min, followed by 5
were identified.                                                mM iodoacetimide (IAA) at 25°C for 30 min in the dark.
                                                                Protein was digested with 1:100 (w/w) lysyl endopepti-
Analysis of sequencing reads                                    dase (Wako) at 25°C for 2 h and further digested overnight
   The sequencing reads were uploaded to the Galaxy             with 1:50 (w/w) trypsin (Promega) at 25°C. Resulting pep-
web platform, and we used the public server at https://         tides were desalted with a Sep-Pak C18 column (Waters)
usegalaxy.org/ to analyze the data (Afgan et al., 2018).        and dried under vacuum.
FastQC was performed to remove samples of poor quality
(Andrews, 2010). All mapping was performed using                Tandem mass tag (TMT) labeling
Galaxy server (v. 21.01) running Hisat2 (Galaxy version           For each tissue type, 10 individual samples and one
2.1.01galaxy7), FeatureCounts (Galaxy version 2.0.1),           composite sample were labeled using the TMT 11-plex kit
and Deseq2 (Galaxy version 2.11.40.61galaxy1; Liao et           (ThermoFisher 90406). Labeling was performed as previ-
al., 2014; Love et al., 2014; Kim et al., 2015). The Genome     ously described (Ping et al., 2018; Higginbotham et al.,
Reference Consortium build of the reference sequence            2020). Briefly, each sample containing 100 mg of peptides
(GRCm38) and the GTF files (Ensembl) were used and              was re-suspended in 100 mM TEAB buffer (100 ml). The
can be acquired from iGenome (Illumina). Hisat2 was             TMT labeling reagents were equilibrated to room temper-
run with the following parameters: paired-end, un-              ature, and anhydrous ACN (256 ml) was added to each re-
stranded, default settings were used except for a GTF           agent channel. Each channel was gently vortexed for
file was used for transcript assembly. The aligned SAM/         5 min, and then 41 ml from each TMT channel was trans-
BAM files were processed using Featurecounts (Default           ferred to the peptide solutions and allowed to incubate for
settings except used Ensembl GRCm38 GTF file and                1 h at room temperature. The reaction was quenched with
output for DESeq2 and gene length file). FeatureCounts          5% (v/v) hydroxylamine (8 ml; Pierce). All 10 channels were

July/August 2021, 8(4) ENEURO.0232-21.2021                                                                            eNeuro.org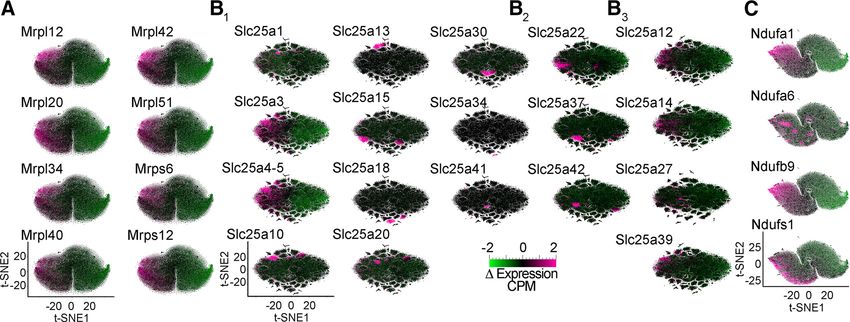
Research Article: New Research      4 of 15

then combined and dried by SpeedVac (LabConco) to                downloaded July, 2018 (98,225 target sequences). Search
;150 ml and diluted with 1 ml of 0.1% (v/v) TFA, then            parameters included 20-ppm precursor mass window,
acidified to a final concentration of 1% (v/v) FA and 0.1%       0.05-Da product mass window, dynamic modifications
(v/v) TFA. Peptides were desalted with a 200 mg C18              methione (115.995 Da), deamidated asparagine and
Sep-Pak column (Waters). Each Sep-Pak column was ac-             glutamine (10.984 Da), phosphorylated serine, threo-
tivated with 3 ml of methanol, washed with 3 ml of 50%           nine and tyrosine (179.966 Da), and static modifica-
(v/v) ACN, and equilibrated with 2  3 ml of 0.1% TFA.           tions for carbamidomethyl cysteines (157.021 Da) and
The samples were then loaded and each column was                 N-terminal and lysine-tagged TMT (1229.26340 Da).
washed with 2  3 ml 0.1% (v/v) TFA, followed by 2 ml of         Percolator was used filter PSMs to 0.1%. Peptides
1% (v/v) FA. Elution was performed with 2 volumes of 1.5         were grouped using strict parsimony and only razor
ml 50% (v/v) ACN. The eluates were then dried to                 and unique peptides were used for protein level quan-
completeness.                                                    titation. Reporter ions were quantified from MS2 scans
                                                                 using an integration tolerance of 20 ppm with the most confi-
High pH fractionation                                            dent centroid setting. Only unique and razor (i.e., parsimoni-
   High pH fractionation was performed essentially as de-        ous) peptides were considered for quantification.
scribed with slight modification (Ping et al., 2020). Dried         The MS proteomics data have been deposited to the
samples were re-suspended in high pH loading buffer              ProteomeXchange Consortium via the PRIDE (Perez-
(0.07% v/v NH4OH, 0.045% v/v FA, 2% v/v ACN) and                 Riverol et al., 2019) partner repository with the dataset
loaded onto an Agilent ZORBAX 300 Extend-C18 column              identifier PXD026104.
(2.1  150 mm with 3.5-mm beads). An Agilent 1100 HPLC              Correlations and statistical analysis between the fold of
system was used to carry out the fractionation. Solvent A        change expression slopes of the selected 210 nuclear en-
consisted of 0.0175% (v/v) NH4OH, 0.0125% (v/v) FA,              coded mitochondrial transcripts presented in Figure 2G
and 2% (v/v) ACN; solvent B consisted of 0.0175% (v/v)           was performed with Prism 9 for macOS version 9.1.1
NH4OH, 0.0125% (v/v) FA, and 90% (v/v) ACN. The sam-             (223).
ple elution was performed over a 58.6-min gradient with a
flow rate of 0.4 ml/min. The gradient consisted of 100% sol-
                                                                 Single-cell RNAseq
vent A for 2 min, then 0–12% solvent B over 6 min, then 12–
40% over 28 min, then 40–44% over 4 min, then 44–60%                Single-cell RNAseq data are described in (Yao et al.,
over 5 min, and then held constant at 60% solvent B for          2020). Gene expression data matrix (matrix.csv) and cell
13.6 min. A total of 96 individual equal volume fractions were   metadata (metadata.csv). Whole cortex and hippocam-
collected across the gradient and subsequently pooled by         pus-smart-seq (2019) with 10-smart-seq taxonomy
concatenation into 24 fractions and dried to completeness        (2020) data were downloaded from the Allen Institute
using a vacuum centrifugation.                                   Portal. This dataset contains RNAseq data of single cells
                                                                 isolated from .20 areas of mouse cortex and hippocam-
Liquid chromatography tandem MS                                  pus. Abbreviations used in figures match the Allen Mouse
   Each of the 24 high-pH peptide fractions was resus-           Brain Atlas. The data set includes 76,307 single cells. The
pended in loading buffer (0.1% FA, 0.03% TFA, 1% ACN).           sequencing results were aligned to exons and introns in
Peptide eluents were separated on a self-packed C18              the GRCm38.p3 reference genome using the STAR algo-
(1.9 mm Maisch) fused silica column [25 cm  75 mM inter-        rithm, and aggregated intron and exon counts at the gene
nal diameter (ID), New Objective] by an Easy nLC 1200            level were calculated.
(Thermo Scientific) and monitored on an Q-Exactive HFX              Matrix files were processed with Delimit Pro for
MS (Thermo Scientific). Elution was performed over a 120         Windows 10/8.1/7. We selected the 210 nuclear en-
min gradient at a rate of 300 nl/min with buffer B ranging       coded transcripts from the matrix.csv file with Delimit
from 3% to 40% (buffer A: 0.1% FA in water; buffer B:            Pro and data were assembled in Excel together with
0.1% FA in 80% ACN). The mass spectrometer was set to            the metadata.csv data. Data were exported as tab de-
acquire data in positive ion mode using data-dependent           limited text file and analyzed with the Qlucore Omics
acquisition with top 10 cycles. Each cycle consisted of          Explorer version 3.6(33). Data were log2 converted
one full MS scan followed by a maximum of 10 MS/MS.              and normalized to a mean of 0 and a variance of 1. 2D
Full MS scans were collected at a resolution of 120,000          t-distributed stochastic neighbor embedding (t-SNE) plots
(400–1600 m/z range, 3  10^6 AGC, 100 ms maximum                were generated using a perplexity of 10 and default settings.
ion injection time). All higher energy collision-induced dis-    Callouts were made by cell metadata or gene expression lev-
sociation (HCD) MS/MS spectra were acquired at a reso-           els. Respiratory complexes and mitochondrial ribosome sub-
lution of 45,000 (1.6 m/z isolation width, 30% collision         units were defined using the CORUM database, see text for
energy, 1  10–5 AGC target, 86-ms maximum ion time).            complex entries (Giurgiu et al., 2019).
Dynamic exclusion was set to exclude previously sequenced
peaks for 20 s within a 10-ppm isolation window.                 Results
Data processing protocol                                         Brain expression of mitochondrial proteins reveals
  All raw files were searched using Thermo’s Proteome            regional heterogeneity
Discoverer suite (version 2.1.1.21) with Sequest HT. The           Expression levels of proteins and their transcripts have
spectra were searched against a mouse Uniprot database           been used to explore tissue heterogeneities in organelle

July/August 2021, 8(4) ENEURO.0232-21.2021                                                                             eNeuro.org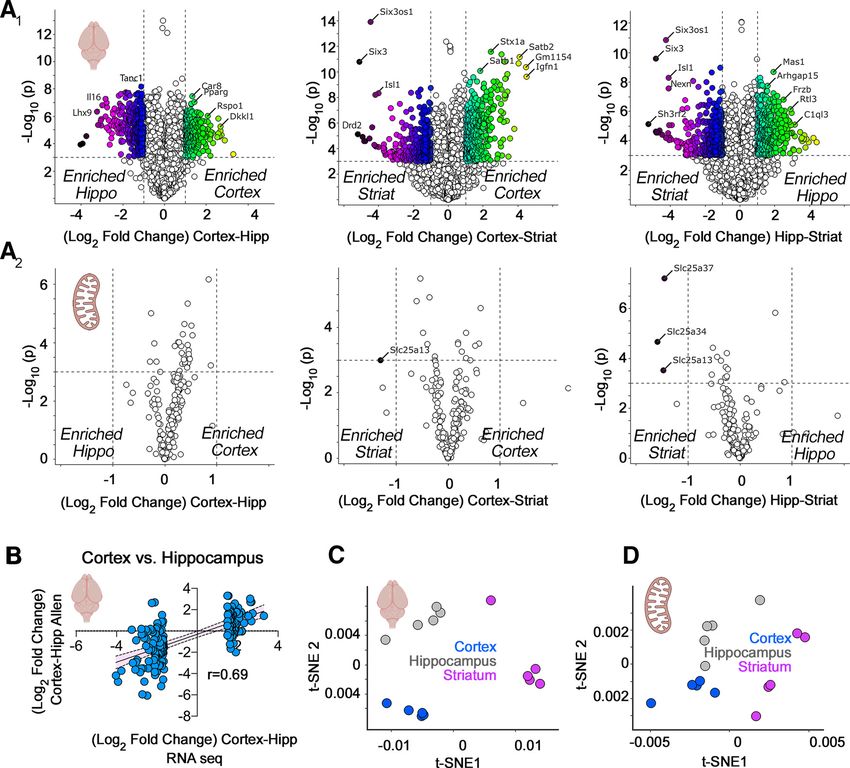
Research Article: New Research      5 of 15

abundance and/or composition (Andersen and Mann,                 segregated cortex and other brain regions into defined
2006; Geiger et al., 2013; Wilhelm et al., 2014; Cardoso-        clusters by t-SNE (Fig. 1C; Kobak and Berens, 2019),
Moreira et al., 2019; He et al., 2020). We applied this para-    the 210 selected mitochondrial transcripts poorly dis-
digm to mitochondria from adult mouse brain regions. We          tinguished brain regions using t-SNE analysis (Fig.
performed simultaneous quantifications of the transcrip-         1D). This indicated minimal regional differences in the
tome and proteome from punch-microdissected mouse                bulk expression of messages encoding proteins local-
coronal sections of cortex, hippocampus, and the stria-          ized to mitochondria.
tum. We chose punch-microdissected tissue to minimize               The poor discrimination between brain regions by the
noise introduced by tissue heterogeneity. Microdissection        210 mRNAs encoding our selected subset of mitochon-
resulted in tissue samples of ;160 mm3 for microanalyti-         drial proteins could be interpreted in the following ways.
cal omics analyses. We focused on components of the              Anatomical differences in cellular composition could
five electron transport chain complexes, the mitochondrial       skew regional differences dictated by these mRNAs. For
ribosome, and the SLC25A family of inner mitochondrial           instance, increased numbers of mitochondria in certain
membrane transporters. We selected the five respiratory          cell types may mask any differences that would otherwise
chain complexes and the mitochondrial ribosome, as these         be detectable when analyzing single cells. Additionally,
complexes are necessary components of mitochondria               regional differences could be manifested at the protein
and have defined subunit stoichiometries necessary for           rather than at the transcript level. This last problem is a
their function (Vafai and Mootha, 2012). In contrast, the ex-    common occurrence in diverse tissues and cell types, in-
pression of SLC25A transporter family members is variable        cluding the brain, with correlations between mRNA and
among tissues, as only the phosphate carrier (SLC25A3)           protein expression below 0.5 (de Sousa Abreu et al.,
and ADP/ATP carriers (SLC25A4-6) are essential for ATP           2009; Ghazalpour et al., 2011; Schwanhäusser et al.,
synthesis (Cunningham and Rutter, 2020; Palmieri et al.,         2011; Carlyle et al., 2017; Wang et al., 2019). We ad-
2020; Rath et al., 2021). Collectively, this set of genes con-   dressed these questions by quantifying regional pro-
stituted 210 proteins, or 18% of the mitochondria-anno-          teomes in mouse brain (Fig. 2) and by analyzing the
tated proteome (Rath et al., 2021). We reasoned that             expression of these 210 mitochondrial transcripts at a sin-
respiratory chain complex subunits and the mitochondrial         gle-cell level (Figs. 3-5). We used quantitative isobaric la-
ribosome should be refractory to anatomic expression dif-        beling by TMT of adult mouse brain proteomes to
ferences because of their fixed stoichiometries, while the       measure regional proteome differences (Fig. 2; Werner et
SLC25A family of transporters would be likely to reveal het-     al., 2012; Gokhale et al., 2019, 2021). We selected TMT
erogeneous expression across brain regions.                      MS quantification of the proteome because TMT offers
   We quantified mRNA expression across three distinct           improved capacity to detect changes reaching statistical
mouse brain regions encompassing diverse cell types:             significance. This is because of TMT’s superior precision
cortex, hippocampus, and striatum (Fig. 1). We focused           and reduced number of missing values as compared with
first on all mRNAs encoded in the mouse genome (Fig.             label-free quantifications (O’Connell et al., 2018).
1A1), and then on a subset of 210 of these messages en-             We first determined the quality of our 15-plex TMT brain
coding proteins localized to mitochondria (Fig. 1A2). We         proteome across the three brain regions selected, analyz-
considered an expression change significant if gene ex-          ing correlation coefficients between biological replicates
pression between two regions differed by at least 2-fold         within and in between brain regions (Fig. 2). Multiscatter
with p , 0.001. These same thresholds were applied to            plots and correlation matrices showed Pearson correla-
RNAseq and proteome datasets from mouse tissues                  tions .0.9 among biological replicates within a brain re-
(Figs. 1-3).                                                     gion and above 0.5 in comparisons between regions (Fig.
   Brain regions were discriminated by their whole-ge-           2A). These strong correlations manifested as a reduced
nome transcript expression (Fig. 1A1). For example, cor-         variance by principal component analysis (PCA) where
tex and hippocampus differed by 353 genes whose                  97% of the total variance was accounted by principal
relative expression was higher in cortex and 316 genes           component 1 (Fig. 2A, inset). Biological replicates within
whose relative expression was higher in hippocampus              regions clustered closely and were segregated from other
(Fig. 1A1). We validated these gene expression differen-         brain regions by PCA, thus validating our TMT proteome
ces with the Allen Mouse Expression Atlas and observed           dataset (Fig. 2A, inset).
a strong correlation between both datasets (r = 0.69,               The global proteome unveiled vast differences between
p , 0.0001; Fig. 1B). In contrast with the transcriptomes        mouse brain regions (Fig. 2B). These proteome differen-
of whole brain regions, the 210 mRNAs mapping to the             ces were more pronounced than those found at the tran-
selected subset of nuclear encoded mitochondrial pro-            script level. As an example, the cortex and hippocampus
teins have minimal expression differences among the              differed in the expression levels of 4698 proteins among a
three brain regions (Fig. 1A2). We could only distinguish        total of 5285 proteins quantified by TMT, while these two
the striatum from other regions because of its low expres-       regions differed significantly in only 670 mRNAs (compare
sion of the transporters SLC25A13, SLC25A34, and                 Figs. 1A1 and 2B). We further validated our findings and
SLC25A37 (Fig. 1A2). These transporters encode an as-            datasets by comparing our proteome hits against the
partate-glutamate exchanger, an orphan transporter, and          label-free quantified proteomes by Sharma et al. (2015).
an iron uptake transporter, respectively (Palmieri and           Our mouse cortex-enriched proteome captured 69.2% of
Monné, 2016). While global gene expression patterns              the mouse motor cortex-enriched proteome described by

July/August 2021, 8(4) ENEURO.0232-21.2021                                                                             eNeuro.org
Research Article: New Research      6 of 15

Figure 1. RNAseq analysis of microdissected mouse brain regions. A1, A2, Volcano plots of cortex compared with hippocampus,
cortex compared with striatum, and hippocampus compared with striatum from adult male mice (n = 5). Threshold for significance
was set at p , 10 3 and log2 fold change at 1. Color code symbols depict the fold of change below or above the thresholds. A1, All
transcripts quantified using DSeq2 annotated to the mouse genome GRCm38. A2, All nuclear transcripts encoding subunits of the
respiratory chain complexes, the mitochondrial ribosome, and the SLC25A family of transporters. Note that scarce numbers of
these nuclear encoded mitochondrial transcripts show modest expression differences among brain regions. B, Validation of the
RNAseq results using as a comparison the in situ hybridization data from the Allen Mouse Brain Atlas. The 100 most upregulated
and downregulated genes when comparing cortex and hippocampus by RNAseq were correlated with the differences reported by
the Allen data. C, t-SNE analysis of the RNAseq data presented in A1. D, t-SNE analysis of the data presented in A2.

Sharma et al. (2015). This overlap is 30.8 times above            expression levels of some of these mitochondrial proteins
what it is expected by chance (p = 7.9E-195; Fig. 2B, Venn        were observed in the cortex (Fig. 2C). We used a nonlinear
diagram insets). We also found significant, yet less pro-         tool of data dimensionality reduction, t-SNE, to uncover
nounced, overlaps between the hippocampal-enriched                similarities in the local and global structure of the protein
and striatum-enriched hits and those previously reported          expression data (Fig. 2E,F; Kobak and Berens, 2019). t-
(Sharma et al., 2015). Thus, our results capture previously       SNE analysis of the whole proteome showed that the
reported differences in the regional brain proteomes and          three brain regions studied did not group into clearly de-
significantly expand them by deploying TMT MS as a way            fined clusters (Fig. 2E). However, when t-SNE analysis
to quantify the proteome.                                         was performed with the selected mitochondrial proteins,
   Among proteins whose expression differed across                cortex, hippocampus, and striatum were group into
brain regions, we found multiple mitochondrial proteins           clearly distinct cluster (Fig. 2F). Thus, t-SNE analysis indi-
(Fig. 2C,D). The most significant changes in mitochondrial        cates that expression differences in mitochondrial pro-
protein expression included proteins belonging to respira-        teins alone can anatomically discriminate these datasets.
tory chain complexes, the mitochondrial ribosome, and                To further explore the regional differences we observed in
the SLC25A family of transporters (Fig. 2C,D). The highest        mitochondrial protein expression, we performed correlation

July/August 2021, 8(4) ENEURO.0232-21.2021                                                                                eNeuro.org
Research Article: New Research       7 of 15

Figure 2. TMT proteomic analysis of microdissected mouse brain regions. A, Multiscatter plots with all individual biological replicates used
for TMT quantifications. Insets, Pearson similarity coefficients and PCA of samples in multiscatter plots. B, C, Volcano plots of cortex com-
pared with hippocampus, cortex compared with striatum, and hippocampus compared with striatum from adult male mice (n = 5).
Threshold for significance were set at p , 10 3 and log2 fold change at 1. Color code symbols depict the fold of change below or above
the thresholds. B, All proteins quantified in brain samples with inset Venn diagrams depicting the overlap between our TMT data (blue) and
label-free quantifications by Sharma et al. (2015; pink). Representation factor and p values were estimated with an exact hypergeometric
probability test. C, All nuclear encoded subunits of the respiratory chain complexes, the mitochondrial ribosome, and the SLC25A family of
transporters. Note the abundant nuclear encoded mitochondrial proteins differentiating brain regions. D, Heat maps of the proteins that
show the most pronounced changes based on the q value and magnitude of the difference. E, t-SNE analysis of the proteome data pre-
sented in B. F, t-SNE analysis of the data presented in C. Note that the best clustering of brain regions is obtained with the nuclear encoded
mitochondrial proteins described in C. G, Simple linear correlation analysis of expression differences across brain regions. Proteins belong-
ing to respiratory chain complexes, the mitochondrial ribosome, and the SLC25A family of transporters are color coded. Note the differen-
ces in slopes. p values describe the differences between adjacent correlation plots slopes obtained with Prism. Shaded area represents the
95% confidence interval. See Extended Data Figure 2-1 for list of protein hits with p , 10 3 and log2 fold change of least 1.

analysis of these differences across paired brain regions (Fig.          2G). Moreover, subunits of respiratory chain complexes and
2G), focusing on the selected mitochondrial proteins of inter-           the mitochondrial ribosome were similarly weighted to the
est. We reasoned that anatomically universal mitochondrial               parameters of these correlations (Fig. 2G, orange and blue
expression patterns would be represented by similar expres-              symbols, respectively). These data argue for regional hetero-
sion differences across multiple mitochondrial proteins be-              geneity in the expression of mitochondrial constituents, even
tween two regions. Similar slopes among regional pairwise                among respiratory chain complexes and the mitochondrial
comparisons would indicate homogenous expression differ-                 ribosome.
ences, while differences in slope would suggest regional
composition differences. These compositional distinctions
could originate either from differences in mitochondria shared           Single-cell transcriptomes identify anatomic and cell
by all cells in a defined anatomic location or differences in mi-        type-specific differences in nuclear encoded
tochondrial composition among diverse cell types residing in             mitochondrial genes
a defined anatomic region (Fig. 2G). We found that pairwise                 The proteomics data suggested that regional heteroge-
expression difference correlations showed different ordinate             neities in mitochondrial protein expression in adult mouse
intersects (Fig. 2G). The slope of these correlations was sig-           brain could originate from intrinsic differences in the cellu-
nificantly distinct among regional pairwise comparisons (Fig.            lar expression of nuclear encoded mitochondrial genes.

July/August 2021, 8(4) ENEURO.0232-21.2021                                                                                        eNeuro.org
Research Article: New Research      8 of 15

Figure 3. Nuclear encoded mitochondrial transcripts differentiate neurons by neurotransmitter identity and anatomical location. A,
Volcano plots were assembled using the Allen single-cell RNAseq dataset. A total of 50,002 pyramidal glutamatergic neurons were
compared with 22,745 GABAergic interneurons. Volcano plots are organized by subunits belonging to the mitochondrial ribosome,
electron chain complexes I to V, and the SLC25A family of solute transporters. The mitochondrial ribosome and the SLC25A family
of transporters are the most dissimilarly expressed transcripts when comparing GABAergic with glutamatergic neurons. B1, t-SNE
cell atlas generated with the expression levels of all transcripts encoding mitochondrial ribosome subunits. The t-SNE atlas encom-
passes .20 areas of mouse cortex and hippocampus, totaling 76,307 cells. Color codes denote brain regions annotated by the
Allen Brain Atlas. B2 shows B1 data after 100 consecutive permutations. Anatomical segregation is lost. C, Diagram explaining strat-
egy for cell type and anatomic callout in t-SNE atlases. GABAergic neurons were color-coded green and glutamatergic neurons
were color coded gray. Cell type and anatomic region were marked by a triangle. D, t-SNE atlas shown in B1 that was layered with
the neurotransmitter identity of cells and anatomic location of cells (triangles). GABA, parvalbumin (Pval), somatostatin (Sst), g -syn-
uclein (Sncg), vasointestinal peptide (Vip), and lysosomal-associated membrane protein family member 5 (Lamp5) denote markers
defining specific interneuron subpopulations. E, t-SNE atlas shown in B1 but layered with the subtype of interneuron (triangles).

To test this hypothesis, we analyzed the expression of                solely on nuclear encoded mitochondrial transcripts
the 210 nuclear encoded mitochondrial transcripts at                  (Fig. 1) could be bypassed by the richness of fine-
the single-cell level. We reasoned the ineffectiveness                grained categorizational information from single-cell
of bulk tissue RNAseq discriminating brain regions                    RNAseq datasets. We selected the Allen single-cell

July/August 2021, 8(4) ENEURO.0232-21.2021                                                                                    eNeuro.org
Research Article: New Research      9 of 15

transcript expression dataset as the most comprehen-             ribosome gene expression across the brain (Fig. 3B2). t-
sive single-cell transcript expression study to date             SNE analysis of mitochondrial ribosome gene expression
(Yao et al., 2020). The Allen brain dataset encom-               segregated cells into two major clusters; one was enriched
passes .20 areas of mouse cortex and hippocampus,                in cells from the temporal cortex, visual cortex, and hippo-
totaling 76,307 cells. Of these cells, 50,002 corre-             campus, while the other cluster preferentially enriched cells
spond to pyramidal glutamatergic neurons and 22,745              from motor cortex areas (Fig. 3D, anatomic annotation by
correspond to GABAergic interneurons, which include              triangle callout over a color-coded glutamate vs GABA-an-
4363 parvalbumin (PV)-positive cells (Yao et al., 2020).         notated atlas). We mapped the neurotransmitter identity of
   We asked whether the mRNA expression of any one               different cell types into this mitochondrial ribosome gene ex-
of the five electron transport chain complexes, the mi-          pression atlas to assess cell type-specific variations in gene
tochondrial ribosome, or the SLC25A family of inner              expression (Fig. 3E, GABAergic neuronal subtype annota-
mitochondrial membrane transporters was able to dis-             tion by triangle callout over a color-coded glutamate vs
criminate anatomic regions and brain cell types in t-            GABA-annotated atlas). t-SNE analysis revealed clear dis-
SNE-generated atlases (Figs. 3-5). We first sought to            tinctions between GABAergic and glutamatergic cells (Fig.
determine whether the expression of transcripts could            3E, green and gray symbols, respectively). In particular, PV-
be different between glutamatergic and GABAergic                 positive and g -synuclein (Sncg)-positive interneurons were
neurons when single-cell expression was bulk aver-               the most clearly segregated cell types, regardless of their
aged across each cell category. Volcano plots re-                anatomic location (compare triangle callouts in Fig. 3D,E).
vealed that the most pronounced changes in the                   Cell clustering was less pronounced for somatostatin-posi-
number of transcripts and the magnitude of expression            tive or vasointestinal peptide-positive interneurons (Fig. 3E).
differences occurred among subunits of the mitochon-             We overlapped the t-SNE transcriptional clusters with heat
drial ribosome and the SLC25A family of mitochondrial            maps depicting expression levels of representative mito-
transporters (Fig. 3A). Some transcripts were enriched in        chondrial ribosome transcripts (Fig. 5). These heat maps
glutamatergic neurons, such as the mitochondrial ribosome        indicated that the expression of several mitochondrial ribo-
subunit Lactb (Mrpl56) or the mitochondrial glutamate/pro-       some transcripts was higher in GABAergic interneurons, in
ton symporter SLC25A22 (Fig. 3A). Conversely, the mito-          particular PV-positive interneurons localized to motor areas
chondrial ribosome subunit Mrpl52 and the mitochondrial          of the cortex (compare Figs. 3D,E and 5A).
aspartate-glutamate carrier SLC25A13 were enriched in               We wanted to evaluate the robustness of nuclear en-
GABAergic neurons (Fig. 3A). The bulk expression of at least     coded mitochondrial gene expression sets to segregate
one respiratory complex subunit or its assembly factor was       cell populations into anatomic and cell type categories
substantially different between these two neuron types (Fig.     (Fig. 4). To this end, we built additional gene expression
3A; see Ndufaf5, Sdhc, and Atp5J).                               atlases with transcript datasets made up of either the 48
   We used t-SNE to compress multidimensional mRNA               SLC25A transporters, 45 subunits of Complex I, four sub-
expression data into single point cell representations.          units of Complex II (CORUM complex #440), 10 subunits
t-SNE atlases capture and represent similarities in sin-         of Complex III (CORUM complex #403), 14 subunits of
gle-cell gene expression by clustering cells along the co-       Complex IV (CORUM complex #6442), or 16 subunits of
ordinates of a bidimensional space (Fig. 3B; Kobak and           Complex V (CORUM complex #563; Giurgiu et al., 2019).
Berens, 2019). These atlases were then annotated based           Each one of these atlases segregated cells into distinct
on their anatomic location or cell type, using triangles to      anatomic and cell type-specific cell populations (compare
label cells belonging to a particular region (Fig. 3C–E).        Fig. 4A, where anatomic annotation is done by color, and
We focused on GABAergic (Fig. 3C–E, green dots) and              B, where the GABAergic cell type annotation is done with
glutamatergic neurons (Fig. 3C–E, gray dots), as these           triangle callouts). Of note, the distance to nearest neigh-
two cell types were the most numerous cells whose gene           bors for the SLC25A family was more variable, containing
expression was scored in the Allen dataset (Yao et al.,          small distinct clusters, compared with the ribosome and
2020).                                                           electron transport chain complexes. Transcriptionally de-
   We next focused our analysis on the mitochondrial ribo-       fined cell populations were identified regardless of the
some, as this organelle is the biggest protein complex in        complexity of the dataset fed into the t-SNE algorithm.
mitochondria. The ribosome is encoded by ;80 core nu-            For example, t-SNE analysis of Complex II, a complex
clear expressed proteins necessary for organelle function        represented just by four transcripts, segregated cells into
(CORUM complex #320; Giurgiu et al., 2019). We built a           clusters categorized by anatomic location and cell type
mitochondrial ribosome subunit expression t-SNE atlas            (Fig. 4A,B). The expression of Complex II subunits was
(Fig. 3B1). This atlas revealed that mitochondrial ribosome      sufficient to distinguish PV-positive GABAergic neu-
mRNA expression profiles grouped cells into distinct             rons among all cell types, regardless of their anatomic
areas of the cortex and hippocampus (the hippocampus             location (Fig. 4A,B). Similar findings were obtained
is annotated by color in Fig. 3B1 and by a triangle callout in   with cell atlases generated with each one of the respi-
Fig. 3D), as well as neuronal cell types within these regions    ratory chain complexes, as well as the SLC25A trans-
(Fig. 3D, anatomic annotation by triangle callout over a         porter family (Fig. 4A,B).
color-coded glutamate vs GABA-annotated atlas). These               We also determined whether the expression levels of
anatomic distinctions were removed after data permutation,       different transcripts could further distinguish transcrip-
supporting specific anatomic patterns of mitochondrial           tionally defined cell populations. We superimposed

July/August 2021, 8(4) ENEURO.0232-21.2021                                                                              eNeuro.org
Research Article: New Research     10 of 15

Figure 4. Families of nuclear encoded mitochondrial transcripts differentiate neurons by neurotransmitter identity and anatomical lo-
cation. A, B, t-SNE cell atlases were generated with the expression levels of nuclear transcripts either encoding subunits of the re-
spiratory chain complexes I to V, the mitochondrial ribosome, or the SLC25A family of transporters. A, t-SNE atlases encompasses
.20 areas of mouse cortex and hippocampus, totaling 76,307 cells in each case. Color codes denote brain regions annotated by
the Allen Brain Atlas. B, GABAergic neurons color-coded green and glutamatergic neurons color coded gray. PV-positive and so-
matostatin-positive cells were marked by a triangle. Note that families of transcripts can segregate cells by their lineage and ana-
tomic origin.

expression heat maps of mitochondrial ribosome subu-                missed in the expression analysis of this transporter
nits, transporters of the SLC25A family, and subunits of            when glutamatergic and GABAergic neuron SLC25A13
Complex I into their corresponding atlases. Subunits of             mRNA levels were averaged in bulk (Fig. 3A, volcano
the mitochondrial ribosome expressed similarly and pre-             plots). Similarly, the most expressed transporters in
ponderantly in GABAergic neurons (compare Figs. 5A and              glutamatergic cells by bulk averaging were SLC25A22,
3E); however, members of the SLC25A transporter family              SLC25A37, and SLC25A42 (Fig. 3A). Yet, when we
displayed variable transcript expression patterns (Fig.             mapped the expression levels of these transporters to
5B). On one hand, we found SLC25A transporters                      a t-SNE atlas, we found again discrete cell populations
whose expression was higher in classes of GABAergic                 with uniquely high expression levels of these three
neurons (compare Figs. 5B1 and 4A). These include                   transporters (Fig. 5B2).
the phosphate transporter SLC25A3 and the ADP-ATP                      We expanded our studies to the expression of a subset of
mitochondrial translocators SLC25A4 and SLC25A5.                    SLC25A transporters annotated in the SFARI database that
These three SLC25A transporters are indispensable in                are associated with autism spectrum disorder (SLC25A12,
mitochondria for ATP generation (Palmieri and Monné,                SLC25A27, and SLC25A39; Abrahams et al., 2013), or
2016; Cunningham and Rutter, 2020). On the other                    whose expression is altered in postmortem autism brain sam-
hand, we identified transporters whose expression                   ples (SLC25A12, SLC25A14, and SLC25A27; Fig. 5B3;
was 2-fold to 4-fold higher in discrete cell populations.           Segurado et al., 2005; Lepagnol-Bestel et al., 2008; Anitha et
For example, SLC25A13 was expressed at high levels                  al., 2012). We found that these transporters had non-overlap-
in a unique subgroup of cells among PV-positive cells               ping increases in expression levels in discrete brain areas and
(compare Fig. 5B1 and 4A). This cell population is                  cell types (compare Figs. 5B3 and 4A). Interestingly, while

July/August 2021, 8(4) ENEURO.0232-21.2021                                                                                 eNeuro.org
Research Article: New Research     11 of 15

Figure 5. Differential expression of selected nuclear encoded mitochondrial transcripts further differentiates neuronal subpopula-
tions. A–C, t-SNE cell atlases built with the subunits of the mitochondrial ribosome (A), the SLC25A family of transporters (B), and
the electron transport chain Complex I (C). t-SNE cell atlases were overlaid with heat maps of the expression levels of selected sub-
units of protein complexes or transporters. B1, Transporters diffusely expressed across brain regions or showing specific patterns
of expression. B2, Transporters Slc25a22, Slc25a37, and Slc25a42 preferentially expressed in glutamatergic cells (see Fig. 3A). B3,
SLC25A transporters annotated in the SFARI database associated with autism spectrum disorder (SLC25A12, SLC25A27, and
SLC25A39) or whose expression is altered in postmortem autism brain samples (SLC25A12, SLC25A14, and SLC25A27).

SLC25A12 and SLC25A13 are both aspartate-glutamate car-             makeup of cell types in the different regions (Wheeler et
rier isoforms, only SLC25A12 is linked to autism (Figs. 4, 5B3;     al., 2015; Zeisel et al., 2015; Gokce et al., 2016; Tasic et
Segurado et al., 2005; Lepagnol-Bestel et al., 2008; Palmieri       al., 2016, 2018; Erö et al., 2018). We used t-SNE analy-
and Monné, 2016; Cunningham and Rutter, 2020). The ex-              sis of a comprehensive, neuronally-enriched single-cell
pression properties uncovered with t-SNE atlases built with         RNAseq dataset to gain more insight into these possi-
mitochondrial ribosome or SLC25A transporter datasets               bilities (Yao et al., 2020). We found that differences in
were also evident with a Complex I subunit dataset (Fig. 5C).       nuclear encoded mitochondrial transcript expression at
We found discrete cell clusters that differed markedly in the       the single-cell level distinguished cortical areas and re-
expression levels of some of the Complex I subunits (Fig. 5C,       gions of the hippocampal formation from one another
compare Ndufa1 and Ndufa6). Our findings demonstrate that           (Figs. 2-4), and the expression of some nuclear en-
PV-positive neurons and glutamatergic neurons can be differ-        coded mitochondrial genes was differentially enriched
entiated based on the abundance and expression patterns of          in distinct cell populations in single-cell RNAseq analy-
nuclear encoded mitochondrial genes. We conclude that the           sis (Fig. 5). In particular, our results showed that excita-
expression of nuclear encoded mitochondrial genes varies            tory and GABAergic neurons can be differentiated
across anatomic locations and cell types in the brain. These        based solely on their expression of nuclear encoded mi-
findings set the stage for the possibility of diversified mito-     tochondrial transcripts (Fig. 3).
chondrial composition and function across cell types and re-           Our findings expand recent evidence that there is heter-
gions in neural tissue.                                             ogeneity in mitochondrial composition among different
                                                                    brain cell types (Fecher et al., 2019). Fecher and col-
                                                                    leagues used an elegant genetic approach to tag and iso-
Discussion                                                          late brain mitochondria in a cell type-specific manner,
  We used proteomic and single-cell transcriptomic data-            demonstrating that GABAergic Purkinje cells, glutamater-
sets to discern whether expression of nuclear mitochon-             gic granule cells, and astrocytes in the cerebellum have
drial genes can differentiate both anatomic regions and             distinct proteomes that help carry out specialized func-
neuronal cell types in the adult mouse brain. We focused            tions in these cell types (Voogd and Glickstein, 1998;
on a subset of nuclear mitochondrial genes encompass-               Ioannou et al., 2019). Here, we extend this evidence of
ing the electron transport chain, mitochondrial ribosome,           heterogeneity by analyzing single-cell transcript data from
and SLC25A family of mitochondrial transporters. Using              a large number of neurons across diverse cortical and hip-
whole tissue datasets from the cortex, hippocampus,                 pocampal areas. The breadth and granularity of our analy-
and striatum, we found that regional mitochondrial dif-             sis extends the principle that brain mitochondria are
ferences were apparent at the protein level but not the             heterogeneous organelles across diverse brain regions.
transcript level (Figs. 1, 2). We reasoned that this pro-           We focused on electron transport chain genes, mitochon-
teomic variation could stem from intrinsic regional dif-            drial ribosome genes, and the SLC25A transporter family,
ferences in mitochondrial composition and/or cell type-             reasoning that the defined stoichiometry of electron trans-
specific mitochondrial composition, given the variable              port chain and ribosomal complexes would preclude

July/August 2021, 8(4) ENEURO.0232-21.2021                                                                                 eNeuro.org
Research Article: New Research 12 of 15 them from having much heterogeneity while the SLC25A fragile X syndrome (Antoine et al., 2019). Recent work impli- family, most of which are dispensable for ATP genera- cates mitochondria as mediators of homeostatic plasticity, tion, would have more variable expression. Our proteo- with more pronounced changes in the mitochondrial pro- mics data showed that, surprisingly, regional differences teome in response to activity deprivation in mice modeling in mitochondrial composition extend to electron trans- fragile X syndrome (Bülow et al., 2021). Given these findings port chain subunits and mitochondrial ribosome subu- and our results here reporting enriched expression of nu- nits (Fig. 2). Several mitochondrial ribosome proteins clear-encoded mitochondrial transcripts in PV interneurons, and respiratory complex proteins are enriched in the cor- it is tempting to speculate that disturbances in mitochondrial tex compared with the hippocampus or striatum (Fig. 2). composition contribute to altered E-I ratios common in Moreover, t-SNE analysis of the single-cell RNAseq pro- disease. file of mitochondrial ribosome transcript expression, The heterogeneity we observed in ribosomal and respi- SLC25A transcript expression, or expression of genes of ratory chain proteins, as measured in our proteomic data the individual respiratory complexes segregates differ- or predicted from the single-cell transcript datasets, can ent cortical and hippocampal regions from one another be interpreted in the following ways. First, differences in (Figs. 3, 4). Generally, mitochondrial ribosome gene ex- expression do not necessarily mean that the stoichiome- pression was enriched in GABAergic cell types, particu- tries differ from what is expected of the respiratory chain larly fast-spiking PV-positive interneurons (compare complexes embedded in the inner mitochondrial mem- Figs. 3E and 5A). This is perhaps not surprising given the brane or the mitochondrial ribosome in the matrix of the role of the mitochondrial ribosome in translating mito- organelle. These expression differences may reflect ana- chondrially encoded subunits of the electron transport tomic and cell type-specific regulation of free subunits in chain. However, while it has been established that the the cytoplasm before they are targeted to their corre- mitochondrial ribosome is required for neuronal devel- sponding mitochondrial compartments. This hypothesis opment and function (Gokhale et al., 2021), there is no would suggest that the biogenesis or destruction of respi- evidence for GABAergic-specific requirements of mito- ratory complexes or the mitochondrial ribosome subunits chondrial ribosomes. is different among anatomic regions or cell types. A sec- The single-cell transcriptomes of glutamatergic and ond model considers heterogeneity in the composition of GABAergic neurons, as well as different classes of these complexes, a possibility bolstered by recent find- GABAergic neurons, distinguish these neuronal types ings of variable neuronal cytoplasmic ribosome composi- from one another (Fig. 3). These differences in presumed tion (Fusco et al., 2021). The contributions of these mitochondrial composition may underlie unique mito- models to the stochiometric assembly of these mitochon- chondrial demands imposed by specialized cell types, drial complexes awaits further experimentation. as has been suggested by previous work (Murgia et al., Our analysis of expression of SLC25A transporters 2015; Cserép et al., 2018; Fecher et al., 2019; Thomas et showed that, as predicted, this family of proteins has vari- al., 2019). For instance, the faster spiking characteristic able expression across regions and cell types (Figs. 4, 5). of PV-positive GABAergic interneurons imposes greater Interestingly, we found that several SLC25A transporters energy demands for these cells, and their mitochondria were expressed at higher levels in small populations of are ultrastructurally adapted to generate ATP very effi- cells (Fig. 5). The increased expression of SLC25A family ciently (Cserép et al., 2018). Moreover, the integrity of members in distinct cell populations included multiple or- electron transport chain subunits is crucial for PV inter- phan transporters whose function is unclear, such as neuron function (Inan et al., 2016; Sanz-Morello et al., SLC25A30, SLC25A34, and SLC25A39 (Palmieri, 2013; 2020). Our data suggest that the mitochondrial ribosome Palmieri and Monné, 2016; Palmieri et al., 2020), and and members of the SLC25A family also play key roles in transporters linked to neurodevelopmental disorders, PV interneuron function, as the expression of mitochon- such as the citrate transporter SLC25A1 and those anno- drial ribosome subunits and certain SLC25A transporters tated in the SFARI database of autism spectrum-linked (SLC25A3-5, SLC25A13) is enriched in PV interneurons genes (Fig. 5B). Mutations in SLC25A1 cause a rare, (compare Figs. 3E, 4, 5). GABAergic signaling by PV in- often fatal metabolic disorder characterized by neonatal terneurons is key in establishing the ratio of excitatory to epileptic encephalopathy (Nota et al., 2013). Moreover, inhibitory (E-I) neurotransmission in the cortex (Ferguson SLC25A1 is part of the chromosomal interval deleted in and Gao, 2018). Disruptions to the E-I ratio have been 22q11.2 deletion syndrome, which is associated with in- widely hypothesized to contribute to pathogenesis of neuro- creased risk for myriad neurodevelopmental disorders, developmental and psychiatric disorders (Nelson and most prominently schizophrenia (McDonald-McGinn et Valakh, 2015; Sohal and Rubenstein, 2019). Perturbations al., 2015). Recent work suggests that SLC25A1 and of the E-I ratio in rodents impair circuit function and informa- SLC25A4 are hub genes in the network of the perturbed tion processing capabilities of cortical neurons, producing brain proteome associated with 22q11.2 deletion syn- behavioral defects common in neurodevelopmental and drome (Gokhale et al., 2019). The distinctive expression psychiatric disease (Yizhar et al., 2011; Nelson and Valakh, patterns of SLC25A transporters that we observed may 2015; Antoine et al., 2019; Sohal and Rubenstein, 2019). be an intrinsic cell autonomous characteristic defining a Such disturbances to the E-I ratio in neurodevelopment can distinct cell population. Alternatively, such discrete cell be caused by compensatory homeostatic plasticity in re- populations may represent a transient metabolic state sponse to genetic defects, such as in mouse models of triggered by an acute stimulus. While we cannot resolve July/August 2021, 8(4) ENEURO.0232-21.2021 eNeuro.org
You can also read