HHS Public Access Author manuscript Sci Immunol. Author manuscript; available in PMC 2020 July 03 - Columbia
←
→
Page content transcription
If your browser does not render page correctly, please read the page content below
HHS Public Access
                                 Author manuscript
                                 Sci Immunol. Author manuscript; available in PMC 2020 July 03.
Author Manuscript

                    Published in final edited form as:
                     Sci Immunol. 2020 January 03; 5(43): . doi:10.1126/sciimmunol.aax5430.

                    Human T cell response to CD1a and contact dermatitis allergens
                    in botanical extracts and commercial skin care products
                    Sarah Nicolai1, Marcin Wegrecki2,3, Tan-Yun Cheng1, Elvire A. Bourgeois1, Rachel N.
                    Cotton1, Jacob A. Mayfield1, Gwennaëlle C. Monnot5, Jérôme Le Nours2,3, Ildiko Van
                    Rhijn1, Jamie Rossjohn2,3,4,*, D. Branch Moody1,*, Annemieke de Jong5,*
                    1Divisionof Rheumatology, Immunology and Allergy, Brigham and Women’s Hospital, Harvard
Author Manuscript

                    Medical School, Boston, MA 02115, USA
                    2Infection
                             and Immunity Program and Department of Biochemistry and Molecular Biology,
                    Biomedicine Discovery Institute, Monash University, Clayton, Victoria 3800, Australia
                    3Australian Research Council Centre of Excellence in Advanced Molecular Imaging, Monash
                    University, Clayton, Victoria 3800, Australia
                    4Institute
                           of Infection and Immunity, Cardiff University, School of Medicine, Heath Park, Cardiff
                    CF14 4XN, UK
                    5Columbia University Vagelos College of Physicians and Surgeons, Department of Dermatology,
                    New York, NY 10032, USA

                    Abstract
Author Manuscript

                         During industrialization, humans have been exposed to increasing numbers of foreign chemicals.
                         Failure of the immune system to tolerate drugs, cosmetics and other skin products causes allergic
                         contact dermatitis, a T cell-mediated disease with rising prevalence. Models of αβ T cell response
                         emphasize T cell receptor (TCR) contact with peptide-MHC complexes, but this model cannot
                         readily explain activation by most contact dermatitis allergens, which are non-peptidic molecules.
                         We tested whether CD1a, an abundant MHC I-like protein in human skin, mediates contact
                         allergen recognition. Using CD1a autoreactive human αβ T cell clones to screen clinically
                         important allergens present in skin patch testing kits, we identified responses to balsam of Peru, a
                         tree oil widely used in cosmetics and toothpaste. Additional purification identified benzyl benzoate
                         and benzyl cinnamate as antigenic compounds within balsam of Peru. Screening of structurally
                         related compounds revealed additional stimulants of CD1a-restricted T cells, including farnesol
Author Manuscript

                    Correspondence: Annemieke de Jong, Columbia University Vagelos College of Physicians and Surgeons, Department of Dermatology,
                    Russ Berrie Medical Science Pavilion, 1150 St Nicholas Ave, New York, NY 10032. ad2952@cumc.columbia.edu.
                    *equal contributions
                    Author contributions. The indicated individuals carried out project oversight and direction (AdJ, DBM, JR), T cell assays (SN, TYC,
                    EAB, RNC, IVR, GCM, AdJ), protein chemistry, structure and surface plasmon resonance (MW, JLN) and manuscript preparation
                    (SN, AdJ, DBM, JR) with input from all authors.
                    Competing Interests Statement.
                    The authors declare that they have no competing interests.
                    Data and reagent availability statement. Reagents are available to qualified scientists subject to the limitation that cells from
                    primary T cell lines can be limited in number. The data and refined coordinates for the CD1a-farnesol structure were deposited in the
                    Protein Data Bank under 6NUX accession code. All other data needed to evaluate the conclusions in the paper are present in the paper
                    or the Supplementary Materials.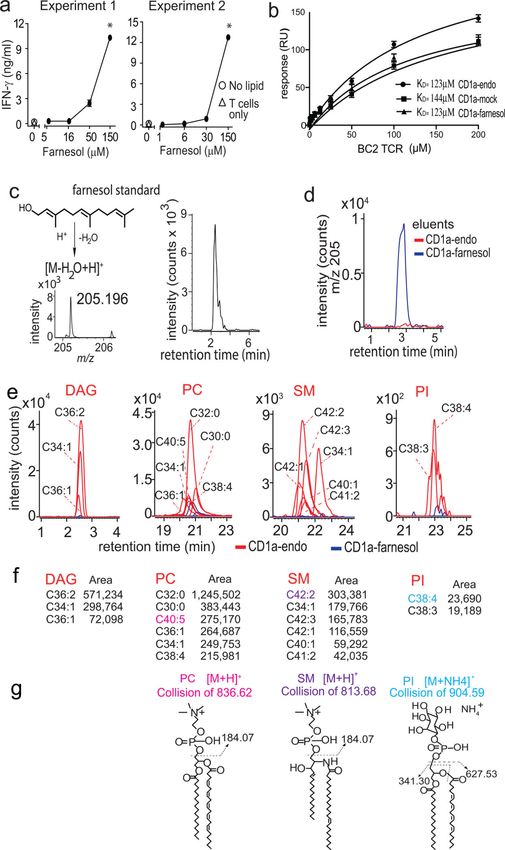
Nicolai et al.                                                                                                 Page 2

                              and coenzyme Q2. Certain general chemical features controlled response: small size, extreme
Author Manuscript

                              hydrophobicity and chemical constraint from rings and unsaturations. Unlike lipid antigens that
                              protrude to form epitopes and contact TCRs, the small size of farnesol allows sequestration deeply
                              within CD1a, where it displaces self-lipids and unmasks the CD1a surface. These studies identify
                              molecular connections between CD1a and hypersensitivity to consumer products, defining a
                              mechanism that could plausibly explain the many known T cell responses to oily substances.

                        One sentence summary
                              CD1a, an abundant lipid-antigen presenting molecule in human skin, mediates T cell responses to
                              small contact allergens.

                        Introduction
Author Manuscript

                                        The human immune system evolved to respond to foreign microbial antigens, but must also
                                        tolerate foreign compounds present in the environment, such as plants and foods. Over the
                                        past two centuries, industrialization has introduced the widespread use of chemical
                                        extraction techniques and synthetic chemistry methods. Industrial development has greatly
                                        increased the range of synthetic or purified botanical compounds to which humans are
                                        commonly exposed through pollution, or the intentional use of drugs, fragrances, cosmetics
                                        and other consumer products, especially those applied at high concentrations directly on the
                                        skin. Accordingly, the incidence of contact dermatitis has risen, especially in industrialized
                                        countries (1). Lifetime incidence currently exceeds 50%, making contact dermatitis the most
                                        common occupational skin disease (2). The essential pathophysiological feature of contact
                                        dermatitis is the allergen-specific nature of immune hypersensitivity reactions. Diagnosis
                                        relies on identifying the specific allergens to which a patient was exposed. Physicians
Author Manuscript

                                        measure local skin inflammation to a grid network of allergen patches applied to the skin as
                                        a diagnostic test. The mainstay of treatment is avoidance of exposure to named allergens.

                                        Considerable evidence documents a role for αβ T cells in contact dermatitis, which is
                                        caused by delayed type hypersensitivity reactions. Gell and Coombs defined Type IV
                                        reactions as ‘delayed type’ hypersensitivity because they appear after 72 hours. Type IV
                                        reactions are T cell-mediated and are worsened after repeated exposure to allergens (3).
                                        During the sensitization phase, naive T cells are activated in a process that involves
                                        Langerhans cells and dermal dendritic cells (2). In the elicitation phase, T cells cause
                                        inflammatory manifestations in the skin. Biologists’ views of T cell response are strongly
                                        influenced by the known mechanisms by which T cell antigen receptors (TCRs) recognize
                                        peptide antigens bound to major histocompatibility complex (MHC) I and MHC II proteins
Author Manuscript

                                        (4–6). Yet, most known contact allergens are non-peptidic small molecules, cations or metals
                                        that are typically delivered to skin as drugs, oils, cosmetics, skin creams or fragrances (1, 2).
                                        Thus, the chemical nature of contact allergens does not match the chemical structures of
                                        most antigens commonly recognized within the TCR-peptide-MHC axis.

                                        This apparent disconnect, which represents a core question regarding the origin of delayed
                                        type hypersensitivity, might be explained if MHC proteins use atypical binding interactions
                                        to display non-peptidic antigens to TCRs. For example, the anti-retroviral drug abacavir

                                              Sci Immunol. Author manuscript; available in PMC 2020 July 03.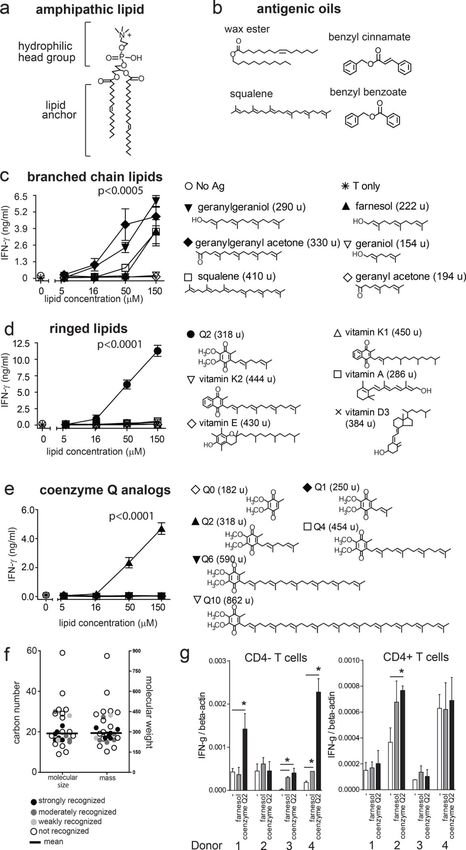
Nicolai et al.                                                                                           Page 3

                                     binds within the HLA-B*57:01 groove to alter the seating of self-peptides, creating neo-self
Author Manuscript

                                     epitopes (7). Similarly, the MHC class II protein encoded by HLA-DP2, can bind beryllium,
                                     thereby plausibly altering the MHC-peptide complex shape to enable binding of an
                                     autoreactive TCR (8). Here, autoimmune response to non-peptidic compounds still involves
                                     peptides in some way, and is linked to a specific HLA-allomorph that uses a defined
                                     structural mechanism. A second general model is that non-peptidic allergens form covalent
                                     bonds with peptides in vivo. Such ‘haptenation’ reactions might create hybrid molecules
                                     with peptide-based MHC binding moieties and TCR epitopes formed from the haptenizing
                                     drug or chemical. This concept derived from Landsteiner’s landmark studies with 2,4-
                                     dinitrophenols (9) and evolved into broader predictions that drugs could haptenate peptides
                                     or innate receptors (10). Some evidence indicates that drugs can generate immune
                                     hypersensitivity reactions via haptenation. For example, sulfamethoxazole, lidocaine,
                                     penicillins, lamotrigine, carbamazepine, p-phenylendiamine or gadolinium can bind
Author Manuscript

                                     peptides, MHC proteins or TCRs (11–16). Although the haptenation hypothesis is broadly
                                     taught to physicians, the extent to which it accounts for the larger spectrum of contact
                                     allergens remains unknown (17).

                                     Both of these models derive from the premise that αβ T cell responses are mediated by
                                     MHC-encoded proteins and emphasize atypical modes of peptide presentation. Putting aside
                                     this premise, we tested a straightforward model whereby drugs and other non-peptidic
                                     contact allergens are presented by a system that evolved to present non-peptidic antigens to
                                     T cells (18). CD1 proteins are MHC I-like molecules that fold to form an antigen binding
                                     cleft comprised of two pockets, A’ and F’, which are larger and more hydrophobic than the
                                     clefts present in MHC I and MHC II proteins (19, 20). Most published studies of human
                                     CD1 proteins (CD1a, CD1b, CD1c and CD1d) emphasize display of amphipathic membrane
                                     phospholipids and sphingolipids. The alkyl chains bind within and fill up the cleft of CD1,
Author Manuscript

                                     and the polar head groups, comprised of carbohydrates or phosphate esters, protrude through
                                     a small portal (F’ portal) to lie on the outer surface of CD1, where they are presented to
                                     TCRs (21).

                                     Whereas most known CD1-presented antigens are amphipathic lipids, some evidence
                                     suggests that CD1 proteins mediate recognition of non-lipidic, drug-like molecules. For
                                     example, CD1d mediates T cell response to phenyl pentamethyldihydrobenzofuran
                                     sulfonates (PPBFs) (22), and chemically reactive small molecules can influence CD1-
                                     restricted T cell response by an unknown mechanism that might involve induced lipid
                                     autoantigen synthesis (23). PPBFs lack aliphatic hydrocarbon chains that define lipids, and
                                     they are instead ringed, sulfated small molecules that chemically resemble allergenic drugs,
                                     such sulfonamide antibiotics and furosemide. However, PPBF antigens are much smaller
Author Manuscript

                                     than the known volume of CD1d cleft. Unlike amphipathic lipids, they lack a defined lipid
                                     anchor and hydrophilic head group (22), raising questions about how PPBFs could bind
                                     within CD1d and yet protrude in some way for TCR contact.

                                     Among human CD1 isoforms, we focused on CD1a because it is abundantly expressed on
                                     epidermal Langerhans cells and dermal dendritic cells, which are implicated in contact
                                     dermatitis (24). Also, CD1a-autoreactive T cells home to the skin, and polyclonal
                                     autoreactive T cells derived from blood and skin show higher responses to CD1a as

                                          Sci Immunol. Author manuscript; available in PMC 2020 July 03.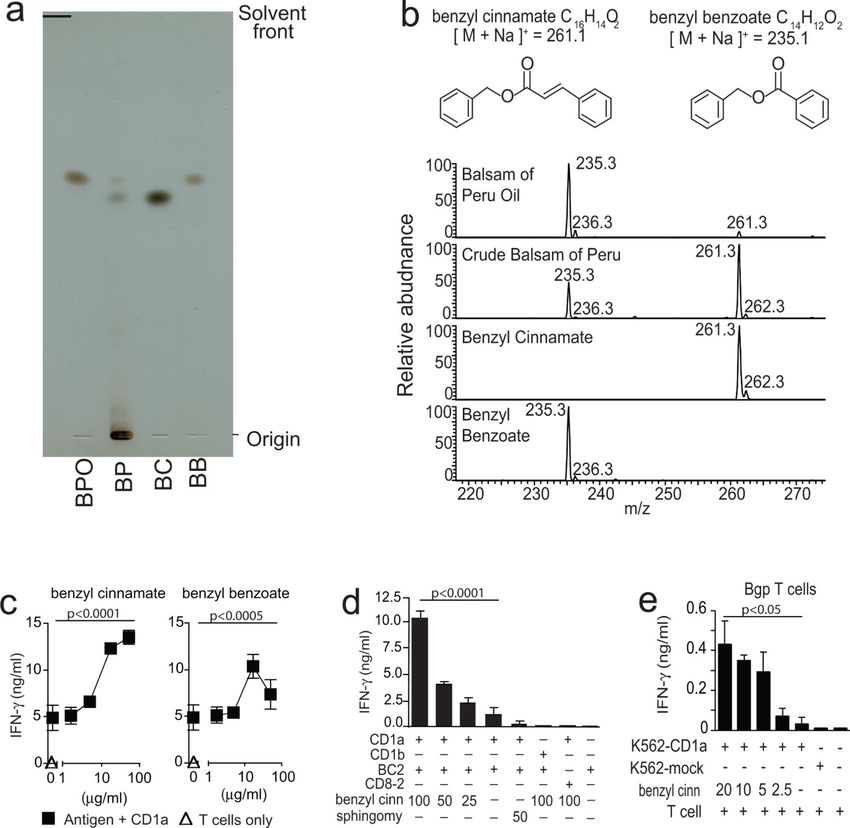
Nicolai et al.                                                                                            Page 4

                                     compared to other CD1 proteins (25, 26). In addition, surface CD1a proteins can rapidly
Author Manuscript

                                     capture extracellular antigens using mechanisms that do not require complex mechanisms of
                                     antigen processing within the endosomal network (27, 28). Recently, transfer of the human
                                     CD1a gene into mice (29) was found to augment intradermal T cell responses to the natural,
                                     plant-derived compound, urushiol (30). Actual CD1a-mediated T cell responses to
                                     commonly used drugs or contact allergens in consumer goods are, to our knowledge,
                                     unknown.

                                     As a screen for the most common and clinically important contact dermatitis antigens, we
                                     tested for human T cell response to compounds embedded in the thin-layer rapid use
                                     epicutaneous (T.R.U.E.) test (or Truetest), which is broadly used in dermatology and allergy
                                     clinics to screen patients for contact dermatitis allergens that are most commonly
                                     encountered in medical practice. This approach identified a human T cell response to a tree
                                     oil-derived contact allergen known as balsam of Peru. Larger scale screens defined the
Author Manuscript

                                     general chemical requirements for a T cell response to oily substances and discovered
                                     additional contact allergens presented by CD1a, including farnesol. The crystal structure of
                                     the CD1a-farnesol complex and study of the self-lipids bound to CD1a provided evidence
                                     for a molecular mechanism for recognition of a contact allergen, explaining how small
                                     antigens sequestered fully within CD1a can lead to T cell responses through absence of
                                     interference with CD1a-TCR contact.

                        Results
                        Balsam of Peru binds CD1a and activates T cells
                                     To determine if CD1a can present contact allergens to T cells, we initially used the CD1a-
                                     restricted αβ-T cell line known as BC2 for testing response to the T.R.U.E. test panel 1
Author Manuscript

                                     (Truetest 1) (Fig. S1). BC2 is a T cell line derived from peripheral blood T cells of a blood
                                     bank donor, and has previously been shown to be activated by CD1a loaded with small
                                     hydrophobic self-lipids (31). Normally, the Truetest panel consists of compounds arrayed on
                                     sterile matrix, which is placed on patient skin. Localized erythema occurring in vivo on skin
                                     2–5 days after exposure is considered a positive test, allowing allergen identification based
                                     on position in the grid. For testing in vitro, individual allergen patches and untreated patch
                                     matrix (control patch) were cut apart with sterile technique. Patches were soaked in media
                                     and removed (soaking method) or inserted into wells to contact (contact method) CD1a-
                                     transfected K562 (K562-CD1a) antigen presenting cells (APCs). We saw a modest response
                                     to K562-CD1a in the absence of added patch material using interferon (IFN)-γ ELISA, as
                                     expected based on the known CD1a autoreactivity of the BC2 T cell line (Fig. S1a).
Author Manuscript

                                     Compared to the control patch, most of the antigen-containing patches, including nickel,
                                     potassium dichromate, colophony, lanolin and paraben, showed no effect. A combination of
                                     molecules known as ‘fragrance mix 1’ showed slight suppression of cytokine release,
                                     consistent with toxicity to cells (Fig. S1a). Cobalt, neomycin and ethylenediamine
                                     dihydrochloride showed small increases in IFN-γ at some doses tested, but not reproducibly
                                     in subsequent assays. In contrast, balsam of Peru showed a significant response above
                                     background (Fig. S1a), which also repeated in subsequent assays (Figs. S1b, Fig. 1a).
                                     Response to balsam of Peru was not seen with patch soaking (Fig. S1b), indicating that the

                                          Sci Immunol. Author manuscript; available in PMC 2020 July 03.
Nicolai et al. Page 5
stimulatory factor(s) was not physically released from the patch. Overall, the screen
Author Manuscript
suggested a T cell response to balsam of Peru embedded in Truetest patches, leading to
focused studies of this natural botanical extract.
Balsam of Peru is a resin from the South American tree, Myroxylon balsamum, which has a
vanilla scent and is used as a fragrance and flavor in many personal care products such as
skin creams and toothpaste. Balsam of Peru is a common contact allergen seen in medical
practice, where it causes severe skin rash in allergic individuals (32, 33). We tested balsam
of Peru extract and oily substances derived therefrom, which is known as balsam of Peru oil.
Both preparations are commonly used in consumer products. BC2 T cells were activated by
both preparations, establishing a T cell dose response to a common botanical extract used in
consumer goods (Fig. 1a).
Given the unusual chemical nature of oily substances found in Balsam of Peru oil, we
Author Manuscript
considered candidate mechanisms of T cell activation other than antigen display by CD1a. In
theory, compounds might undergo peptide haptenation reactions for presentation by MHC
proteins, but this possibility was less favored since K562 cells express very low or
undetectable MHC I and MHC II (25). Oily mixtures might influence cellular lipid
production (23) or contain mitogens that cross-link CD3 complexes or broadly activate
lymphocytes via TCR-independent mechanisms (34). To determine the cellular and
molecular mechanisms of T cell stimulation, we measured T cell activation by K562 APCs
and by biotinylated CD1a proteins bound to avidin-coated plates. As assessed with anti-
CD1a blocking antibodies and K562 cells lacking CD1a, CD1a was required for the BC2
response to crude balsam of Peru and oils derived therefrom (Fig. 1b–c). Treating plate
bound CD1a protein with balsam of Peru was sufficient to activate the BC2 response, albeit
at higher doses than with antigen in the presence CD1a-expressing cells (Fig. 1c). Thus,
Author Manuscript
APCs facilitate some aspect of T cell response, but clear activation in APC-free systems
ruled out that antigen processing is required. As a specificity control, BC2 did not respond
structurally unrelated lipid, sphingomyelin, which is a known ligand for CD1a (Fig. 1d)
(35). These results were most consistent with CD1a forming complexes with some molecule
in these antigen preparations. Further specificity controls showed that balsam of Peru
preparations did not activate a CD1a-restricted T cell clone, CD8–2, that recognizes CD1a
presenting a mycobacterial antigen (18, 36) (Fig. 1d). This finding, along with the absolute
requirement for CD1a in all recognition events, strongly indicated these substances are not
mitogens. However, both balsam of Peru and balsam of Peru oil did activate another CD1a-
autoreactive T cell line, Bgp (31). This indicates that balsam of Peru response was not
limited to the BC2 T cell line (Fig. 1e).
Author Manuscript
Chemical composition of balsam of Peru
Next, we sought to pinpoint chemical structures of the antigenic substances. Balsam of Peru
is a complex botanical extract, with the most abundant components previously reported to be
benzyl cinnamate and benzyl benzoate (37). Silica thin-layer chromatography (TLC) showed
that crude balsam of Peru contained hydrophilic compounds that remained near the origin,
as well as two dark spots that co-migrate with synthetic benzyl benzoate and benzyl
cinnamate standards (Fig. 2a). As expected, oils extracted from balsam of Peru lacked the
Sci Immunol. Author manuscript; available in PMC 2020 July 03.Nicolai et al. Page 6
hydrophilic compounds that adhered at the origin. Balsam of Peru oil generated one dark
Author Manuscript
spot that co-migrated with benzyl benzoate. More sensitive methods of positive mode nano-
electrospray ionization mass spectrometry (nano-ESI-MS) (Fig. 2b) detected sodium adducts
[M+Na]+ of benzyl cinnamate (m/z 261.3) and benzyl benzoate (m/z 235.3) in both
preparations. The signal for benzyl benzoate was ~10-fold stronger than for benzyl
cinnamate in balsam of Peru oil. Thus, benzyl cinnamate was present in both preparations,
but its concentration was below the threshold of detection by TLC.
Benzyl cinnamate and benzyl benzoate are CD1a-presented antigens
False positive results from trace contaminants in natural preparations occur, so we tested
whether benzyl benzoate and benzyl cinnamate, provided as purified synthetic molecules,
activated CD1a-restricted T cells. We observed T cell activation in response to both synthetic
molecules, and the response was dependent on pre-coating the plate with CD1a. We
Author Manuscript
observed a stronger and more potent response to benzyl cinnamate (Fig. 2c), which was then
used for further mechanistic studies. Detailed testing of BC2 and CD8–2 activation by
benzyl cinnamate confirmed the dose-dependence, CD1a-dependence and TCR-specificity
of the T cell response to benzyl cinnamate (Fig. 2d). Sphingomyelin, a known CD1a ligand
(31), which has a bulky polar head group, did not activate T cells. Responses to benzyl
cinnamate were seen in two T cell lines, BC2 and Bgp (31). Benzyl cinnamate and benzyl
benzoate were efficiently presented by plate-bound CD1a proteins after a short co-
incubation, demonstrating the lack of a cellular processing requirement (Fig. 2c–d). These
findings are most consistent with the formation of CD1a-benzyl cinnamate complexes as the
target of T cell response. Thus, tree oils that are known to act as potent contact
hypersensitivity agents also function as T cell stimulants that act via CD1a.
Shared structures and size among oily antigens
Author Manuscript
The dual benzyl rings present in benzyl cinnamate and benzyl benzoate (Fig. 2b) are
chemically different from the alkyl chains present in most CD1-presented antigens.
However, they are strikingly similar to the dually ringed structure present in the unusual
non-lipidic antigen presented by CD1d known as PPBF (22). All three non-lipidic T cell
stimulants are smaller (212–345 Da) than most previously known CD1-presented lipid
antigens (~700–1500 Da) (21). Prior CD1-lipid structures (21) established a widely accepted
mechanism whereby the acyl chains rest inside the hydrophobic clefts of CD1 proteins, so
that hydrophilic head groups protrude outside CD1 and form epitopes that specifically
contact TCRs (38) (Fig. 3a). In contrast, the antigenic tree oils identified here lack any
identifiable polar group that could function as a TCR epitope (Fig. 3b). Further, the size of
the carbon skeletons of benzyl benzoate and benzyl cinnamate (C14–16) are substantially
Author Manuscript
smaller than other CD1 antigens (C20–40) and the estimated capacity of the CD1a cleft
(~C36) (19, 39, 40). Because tree oils are apparently too small to fill the CD1a cleft and
protrude to the outer surface, we hypothesized that they might not form TCR epitopes and so
function outside the main CD1 antigen display paradigm. For example, interactions within
the CD1a cleft might alter the shape of CD1-lipid complexes from the inside (41).
Alternatively, similar to recent studies of CD1a (31, 35) and CD1c (42), tree oils might
displace endogenous lipids, like sphingomyelin, whose large head groups interfere with
TCR contact with CD1a. This emerging model is known as “absence of interference”
Sci Immunol. Author manuscript; available in PMC 2020 July 03.Nicolai et al. Page 7
because carried lipids do not contact TCRs directly, but instead bind CD1 in a manner that
Author Manuscript
allows direct contact between CD1 and the TCR (31, 35).
Testing rings, unsaturations and molecular size
The approach to testing chemical features was guided by the observation that squalene,
benzyl benzoate and benzyl cinnamate have ringed or unsaturated structures that chemically
constrain molecules, rendering them bulky and rigid. Using tree oils and skin oils as lead
compounds (Fig. 3b) to generate a larger test panel (Figs. 3c–e, S2), we surveyed 29
structurally related molecules that differed in size, saturation, branching patterns or ringed
structures. Fifteen compounds, including examples among branched (Fig. 3c), ringed (Fig.
3d–e) and saturated or unsaturated fatty acyl compounds (Fig. S2) were recognized. This
moderately promiscuous pattern was markedly different from T cell responses to glycolipids
such as α-galactosyl ceramide or glucose monomycolate, where altering a single
Author Manuscript
stereocenter on the carbohydrate epitope abolished recognition (43, 44). However, not every
oily substance was sufficient to activate T cells.
Considering the particular chemical structures that control response, squalene is a C30
polyunsaturated branched chain lipid antigen (Fig. 3b) (31). We found cross-reactivity to
structurally related C20 geranylgeraniol and C23 geranylgeranylactone, as well as C15
farnesol, but not smaller geraniol-based compounds (Fig. 3c). The farnesol response is
notable because it is also a contact allergen in Truetest panel 2 (45) (Fig. 1) and so
represents another link between contact allergens and CD1a antigens. Further, considering
molecules with branched and ringed structures related to benzyl cinnamate, we identified a
new antigen, coenzyme Q2 (Fig. 3d). Although coenzyme Q2 has not been described as a
contact allergen, idebenone, which has an identical headgroup (2,3-dimethoxy, 5-methyl,
1,4-benzoquinone), but a less hydrophobic lipid tail, comprised of a 10-carbon alkyl chain
Author Manuscript
with a hydroxyl group, is a well-known skin allergen (46–48). Also, in our CD1a plate
assays, idebenone stimulated a dose-dependent T cell response, supporting a link between
coenzyme Q2-related structures and contact allergens (Fig. S3). Notably, vitamin E, a known
skin allergen, did not induce a response in this BC2-based screening. However, this does not
exclude the existence of CD1a-restricted T cells to this hydrophobic compound within a
polyclonal T cell repertoire.
The identification of a strong stimulatory response to coenzyme Q2 prompted screening of
coenzyme Q length analogs, finding optimal response to coenzyme Q2 but not larger or
smaller chain length analogs (Fig. 3e). (Fig. 3d). Last, comparison of 12 fatty acyl analogs
consistently showed stronger response when the normally charged carboxylate group was
capped by a methyl, alkyl or other structure to generate a non-polar molecule (Fig. S2). A
Author Manuscript
weak effect was seen in some cases, where potency was increased by cis-unsaturation.
In summary, compared to highly flexible lipids with saturated alkyl chains, an unsaturation,
ringed or branched structure correlated with higher response. However, very highly
constrained or bulky structures, such as vitamin A, vitamin D and vitamin E, were not
recognized. Considering molecular size, response was optimal with compounds (222–410
Da, C15-C30), which were near the middle of the size range tested (154–862 Da, C9-C59)
(Fig. 3f). These optima were considerably smaller than known CD1 antigens (~700–1500
Sci Immunol. Author manuscript; available in PMC 2020 July 03.Nicolai et al. Page 8
Da). Even the largest stimulatory compound, squalene (C30, 410 Da), was substantially
Author Manuscript
smaller than the predicted number of methylene units (~C36) that would fill the CD1a cleft
(1650 Å3) (19, 40). Unlike molecules that form antigenic epitopes for TCRs, no single
molecular variant could be assigned as essential for T cell activation.
Last, to determine if the identified link between CD1a and contact allergens is generalizable
to polyclonal T cells and among genetically unrelated human donors, we screened purified
polyclonal T cells (CD4+ and CD4−) from blood bank donors, and determined their response
to plate-bound CD1a pre-loaded with either farnesol or coenzyme Q2. As also seen in
clinical evaluation of contact dermatitis patients, not all patients responded to every antigen,
but we observed polyclonal responses to both antigens in two or more subjects using
sensitive real-time qPCR testing of IFN-γ response (Fig. 3g). Responses were seen in the
CD4+ T cell fractions, but were stronger in the CD4− T cell fraction (Fig. 3g). This suggests
that the normal T cell repertoire contains T cells that respond to CD1a-contact allergen
Author Manuscript
complexes. Similarly, in a different set of donors, T cell responses were detected to benzyl
cinnamate-loaded CD1a (Fig.S4). Together, these results support the broader relevance of
these CD1a allergens beyond the specificity of two T cell lines.
CD1a-lipid binding to the TCR
Farnesol is a common additive to cosmetics and skin creams, where its use requires
precaution labeling, based on its recognized role as a contact allergen (45). Farnesol testing
is routine in clinical practice, where it is present in the ‘fragrance mix 2’ in Truetest patches.
Farnesol can also be tested as a pure compound, generating responses in ~1 % of people
with suspected contact dermatitis (45). After the screen identified a farnesol response (Fig.
3c), we observed reproducible and dose-dependent response for BC2 in the CD1a-coated
plate assay (Fig. 4a). Thus, farnesol was unlikely to be modified prior to recognition and was
Author Manuscript
likely recognized by the BC2 TCR as a CD1a-farnesol complex.
To test this hypothesis, we loaded farnesol onto biotinylated CD1a monomers, generated
fluorescent tetramers and stained the BC2 T cell line and a control line. In several attempts
with differing protocols, we failed to detect staining with CD1a-farnesol tetramers above
background levels seen with farnesol-treated CD1b tetramers (Fig. S5). Turning to surface
plasmon resonance (SPR), we produced the BC2 TCR heterodimer in vitro and measured its
binding to untreated CD1a carrying mixed endogenous lipids (CD1a-endo), CD1a that was
treated with media (CD1a-mock) and CD1a treated with farnesol (CD1a-farnesol) after
coupling to SPR chips. The BC2 TCR bound to all three complexes with low but measurable
binding affinities for CD1a-endo (KD = 123 μM), CD1a-mock (KD = 144 μM) and CD1a-
farnesol (KD = 123 μM) (Fig. 4b). SPR is known to be more sensitive that tetramer staining
Author Manuscript
(49), so the relatively low affinity interactions likely explained the absent tetramer staining.
Yet, interactions are still in the physiological range, demonstrating direct binding between
the BC2 TCR and CD1a. However, the cross reactivity of the BC2 TCR to three forms of
CD1a left unclear the role of farnesol or other carried lipids in mediating CD1a-TCR
interactions.
Sci Immunol. Author manuscript; available in PMC 2020 July 03.Nicolai et al. Page 9
Lipid analysis of CD1a-lipid complexes
Author Manuscript
A recently proposed but unproven hypothesis is small hydrophobic lipids could fully
sequester within CD1a (31, 50), displacing larger endogenous self-lipids that cover TCR
epitopes on the outer surface of CD1a. Therefore, we undertook direct biochemical analysis
of CD1a-lipid complexes formed in vitro with detergents and stimulatory substances,
analyzing elutable lipids using high performance liquid chromatography-mass spectrometry
(HPLC-MS). First, we addressed the trivial possibility that the lack of effect of farnesol
treatment on TCR binding to CD1a resulted from the lack of farnesol loading onto CD1a.
Analysis of eluents from farnesol-treated CD1a monomers was initially inconclusive
because farnesol is a non-polar alcohol and does not readily adduct the cations or anions
needed for MS detection. However, building on the fortuitous detection of a positively
charged dehydration fragment [M-H20+H]+ generated in the MS source (31), we could
reliably detect the equivalent product (m/z 205.196, C15H25+) from a farnesol standard.
Author Manuscript
Subsequently we detected strong signal for this product from farnesol-treated CD1a proteins
but not CD1a-endo, directly documenting farnesol in CD1a complexes (Fig. 4d).
Further, the HPLC-MS-based platform allowed broader analysis of the lipid ligands carried
in CD1a-endo and CD1a-farnesol complexes. Similar to prior reports (31, 35), we could
detect many ions in CD1a-endo eluents, which were self-lipids captured during protein
expression in cells. Focusing on specific classes of lipids, including neutral lipids,
phospholipids and sphingolipids, we could identify many self-ligands. CD1a-endo
complexes carried at least three molecular species of diacylglycerol (DAG), six
phosphatidylcholines (PC), six sphingomyelins (SM) and two phosphatidylinositol species.
Initially these identifications were based on the expected early (DAG) or later (PI, PC, SM)
retention time, as well as match of the detected m/z value with the expected mass of these
ligands (Fig. 4e–f). For one lead compound in each class, we confirmed the identification
Author Manuscript
using collision-induced dissociation mass spectrometry (CID-MS), which demonstrated the
characteristic phosphocholine, phosphoinositol, sphingolipid or diacylglycerol fragments
(Fig. 4g).
Elution analysis of farnesol-treated CD1a directly demonstrated farnesol loading (Fig. 4d).
The comparison of CD1a-endo and CD1a-farnesol eluents, showed complete or nearly
complete suppression of ion chromatogram signals corresponding to all the 17 tested self-
lipids (Fig. 4e, blue). Although the conditions used to load farnesol in vitro are not the same
as those in immunological assays, these findings suggest high occupancy of CD1a proteins
by farnesol and that farnesol and self-lipids are not simultaneously bound. Together these
data support a simple model for the cross-reactivity, where the TCR binds CD1a carrying
either farnesol or certain self-lipids that permit recognition. Treatment of CD1a with farnesol
Author Manuscript
displaces lipids with hydrophilic head groups to generated more homogenously liganded
CD1a proteins (Fig. 4d–e).
CD1a-farnesol crystal structure overview
To determine the structural basis of farnesol response, we solved the CD1a-farnesol crystal
structure at 2.2 Å resolution (Table S1). The electron density for the bound farnesol and
surrounding CD1a residues were unambiguous (Fig. S6), allowing determination of the
Sci Immunol. Author manuscript; available in PMC 2020 July 03.Nicolai et al. Page 10
position and orientation of farnesol within the cleft (Fig. 5a–b). Unlike covalent binding of
Author Manuscript
vitamin B metabolites to MR1 (51) and the predictions of haptenation models, we find no
evidence for haptenation of CD1a residues by farnesol.
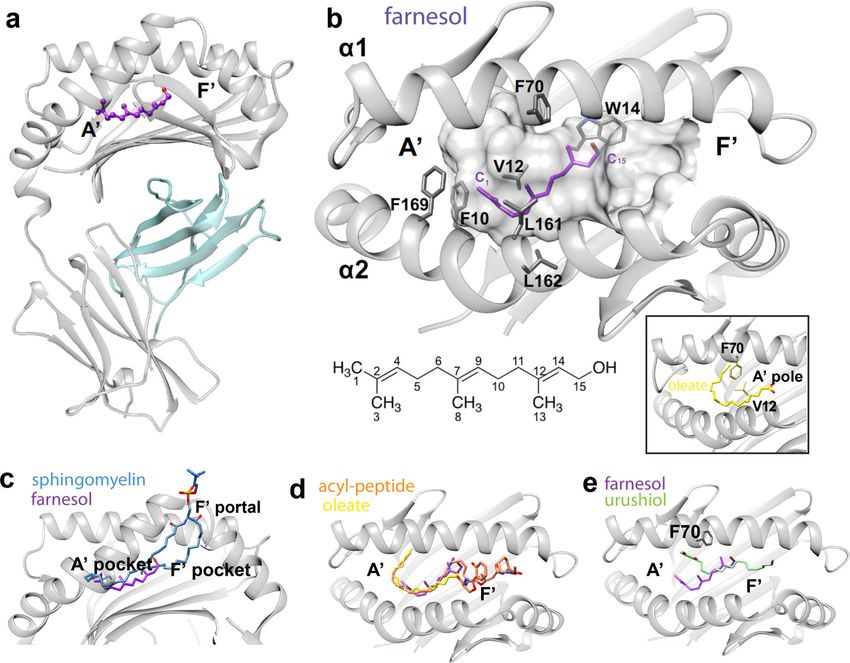
Instead the striking finding is that farnesol is deeply sequestered within the CD1a cleft,
where it is fully inaccessible to TCRs. Most known amphipathic membrane lipids, such as
sulfatide or sphingomyelin (19), occupy nearly all of the CD1a cleft and then extend their
head groups through a portal (F’-portal) onto the external surface of CD1a (Fig. 5c). In
contrast, farnesol occupies only 36% of the cleft. Accordingly, this relatively small ligand
could have been seated in many ways within the larger cavity or potentially bound with
lipid:CD1 stoichiometry of 2:1 or 3:1 (52). Instead, a preferred seating and orientation of a
single molecule is observed at the junction of the A’ and F’ pockets. Unlike CD1b structures
in which two lipids bind simultaneously within the cleft (53, 54), electron density
corresponding to a second lipid or spacer in the cleft was not observed (Fig. 5a–b). This
Author Manuscript
finding agreed with elution experiments showing substantial exclusion of the measured self-
lipids from CD1a complexes (Fig. 4e). Together, the biochemical and structural data
indicated that farnesol itself was sufficient to stabilize a partially occupied CD1a cleft.
Farnesol is buried fully within CD1a
In previously solved CD1a structures in complex with oleic acid (35) or an acyl-peptide
(40), the flexible fatty acyl chains take a C-shaped conformation around the margin of the
curved A’ pocket (Fig. 5d) (19, 35, 40). These lipids encircle a vertical structure known as
the A’ pole, which is formed by an interaction of Phe70 and Val12, located in the ceiling and
floor of the A ‘pocket, respectively (Fig. 5b, inset) (19, 35, 40). The semi-rigid and branched
structure of farnesol does not allow the C-shaped peripheral conformation seen with other
lipids and instead lies in the center of the A’ pocket, disrupting the A’ pole. The orientation
Author Manuscript
of farnesol is discernible: the terminal methyl and hydroxyl groups point towards the A’ and
F’ pocket, respectively (Fig. 5b). The polar hydroxyl group is situated nearer the solvent-
exposed F’ portal of CD1a with ~ 15 percent of its surface water exposed. Farnesol made
van der Waals contacts with Phe10, Trp14, Phe70, Val98, Leu161, Leu162 and Phe169 from
CD1a. (Fig. 5b, Table S2). Here, Trp14 stacked against the unsaturated hydrocarbons C12
and C14 of farnesol, stabilizing further the bound lipid within the cleft. Interestingly, the
same Trp14 residue maintains hydrophobic contacts with sphingosine and acyl chain
moieties in the CD1a-sphingomyelin and CD1a-sulfatide structures (19), respectively.
Collectively, this positioning mechanism appears to be driven by unsaturations in farnesol,
which limit its ability to bend and provide and van der Waals interactions with the inner
surface of CD1a.
Author Manuscript
Parallels in the positioning of CD1a-urushiol and CD1a-farnesol (Fig. 5e) highlight how the
positioning of bulky and constrained lipids differs from the seating of acyl chain-containing
ligands (Fig. 5d). Although farnesol and urushiol are not located in the same position, they
are both situated near the junction of the A’ and F’ pockets (Fig. 5e) and do not take the
deep and curved positioning at the rim of the A’ toroid (Fig. 5d). Whereas oleate and acyl
peptide wrap around the intact A’ pole (Fig 5d, 5b inset), farnesol and urushiol complexes
show a marked repositioning of Phe 70, which disrupts the A’ pole (Fig. 5b, e). Urushiol
Sci Immunol. Author manuscript; available in PMC 2020 July 03.Nicolai et al. Page 11
extends substantially into the F’-pocket so that it approaches the F’ portal of CD1a. It is
Author Manuscript
unknown whether TCRs contact urushiol, but the molecule is adjacent to the surface portal
(30) and TCRs can contact lipids located just within the portal (55). In contrast, farnesol is ~
8Å more deeply positioned, so that it is unequivocally separated from the F’ portal and the
TCR contact surface (Fig. 5e).
Overall, the structure-activity relationships (Fig. 3) indicated that many small, hydrophobic,
bulky lipids from consumer goods are recognized by T cells. The biochemical (Fig. 4) and
structural (Fig. 5) analysis of CD1a-lipid complexes demonstrate that farnesol’s small size
and unsaturated structure allow it to interact specifically, but not covalently, within CD1a.
This binding interaction stabilizes the CD1a cleft and positions farnesol out of the reach of
the TCR, largely or fully displacing lipids that normally emerge to the outer surface of CD1a
(19, 35, 40).
Author Manuscript
Discussion
In 1963 Gell and Coombs classified human disease-related immune manifestations into 4
types of hypersensitivity reactions (3). Despite the early development and descriptive nature
of this scheme, the classification system is still widely taught in clinical immunology and
medicine. Type I, II and III reactions are rapid and mediated by B cells, whereas the delayed
Type IV response is mediated by T cells. Our study sought molecular mechanisms
underpinning Type IV hypersensitivity to the most common contact dermatitis allergens in
consumer products. Our data provide specific molecular connections between CD1a-reactive
T cells and four structurally related contact dermatitis allergens: benzyl benzoate, benzyl
cinnamate, farnesol and coenzyme Q-related compounds. Whereas haptens (9), drugs (7), or
cations (8) can influence MHC-peptide display, here we detail a straightforward mechanism
Author Manuscript
for T cell activation by small molecules that non-covalently bind CD1a.
In the MHC and CD1 systems, the most common recognition mechanism involves TCR co-
contact with an epitope on the carried peptide or lipid and the antigen presenting molecule
(21, 56–58). Here we show evidence that the key active components of balsam of Peru and
farnesol activate T cells by binding to CD1a without cellular processing. However, both the
structural and biochemical data strongly point to a new model of recognition that does not
involve TCR contact with epitopes present on the stimulatory small molecules. Antigenic
tree oils, PPBF, farnesol, coenzyme Q2 and the other 14 oily stimulants identified here all
lack carbohydrate, phosphate or peptidic groups that normally serve as TCR epitopes. We
show that the BC2 TCR can cross-react among at least 16 stimulatory compounds, which do
not share any single chemical structure that would be a candidate cross-reactive epitope.
More conclusively, farnesol resides deeply within the CD1a cleft, essentially ruling out
Author Manuscript
direct contact with the TCR. Sequestration of molecules of a small size is could be a general
mechanism of their recognition, since all of the stimulatory molecules are smaller than the
CD1a cleft (21, 40, 57).
Prior studies of CD1-lipid complexes have emphasized head group positioning, where the
seating of amphipathic lipids in the cleft is guided by carbohydrates or charged moieties that
interact near the F’ portal. Alkyl chains have a ‘bland’ repetitive structure, and have been
Sci Immunol. Author manuscript; available in PMC 2020 July 03.Nicolai et al. Page 12
described as sliding within CD1 allowing diversely positioning in the groove (54, 59). Based
Author Manuscript
on this concept, we expected that the small hydrophobic ligands studied here might slide
freely or adopt multiple positions in the CD1a cleft. Also, since many of the lipids have a
molecular size that is less than half the volume of the CD1a cleft, they might have bound in
pairs or together with spacer lipids (52, 53, 60, 61). However, farnesol shows one defined
position in the CD1a groove. Both mass spectrometry and crystallographic analysis failed to
detect co-binding spacer lipids indicating that partial occupancy by one small lipid is
sufficient to stabilize the CD1a cleft.
Comparison of CD1a-farnesol with previously solved CD1a-lipid structures provides insight
into the roles of steric hindrance and interior pocket remodeling. CD1a-oleate (35), CD1a-
mycobactin-like lipopeptide (40), CD1a-sulfatide (19) and CD1a-sphingomyelin (35)
complexes involve lipids with flexible alkyl chains. These alkyl chains insert deeply into
CD1a by curling along the outer wall of the A’ pocket and wrapping around the A’ pole to
Author Manuscript
insert fully within the cleft (40). In contrast farnesol is chemically hindered and bulky, based
on polyunsaturation and methyl branching. The rigid and bulky moiety in urushiol derives
from a substituted catechol ring. These two molecules cannot curl to trace the outer wall of
the A’ pocket so do not penetrate deeply, and both sit in a central position within the A’
pocket that prevents the A’ pole form forming. Farnesol is anchored in a specific position by
a series of van der Waals interactions with named pocket residues formed by its
polyunsaturated and branched structure. While the roles of benzyl rings in benzyl benzoate
and benzyl cinnamate are not studied structurally, they also constrain the chemical structure
in ways that are also expected to prevent the side-wall curvature (19, 35, 40). More
generally, many of the stimulatory lipids identified here and in a recent study (31), including
farnesol, squalene, geranylgeraniol, geranylgeranylacetone and coenzyme Q2, are
polyunsaturated or branched isoprenoid lipids that could plausibly anchor in CD1a by
Author Manuscript
similar mechanisms.
Lipid antigen binding wholly within CD1a could trigger T cell responses by remodeling the
3-dimensional structure of CD1a, as previously reported for CD1d (62, 63), CD1b (54) and
CD1c (41, 64). However, comparing CD1a-farnesol with all CD1a-lipid structures solved to
date (19, 35, 40) does not demonstrate a broad or obvious change in CD1a conformation.
Also, binding of the BC2 TCR to both CD1a-farnesol and CD1a-endo point away from this
explanation. Instead, biochemical analysis of CD1a-endo complexes and the CD1a-farnesol
structure both indicate that farnesol displaces endogenous ligands from the cleft. Whereas
farnesol can be considered a headless ligand, some amphipathic self-lipid ligands in CD1a-
endo structures have head groups comprised of phosphates or sugars that normally cover the
exposed surface of CD1a (35). In the case of the sphingomyelin, it blocks autoreactive T
Author Manuscript
cells by interfering with TCR contact with CD1a (31, 35). Our experimental observations
rule in key aspects of the “absence of interference” model, where activating substances are
sequestered within the CD1a cleft, so that recognition occurs by ejecting self-lipids and
freeing up epitopes on the surface of CD1a itself.
As contrasted with MHC I and MHC II, where peptides are broadly exposed over the lateral
dimension of the platform, human CD1 proteins have a large roof-like structure above their
clefts and a small antigen exit portal at the margin of the platform (65). This creates a
Sci Immunol. Author manuscript; available in PMC 2020 July 03.Nicolai et al. Page 13
potentially large, ligand-free TCR contact surface on CD1 proteins. Evidence for the
predominant contact of αβ TCRs with the surface of CD1 proteins in preference to carried
Author Manuscript
lipids, including the extreme case in which TCRs contact CD1 only, is becoming a central
theme in CD1 research (65). Recent studies have shown direct TCR contact with the
unliganded surface of CD1a and CD1c by autoreactive clones and polyclonal T cells (31, 35,
42). Thus, the stimulatory compounds identified here, which are small and internally
sequestered, provide a molecular link to polyclonal autoreactive T cell responses, which are
specific for the surface of CD1 rather than the carried lipid.
The presence of CD1a in all individuals prompts the question of why allergic contact
dermatitis does not universally develop in everyone. However, inter-individual differences
that may play a role include permeability of the skin barrier (66), dose and number of
chemical exposures to allergens, regulatory T cell activity (67–69), and inter-individual
differences in T cell repertoires. Prior studies show that there is inter-individual variability in
Author Manuscript
the frequency of CD1a-restricted T cells in the blood and skin of healthy individuals, and
differences in CD1a autoreactive response rates in skin (25, 66, 70, 71). Increased CD1a-
restricted T cells responses were observed in allergic individuals and those with
inflammatory skin disease (66, 70, 72), which may be a factor in susceptibility to
development of CD1a-mediated allergic contact dermatitis in certain individuals. Consistent
with these known patterns of antigen response, our small study of 11 humans demonstrates
differing patterns of polyclonal response in each individual rather than a universal response
to one antigen, which might be expected from an innate receptor.
Overall, the molecular analysis of tree oils and isoprenoid lipids presented in this manuscript
invites focused consideration of the role of CD1a in T cell-mediated skin diseases. In this
new view, the pattern of high density CD1a on the Langerhans cell network present
Author Manuscript
throughout the skin could mediate responses to oils naturally produced within the skin or
oils that contact the skin through application of commercial skin products containing
botanical extracts, synthetic lipids or oils. Other immunogenic oils used in human patients or
for experimental biology include the adjuvant MF-59 (squalene) and incomplete Freund’s
adjuvant (mineral oil). These immunogens, as well as drug-like small molecules resembling
PPBF or sulfonamide antibiotics, could plausibly act through the CD1 system.
Materials and Methods
Study Design
The goal of this study was to determine if known contact allergens can bind to CD1a and
stimulate a CD1a-dependent T cell response. This study involved in vitro T cell assays using
Author Manuscript
both CD1a-restricted T cell lines and polyclonal purified T cells from healthy blood bank
donors. For T cell recognition, either cell-based assays using CD1a-expressing antigen
presenting cells or CD1a plate assays using recombinant plate-bound CD1a were performed.
Cytokine release was measured by ELISA, and/or cytokine transcription was measured by
real-time qPCR. Complex lipid mixtures, such as balsam of Peru, were purified by thin layer
chromatography, and analyzed by nanoelectrospray ionization mass spectrometry. Lipid
eluents from CD1a, after displacement by contact allergens, were analyzed by positive
Sci Immunol. Author manuscript; available in PMC 2020 July 03.Nicolai et al. Page 14
normal phase HPLC-MS QToF mass spectrometry. Structural insights into CD1a complexed
Author Manuscript
with the contact allergen farnesol were obtained by X-ray crystallography.
Contact dermatitis antigen screen
The T.R.U.E. (Thin-layer Rapid Use Epicutaneous Patch) test 1 (Truetest 1) is a test
routinely used in clinic to diagnosis contact dermatitis in response to the most common
allergens (SmartPractice, Phoenix, AZ). The system consists of surgical tape (5.2 × 13.0 cm)
that is embedded with antigen patches of 0.81 cm2 with each coated with a polyester film
that contains uniformly dispersed specific allergen. Using sterile technique, individual
allergen patches were cut and placed directly in the assay wells containing ~ 106 antigen
presenting cells and 1 ml T cell media in 24 well plates (contact method) or first extracted
by soaking patch in 1 ml media (2 hrs, 37°C), followed by removing the patch and
transferring 100 μL of media to T cell assays. Antigen dose was normalized to mm2 of patch
Author Manuscript
exposure. Antigens or extracts were co-cultured with 50,000 CD1a-transfected or mock-
transfected K562 cells (25) and a CD1a-dependent T cell line in a 96-well plate. Activation
was measured by IFN-γ ELISA (ThermoFisher Scientific).
CD1a assays for T cell antigens
Balsam of Peru, balsam of Peru oil, benzyl cinnamate, and benzyl benzoate or other isolated
antigens were dried in clean glass, subjected to water bath sonication in T cell media for 120
sec and cultured with 50,000 CD1a-transfected K562 cells or mock-transfected K562 cells
for 3 h at 37°C and then co-cultured with 50,000–200,000 cells per well of an autoreactive T
cell line (BC2 or Bgp) (31) or foreign antigen reactive T cells (CD8–2) (18) for 24 h at 37°C
in 96-well plates as previously described (31). Activation was measured using IFN-γ ELISA
(ThermoFisher Scientific). For blocking experiments, CD1a-transfected K562 cells were
Author Manuscript
pre-incubated for 1 h at 37°C with CD1a-blocking antibody (OKT-6) or isotype-matched
control IgG (P3) (10 μg/ml) before the addition of T cells. For plate assays, 96-well
streptavidin plates (ThermoFisher Scientific) were incubated for 24 h at room temperature
with biotinylated CD1a or CD1b protein (10 μg/ml, NIH Tetramer Core Facility) and anti-
CD11a (2.5 μg/ml) in PBS, pH 7.4 as previously described (31). For the acid-stripping
protocol (Fig. 4, Fig. 5a, and Fig. S2), after 24 h of coating with protein, plates were washed
three times with PBS, followed by washing twice with citrate buffer at a pH of 3.4 for 10
min, followed three washes in PBS before the addition of lipid antigens (30). Peripheral
blood mononuclear cells (PBMC) were isolated from buffycoats obtained from the New
York Blood Center, as approved by the Institutional Review Board of Columbia University
Irving Medical Center. Polyclonal T cell assays were performed using FACS-sorted T cells
from PBMC (CD4− and CD4+), and CD1a-coated 96-well plates as described above. Plate-
Author Manuscript
coated CD1a was either treated with buffer only (0.05% CHAPS in PBS) or lipid antigens
sonicated in buffer and incubated overnight at 37°C. Plates were washed three times and
then purified T cells were added to the wells and incubated overnight at 37°C. RNA was
extracted using RNeasy (Qiagen), and first-strand cDNA synthesis was performed using
iScript (BioRad).
Sci Immunol. Author manuscript; available in PMC 2020 July 03.Nicolai et al. Page 15
Lipid sources
Author Manuscript
Balsam of Peru (W211613), balsam of Peru oil (W211710), benzyl cinnamate (234214),
benzyl benzoate (B9550), geranylgeraniol (G3278), farnesol (277541), geranylgeranyl
acetone (G5048), geraniol (163333), squalene (S3626), geranyl acetone (250716), vitamin
K1 (V3501), vitamin K2 (V9378), vitamin A (R7632), vitamin E (T3251), vitamin D3
(C9756), coenzyme Q2 (C8081), coenzyme Q0 (D9150), coenzyme Q4 (C2470), coenzyme
Q6 (C9504), coenzyme Q10 (C9538), palmitoleic acid (P9417), methyl palmitoleate
(P9667), cis-11-hexadecenal (249084), palmityl acetate (P0260), palmitoleyl alcohol
(P1547), lauryl palmitoleate (P1642), oleamide (O2136), palmitoyl ethanolamide (P0359),
tetradecanoic acid ethylamide (R425567), N-oleoyl glycin (O9762), N,N-dimethyl
tetradecanamide (S347388), and 1-dodecyl-2-pyrrolidinone (335673) were obtained from
Sigma-Aldrich (St. Louis, MO). Coenzyme Q1 (270–294-M002) was obtained from Alexis
Biochemicals.
Author Manuscript
Lipid analysis by TLC
Silica-coated glass thin layer chromatography (TLC) plates (10 cm x 20 cm; Scientific
Adsorbents Incorporated) were pre-cleared in chloroform-methanol-water (60:30:6; vol/vol/
vol). Samples (10 – 20 μg) were developed with a solvent system-hexane/diethyl ether/acetic
acid (70/30/1 (vol/vol/vol)). For visualization, plates were sprayed with a solution of 3%
(wt/vol) of cupric acetate in 8% (vol/vol) phosphoric acid, followed by heating for 20–30
min at 150 °C.
Nanoelectrospray-ionization Mass Spectrometry
2 μg/ml of methanol solution was prepared for each reagent, and then 10 μl was loaded onto
a glass nanospray tip for positive-mode electrospray-ionization mass spectrometry
Author Manuscript
performed on a LXQ (Thermo), two-dimensional ion-trap mass spectrometer. The spray
voltage and capillary temperature were set to 0.8 kV and 200 °C.
High performance liquid chromatography (HPLC)-QTof-Mass spectrometry
CD1a-endo (200 μg) and CD1a-farnesol (200 μg) were transferred to 15-ml glass tubes and
treated with chloroform, methanol, and water for lipid extraction according to the method of
Bligh and Dyer (73). The lipid-containing organic solvent layer was separated from the top
aqueous layer by centrifugation at 850 g for 10 min. For HPLC-MS analysis, the samples
were normalized based on the input proteins (20 μM), and 20 μl of eluent was injected to an
Agilent 6530 Accurate-Mass Q-TOF spectrometer equipped with a 1260 series HPLC
system using a normal phase Inertsil diol column (150 mm × 2.1 mm, 3 micron, GL
Sciences) with a guard column (10 mm x 3 mm, 3 micron, GL Sciences), running at 0.15
Author Manuscript
ml/min according to a published method (74).
Recombinant CD1a expression and purification
The glycoprotein CD1a was expressed in HEK293S GnTI− cells and purified as previously
described (35). Following an endoglycosidase H (New England BioLabs) and thrombin
treatment, the purified CD1a was first loaded with the ganglioside GD3 (GD3) (Avanti) that
was dissolved in a solution containing 2.5% dimethylsulfoxide (DMSO) and 0.5% tyloxapol
Sci Immunol. Author manuscript; available in PMC 2020 July 03.Nicolai et al. Page 16
(Sigma). CD1a was first incubated with GD3 overnight at room temperature at a molar ratio
Author Manuscript
of 1:8. The CD1a sample loaded with GD3 was further purified using ion exchange
chromatography (MonoQ 10/100 GL-GE Healthcare). Trans, trans-farnesol (Sigma) was
dissolved in a solution containing 2.5% DMSO and 0.5% tyloxapol (Sigma). The CD1a-
GD3 sample was then incubated overnight with farnesol at a 1:100 molar ratio and at room
temperature. A subsequent ion exchange chromatography (MonoQ 10/100 GL) was
performed to remove the excess of farnesol, CD1a-GD3 and tyloxapol.
Expression, refolding and purification of recombinant TCRs
The BC2 TCR was produced using a previously described method (31). Briefly, individual α
and β chains of the TCR, with an engineered disulfide bond between the TRAC and TRBC
constant domains, were expressed in BL21 E. coli cells as inclusion bodies and solubilised
in 8 M urea buffer containing 10 mM Tris-HCl pH 8, 0.5 mM Na-EDTA, and 1 mM
Author Manuscript
dithiothreitol. The TCR was then refolded in buffer that was comprised of 5M urea, 100 mM
Tris-HCl pH 8, 2 mM Na-EDTA, 400 mM L-Arg-HCl, 0.5 mM oxidized glutathione and 5
mM reduced glutathione. The refolded solution was dialyzed twice against 10 mM Tris-HCl
pH 8.0 overnight. The dialyzed samples were then purified through DEAE cellulose, size-
exclusion and anion exchange HiTrap Q chromatography approaches. The quality and purity
of the samples were analyzed via SDS-PAGE.
Crystallization, structure determination and refinement
Seeds obtained from previous binary CD1a-antigen crystals (30) were used to grow crystals
of the CD1a-farnesol binary complex in 20–25% PEG 1500 / 10% MMT buffer pH 5–6. The
crystals were flash-frozen and data were collected at the MX2 beamline (Australian
Synchrotron) to a 2.2 Å resolution. All the data were processed with the program XDS (75)
Author Manuscript
and were scaled with SCALA from the CCP4 programs suite (76). Upon successful phasing
by molecular replacement using the program PHASER (77) and the CD1a-urushiol structure
as search model (30), the farnesol electron density was clearly evident in the unbiased
electron density maps in addition to some very weak residual density. An initial run of rigid
body refinement was performed using phenix.refine (78). Iterative model improvement was
performed using with the program COOT (79) and phenix.refine. The final refinement led to
an R/R-free (%) of 20/25. The quality of the structure was confirmed at the Research
Collaboratory for Structural Bioinformatics Protein Data Bank Data Validation and
Deposition Services website. All presentations of molecular graphics were created with
UCSF-Chimera (80).
Surface plasmon resonance
Author Manuscript
Biotinylated CD1a-endogenous lipids derived from HEK293 cells was incubated over-night
with 30-fold molar excess of farnesol solubilized in 2.5% dimethylsulfoxide/0.5% tyloxapol
(CD1a-farnesol) or with solvent only (CD1a-mock). The sample was coupled onto research-
grade streptavidin-coated chips (SA) to a mass concentration of ~3000 resonance units (RU).
Increasing concentrations of the BC2 TCR (0–200 μM) were injected over all flow cells for
30s at a rate of 5 μl/min on a Biacore 3000 in 10 mM Tris-HCl pH 8, 150 mM NaCl buffer.
The final response was calculated by subtraction of the response for CD1a-endogenous
minus a flow cell containing an unrelated protein. The data were fitted to a 1:1 Langmuir
Sci Immunol. Author manuscript; available in PMC 2020 July 03.You can also read