Synthesis of the Morphological Description of Cometary Dust at Comet 67P
←
→
Page content transcription
If your browser does not render page correctly, please read the page content below
Astronomy & Astrophysics manuscript no. DustUnification                                                                               c ESO 2019
                                               February 28, 2019

                                                                     Synthesis of the Morphological Description of
                                                                             Cometary Dust at Comet 67P
                                                    C. Güttler1 , T. Mannel2, 3 , A. Rotundi4, 5 , S. Merouane1 , M. Fulle6 , D. Bockelée-Morvan7 , J. Lasue8 , A. C.
                                                Levasseur-Regourd9 , J. Blum10 , G. Naletto11, 12, 13 , H. Sierks1 , M. Hilchenbach1 , C. Tubiana1 , F. Capaccioni4 , J. A.
                                                  Paquette1 , A. Flandes14 , F. Moreno15 , J. Agarwal1 , D. Bodewits20 , I. Bertini16 , G. P. Tozzi17 , K. Hornung18 , Y.
                                                Langevin19 , H. Krüger1 , A. Longobardo4 , V. Della Corte4 , I. Tóth21 , G. Filacchione4 , S. L. Ivanovski6 , S. Mottola22 ,
                                                                                                       and G. Rinaldi4

                                                     1
                                                         Max Planck Institute for Solar System Research, Justus-von-Liebig-Weg 3, 37077 Göttingen, Germany
arXiv:1902.10634v1 [astro-ph.EP] 27 Feb 2019

                                                     2
                                                         Space Research Institute, Austrian Academy of Sciences, Schmiedlstrasse 6, 8042 Graz, Austria
                                                     3
                                                         Physics Institute, University of Graz, Universitätsplatz 5, 8010 Graz, Austria
                                                     4
                                                         INAF - Istituto di Astrofisica e Planetologia Spaziali, Via Fosso del Cavaliere 100, I-00133 Rome, Italy
                                                     5
                                                         Universitá degli Studi di Napoli Parthenope, Dip. di Scienze e Tecnologie, CDN IC4, I-80143 Naples, Italy
                                                     6
                                                         INAF - Osservatorio Astronomico, Via Tiepolo 11, I-34143 Trieste, Italy
                                                     7
                                                         LESIA, Observatoire de Paris, Université PSL, CNRS, Univ. Paris Diderot, Sorbonne Paris Cité, Sorbonne Université, 5 Place J.
                                                         Janssen, 92195 Meudon Pricipal Cedex, France
                                                     8
                                                         IRAP, Université de Toulouse, CNRS, UPS, CNES, Toulouse, France
                                                     9
                                                         LATMOS, Sorbonne Univ., CNRS, UVSQ, Campus Pierre et Marie Curie, BC 102, 4 place Jussieu, 75005 Paris, France
                                                    10
                                                         Institut für Geophysik und extraterrestrische Physik, Technische Universität Braunschweig, Mendelssohnstr. 3, 38106 Braun-
                                                         schweig, Germany
                                                    11
                                                         University of Padova, Department of Physics and Astronomy “Galileo Galilei”, Via Marzolo 8, 35131 Padova, Italy
                                                    12
                                                         University of Padova, Center of Studies and Activities for Space (CISAS) “G. Colombo”, Via Venezia 15, 35131 Padova, Italy
                                                    13
                                                         CNR-IFN UOS Padova LUXOR, Via Trasea 7, 35131 Padova, Italy
                                                    14
                                                         Ciencias Espaciales, Instituto de Geofísica, Universidad Nacional Autónoma de México, Coyoacán, Mexico City 04510, Mexico
                                                    15
                                                         Instituto de Astrofísica de Andalucía (CSIC), c/ Glorieta de la Astronomia s/n, 18008 Granada, Spain
                                                    16
                                                         University of Padova, Department of Physics and Astronomy “Galileo Galilei”, Vicolo dell’Osservatorio 3, 35122 Padova, Italy
                                                    17
                                                         Osservatorio Astrofisico di Arcetri, INAF, Firenze, Italy
                                                    18
                                                         Universität der Bundeswehr München, LRT-7, 85577 Neubiberg, Germany
                                                    19
                                                         Institut d’Astrophysique Spatiale, CNRS/Univ. Paris-Sud, F-91405 Orsay, France
                                                    20
                                                         Auburn University, Physics Department, 206 Allison Laboratory, Auburn, AL 36849, USA
                                                    21
                                                         Konkoly Observatory, PO Box 67, 1525 Budapest, Hungary
                                                    22
                                                         Deutsches Zentrum für Luft- und Raumfahrt (DLR), Institut für Planetenforschung, Rutherfordstraße 23, 12489 Berlin, Germany

                                                    February 28, 2019

                                                                                                                  ABSTRACT

                                                    Before Rosetta, the space missions Giotto and Stardust shaped our view on cometary dust, supported by plentiful data from Earth based
                                                    observations and interplanetary dust particles collected in the Earth’s atmosphere. The Rosetta mission at comet 67P/Churyumov-
                                                    Gerasimenko was equipped with a multitude of instruments designed to study cometary dust. While an abundant amount of data
                                                    was presented in several individual papers, many focused on a dedicated measurement or topic. Different instruments, methods, and
                                                    data sources provide different measurement parameters and potentially introduce different biases. This can be an advantage if the
                                                    complementary aspect of such a complex data set can be exploited. However, it also poses a challenge in the comparison of results in
                                                    the first place. The aim of this work therefore is to summarise dust results from Rosetta and before. We establish a simple classification
                                                    as a common framework for inter-comparison. This classification is based on a dust particle’s structure, porosity, and strength as well
                                                    as its size. Depending on the instrumentation, these are not direct measurement parameters but we chose them as they were the most
                                                    reliable to derive our model. The proposed classification already proved helpful in the Rosetta dust community and we propose to
                                                    take it into consideration also beyond. In this manner we hope to better identify synergies between different instruments and methods
                                                    in the future.
                                                    Key words. comets: general – comets: individual: 67P/Churyumov-Gerasimenko – space vehicles: instruments

                                               1. Introduction                                                            material is known to exhibit a very low strength (Attree et al.
                                                                                                                          2018; Groussin et al. 2015) and processes take place under the
                                               When comets become active, they release gas and dust, where                extremely low cometary gravity (Sierks et al. 2015), the required
                                               the latter is then carried away by the gas to form the cometary            forces for the dust lift-off are likely gentle. This is the mecha-
                                               coma. The detailed physical processes of the dust release from             nism by which a comet – formed 4.57 billion years ago – slowly
                                               the surface are not well known. However, given that cometary               decomposes back into its building blocks. The level of the prim-

                                                                                                                                                                      Article number, page 1 of 15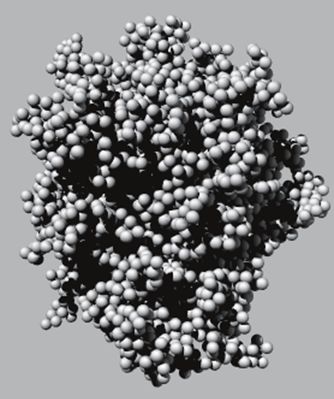
A&A proofs: manuscript no. DustUnification

itiveness of these dust particles with respect to their formation          data in particular and cometary dust in general. However, the
time can be debated but it is clear that they still carry clues to the     work is ongoing and we aim to continue combining our results
early formation of comets and our solar system. It must be the             in the spirit of this paper.
ultimate goal of cometary dust studies – whether from Earth or
by space missions – to interpret results from this viewpoint and
aim to decipher these clues.                                               2. Classification
     It was the purpose of Rosetta, “ESA’s Mission to the Origin           2.1. General Nomenclature
of the Solar System” (Schulz et al. 2009), to provide the data
in support of this goal. Three instruments on Rosetta were ex-             Different communities or even different scientists tend to use
clusively dedicated to the study of dust in the coma of comet              slightly different nomenclatures. This work is a large collabo-
67P/Churyumov-Gerasimenko. But several other instruments                   rative effort and the aim is to form a broad agreement (or at least
from the suite of 11 instruments on-board Rosetta and 10 instru-           identify disagreements). It is therefore critical to be as explicit
ments on the lander Philae were equally suited and successful              and precise as possible, which is why we provide here the used
in the study of cometary dust. Results of these dust studies are           and agreed nomenclature. We intend to keep consistence with the
presented in Sects. 3.1 to 3.6.                                            nomenclature used in the Stardust (e.g., Brownlee et al. 2006) as
     Rosetta-era studies of cometary dust are standing on the              well as planetesimal formation (e.g., Dominik et al. 2007) com-
shoulders of space missions like Giotto and Vega at 1P/Halley              munities.
and Stardust at 81P/Wild 2. Giotto was equipped with two dedi-                  A grain is the smallest component we consider in this study.
cated dust instruments, the Dust Impact Detector System (DID)              It is a solid particle with a tensile strength (typically > MPa)
and the Particle Impact Analyzer (PIA), providing the first in-            that is larger than forces acting in its environment. A grain is
situ data of cometary dust shortly after its release from a comet.         likely irregular in shape but homogeneous in composition. It is
Additionally, the Optical Probe Experiment (OPE) retrieved lo-             the constituent that forms the aggregates and agglomerates de-
cal dust brightness and polarisation. The Vega spacecraft were             fined below. Grains were created by condensation, either in the
equipped with the dust mass spectrometer PUMA (on Vega 1;                  Solar System’s protoplanetary disk or earlier in the interstellar
Kissel & Krueger 1987; Krueger et al. 1991) and the dust parti-            medium or AGB-star outflows (e.g., Alexander et al. 2007). We
cle detectors SP-1 and SP-2 (on Vega 1 and 2, respectively; Rein-          do not specify the grain’s material in this definition.
hard & Battrick 1986), all in-situ dust instruments. The Stardust               The term monomer is often used in this context and must
spacecraft, during its flyby at comet Wild 2, collected dust parti-        not be mistaken with the definition of a monomer molecule. In
cles to bring them to Earth for detailed analysis (Stardust results        the dust community, monomer is used synonymously with grain,
are described further in Sect. 3.7). Additional in-situ informa-           often in theoretic works. We thus propose to keep this term but
tion was provided by Stardust’s Dust Flux Monitor Instrument               restrain its use to spherical or elliptical grains or their mathemat-
(DFMI; Tuzzolino et al. 2004) and Cometary and Interstellar                ical description.
Dust Analyzer (CIDA; Kissel et al. 2004).                                       We use the term (dense) aggregate for an intimate assem-
     Aspects of cometary dust can also be studied from Earth:              blage of grains, rigidly joined together and not readily dispersed.
Telescope observations can for instance determine levels of ac-            Such dense aggregates might look like grains from the outside
tivity and the morphology of the large scale dust tails and trails,        but in fact contain different mineralogical components (grains)
thus dynamics of dust particles; photo-polarimetric studies allow          in the inside. The smallest components observed in the Stardust
the interpretation of the dust particles’ structures. Cometary dust        sample were these aggregates (Brownlee et al. 2006).
particles, once lifted from a comet, can travel through the solar               A (porous) agglomerate is constituted of grains or dense ag-
system and eventually cross the Earth orbit. These are collected           gregates. The binding forces are much smaller than the grains’ or
in the Earth stratosphere as interplanetary dust particles (IDPs)          aggregates’ inner binding forces such that agglomerates are eas-
or on the Earth surface as micrometeorites (MMs). These aspects            ily dispersed. Agglomerates are the particles that are expected
will all be summarised and discussed in Sects. 3.8 and 3.9.                to form through dust agglomeration in the early protoplanetary
     The main goal of this work is to summarise Rosetta results            disk (Dominik et al. 2007).
on cometary dust and make these comparable among themselves                     The terms aggregate and agglomerate are often used synony-
but also with studies outside Rosetta. Here we focus on the mor-           mously, describing what we define here as agglomerate. How-
phology and structure of cometary dust particles; for the compo-           ever, we see the need to formally discriminate between these
sition and mineralogy, the reader is referred to Engrand et al.            two. The precise distinction is not always consistent in the liter-
(2016, Rosetta), Zolensky et al. (2006, Stardust) and others.              ature (e.g., Nichols et al. 2002; Walter 2013) and we choose the
Many results were published by the different Rosetta instrument            definition that is prevalently used in the community whenever
teams and due to the nature of the complementary instruments,              the two are discriminated at all. We propose to address them as
measurement parameters are different and not directly compa-               dense aggregate and porous agglomerates wherever the precise
rable. We will in Sect. 2 establish a clear language and classi-           wording is important (as dense we consider porosities < 10%,
fication for dust particles of different morphologies. This is not         see below).
a new definition but we try to summarise the consensus of the                   Furthermore, we distinguish the case of a fractal agglom-
community and then rigorously stick to it. Based on this, we will          erate, which is showing a fractal and dendritic nature, implying
in Sect. 3 summarise results from Rosetta, Stardust, and Earth-            a very high porosity of typically > 99%. For these, the fractal
based observations. As a key result, these are summarised in Ta-           dimension Df defines the relation between mass m and size r as
ble 1 and Fig. 12. These are compared and discussed in Sect. 4             m ∝ r Df (e.g., review by Blum 2006). In our case, the relevant
and a short conclusion is presented in Sect. 5.                            fractal agglomerates have Df < 3 and are typically in the range
     This work is the result of a series of workshops and discus-          1.5 – 2.5. This is consistent with particles formed by cluster-
sions, involving the largest part of the Rosetta dust community.           cluster agglomeration (Blum 2006).
It is clear that due to the extent of data still being interpreted, this        Finally, we use the term particle as a generic term for any
can only be a first step in a concerted understanding of Rosetta           unspecified dust particle. This can be anything from a monomer
Article number, page 2 of 15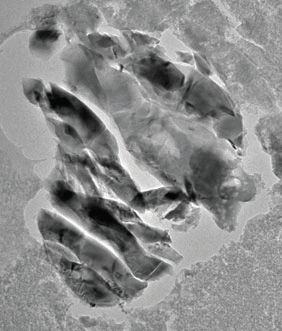
C. Güttler et al.: Synthesis of the Morphological Description of Cometary Dust at Comet 67P
to an agglomerate and implies that the nature of a particle is not any of those grains in any mixed state. The composition of many
further known or considered. agglomerates in Stardust and Rosetta is known but fall outside
the scope of this paper.
2.2. Structure and Porosity Classification The second class, group fluffy, describes agglomerates,
which (a) have a very high porosity (> 95 %). These (b) are likely
Based on the general nomenclature above, we further refine the fractal and dendritic agglomerates, the only reasonable explana-
description of the structures and porosities of dust particles. tion for extreme porosities, and (c) show a very low strength (Pa
Besides a particle’s size, the porosity and structure are param- range). A visualized example is FLUFFY_1 in Fig. 1. Fractal ag-
eters which are to some degree accessible for Rosetta’s dust glomerates are very well known from the literature, in particular
instruments and are a focus of this work. We introduce three in the context of early planet formation (Blum 2006). The exam-
groups, which will prove to be useful in terms of categorizing ples in Fig. 4 (left) show fractal agglomerates from SiO2 , grown
Rosetta dust observations summarised below. Each group com- under laboratory conditions. The top one is a small agglomerate
prises physical properties and a structure, which can explain out of 1.9 µm monomers from Heim et al. (1999) while the lower
these properties. Specifically, the three discriminating properties one is significantly larger and has a fractal dimension of Df ≈ 1.8
chosen here are (a) porosity, (b) structure, and (c) strength. Var- (not measured for this specific agglomerate but for similar ones
ious structures can be possible within these groups, which are formed under the same condition, Blum 2004). The example on
illustrated in Fig. 1 and explained below one by one. Also, each the top right is a fractal agglomerate formed in a computer simu-
of these structures will be compared to examples in nature, lab- lation by ballistic cluster-cluster agglomeration, consists of 8192
oratory, or theory in Figs. 2 – 6. monomers and exhibits a fractal dimension of 1.99 (Wada et al.
The group solid describes particles with (a) a porosity < 10 2008). The bottom right example is from the Rosetta/MIDAS
%, that are (b) consolidated and (c) exhibit a high strength sim- experiment and will be discussed in detail in Sect. 3.1.
ilar to rock. Particles that fall into this group are the grains and Finally, the group porous collects the remaining parame-
dense aggregates described in Sect. 2.1, as well as chondrules or ter range with particles of (a) porosities between 10 and 95 %.
calcium aluminium rich inclusions (CAIs). The tensile strength These are (b) considered as loosely bound agglomerates with (c)
should be in the MPa range and higher, which is only the case an intermediate but rather low strength, typically in the order
for solid particles of low porosity. The latter is chosen to be < 10 of 1 Pa to 100 kPa. Laboratory analogue experiments demon-
%, to be much smaller than the random close packing of a gran- strated that in the case of silicates, this depends only mildly on
ular medium (∼ 40 %, Onoda & Liniger 1990), clearly discrim- composition (Blum et al. 2006). Due to their higher stickiness
inating between compressed agglomerates. The most reasonable in collisions (Gundlach & Blum 2015), ice agglomerates may
mechanism to create these low porosities for cometary particles form easier in the solar nebula. However, their intrinsic cohesion
is thermal processing, i.e., compaction through (partial) melting (tensile strength) is very similar to that of silicates (Gundlach
or vapour transport. et al. 2018b) as long as the temperatures are low. For temper-
We identify two structures that fall into this group. Irregu- atures above ∼ 140 K, µm-sized ice particles start to sinter on
lar grains and spherical monomers (SOLID_1 in Fig. 1) are the timescales shorter than ∼ 105 s so that for cometary nuclei close
smallest. Examples of irregular grains used in laboratory ana- to the ice-evaporation front, the mechanical strength might be
logue experiments are shown in Fig. 2 (left). Many different ma- increased (Gundlach et al. 2018a). Sintering can also occur for
terials have been used in laboratory experiments, while the ex- silicates (Poppe 2003) and organics (Kouchi et al. 2002).
amples here are from diamond (top left, Poppe et al. 2000) and
Figure 1 provides two examples for this group: POROUS_1
Forsterite (bottom left, Tamanai et al. 2006). Spherical mono-
is a van-der-Waals agglomerate with a rather homogeneous
mers can easily be formed in the laboratory from super saturated
structure, bound by surface forces. Similar agglomerates are
gas or liquid phases and are also used for analogue experiments
studied in laboratories and computer simulations. In Fig. 5, we
in astrophysics. All three examples in Fig. 2 (right) are from
present an SEM image of a loose agglomerate consisting of 0.5
SiO2 but with different size distributions (top to bottom: Poppe
µm solid Zirconium silicate particle (top left, Blum & Münch
et al. 2000; Colangeli et al. 2003; Brisset et al. 2017). Monomers
1993), an IDP from the NASA Cosmic Dust Catalog (L2021A1,
in nature are not perfectly spherical and exhibit surface rough-
bottom left), an x-ray tomography reconstructed cut though an
ness.
agglomerate from SiO2 monomers (top right, Kothe et al. 2013),
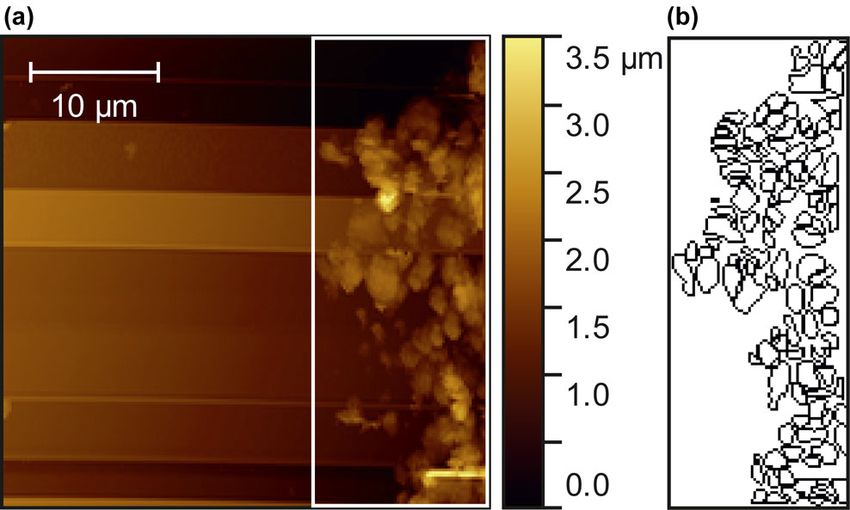
If grains form a dense aggregate, we expect a morphology
and an agglomerate used for numeric simulations (bottom right,
like SOLID_2, which is an idealized (simplified) Stardust parti-
Wada et al. 2011).
cle. Figure 3 shows three thin sections of solid aggregates from
Stardust (top: Brownlee (2014); bottom left: Brownlee et al. The sub-structure might not be as homogeneous and the sec-
(2006)). Also some interplanetary dust particles (IDPs) collected ond example for the porous group in Fig. 1 (POROUS_2) rep-
in the Earth’s stratosphere in the NASA Cosmic Dust Catalog1 resents a cluster consisting of smaller agglomerates with voids
resemble this morphology, an example is presented in Fig. 3 in-between. Such hierarchic agglomerates were produced in lab-
(L2021B6, bottom right). oratory experiments as shown in Fig. 6 (top left). This is a back-
The structures following hereafter are based on agglomer- light illuminated agglomerate, grown from smaller (100 µm) ag-
ated particles from the solid group. SOLID_1 are drawn grey glomerates under microgravity conditions (Brisset et al. 2016).
(e.g., silicates) or blue (e.g., ices) to make clear that the com- The other two examples are from Rosetta/COSIMA (centre) and
position can be varying. However, we want to leave the shape Rosetta/MIDAS (right) and will be explained in detail in Sect.
and composition of the constituent grains open on that scale and 3.1 and 3.2. A hierarchic agglomerate structure can formally be
therefore assume that the agglomerates below can form out of described as being fractal if the agglomerate consists of hierar-
chically structured (self-similar) sub-agglomerates. In the case
1
Example images of interplanetary dust particles in this work are from of POROUS_2 we assume either one single sub-agglomerate
the NASA Cosmic Dust Catalog Volume 15 from 1997 (see e.g. Brown- size or few cascades of sub-structures, such that all requirements
lee 1985, 2016). for the porous group are still fulfilled. The strength of these clus-
Article number, page 3 of 15A&A proofs: manuscript no. DustUnification
solid group fluffy group porous group
SOLID_1: FLUFFY_1: fractal, dendri�c agglomerate POROUS_1: porous agglomerate
irregular grain (with m ∝ rDf and Df typically 1.5 .. 2.5)
roundish monomer
(e.g., in computer models)
POROUS_2: cluster of agglomerates
(hierarchic)
SOLID_2: dense aggregate of grains
Fig. 1. Possible dust-particle structures, applying the three main groups defined in Sect. 2.2. The units of larger structures are drawn from circles
for illustrative purposes only. In reality, these can be any of the solid group, where also colours (grey and blue) indicate that compositions can vary
(e.g., ices).
2 µm
3 µm 1 µm
2 µm
2 µm
1 µm 5 µm 3 µm 3 µm
Fig. 2. Examples of laboratory analogues for the SOLID_1 types in Fig. Fig. 3. Samples of the SOLID_2 types in Fig. 1 (references in the text).
1 (references in the text).
POROUS_SOLID_1 is a particle from the solid group, man-
ters is significantly smaller than POROUS_1 structures if the tled with an agglomerate layer. An example for such an agglom-
number of contacts is small at sub-structure boundaries. erate is the common picture of a mantled chondrule. A polished
It should be noted that a classification by these three groups cross-section of a rimmed chondrule by Metzler et al. (1992) is
is not always unambiguous. Structure, porosity, and strength shown on the top left of Fig. 8 and an isolated chondrule ana-
have a likely but non-mandatory correlation. It can therefore be logue by Beitz et al. (2012) is shown in the top right (inset with
possible that a studied particle shares properties of more than different coating technique). From a density measurement, one
one group such that a classification is not easily possible. This is would interpret this particle as a member of the solid group,
in particular the case when also the structure shows properties of while the outer appearance (e.g., light scattering) would cloak it
different groups as in the mixed cases in Fig. 7. as a member of the porous group. The Stardust particle T57 Febo
Article number, page 4 of 15C. Güttler et al.: Synthesis of the Morphological Description of Cometary Dust at Comet 67P
10 µm
2 mm 200 µm
10 µm 10 µm
Fig. 4. Fractal particles from laboratory experiments (left), computer 10 µm 3 µm
simulation (top right) and Rosetta/MIDAS (bottom right, left and right
of scale bar; references in the text). The colour code and scale bar for
the bottom right image denotes height. Fig. 6. Clusters of agglomerates from the POROUS_2 type in Fig. 1.
Sample grown under microgravity (top left) and Rosetta/COSIMA (top
right) and Rosetta/MIDAS samples (bottom; references in the text).
Sections 3.1 through 3.6 focus on Rosetta dust instruments.
These are all different and thus complementary in nature: The
Micro-Imaging Dust Analysis System (MIDAS; see Riedler
et al. 2007) collected dust particles and determined their shape
15 µm 30 µm and structure with an atomic force microscope. It was thus an
in-situ instrument with an imaging method. The same is the case
for the Cometary Secondary Ion Mass Analyser (COSIMA; see
Kissel et al. 2007), where collected particles were studied with a
microscope and with a secondary ion mass spectrometer. The
Grain Impact Analyser and Dust Accumulator (GIADA; see
Colangeli et al. 2007) was another in-situ instrument but with-
out an imaging method. Particles were instead crossing a laser
curtain and their size and speed was determined from the sig-
nal of scattered light (Grain Detection System; GDS). The parti-
5 µm cles then collided on the Impact Sensor (IS) where their momen-
tum (thus mass if velocity is known) could be measured if they
Fig. 5. Agglomerates from the POROUS_1 type in Fig. 1. SEM image carried enough momentum. The Optical, Spectroscopic, and In-
of a laboratory analogue agglomerate (top left), an IDP (bottom left), frared Remote Imaging System (OSIRIS; see Keller et al. 2007),
a tomographic cross section (top right), and a computer model (bottom consisting of a narrow- and a wide-angle camera, could observe
right; references in the text). – within the inner coma – individual (but still unresolved) dust
particles as well as a diffuse signal from a large ensemble of
undistinguishable particles. In either case, the interpretation re-
(Brownlee et al. 2006, also Fig. 8 bottom left) is another mixed quires an assumption of the light scattering properties. The Vis-
case POROUS_SOLID_2. Depending on the ratio between solid ible and Infrared Thermal Imaging Spectrometer (VIRTIS; see
and mixed component, the group would be ambiguous. Finally, Coradini et al. 2007) could spectrally resolve the diffuse coma to
a solid particle with an attached fractal structure as depicted in infer colour and temperature of the unresolved dust. As OSIRIS
FLUFFY_SOLID_1 was observed in IDPs (NASA Cosmic Dust and GIADA above, also VIRTIS relies on the scattered light and
Catalog, L2021A7, Fig. 8 bottom right) and shares reflection and model assumptions on scattering properties. On the surface of
density properties from the solid and fluffy group. comet 67P, the lander Philae also studied the dust and we put the
Occurring ambiguities will further be discussed in Sec. 3 focus here on the dust monitor DIM as part of Philae/SESAME
wherever they occur. (Seidensticker et al. 2007) as well as the down-looking cam-
era Philae/ROLIS (Mottola et al. 2007) and the cameras for
panoramic imaging Philae/CIVA (Bibring et al. 2007).
3. State of Knowledge
Sections 3.7 through 3.9 extend the picture beyond recent
In this section we summarise the knowledge on cometary dust Rosetta findings. We will consider constraints from the large
with a focus on Rosetta. body of Earth based observation as well as studies of cometary
Article number, page 5 of 15A&A proofs: manuscript no. DustUnification
POROUS_SOLID_1: porous agglomerate POROUS_SOLID_2: solid grains with FLUFFY_SOLID_1: fractal a�ached to
with solid component in core porous agglomerate component solid component
Fig. 7. The classification from Sect. 2.2 and Fig. 1 is not always unambiguous. These examples of mixed cases show aggregate structures that
would be classified one way or another depending on the method applied (e.g., surface microscopy vs. mass determination vs. light scattering)
subunits, which could again be of agglomerate structure (Bentley
et al. 2016).
One particle was pointed out to exhibit an extraordinarily
loose packing of subunits, and a sophisticated structural analysis
was conducted (Fig. 4, bottom right; Bentley et al. 2016; Mannel
et al. 2016). Subunits range from 0.58 to 2.57 µm with an aver-
age of 1.48 µm (Bentley et al. 2016), while it cannot be excluded
that these subunits are again agglomerates with subunit sizes less
than about 500 nm. The particle is expected to have compacted
200 µm 1 mm during collection so that its image can be interpreted as a projec-
tion of the original structure onto the target plane (Fig. 4, bottom
right) which was determined to be fractal with a fractal dimen-
sion Df = 1.7 ± 0.1 (as used in Table 1) (Mannel et al. 2016).
Only a 37 × 20 µm2 area of the particle was scanned and an at-
tempt to scan the particle with adapted parameters showed that
fragmentation destroyed the probably very fragile particle. The
representative size (disc of same area) of this particle is about 15
µm diameter, while one could argue that the lateral extension is
no larger than 80 µm, which results in a representative size of 30
µm diameter. We therefore consider a range of 15 – 30 µm (as
used in Table 1) for the MIDAS fluffy group. It should be noted
25 µm 5 µm that since this was the only fractal collected by MIDAS, and the
overall number of collected particles is unknown but assumed
to be low, it is not feasible to determine a ratio of fractal versus
Fig. 8. Examples for mixed cases in Fig. 7. (references in the text).
non-fractal particles.
All remaining particles with sizes about 10 – 50 µm show
surface features in the order of 1 µm, that are interpreted as
dust in laboratories, in particular the samples brought back to loosely bound subunits (group porous in Sect. 2.2). As an exam-
Earth by Stardust. ple, Fig. 6 (bottom) shows two of these agglomerates in different
The intention of this section is to summarise the individ- sizes: The left particle of ∼ 20 µm diameter shows several sub-
ual results and compile them into a comparative table (Table structures, of which the structure at the bottom right (. 10 µm)
1). While the summaries shall be descriptive and comprehen- is the most prominent. The particle in the bottom right of Fig. 6 –
sive, the resulting table is a simplification, which is intended as in the size of the previous subunit and measured with higher res-
a framework and an aid to memory for cross comparison. While olution – again features about four subunits. On the next smaller
individual instrument groups have so far interpreted specific in- scale, Fig. 9 shows a 1 µm particle that consists of a few hundred
strument result, we are here aiming – with all Rosetta instru- nanometre-sized subunits that again exhibit surface features pos-
ment teams involved – to homogenize our understanding and sibly indicating that they are again agglomerates (Mannel et al.
nomenclatures. For a more general and complementary review submitted). Overall, this indicates that the 10 – 50 µm sized par-
of cometary dust with a focus on Rosetta, the reader is also re- ticles might have a hierarchical structure of agglomerates of ag-
ferred to the article by Levasseur-Regourd et al. (2018). glomerates, resembling the example POROUS_2.
The sizes of cavities compared to the subunits suggests a
packing below maximal density, while, on the other hand, the
3.1. Rosetta/MIDAS density is certainly higher than that of the fractal particle de-
scribed above. Most of the 10 – 50 µm sized particles decom-
The MIDAS atomic force microscope revealed the surface struc- posed into many smaller fragments during scanning, which are
ture of particles with nanometre resolution for 1 – 50 µm sized of similar size as features observed on their surface. This is sug-
particles. All studied particles show surfaces with textures that gesting that they are at least to a large amount consisting of
can be interpreted as that of an agglomerate consisting of smaller subunits similar to those shaping their surface and are not mis-
Article number, page 6 of 15C. Güttler et al.: Synthesis of the Morphological Description of Cometary Dust at Comet 67P
fied features have sizes between 50 – 200 nm (Fig. 9 and Man-
nel et al. submitted). They were detected in a special imaging
mode where the instrument picked up particles or particle frag-
ments which could have altered the particles or fragments. It is
expected that particle alteration first alters the arrangement of the
subunits, and a higher stress is required to change subunit prop-
erties. As the subunit size distributions of rather porous looking
picked up particles and more compressed looking particles are
similar, we expect that no major alteration of subunit sizes oc-
curred. However, if these smallest 50 – 200 nm sized features
are only surface features of consolidated larger units, then the
next larger units of less than about 500 nm size would be the
candidates for the smallest solid unit detected by MIDAS. To
conclude, with a significant uncertainty, we consider particles of
50 – 500 nm (as used in Table 1) as the smallest particles, possi-
bly classified into our solid group.
3.2. Rosetta/COSIMA
The COSIMA instrument collected dust particles to image these
with an optical microscope (COSISCOPE) and then perform
secondary ion mass spectroscopy (SIMS). Observed dust par-
ticles range from COSISCOPE’s resolution limit of 14 µm to
around one millimetre (as used in Table 1). During collection, the
particles collided with the targets with a varying relative velocity
Fig. 9. MIDAS image of an agglomerate particle sticking to the side around few m s−1 with respect to the Rosetta spacecraft (Rotundi
of a tip that was acquired using a calibration target with sharp spikes et al. 2015). Upon impact they therefore fragmented and the ad-
(Mannel et al. submitted). The smooth round feature at the bottom is hering fragments show a power law size distribution with a dif-
the tip apex and the straight line to the bottom right corner is a structure ferential power law exponent of −3.1 in average (Hilchenbach
supporting the tip. The image has a pixel resolution of about 15 nm and et al. 2016; Merouane et al. 2016).
was acquired on 2015-12-08. The fragments were initially classified as compact parti-
cles, rubble piles, shattered clusters, and glued cluster (Langevin
et al. 2016; Merouane et al. 2016). It was later shown that also
taken as particles resembling the examples POROUS_SOLID_1 compact particles are fragile enough to be broken by mechanical
or SOLID_2. The sizes of subunits are moreover similar to those pressure as well as by charge-up in the SIMS ion beam (Hilchen-
of the fractal particle described by Mannel et al. (2016). This bach et al. 2017). Ellerbroek et al. (2017) furthermore showed
could be a sign for both, the fractal and the denser particles, hav- in laboratory analogue experiments that the four morphologi-
ing formed out of subunits from a similar reservoir and both be- cal groups defined by Langevin et al. (2016) can be explained
ing at least to a large extent agglomerates. through a variation of the collection velocity. Based on this and
The smallest individual particles detected are between 1 and the evidence that all particles can be further broken, we consider
10 µm (Bentley et al. 2016, and Fig. 6 bottom right). They are all as agglomerates according to the classification in Sect. 2.2.
less numerous than larger particles and did not fragment dur- Many particles show sub-structures, even down to the resolu-
ing scanning, pointing towards a higher strength. Their surfaces tion limit of 14 µm/pixel, which indicates that they are clusters
are similar to those of the 10 – 50 µm particles but in a size consisting of smaller components, possibly again agglomerates
range of the large particles’ subunits. As the 1 – 10 µm particles (similar to POROUS_2 in Fig. 1).
were scanned with higher resolutions, it is possible to resolve In an attempt to infer mechanical properties from the impact
features of sizes down to about 500 nm on their surfaces (see fragmentation, Hornung et al. (2016) used this picture for the im-
Fig. 9, discussed below), and highest resolution scans (8 and 15 pacting agglomerates and inferred a strength (they intentionally
nm/pixel) even resolve features with sizes of about 100 nm. The do not distinguish between tensile and shear strength) for the ini-
deep trenches observed between the few hundred nanometres tially un-fragmented agglomerate. In their model, the strength is
features indicate that the 1 – 10 µm particles might be agglom- determined by the binding force between sub-agglomerate struc-
erates rather than members of the SOLID_2 class. However, it tures, thus depends on their sizes, and they arrive at around 1000
should be mentioned that they were never seen to disintegrate Pa (as used in Table 1) when assuming subunits of 10 – 40 µm,
and thus they could also have a solid core covered with subunits i.e., in the size around COSISCOPE’s resolution limit.
like POROUS_SOLID_1. Relying on the deep trenching we sug- Observations of sub-structures of non-fragmented agglomer-
gest to classify 1 – 10 µm particles as agglomerates with a non- ates were interpreted by Hornung et al. as macroscopic filling
negligible porosity, which overall puts MIDAS dust particles of factors defined as 1 – porosity (on a 60 – 300 µm scale) in the
1 – 50 µm size into the porous group. range of 0.4 to 0.6. These sub-structures were in turn assumed
Particles matching the solid group were not strictly observed to be porous with the smallest solid unit of ∼ 0.2 µm diameter.
by MIDAS. Neither a porosity, nor the inner structure of the This is formally described by their size dependent filling factor
dust can be determined with the current data. Also the size of φ ∝ r−0.4 , which implies a hierarchical cascade of sub-structures
the smallest refractory subunits cannot be determined due to the and porosities on all scales down to the solid grain. Since the
resolution limit of MIDAS and the ambiguity between surface fragmentation model constrains strength boundaries rather than
features created by roughness or subunits. The smallest identi- void spaces, the porosity of above 90 % quoted by Hornung et al.
Article number, page 7 of 15A&A proofs: manuscript no. DustUnification
Table 1. Summary of Rosetta and Stardust classification. The table collects mostly sizes (all in diameter) for inter-comparison and classifications
into morphological groups following Sect. 2.2. A visual representation of this table is presented in Fig. 12.
Note: The terminology used in particular for Stardust is described in detail in Sect. 3.7 (see also Fig. 10).
MIDAS COSIMA GIADA OSIRIS VIRTIS Stardust
porous group 1 – 50 µm 14 – 300 µm 0.1 – 0.8 mm ∼100 µm – 1 m dominating size particle creating
- porosity 10-95 % on target; dominant distribution track A with
- aggregate up to scatterers (diff. slope multiple terminals
- low strength mm-range –2.5 to –3) or track B
parents 1 – 100 µm
fluffy group fractal: 15 – 30 µm no indication 0.1 – 10 mm not dominant not excluded, particle creating bulbous
- porosity >95 % Df = 1.7 ± 0.1 Df < 1.9, scatterers consistent with tracks (B for coupled,
- likely fractal constituent ∼23 % of GDS moderate super- A* or C for fluffy GIADA
- very low strength particles: detections heating in normal detections), aluminium foil
< 1.5 µm activity clusters. Up to 100 µm
solid group 50 – 500 nm CAI candidate 0.15 – 0.5 mm no indication outburst: particle creating
- porosityC. Güttler et al.: Synthesis of the Morphological Description of Cometary Dust at Comet 67P
static field got larger than the strength keeping the agglomerate used in Table 1). The sizes could have been smaller, depending
together. Fulle et al. estimated charge, mass, and cross-section of on the scattering properties of the particles (see discussion in
the parent agglomerates and derived an upper limit for the equiv- Güttler et al. and Fulle et al. (2018)). Density assumptions in
alent bulk density of less than 1 kg m−3 . Moreover, the velocity the 100 – 1000 kg m−3 range can explain the particles’ observed
of these fluffy agglomerates was smaller than the escape veloc- acceleration, either through a rocket force (Güttler et al.) or by
ity from the comet. Assuming that this velocity difference was pure solar radiation pressure (Fulle et al.). Based on this density,
caused by electrostatic deceleration of the particles at the space- the agglomerates fall into the porous group (as used in Table 1).
craft, Fulle & Blum (2017) determined the size of the fluffy ag- The diffuse coma observed under different phase angle con-
glomerates before breakup to be in the millimetre range. Since ditions was studied by Bertini et al. (2017, 2019). With the comet
the only plausible way to grow such a large and porous particle is outside the OSIRIS field of view (FoV; preferably by 90 deg), the
fractal growth, Fulle et al. (2016a) calculated a fractal dimension Rosetta spacecraft was rotated around a vector perpendicular to
of Df ≈ 1.87 (as used in Table 1) for the fluffy agglomerates. The the Sun direction and inside the comet-spacecraft-Sun plane to
GDS showers, i.e. the fluffy particles, were often accompanied take images of the coma at a wide range of phase angles. From
by the signal of a compact particle at the IS (GDS+IS detec- the overall flux in the images (after filtering cosmics and indi-
tion), which is interpreted as the fluffy particles being attached vidual dust particles), they computed a phase curve, which inter-
to a compact one until disruption shortly before detection. It is estingly shows a concave ”smile shape”, featuring an absolute
not known if all fluffy particles were attached to a compact par- minimum at around 90 deg phase angle (see their Figs. 2 – 4).
ticle as the cross sections of the GDS showers were larger than Moreno et al. (2018) succeeded in modelling the full phase
GIADA’s entrance area, leading to the possibility of the com- function using elongated particles of diameter & 20 µm, which
pact particle not entering the instrument and escaping detection. need to be aligned along the solar radiation direction. In a com-
Furthermore, GDS detections of single particles with low speeds plementary modelling attempt, Markkanen et al. (2018) could
and not enough momentum to create an IS signal could also have reproduce the OSIRIS phase function at different times using
been caused by fluffy particles, although a determination of den- aggregates in the 5 – 100 µm size range, consisting of sub-
sity, and thus clear assignment to the group fluffy or group porous micrometre-sized organic grains and micrometre-sized silicate
is not possible. grains. Indication for macroscopic particles (in contrast to dis-
The chance of a particle being a fluffy agglomerate is about persed sub-micrometre monomers) is also provided from labo-
23 % (as used in Table 1) Fulle & Blum (2017) if all GDS single ratory analogous experiments by Muñoz et al. (2017). Overall,
detections are counted as group porous, or 58 % if the latter are there are indications for particles smaller that the best OSIRIS
counted as group fluffy. resolution in OSIRIS data but interpretation and detailed studies
are still ongoing.
3.4. Rosetta/OSIRIS
3.5. Rosetta/VIRTIS
With the Rosetta/OSIRIS camera system, dust in the coma of
67P could be studied remotely, thus non invasively, through ob- The Rosetta/VIRTIS dual channel spectrometer (Coradini et al.
servations in different colour filters of the solar light they scatter. 2007) consisted of two instruments: A point spectrometer
We have to distinguish between individual particles, which were VIRTIS-H (operating in the 2 – 5 µm spectral range with an
in most cases unresolved (smaller than one pixel), and a diffuse FoV of 0.033◦ × 0.10◦ ) and a line scanning imaging spectrome-
signal from a large ensemble of undistinguishable particles. ter VIRTIS-M (operating in the 0.25 – 5 µm spectral range with
Individual particles were first described by Rotundi et al. an FoV of 3.6◦ × 3.6◦ ). Due to its low spatial resolution and rel-
(2015), who determined a dust-particle size distribution, later atively long integration times (compared to Rosetta/OSIRIS), it
analysed in its time evolution by Fulle et al. (2016c) and Ott could not study individual dust particles. The strength of VIR-
et al. (2017). Detectable sizes by this method are typically in the TIS was the high spectral resolution and the extended wave-
range of centimetres and decimetres. Agarwal et al. (2016) stud- length range covering thermal radiation in the 3 – 5 µm spectral
ied the larger end of particles observed with OSIRIS, which were range. Spectra of the diffuse coma can be modelled to provide
close to the comet and far from the spacecraft, with the largest remote-sensing information, complementary to other Rosetta in-
about 80 cm diameter2 (as used in Table 1). Only one particle struments.
was detected that is resolved by the cameras (i.e., larger than 1 A comprehensive study of the diffuse coma and outbursts
pixel, Fig. 7 in Fulle et al. 2016c), where the size is largely un- observed with the VIRTIS-H channel on 13 and 14 Sep 2015 was
certain but likely larger than a metre. Frattin et al. (2017) studied presented by Bockelée-Morvan et al. (2017a,b) and Rinaldi et al.
individual particles in different OSIRIS colour filters to assess (2018). The two key results that we are here picking up are the
their composition and, depending on their spectral slope, associ- particle size distribution in the quiescent coma and the detection
ated different particles with organics, silicates, or water ice. All of high-temperature grains (see below) during outburst.
of these particles are expected to fall into the porous group as Bockelée-Morvan et al. (2017a) modelled the 2 – 5 µm infra-
defined in Sect. 2.2. They are too large to be fractals or grains red emission of a collection of porous and fractal particles with
and it is unlikely for them to be solid. Mie and Rayleigh-Gan-Debye theories (see Bockelée-Morvan
The smallest individual particles in OSIRIS were observed et al. for details), in order to explain the 2-µm colour, colour
by Güttler et al. (2017). These were close to the spacecraft (1 – temperature, and bolometric albedo measured on the spectra.
100 metres) and the smallest measured 0.3 mm in diameter (as The best fit for the quiescent coma was achieved with a differ-
ential power index β of the n(a) ∝ a−β size distribution in the
2
The sizes shown in the paper are valid for particles that have a phase range 2.5 – 3 (as used in Table 1), consistent with the power in-
function and albedo as described by Kolokolova et al. (2004), contrary dex determined by other instruments (Rotundi et al. 2015; Fulle
to what is stated in the paper text. If they show reflection properties et al. 2016c). The observed 20 % excess in colour temperature
like the nucleus (Güttler et al. 2017), the sizes should be corrected up with respect to the equilibrium temperature can be attributed
(increased) by a factor 4.4 (Agarwal pers. comm.). either to the presence of sub-micrometre particles made of ab-
Article number, page 9 of 15A&A proofs: manuscript no. DustUnification
sorbing material or, alternatively, to fractal agglomerates with (a)
sub-micrometre units. The ratio of fractal versus porous agglom-
erates influences the minimum size of the particles in the size
distribution fitting the measurements. For a relative number of
fractal agglomerates of 25 % (Fulle & Blum 2017), particles at
sizes below ∼ 20 − 30 µm should be under-abundant (Bockelée-
Morvan et al. 2017b). The scattering and thermal properties of
67P’s diffuse coma are in line with the mean of values measured
for moderately active comets, showing that 67P is not atypical
concerning dust properties (Bockelée-Morvan et al.). (c)
The material detected shortly after outburst onset showed
blue colours and colour temperatures as high as 550 and 650
K (Figs. 4 and 5 in Bockelée-Morvan et al. (2017a), and Rinaldi (d)
et al. (2018)). This was attributed to super-heating of very small
particles, which got warmed by solar irradiation but could not
sufficiently cool through infra-red emission. The required par-
ticle size to explain the two properties is ∼ 0.1 µm, and parti-
cles are believed to be individual, i.e., not bound in larger ag-
gregates (see discussion in Bockelée-Morvan et al. (2017a) and
Rinaldi et al. (2018)). Since nanometre-sized particles may not
be present in the general background coma, Bockelée-Morvan
et al. suggest that the outburst was disintegrating loosely bound
agglomerates, which were otherwise bound by strong cohesion. (b) (e)
These smallest particles could fall into our solid group, although
their strength and porosity is not constrained by VIRTIS. Fig. 10. Track morphology terminology for Stardust tracks, derived
from Kearsley et al. (2012, Fig. 1 and 12). (a) to (d) from aerogel tracks
in Stardust collection, (e) from analogue experiment by Kearsley et al.
3.6. Rosetta/Philae (2012).
3.6.1. DIM
The Dust Impact Monitor (DIM) on board Philae was a 7 cm 3.6.3. CIVA
side cube designed to detect sub-millimetre- and millimetre-
sized dust particles emitted from the nucleus of the comet em-
ploying piezoelectric detectors. The cube had three active sensor The Comet Infrared and Visible Analyser (CIVA) performed
sides, and each side had a total sensitive area of 24 cm2 (Sei- successful observations at the Abydos final landing site. With
densticker et al. 2007). During the descent of Philae to the sur- a best resolution of 0.6 mm/pixel, the observed surface is in
face of 67P, DIM recorded an impact of a cometary dust particle parts interpreted as pebbles with a dominating size of 5 – 12 mm
(among many other impact signals identified as false impacts) at (Poulet et al. 2016). It should be noted that these are not clearly
2.4 km from the comet surface (Hirn et al. 2016; Krüger et al. detached from the surface, which means that the observations are
2015; Flandes et al. 2018). Experiments support the identifica- consistent with ROLIS and the interpretation is different. CIVA
tion of this particle (aerogel was used as a comet analogue mate- has observed one isolated signal in the coma, which was inter-
rial to characterise the properties of this particle). They are con- preted as a detached particle by Bibring et al. (2015, supplement
sistent with a particle radius of 0.9 mm, density of 250 kg m−3 , Fig. S5), consistent with ROLIS observations. Also here, no fur-
and porosity close to 90 %. Data and estimations also indicate ther properties of this particle candidate can be determined.
that the particle likely moved at near 4 m s−1 with respect to the
comet (Podolak et al. 2016; Flandes et al. 2018).
3.7. Stardust Sample Collection
3.6.2. ROLIS The Stardust mission collected and returned cometary dust sam-
ples which are the only cometary samples of known origin avail-
The Rosetta Lander Imaging System (ROLIS) performed obser- able on Earth (Brownlee et al. 2006). The spacecraft made a fly-
vation of the original Philae landing site Agilkia during descent by at the Jupiter family comet 81P/Wild 2 in January 2004 at
and later of Philae’s final rest location Abydos. In the Agilkia re- 234 km closest distance and 6.1 km s−1 relative velocity. It cap-
gion, surface regolith was observed with a best resolution of 0.95 tured more than 10,000 dust particles between 1 to 100 µm in
cm/pixel (Mottola et al. 2015). Besides the power law size distri- collectors of 3 cm thick silica aerogel tiles. In addition, the alu-
bution of particles, the images reveal that small, decimetre-sized minium frame around the aerogel tiles shows impact craters with
boulders show surface textures down to the resolution limit. At residues of the particles.
the Abydos site, the material is more lumpy and no individual
particles or pores can be distinguished at the resolution limit of All particles suffered alteration due to the capture, domi-
0.8 cm/pixel (Schröder et al. 2017). Dust particles crossing the nantly through heating to temperatures above the melting point
camera field of view were observed few centimetres as well as of silica. Larger particles over a micrometre in size are often rea-
several metres from the camera (Fig. 3 and Fig. 7, respectively, sonably well preserved due to their higher thermal inertia, whilst
in Schröder et al. 2017). No size or morphological information sub-micrometre dust was only able to survive when shielded by
can be determined though. a larger particle (Brownlee et al. 2006; Rietmeijer 2016).
Article number, page 10 of 15C. Güttler et al.: Synthesis of the Morphological Description of Cometary Dust at Comet 67P
3.7.1. Aerogel Tracks ties such as size, mass, density and internal structure from crater
morphology.
Impacts into aerogel are divided into three main classes (Hörz If the morphology of the craters is smoothly bowl-shaped,
et al. 2006): Type A tracks are slender, flute- or carrot-shaped ta- their suggested impactors are dense, 10 – 60 µm in size, thus
pering tracks with either a single or multiple styli and/or spikes could resemble the particles causing type A tracks in aerogel.
(cf. Fig. 10 (a)), where a stylus is defined as that part of the par- The residuals in the craters indicate that these particles must not
ticle track that runs about straight, looking like a narrowing tube be homogeneous in composition, but can also have consisted of
or a root. The shortest type A tracks, less than 100 µm, were ini- a compact, about 3000 kg m−3 silicate particle accompanied by a
tially all classified as type A although it was then already noted fine grained material mix (Kearsley et al. 2008). Thus, impactors
that their morphology of a squat turnip is slightly different (Hörz creating bowl-shaped craters would fall into our solid group or
et al. 2006). Subsequent laboratory work with analogue material porous group, or a mix of the two (e.g., POROUS_SOLID_1 or
showed that their impactors are substantially different from the POROUS_SOLID_2).
longer type A tracks, thus Kearsley et al. (2012) suggested to re- For craters with high and uneven relief Kearsley et al. (2008)
classify these tracks as type A* (cf. Fig. 10 (e)). Type B tracks suggest that they are caused by porous agglomerates with low
show broader, bulbous cavities with one or several styli (cf. Fig. densities, complex shape and diverse composition. Their model
10 (b) and (c)), and type C tracks are broad, stubby cavities with calculations reveal porosities around 75 % and densities less than
no or very little styli (cf. Fig. 10 (d)). 1000 kg m−3 , which classifies them as members of our porous
To determine impactor properties from track properties, group. Agglomerate sizes can be up to 100 µm, but their con-
many efforts of laboratory calibration were carried out, e.g. by stituents are in the micrometre scale and seem to consist of again
Kearsley et al. (2012). Impactors that are suggested to match smaller particles in the tens of nanometres size range (Kearsley
particles of the solid group in our classification are single crys- et al. 2008). These smallest, tens of nanometres grains are falling
tals or glassy grains of sizes between 1 and 10 µm (note that the into our solid group.
impactor particle diameters less than 1 µm are all correlated to As there is no experimental data on extremely low-density
type A* tracks; Burchell et al. 2008). These materials are not and high-porosity material shot on aluminium foils (Kearsley
expected to fragment upon high-velocity capture and indeed are et al. 2008), there is no counterpart for the fluffy group in
found to produce type A tracks with one stylus (Kearsley et al. these laboratory studies. Interestingly, the distribution of aero-
2012). However, type A tracks with one stylus can also be caused gel tracks and aluminium foil craters are only slightly consis-
by agglomerates of up to 100 µm with coarse subunits larger than tent with random impacts and can be interpreted as clustering. It
about 10 µm. In our classification, this agglomerate would fall in was suggested that particles fragment in the coma, leading to so-
the porous group. called bursts and swarms in dust flux measurements (Tuzzolino
The porous group is suggested to be populated by all ag- et al. 2004; Economou et al. 2012). Clustering of impact fea-
glomerate impactors used in the experimental calibrations, ex- tures, be it aerogel tracks or aluminium foil impacts, could be
cept for the most fragile ones (Kearsley et al. 2012). These im- the result of particle fragmentation, but the reason for breakup
pactors of sizes between 1 and 100 µm (Burchell et al. 2008) is unknown (Hörz et al. 2006). If millimetre sized fluffy parti-
were found to create type A tracks with single or multiple styli cles like the ones detected by Rosetta/GIADA (Sect. 3.3) were
as well as type B tracks. This ambiguity is in good agreement present at comet Wild 2, the aluminium foil clusters could even
with the continuity between the track shapes of type A and B be explained without particle fragmentation, just by direct im-
(Kearsley et al. 2012) and possibly an effect of different aggre- pact of fluffy particles or, if breakup is desired, the fragmentation
gate strength depending on the degree of subunit fineness and of fluffy particles can be explained by electrostatic charging.
organic content.
Extremely weak material with highest porosities as sug- 3.8. Interplanetary Dust Particles and Micrometeorites
gested in the fluffy group was not used for laboratory calibrations
and thus a comparison to the impacts created is difficult. The The largest sample of cometary material on Earth is believed
best matches among the used calibration material is expected to to be in Interplanetary Dust Particles (IDPs) and Micromete-
be the agglomerates of fine subunits with organic material, or orites (MMs). While IDPs are particles collected in the Earth
pure organic material. Small impactors of few 100 nm in size stratosphere, MMs are collected on ground (e.g., Antarctica, sed-
were probably creating type A* tracks and those around 10 µm iments, ...). The association with cometary material is not unam-
(Burchell et al. 2008) type C tracks. biguous but several arguments support it on a statistical level.
In comparison to the Rosetta/GIADA data, those impactors The zodiacal cloud model of Nesvorný et al. (2010), sug-
could well be the same materials as the particles creating fluffy gests from a dynamical perspective that 85 % of the total mass
detections without a sign of a compact particle in the GIADA influx at Earth originates from Jupiter family comets. Particles
instrument. On the other hand, fluffy particles associated with smaller than ∼ 300 µm should moreover survive frictional heat-
the detection of a compact particle in GIADA (explained by ing to arrive in the Earth stratosphere (as IDPs) and even on the
FLUFFY_SOLID_1 in Fig. 7) are suggested to have caused Star- surface (as MMs). Interpretations of zodiacal light observations
dust type B tracks, where the fluffy part would create the bulbous in the visible and infra-red domains (Lasue et al. 2009; Rowan-
morphology and the compact particle creates the stylus. Robinson & May 2013) also indicate that most of the interplan-
etary dust particles reaching the Earth’s vicinity are of cometary
origin.
3.7.2. Aluminium Foils Busemann et al. (2009) connected IDPs collected in April
2003 with comet 26P/Grigg-Skjellerup, which was expected to
Cometary dust particles that collided with the aluminium frame show an enhanced flux in this time period. From a compositional
holding the aerogel collector produced hyper velocity craters and standpoint, this sample shows very primitive properties: an un-
left molten residues inside (Hörz et al. 2006). It was found in lab- usually high abundance of pre-solar grains, organic matter, and
oratory experiments that it is possible to deduce impactor proper- fine-grained carbonates. As a classification, Bradley (2003) and
Article number, page 11 of 15You can also read