Computational characterization of inhaled droplet transport to the nasopharynx
←
→
Page content transcription
If your browser does not render page correctly, please read the page content below
www.nature.com/scientificreports
OPEN Computational characterization
of inhaled droplet transport
to the nasopharynx
Saikat Basu
How human respiratory physiology and the transport phenomena associated with inhaled airflow in
the upper airway proceed to impact transmission of SARS-CoV-2, leading to the initial infection, stays
an open question. An answer can help determine the susceptibility of an individual on exposure to a
COVID-2019 carrier and can also provide a preliminary projection of the still-unknown infectious dose
for the disease. Computational fluid mechanics enabled tracking of respiratory transport in medical
imaging-based anatomic domains shows that the regional deposition of virus-laden inhaled droplets
at the initial nasopharyngeal infection site peaks for the droplet size range of approximately 2.5–19
µ. Through integrating the numerical findings on inhaled transmission with sputum assessment data
from hospitalized COVID-19 patients and earlier measurements of ejecta size distribution generated
during regular speech, this study further reveals that the number of virions that may go on to establish
the SARS-CoV-2 infection in a subject could merely be in the order of hundreds.
Severe acute respiratory syndrome coronavirus 2 (SARS-CoV-2) has been identified as the causative agent for
coronavirus disease 2019 (COVID-19), that has inflicted a global pandemic with nearly 114 million confirmed
infections and over 2.5 million deaths worldwide, as of late-February 2021; for details, s ee1.
As is well-known by now, transmission of respiratory infections such as COVID-19 occurs through carriage
of pathogens via droplets of different sizes produced during sneezing, coughing, singing, normal speech, and
even, breathing2. Accordingly, the means of person-to-person infection are projected to be three-way3: (a) inhala-
tion of virus-laden droplets emitted by an infected individual at close-range; (b) inhalation of vaporized droplet
nuclei that can float in air for hours; and (c) contaminating the respiratory mucosa through physical contact to
external surfaces (fomites) with droplet deposits sitting on them. While (a) is valid for short-distance exposures
to the COVID-19 carrier, transmission through modes (b) and (c) can happen over larger distances and longer
time scales. However, clustering trends of infection spread (e.g. in industrial units4, in closed groups5, and inside
households6) suggest that close-range exposures, through inhalation of respiratory ejecta from infected indi-
viduals, is a critical determinant in worsening of the pandemic. A follow-up question might be—what entails an
exposure? A key component therein are the respiratory droplet sizes one is exposed to. Coughing and sneezing
typically generate droplets with length-scales of O(102 ) to O(103 ) µ, while oral droplets ejected during normal
speaking can range over ∼ 0.1–500 µ3,7. Some of the competing environmental effects determining the fate of
these droplets are the ambient temperature and humidity (e.g. low relative humidity induces fast evaporation
and shrinkage of the droplets), along with the size of the droplet that controls its inertia and the gravitational
force acting on it. While smaller droplets would stay airborne for longer, the larger droplets tend to fall fast bal-
listically; with the critical size for this transition being in the vicinity of 100 µ8,9. Of note here, this study does not
insist on any nomenclatural distinction between “aerosols” and “droplets”, owing to a mbiguities10 in common
perception, and simply refers to all expiratory liquid particulates as droplets.
For tracking what range of virus-bearing droplet sizes might be more potent for SARS-CoV-2 transmis-
sion and to eventually induce infection, it is crucial that we identify the initial infection sites. At least two 2020
studies11,12 reveal a striking pattern of relatively high SARS-CoV-2 infectivity in ciliated epithelial cells along the
nasal passage lining in the upper airway, to less infectivity in cells lining the throat and bronchia, and finally to
relatively low infectivity at the lung cells. Such viral tropism is decidedly governed through angiotensin-convert-
ing enzyme 2 (ACE2), which is a single-pass type I membrane protein and is the surface receptor that the virus
utilizes to intrude into cells. ACE2 is abundant on ciliated epithelial cells, but is relatively scarce on the surface
of the lower airway cells. While these findings are for in vitro samples, deposition of virus-laden droplets along
1
Department of Mechanical Engineering, South Dakota State University, Brookings, SD 57007, USA. 2Department
of Otolaryngology / Head and Neck Surgery, University of North Carolina School of Medicine, Chapel Hill,
NC 27599, USA. email: Saikat.Basu@sdstate.edu
Scientific Reports | (2021) 11:6652 | https://doi.org/10.1038/s41598-021-85765-7 1
Vol.:(0123456789)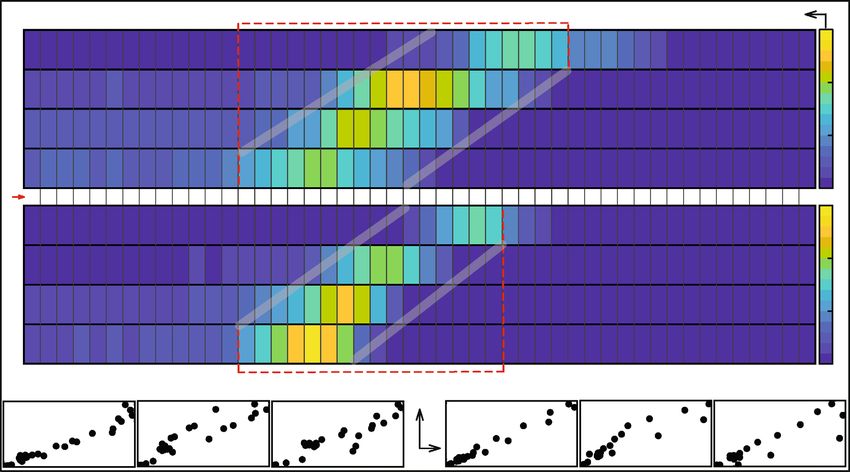
www.nature.com/scientificreports/
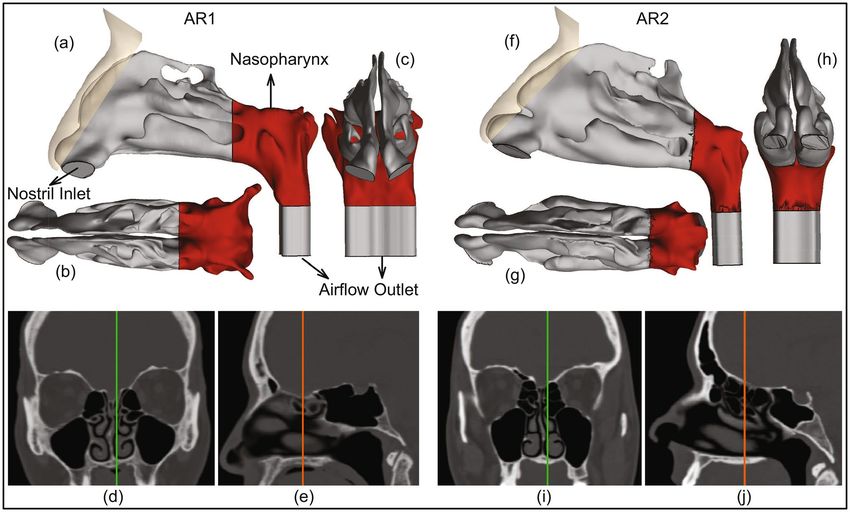
Figure 1. Anatomically realistic nasal airway geometries: (a–c) respectively depict the sagittal, axial, and
coronal views of the computed tomography (CT) based nasal domain in anatomic reconstruction 1 (AR1).
(d,e) Representative CT slices for AR1. Therein, the green line in (d) corresponds to the location of the sagittal
section shown in (e); the orange line in (e) corresponds to the location of the coronal section shown in (d).
(f–h) Respectively depict the sagittal, axial, and coronal views of the CT-based nasal domain in anatomic
reconstruction 2 (AR2). (i,j) Representative CT slices for AR2. Therein, the green line in (i) corresponds to the
location of the sagittal section shown in (j); the orange line in (j) corresponds to the location of the coronal
section shown in (i). The digital reconstructions only consider the main nasal cavity and leave out the sinus
appendages. Nasopharynx is marked in red on the top row graphics. Visuals in (a–c), (f–h) are generated
using the software ICEM CFD 15.0 (ANSYS Inc., Canonsburg, Pennsylvania; link to software homepage). The
scans on (d,e) and (i,j) are extracted from the image processing software Mimics Research 18.0 (Materialise,
Plymouth, Michigan; link to software homepage).
the anterior nasal airway might not be so effective as to launch an infection despite the presence of ciliated cells,
since the mucus layer provides some protection against virus invasion and i nfection3. This sets up nasopharynx
(i.e. the region in the upper airway posterior to the septum and comprising the superior portion of the pharynx;
for reference, see Fig. 1) as the main initial infection site; it acts as the seeding zone for subsequent infection of
the lower airway, mediated by the aspiration of virus-laden boluses of nasopharyngeal fl uids11,13–15. The ansatz
steering the identification of nasopharynx, as the dominant initial site of infection during SARS-CoV-2 patho-
genesis, is supported by the e fficacy16 of nasopharyngeal swab testing for COVID-19 diagnosis, when compared
to oropharyngeal swabs. So at this point, a valid question to ask would be: what are the dominant inhaled droplet
sizes that are making their way to the nasopharynx?
Respiratory droplets, on being expelled, typically lose water and shrink;—the extent of which partially
depends on the fraction of non-volatile constituents present in the droplets, e.g. dehydrated epithelial cell rem-
nants, white blood cells, enzymes, DNA, sugars, electrolytes etc. So, although sputum is composed of 99.5% water;
ejected droplets, on dehydration, have a higher density of 1.3 g/mL17, which is what has been used for the initial
set of droplet tracking simulations here, with the assumption that the non-volatile weight fraction is in the 1–5%
range. Such dehydration contracts the expelled droplet diameter to 20–34% of the initial size. Considering 100
µ as the critical size prompting ballistic sedimentation, this study tracks inhaled droplet sizes that could still be
airborne after dehydration. Hence, the tested size range is 0.1–30 µ, assuming a conservative dehydration-induced
shrunk volume of 30% of the initial s ize18. Choice of the smallest tracked droplet size is dictated by SARS-CoV-2
dimension, which is in between 0.08 and 0.2 µ, with an average physical diameter of 0.1 µ19.
Next piece in this puzzle involves the breathing parameters. Allometric r elations20 put the minute inhalation
at 18.20 L/min for a 75-kg male and 15.05 L/min for a 75-kg female, for gentle steady breathing while sitting
awake. In general, inspiratory rates can stretch over ∼ 15 to 85 L/min, based on whether the individual is inhaling
gently or breathing in forcefully. This study uses computational fluid dynamics (CFD) in anatomically realistic
upper airway geometries to simulate droplet transmission at four different inhalation rates, viz. 15, 30, 55, and
Scientific Reports | (2021) 11:6652 | https://doi.org/10.1038/s41598-021-85765-7 2
Vol:.(1234567890)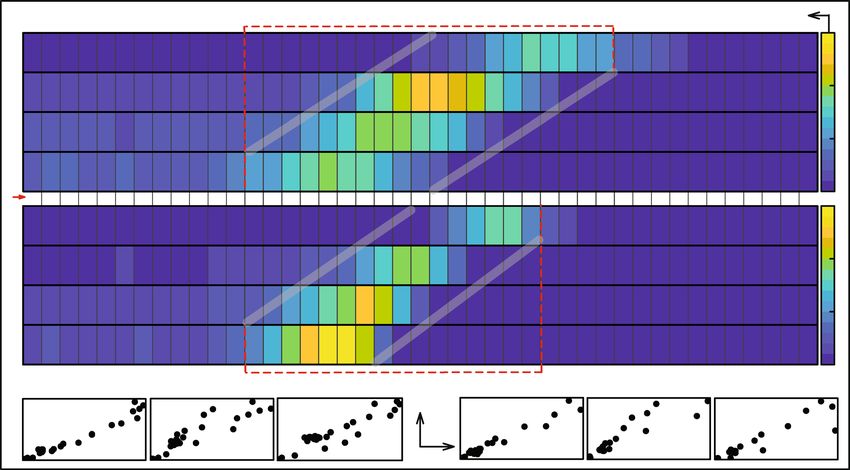
www.nature.com/scientificreports/
85 L/min; notably these discrete flow rates are also the ones traditionally used21 for checking filtration capacities
of protective face-coverings and respirators. The flow physics undergo a transition over this range; e.g. 15 L/
min through nasal conduits is in laminar regime, the transport mechanism however devolves into turbulence
at higher inhalation rates.
Methods
Anatomic geometry reconstruction. Computed tomography (CT)-based in silico model generation
was accomplished according to relevant guidelines and regulations, with the anatomic geometries being recon-
structed from existing de-identified imaging data from two CT-normal subjects. The use of the archived and
anonymized medical records was approved with exempt status by the Institutional Review Board of the Univer-
sity of North Carolina (UNC) at Chapel Hill, with the requirement of informed consent being waived for retro-
spective use of the de-identified scans in computational research. The test subjects include a 61 year-old female
(subject for anatomic reconstruction 1, or AR1) and a 37 year-old female (subject for anatomic reconstruction
2, or AR2). In context to the imaging resolution, the CT slices were collected at coronal depth increments of
0.348 mm in AR1’s scans and 0.391 mm in AR2’s scans. The nasal airspaces were extracted from the medical
grade scans (see the bottom row in Fig. 1 for representative CT slices) over a delineation range of − 1024 to − 300
Hounsfield units, and was complemented by careful hand-editing of the selected pixels to ensure anatomic accu-
racy. For this step, the DICOM (Digital Imaging and Communications in Medicine) scans for each subject were
imported to the image processing software Mimics Research 18.0 (Materialise, Plymouth, Michigan).
The reconstructed geometries were exported as stereolithography files to ICEM-CFD 15.0 (ANSYS Inc., Can-
onsburg, Pennsylvania), and then meshed spatially into minute volume elements. Conforming with established
mesh refinement-based protocols22,23, each computational grid contained more than 4 million unstructured,
graded tetrahedral elements (e.g. 4.54 million in AR1, 4.89 million in AR2); along with three prism layers of
0.1-mm thickness at the airway walls, with a height ratio of 1. The nostril inlet planes comprised 3015 elements
in AR1 (1395 elements on left nostril plane, 1620 elements on right nostril plane) and 3000 elements in AR2
(1605 on left nostril plane, 1395 on right nostril plane).
Numerical simulations. The study considers droplet transport for four different inhaled airflow rates,
viz. 15, 30, 55, and 85 L/min. The lower flow rate (i.e. 15 L/min) corresponds to comfortable resting breathing,
with the viscous-laminar steady-state flow physics model standing in as a close approximation24–35. At higher
flow rates (extreme values of which may sometimes lead to nasal valve collapse), the shear layer separation from
the tortuous walls of the anatomic geometries results in turbulence36–40. While accounting for the turbulent
characteristics of the ambient airflow, the study averages the droplet deposition percentages from implemen-
tation of two distinct categories of numerical schemes, viz. (a) shear stress transport (SST) based k-ω model,
which is a sub-class under Reynolds-averaged Navier Stokes (RANS) schemes that parameterize the action of all
turbulent fluctuations on to the mean flow; and (b) Large Eddy Simulation (LES). In this work (see results), the
two numerical techniques depict high correlation in terms of droplet deposition at the nasopharynx. However,
it should be noted that while the SST k-ω scheme, a 2-equation eddy-viscosity model, is computationally less
expensive; it averages the short time-scale flow artifacts, such as the transient vortices (e.g. the low-pressure
Dean vortices that are common in tortuous channels and can act as droplet attractors), and hence the prediction
of droplet transport affected by the simulated airflow may at times contain errors. LES is computationally more
expensive, it separates the turbulent flow into large-scale and small-scale motions, and accounts for the small
fluctuations through a sub-grid scale model (for this study, Kinetic Energy Transport Model was used as the
sub-grid scale model41). We took the averaged estimates for regional droplet deposition (along the in silico nasal
tissue surfaces) from the two schemes, to minimize probable statistical and algorithmic biases.
The computational schemes implemented in the meshed domains employed a segregated solver on ANSYS
Fluent 15.0, with SIMPLEC pressure-velocity coupling and second-order upwind spatial discretization. Solution
convergence was monitored by minimizing the mass continuity and velocity component residuals, and through
stabilizing the mass flow rate and static pressure at the airflow outlets. For the pressure-driven flow solutions: typi-
cal convergence run-time in a laminar simulation with 5000 iterations was approximately 5–6 h for 4-processor
based parallel computations executed at 4.0 GHz speed. The corresponding run-time for a RANS simulation was
∼ 12 h; for an LES computation, it was 4–5 days. Note that for the LES work, the simulated flow interval was 0.5
s for the 30 L/min case, with 0.0002 s as the time-step42 and it was 0.25 s for the 55 and 85 L/min flow rates with
the time-step at 0.0001 s. In the computations, assumed air density was 1.204 kg/m3 and 1.825 × 10⁻⁵ kg/m s
was used as dynamic viscosity of air.
Following set of boundary conditions were enforced during the simulations: (1) zero velocity at the airway-
tissue interface i.e. at the walls enclosing the digitized nasal airspace (otherwise commonly referred to as the no
slip condition), along with “trap” boundary condition for droplets whereby the tracking of a droplet’s transport
would cease once it has landed on the walls; (2) zero pressure at nostril planes, which were the pressure-inlet
zones in the simulations, with “reflect” boundary condition for droplets to mimic the effect of inhalation on
the droplet trajectories if they are about to fall out of the anterior nasal domain; and (3) a negative pressure at
the airflow outlet plane, which was the pressure-outlet zone, with “escape” boundary condition for droplets,
i.e. allowing for the outgoing droplet trajectories to leave the upper respiratory airspace. Mean inlet-to-outlet
pressure gradients were − 9.01 Pa at 15 L/min, − 26.65 Pa at 30 L/min, − 73.73 Pa at 55 L/min, and − 155.93 Pa
at 85 L/min. For a reference on the general layout of the anatomic regions, see Fig. 1.
On convergence of the airflow simulations, inhaled droplet dynamics were tracked by Lagrangian-based
discrete phase inert particle transport simulations in the ambient airflow; with the localized deposition along
the airway walls obtained through numerically integrating transport e quations43 that consider contribution of
Scientific Reports | (2021) 11:6652 | https://doi.org/10.1038/s41598-021-85765-7 3
Vol.:(0123456789)www.nature.com/scientificreports/
the airflow field on the evolution of droplet trajectories, along with the effects for gravity and other body forces
such as the Saffman lift force that is exerted by a flow-shear field on small particulates moving transverse to the
streamwise direction. Also, the droplet size range is considered large enough to discount Brownian motion effects
on their spatial dynamics. Note that the study simulated the transport for 3015 droplets of each size in AR1 and
3000 droplets of each size in AR2, the numbers being same as the number of elements on the nostril inlet planes
which were seeded with the to-be-tracked droplets for the droplet transport simulations. For the numerical
tracking, the initial mass flow rate of the inert droplets moving normal to the inlet planes into the nasal airspace
was required to be non-zero, and was set at 10−20 kg/s. After the transport simulations, the post-processing of
the droplet transmission data along the airway walls provided the regional deposition trends at the nasopharynx.
The numerical methods, discussed and used here, are an extension from one of our recent p ublications43 in
this journal. The questions explored in the present study are, of course, very different and new, and the findings
can be potentially substantial in our evolving field of knowledge on respiratory pathogen transport, with the
current focus being on SARS-CoV-2 transmission mechanisms. The reader should also note that the numeric
protocol has been rigorously validated in the earlier p ublication43, through comparing the regional deposition
trends along the inner walls of similar in silico nasal anatomic domains to the in vitro spray tests performed in
3D-printed solid replicas of the same reconstructions.
Assessing the probability for at least 1 virion being embedded on a respiratory ejecta droplet
emanating from an infected individual. A recent landmark p aper17 reports the probability that a 10-µ
undehydrated droplet, constituted from the respiratory ejecta of an infected individual, will contain at least one
SARS-CoV-2 virion is 0.37%. The probability drops to only 0.01%, if the undehydrated droplet diameter is 3 µ.
We attempt in this study to verify their reported data through a simple mathematical model, while at the same
time laying down the calculation framework to estimate the number of virions that are directly carried to the
nasopharynx by the droplets that could now be inhaled by an exposed individual.
In the oral fluids of hospitalized COVID-19 patients, the mean SARS-CoV-2 RNA load has been m easured14
at 7.0 × 10 copies/mL. Imposing a continuum approach and assuming a homogeneous concentration of the
6
virions in the undehydrated respiratory ejecta, 1 m 3 of oral ejecta therefore has 7 × 10¹² virions (given that SARS-
CoV-2 is a single-stranded RNA v irus44). Consequently, an expiratory droplet of diameter δ (in µ) would have
3
δ × 10−6
4π
N = 7 × 10¹² × × virions. (1)
3 2
In other words, to come across 1 virion in undehydrated droplets of diameter δ (in µ), one would need to “check”
n = N −1 such droplets. (2)
Thus, the probability of there being at least 1 virion in an undehydrated droplet of diameter δ (in µ) is
1
P= × 100% = f (δ). (3)
n
Plugging in δ = 3 µ and 10 µ in Eqs. (1)–(3) respectively generates P = 0.01% and 0.37%, thereby matching prior
findings17 and validating the above mathematical idealization. We have used Eq. (1) (see next, “Estimating the
number of virions transmitted to the nasopharynx”) for further quantification of the number of virions carried
by the droplets that undergo nasopharyngeal deposition.
Estimating the number of virions transmitted to the nasopharynx. The logic diagram in Fig. 2
lays out the modus operandi for the estimation of the number of virions that are carried by the inhaled droplets
to the nasopharynx. In essence, we use known data on the distribution of dehydrated droplet sizes that are
expelled during regular speaking7. The CFD simulations are then used to quantify what percentage of the drop-
lets, purportedly expelled by a COVID-positive patient in proximity, will land at the nasopharynx of the exposed
individual. We obtain both the number and sizes of the droplets that undergo nasopharyngeal deposition, and
then use Eq. (1), to quantify the approximate number of virions that should be transmitted by those droplets.
Note that at this point, we do account for the environmental dehydration, e.g. an expelled droplet of diameter
δ µ would undergo dehydration and with mean shrinkage17, transform into a droplet of diameter D = 0.30 × δ
(in µ) before being inhaled by an exposed subject, by losing bulk of its volatile water components, and yet would
carry the same viral load that was embedded in its initial δ-µ size.
Scientific Reports | (2021) 11:6652 | https://doi.org/10.1038/s41598-021-85765-7 4
Vol:.(1234567890)www.nature.com/scientificreports/
From CFD simulations Process the simulated NPD data from all the tested breathing rates
A
Flow-averaged % of droplets of each size undergoing NPD
% of droplets of each size undergoing
AR1 NPD, at a particular breathing rate
(averaged from AR1 and AR2, from all breathing rates)
Consider a size range defined by five
discrete droplet sizes x1 to x5 (say)
Mean % of droplets of each size undergoing NPD, at a
particular breathing rate (averaged from AR1 and AR2) Compute the averaged NPD % over the x1 to x5 droplet size range
Speech data on droplet sizes B
% of droplets of each size undergoing expelled per minute
AR2 NPD, at a particular breathing rate
Total number (say, ζ) of droplets belonging to the x1 to x5 size
bin, that deposit at the nasopharynx during each minute
From CFD simulations Equal allocation of the deposited
droplets to each discrete size in the bin
Calculate the number of virions carried by these droplets ζ/5 number of droplets of each discrete size in the bin are
(see methods) assumed to be landing at the nasopharynx in each minute
C
Carry out this series of steps for each of the size bins with speech data - to compute D
the total number virions transmitted to the nasopharynx by all the droplets, per minute
Anecdotal exposure durations (e.g. the Skagit Valley choir superspreading incident) can be used as a AR = anatomic reconstruction
preliminary basis for the order-of-magnitude estimate of the still-elusive infectious dose for SARS-CoV-2 NPD = nasopharyngeal deposition
Figure 2. Logic diagram: for each tested breathing rate, the simulations generate the percentage of droplets
of each size that undergo nasopharyngeal deposition (NPD) in AR1 and AR2. From that data, we compute the
mean NPD for each droplet size, at each inhalation rate. Next, considering the mean NPD for all tested airflow
rates, we compute the flow-averaged NPD for each droplet size. The NPD% rate for each droplet size is then
linked to known data on droplet sizes emitted during regular s peech7, to figure out how many of those droplets
would land at the exposed individual’s nasopharynx. We then compute the virion loading, as a function of
the droplet sizes—see “Assessing the probability for at least 1 virion being embedded on a respiratory ejecta
droplet emanating from an infected individual” and “Estimating the number of virions transmitted to the
nasopharynx” for details of the mathematical framework, to quantify the number of virions (say, β) that are
transmitted by the droplets to the nasopharynx in each unit of time. Finally, to obtain an order-of-magnitude
estimate of the infectious dose, we multiply β with the exposure time reported during a known superspreading
incident5. Alphabets A–D in the above schematic respectively correspond to the computed outputs in Panels
A–D of Fig. 5. Note that while using the previously reported7 ejecta size distribution, the study divides up the
percentages for each size bin (i.e. 0–5, 5–10, 10–15 µ etc.) uniformly and apportions them to the discrete droplet
sizes (belonging to the same size bin) that are tracked (see horizontal axis between the NPD heat-maps in Figs. 3
and 4), to estimate how many droplets of each size would be ejected by the carrier during unit time.
Preprint. A preprint version of this manuscript has been screened for content and posted on medRxiv.
https://doi.org/10.1101/2020.07.27.20162362.
Results
Droplet size range that targets the nasopharynx. The overall droplet size range of 2.5–19 µ (in
AR1: 2.5–19 µ, in AR2: 2.5–15 µ) registers the peak, in terms of the percentage of dehydrated droplets of each
size that are deposited at the nasopharynx of an exposed individual. The range is determined by a cut-off of at
least 5% deposition for around 3000 tracked droplets (viz. 3015 in AR1, 3000 in AR2) of each size. Panel A in
Fig. 3 displays the heat-maps for nasopharyngeal deposition (NPD) for different droplet sizes, during inhalation
at the four tested airflow rates. The discrete droplet sizes, that were tracked, have been marked along the hori-
zontal axis of the heat-maps. The patch bounded by the grey lines can, in fact, be a definitive graphical technique
to delineate the hazardous droplet size range for various airborne transmissions.
What if there were less or no environmental dehydration? Findings in “Droplet size range that targets the naso-
pharynx” assume that the post-dehydration density of the respiratory droplets (expelled by the carrier and now
being inhaled by the exposed individual) is at 1.3 g/mL. If, on the contrary, there is little or no dehydration, the
ejected droplet density would remain approximately at ∼ 1 g/mL, since pure saliva contains 99.5% water while
exiting the salivary glands. With such material density, the inhaled droplet size range for peak NPD upscales to
3–20 µ, as depicted in Fig. 4. Note that for these lighter droplets, the tested droplet size range was expanded to
0.1–35 µ (instead of 0.1–30 µ, as used for the dehydrated heavier droplets). The somewhat lighter droplets can
now penetrate further into the intranasal airspace, the transport process being aided by the inspiratory stream-
Scientific Reports | (2021) 11:6652 | https://doi.org/10.1038/s41598-021-85765-7 5
Vol.:(0123456789)www.nature.com/scientificreports/
2.5 - 19 μ Nasopharyngeal Deposition (%)
15
A.
15 L/min
10
30 L/min
AR1
Inhaled Droplet Diameter (μ)
55 L/min 5
85 L/min
0
0.10.2 0.3 0.4 0.5 0.6 0.7 0.8 0.9 1 1.5 2 2.5 3 3.5 4 4.5 5 6 7 8 9 10 11 12 13 14 15 16 17 18 19 20 21 22 23 24 25 26 27 28 29 30
15
15 L/min
10
30 L/min
AR2
55 L/min 5
85 L/min
0
2.5 - 15 μ
B. 30 L/min 55 L/min 85 L/min 30 L/min 55 L/min 85 L/min
AR2
AR1
ρ : 0.9829 ρ : 0.9358 ρ : 0.9603 LES ρ : 0.9842 ρ : 0.9338 ρ : 0.9414
RANS
Figure 3. Computed trends of inhaled droplet transport to the nasopharynx: (A) Visuals of heat-maps for
inspiratory transmission trends in AR1 (top map) and AR2 (bottom map), showing the percentage of droplets
of each size undergoing nasopharyngeal deposition (NPD). The droplets are assumed to undergo environmental
dehydration before being inhaled; hence the droplet density is 1.3 g/mL. Data for different inhaled airflow rates
are arranged along separate rows. Tracked droplet sizes are along the horizontal axis (positioned between the
two heat-maps for AR1 and AR2). NPD peaks for droplets sized between 2.5 and 19 µ in AR1 and 2.5 and 15 µ
in AR2. (B) The correlation between RANS-based SST k-ω and LES results for the higher airflow rates i.e. 30,
55, and 85 L/min; therein the first three frames (bottom-left) are for AR1, the other three frames (bottom-right)
correspond to data for AR2. The frames are on an aspect ratio of 0.5; ρ represents the Pearson’s correlation
coefficient. Heat-maps in (A) are generated by post-processing the simulated data on MATLAB R2020a
(MathWorks, Natick, Massachusetts; link to software homepage). The correlation plots in (B) are generated on
Mathematica 12.0 (Wolfram Research, Champaign, Illinois; link to software homepage).
lines. The underlying physical principle can be assessed in terms of the non-dimensional Stokes number and the
inertial motion of the droplets.
The Stokes number (Stk) can be mathematized a s45
U ξD D2 Cc
Stk = . (4)
18 µ d
Here U is flow rate divided by flux area, ξD is the material density of the inhaled droplets, Cc is the Cunningham
slip correction factor, µ is the dynamic viscosity of the ambient medium i.e. air, and d is the characteristic diam-
eter of the flux cross-section. All other flow and morphological parameters staying the same, it is straightforward
to show from Eq. (4) that
2
ξD1 D2
= , (5)
ξD2 D1
where (ξDi , Di ) for i = 1, 2 are two different droplet density and droplet size pairings. In this study, we have seen
that for say, ξD1 = 1.3 g/mL, the droplet size range where NPD peaks is 2.5–19 µ. Let us now use the scaling
argument in Eq. (5), to predict the corresponding size range if the droplets do not undergo dehydration, and as
such ξD2 = 1.0 g/mL. If the to-be-predicted size range that would generate peak NPD for the lighter droplets is
represented by D′min to D′max (in µ), then
′
2 ′
2
1.3 Dmin 1.3 Dmax
= and = . (6)
1.0 2.5 1.0 19.0
This results in D′min = 2.9 µ and D′max = 21.7 µ. Despite the simplicity of the scaling analysis, the theoretically
predicted range 2.9–21.7 µ is reassuringly close to the CFD-based projection of 3–20 µ.
Scientific Reports | (2021) 11:6652 | https://doi.org/10.1038/s41598-021-85765-7 6
Vol:.(1234567890)www.nature.com/scientificreports/
A. 3 - 20 μ Nasopharyngeal Deposition (%)
15
15 L/min
10
30 L/min
AR1
Inhaled Droplet Diameter (μ)
55 L/min 5
85 L/min
0
0.10.20.30.40.50.60.70.80.9 1 1.5 2 2.5 3 3.5 4 4.5 5 6 7 8 9 10 11 12 13 14 15 16 17 18 19 20 21 22 23 24 25 26 27 28 29 30 31 32 33 34 35
15
15 L/min
10
30 L/min
AR2
55 L/min 5
85 L/min
0
B. 3 - 16 μ
30 L/min 55 L/min 85 L/min 30 L/min 55 L/min 85 L/min
AR2
AR1
ρ : 0.9797 ρ : 0.9516 LES
ρ : 0.9548 RANS ρ : 0.9924 ρ : 0.9523 ρ : 0.9376
Figure 4. Hazardous droplet size range, when there is minimal or no dehydration: (A) Visuals of heat-maps
for inspiratory transmission trends in AR1 (top map) and AR2 (bottom map), showing the percentage of
droplets of each size undergoing nasopharyngeal deposition (NPD). Without any dehydration, the droplet
density is assumed to be 1.0 g/mL. Data for different inhaled airflow rates are arranged along separate rows.
Tracked droplet sizes are along the horizontal axis (positioned between the two heat-maps for AR1 and AR2).
NPD peaks for droplets sized between 3 and 20 µ in AR1 and 3 and 16 µ in AR2. (C) The correlation between
RANS-based SST k-ω and LES results for the higher airflow rates i.e. 30, 55, and 85 L/min; therein the first three
frames (bottom-left) are for AR1, the other three frames (bottom-right) correspond to data for AR2. The frames
are on an aspect ratio of 0.5; ρ represents the Pearson’s correlation coefficient. Heat-maps in (A) are generated
by post-processing the simulated data on MATLAB R2020a (MathWorks, Natick, Massachusetts; link to softw
are homepage). The correlation plots in (B) are generated on Mathematica 12.0 (Wolfram Research, Champaign,
Illinois; link to software homepage).
Figure 5. Quantifying virion transmission to the nasopharynx: (A) Graphical representation of the
flow-averaged data on the percentage of droplets of each size undergoing deposition at the nasopharynx.
(B) Distribution of droplet sizes ejected each minute during normal speaking, the numbers are calculated from
earlier studies on expelled droplet tracking with food coloring7; the reported size distribution is for dehydrated
droplets. Also note that the referenced article7 described the size bin limits as α − β (in µ). For consistency, we
typically interpreted that as droplet sizes (in µ) that are ≥ α and < β; and in this graphic, such a droplet size
bin range is represented by [α, β), conforming to set theory notations. (C) Pie diagram showing which droplet
sizes are dominant contributors for virion transmission at the nasopharynx, for ejecta size distribution as in (B).
Symbol D is the inhaled droplet diameter. The numbers assume that the droplets have undergone dehydration
before being inhaled into the nasal airspace. (D) Estimated number of virions that are deposited at the
susceptible individual’s nasopharynx via dehydrated inhaled droplets, during close-range exposure to a COVID-
19 carrier for 5 min. Outputs in (A–D) in the above graphic respectively correspond to the steps marked by
labels A–D in Fig. 2. The plots on (A,C) are generated using Microsoft Excel 365; link to software homepage.
Scientific Reports | (2021) 11:6652 | https://doi.org/10.1038/s41598-021-85765-7 7
Vol.:(0123456789)www.nature.com/scientificreports/
50
Probability of containing at least 1 virion (%)
40
30
Post-dehydration 20
Pre-dehydration
10
0
10 12 15
Inhaled Droplet Diameter (μ)
Figure 6. Effect of environmental dehydration assessed via probabilistic interpretation of a droplet to contain at
least 1 virion, based on whether the droplet size at inhalation is pre-dehydration or post-dehydration. The plots
are generated using Microsoft Excel 365; link to software homepage.
Statistical analysis and data interpretation. Consider representatively the simulated intranasal trans-
mission for regular dehydrated droplets. Panel B in Fig. 3 plots the NPD values from RANS (along horizontal
axis) and LES (along vertical axis) schemes, implemented for the higher inhalation rates (i.e. 30, 55, and 85 L/
min). The simulation outputs on NPD (%) for different droplet sizes are linearly correlated with an average Pear-
son’s correlation coefficient of 0.98 for 30 L/min, 0.93 for 55 L/min, and 0.95 for 85 L/min. Subsequent check
of the slope m for the linear best-fit trendline, through the scatter plots of RANS and LES-based NPD data,
indicates how similar the estimates are quantitatively; the mean measures therein being m = 1.113 for 30 L/min,
m = 1.052 for 55 L/min, and m = 1.177 for 85 L/min; with the value 1 signifying exact equivalence. The statisti-
cal operations were carried out on Mathematica 12.0 (Wolfram Research, Champaign, Illinois).
Also at this point, to think of a realistic exposure to a COVID-19 carrier: the vulnerable individual can be
considered to inhale at different airflow rates over the duration of exposure. In such context, Panel A in Fig. 5
extracts the averaged nasopharyngeal deposition for the different tested inhalation rates in the two test subjects.
Such inhalation-averaged transmission presents an approximate dehydrated droplet size range of 2.5–15.0 µ, for
a minimum 2% NPD for each droplet size.
Droplets that are better at carrying the virions. The next pertinent question is: how effective are these
droplets at carrying virions? SARS-CoV-2 belongs to a diverse family of single-stranded RNA v iruses44,46, and as
noted before, virological a ssessments14 done on the sputum of hospitalized COVID-19 patients show an aver-
aged viral load of 7.0 × 10⁶ RNA copies/mL of oral fluid, with the peak load being 2.35 × 10⁹ copies/mL. For
the average load, simple calculations (see “Assessing the probability for at least 1 virion being embedded on a
respiratory ejecta droplet emanating from an infected individual” in the methods) show that the probability that
a dehydrated 10-µ droplet (contracted from its original size of ∼ 33.33 µ) will carry at least 1 virion is 13.6%. The
same number is 45.8% for a post-shrinkage 15-µ droplet (contracted from its original size of ∼ 50 µ). The prob-
ability drops exponentially to 0.2% for a 2.5-µ dehydrated droplet (contracted from its original size of ∼ 8.33 µ).
Now, with existing data on the size distribution of expelled droplets during normal speaking (see Panel B, Fig. 5),
the proportion of virion deposits at the nasopharynx by different droplet sizes can be computed (see Panel C,
Fig. 5) by using the transmission data presented in Fig. 3, coupled with the mathematical framework laid out in
“Estimating the number of virions transmitted to the nasopharynx”. The virion deposition trends are again from
droplets that are being inhaled post-dehydration.
Significantly enough: in the absence of environmental dehydration, the probability of 1 virion being embed-
ded in, for instance, a 10-µ droplet plummets to 0.37% (see Fig. 6). This rationalizes why in geographic regions
with high humidity (and hence relatively less dehydration and shrinkage of respiratory ejecta), the pandemic’s
spread has been somewhat measured47,48.
On the SARS‑CoV‑2 infectious dose. The infectious dose is a fundamental virological measure quan-
tifying the number of virions that can go on to start an infection; the value of which is still not conclusively
Scientific Reports | (2021) 11:6652 | https://doi.org/10.1038/s41598-021-85765-7 8
Vol:.(1234567890)www.nature.com/scientificreports/
known for SARS-CoV-249. Theoretically, according to the independent action hypothesis50, even a single virion
can potentially establish an infection in highly susceptible systems. Whether the hypothesis is true for humans
and specifically for SARS-CoV-2 transmission is as yet undetermined. The rapid spread of COVID-19 though a
priori suggests a small infective dose for the disease, that is triggering inter-human transmission.
Since it would be unethical at this point to expose subjects to SARS-CoV-2 (especially in the absence of
well-evidenced remediating therapeutics—as of February 2021), this study proposes a novel strategy synergiz-
ing computational tracking and virological data, to estimate the infectious dose. Based on the nasopharyngeal
transmission trends (Fig. 3) and the virion transmission data (Panels B,C of Fig. 5), for a 5-min exposure: the
number of virions depositing at the susceptible individual’s nasopharynx is 11, considering average RNA load
in the carrier’s sputum. On the contrary, if the infecting individual is in the disease phase with peak RNA load,
as many as 3835 virions will be deposited on the nasopharynx of the exposed individual over 5 min (see Panel
D in Fig. 5).
To put the computed prediction on virion transmission into context, consider now the March 2020 Skagit
Valley Chorale superspreading incident5, where a COVID-19 carrier infected 52 other individuals in a 61-mem-
ber choir group. Exposure time there was reported to be 2.5 h. The subjects were positioned close to each other;
which justifies discounting the effect of spatial ventilation for a conservative estimate of the number of virions
that a susceptible individual would have been exposed to. Therefore, for an average RNA load (assuming that
the carrier had mild-to-moderate symptoms), coupled with derived exposure estimates from previous para-
graph, the number of virions depositing at a closely-situated individual’s nasopharynx over the 2.5-h duration
approximates to: (11/5) virions per minute × 60 min × 2.5 h = 330. So, an order of O(102 ) could be reckoned as
a conservative estimate for SARS-CoV-2’s infectious dose; the scale agreeing with preliminary estimates based
on the viral replication r ates51.
A review of projections for the SARS‑CoV‑2 infectious dose, as per other reports. A recent dose titration study52
of SARS-CoV-2 in a ferret model has shown 500 as the lower tested limit for the number of virions needed to
launch an infection; the study extracted the dose in terms of the plaque-forming units (PFU)—which is a meas-
ure used in virology to describe the number of virus particles capable of forming plaques per unit volume. The
quantitative estimate of the infectious dose, being of the order O(102 ), agrees with the findings presented here.
Moreover, though not yet shown through experimental models in humans, multiple preliminary critiques53,54
expect the infectious dose of SARS-CoV-2 to be similar to that of other coronaviruses, such as SARS-CoV.
According to a key p ublication55 from the 2010s, the SARS-CoV dose that correlated to 10% and 50% adverse
responses (i.e., illness) was estimated respectively at 43 and 280 PFU. This confirms the feasibility of the infec-
tious dose (≈ 300, or more conservatively O(102 )) derived here for SARS-CoV-2.
Discussion
• On the practicality of viral load used in the calculations—Through tissue culture examinations for respiratory
infections, it is fairly well recognized56 that only a small fraction of virions are actually able to infect a human
cell, and that this fraction decreases rapidly with increasing duration from the time of initial infection of
the carrier. So, the SARS-CoV-2 infectivity is being conjectured to peak well before the viral load reaches a
maximum. This substantiates the use of averaged viral load (i.e. 7.0 × 10⁶ RNA copies/mL) in the carrier’s
sputum for the virological calculations, while deducing the conservative upper estimate for the SARS-CoV-2
infectious dose.
• On the significance of the hazardous droplet sizes—Whereas the computed data is post-processed to specifically
extract the droplet sizes that tend to target the nasopharynx, a vastly larger remainder (comprising predomi-
nantly the droplets that are smaller than 5 µ) actually go further down the respiratory tract (considering
that the air passageways narrow down to just a few microns in the lower airway). However, the significantly
pronounced surface area of the lower airspaces, together with the relative scarcity of ACE2 receptors there,
validates the robustness of the modeling approach i.e. focusing on the droplets that deposit on the ACE2-rich
epithelial cells at the nasopharynx. Also, the probability of droplets smaller than 5 µ to carry a virion is often
trivial; e.g. the probability of containing a virion is only 1.7% for a 5-µ dehydrated droplet; for the related
analytical framework, see “Assessing the probability for at least 1 virion being embedded on a respiratory
ejecta droplet emanating from an infected individual”.
• On the number of simulated droplets—The reader should note that the modeling framework to track approxi-
mately 3000 monodispersed droplets of discrete sizes is a mathematical idealization employed to obtain
statistically robust data on the intranasal droplet transmission trends for each size and identify the specific
size range for which a higher fraction of the inhaled droplets would land directly at the infection-prone
nasopharynx in the upper respiratory pathway. Hence, the focus was not on replicating a realistic quantity
and size distribution of droplets, which would be functions of a wide range of environmental and locational
factors57, such as wind and inter-individual distances.
• On the “trap” boundary condition in the simulations—The numerical scheme used in this study tracks the
inhaled droplets as long as they are airborne inside the intranasal space and stops the tracking when the
droplets land on the airway tissue surfaces, which have a no-slip boundary condition. In other words, the
droplet trajectories would cease once they touch a wall and the effects of any possible accretion and erosion
of droplets at the walls were not considered. The feasibility of such entrapment is backed by the physico-
chemical properties58 of mucus which washes the upper airway walls. Mucus in the nose e xhibits59 a pH
range of 5.5–6.5. Mucins, which are the main component of the mucus secretions from goblet and epithelial
cells, are known for inducing drastically different rheological and mechanical properties to mucus based on
Scientific Reports | (2021) 11:6652 | https://doi.org/10.1038/s41598-021-85765-7 9
Vol.:(0123456789)www.nature.com/scientificreports/
several ambient factors, of which the dominant one is the medium pH. The pH range in the nasal mucus is
associated60 with a distinct hydrophilic behavior, which justifies the assumption of the airway walls to be
perfectly absorbing via surface tension forces. The absorbed droplets will spread on i mpact61–64, and mecha-
nistically, the virions embedded in the droplets could be conjectured to disperse over and percolate through
the top gel-like layer of mucus.
Additionally, note that this study considers a droplet to “land” on the airway walls, only when the droplet
center enters the layer of mesh cells that adhere to the walls. To enhance accuracy of tracking, the mesh
at the airway-tissue interfaces comprises three layers of prism cells, with the thickness of each layer being
approximately 30 µ. With similar mesh refinement, the use of the entrapment boundary condition at the walls
during nasal transport is also supported by a long history of publications on particle and droplet tracking
by multiple research g roups65–68, along with several such s tudies43,69 presenting a strong agreement between
CFD simulations and in vitro experiments.
• On the limitations of the virion exposure estimate—Spatiotemporal parameters, such as ambient airflow and
ventilation rates; and subject-specific biological variables, such as innate immune response and anthropomet-
ric differences, are only a subset of the many critical factors that can have a strong correlation on quantifying
viral exposure and infectious dose, and as such, the estimates for virion transmission presented here has not
been substantiated by an epidemiological model. To that end, obtaining an exact and conclusive measure of
the SARS-CoV-2 infectious dose will require a wide in vivo study. The cross-disciplinary strategy presented
here (i.e. integration of numerical simulations of transport in complex anatomic pathways with virological
assessments and respiratory ejecta data) could however be potentially extended as a sub-component of a
full-scale epidemiological model, for an exact quantification of virologic parameters, such as the infectious
dose.
• On the continuum assumption related to the ejecta generation from oral liquids—The mathematical approach
for the estimation of virion contamination in the respiratory ejecta has, by the very nature of it, presumed a
simplistic estimate of viral load in the ejected droplets, based on a continuum-based argument that the spatial
distribution of virions could be considered uniform in the sputum. In reality, how the complex rheology
of oral fluids might affect the ejecta generation and subsequent break-down70, and the resultant volumetric
concentration of virions embedded in the expiratory remnants—are also critical open questions.
• On the size of the test cohort—This study is somewhat limited by the small sample size, primarily owing to the
lack of CT scans in subjects with otherwise disease-free airways. To get a realistic insight on the intranasal
transport phenomena at the onset of any respiratory infection, it is preferred that we base the in silico cav-
ity reconstructions on CT-normal images. Nonetheless, the preliminary findings presented here could be
considered an important step in the mechanistic characterization of the transmission dynamics for inhaled
pathogens, such as SARS-CoV-2.
The main takeaways
To highlight the main finding from this study: the detection of the inhaled droplet sizes (∼ 2.5 to 19 µ, see
“Droplet size range that targets the nasopharynx”) that specifically target the infection-prone nasopharynx,
can provide a pivotal resource in mitigating the pandemic. For instance, the information on the droplet sizes
that tend to launch the initial infection at the nasopharynx could be utilized to inform public policy on social
distancing and in the design71–74 of novel masks and face-coverings that can execute targeted screening of only
the hazardous droplet sizes and in the process, be more breathable and user-friendly than the mask respirators
available now. The findings can additionally extend salient inputs to the mechanistic design of topical anti-viral
therapeutics75–78 and targeted intranasal vaccines79–83, that could be tailored to undergo regional deposition
directly over the infected nasopharynx, thereby significantly pronouncing their therapeutic indices, especially
when compared to systemically administered vaccines and other prophylactics.
Obtained as a corollary, the O(102 ) estimate for the SARS-CoV-2 infectious dose (see “On the SARS-CoV-2
infectious dose”) is also noteworthy. The low order underlines the high communicability of this disease, especially
if discerned in the perspective of other airborne transmissions, e.g. the infective dose for influenza A virus, when
administered through aerosols to human subjects lacking serum neutralizing antibodies, is at least an order
greater and ranges between 1950 and 3000 v irions84.
Data availability
This project has generated simulated, quantitative, de-identified data on regional deposition over nasal tissues.
The digitized anatomic geometries, the simulation data-sets (including Fluent .cas and .dat files), and the numeric
protocols; along with MATLAB codes, Wolfram Mathematica notebooks, and Microsoft Excel spreadsheets
used for data post-processing—are available on-request from the author, through a shared-access Google Drive
folder85.
Received: 2 October 2020; Accepted: 5 March 2021
References
1. Johns-Hopkins-University. Coronavirus Resource Center. Web link. Accessed 28 Feb 2021.
2. Bourouiba, L. Turbulent gas clouds and respiratory pathogen emissions: Potential implications for reducing transmission of
COVID-19. JAMA 323, 1837–1838 (2020).
3. Mittal, R., Ni, R. & Seo, J. H. The flow physics of COVID-19. J. Fluid Mech. 894, 20 (2020).
4. Dyal, J. W. COVID-19 among workers in meat and poultry processing facilities—19 States, April 2020. Morbidity Mortality Wkly.
Rep. 69, 20 (2020).
Scientific Reports | (2021) 11:6652 | https://doi.org/10.1038/s41598-021-85765-7 10
Vol:.(1234567890)www.nature.com/scientificreports/
5. Miller, S. L. et al. Transmission of SARS-CoV-2 by inhalation of respiratory aerosol in the Skagit Valley Chorale superspreading
event. Indoor Air 31, 314–323 (2020).
6. Li, W. et al. Characteristics of household transmission of COVID-19. Clin. Infect. Dis. 20, 20 (2020).
7. Xie, X., Li, Y., Sun, H. & Liu, L. Exhaled droplets due to talking and coughing. J. R. Soc. Interface 6, S703–S714 (2009).
8. Wells, W. F. On airborne infection: Study II, droplets and droplet nuclei. Ame. J. Epidemiol. 20, 611–618 (1934).
9. Xie, X., Li, Y., Chwang, A. T. Y., Ho, P. L. & Seto, W. H. How far droplets can move in indoor environments—revisiting the Wells
evaporation-falling curve. Indoor Air 17, 211–225 (2007).
10. Resnick, B. The debate over “airborne” coronavirus spread, explained. Web link. Accessed 20 Feb 2021.
11. Hou, Y. J. et al. SARS-CoV-2 reverse genetics reveals a variable infection gradient in the respiratory tract. Cell 20, 20 (2020).
12. Matheson, N. J. & Lehner, P. J. How does SARS-CoV-2 cause COVID-19?. Science 369, 510–511 (2020).
13. Dickson, R. P., Erb-Downward, J. R., Martinez, F. J. & Huffnagle, G. B. The microbiome and the respiratory tract. Annu. Rev. Physiol.
78, 481–504 (2016).
14. Wölfel, R. et al. Virological assessment of hospitalized patients with COVID-2019. Nature 581, 465–469 (2020).
15. Basu, S. & Chakravarty, A. From SARS-CoV-2 infection to COVID-19 disease: A proposed mechanism for viral spread to the
lower airway based on in silico estimation of virion flow rates. medRxiv 20, 20 (2020).
16. Patel, M. R. et al. Performance of oropharyngeal swab testing compared to nasopharyngeal swab testing for diagnosis of COVID-
19. Clin. Infect. Dis. 20, 20 (2020).
17. Stadnytskyi, V., Bax, C. E., Bax, A. & Anfinrud, P. The airborne lifetime of small speech droplets and their potential importance
in SARS-CoV-2 transmission. Proc. Natl. Acad. Sci. 117, 11875–11877 (2020).
18. Basu, S., Kabi, P., Chaudhuri, S. & Saha, A. Insights on drying and precipitation dynamics of respiratory droplets from the perspec-
tive of COVID-19. Phys. Fluids 32, 20 (2020).
19. Bar-On, Y. M., Flamholz, A., Phillips, R. & Milo, R. Science forum: SARS-CoV-2 (COVID-19) by the numbers. Elife 9, 20 (2020).
20. Garcia, G. J. M. et al. Dosimetry of nasal uptake of water-soluble and reactive gases: A first study of interhuman variability. Inhala‑
tion Toxicol. 21, 607–618 (2009).
21. He, X., Reponen, T., McKay, R. T. & Grinshpun, S. A. Effect of particle size on the performance of an N95 filtering facepiece res-
pirator and a surgical mask at various breathing conditions. Aerosol Sci. Technol. 47, 1180–1187 (2013).
22. Frank-Ito, D. O., Wofford, M., Schroeter, J. D. & Kimbell, J. S. Influence of mesh density on airflow and particle deposition in
sinonasal airway modeling. J. Aerosol Med. Pulm. Drug Deliv. 29, 46–56 (2016).
23. Basu, S., Witten, N. & Kimbell, J. S. Influence of localized mesh refinement on numerical simulations of post-surgical sinonasal
airflow. J. Aerosol Med. Pulmonary Drug Deliv. 30, A–14 (2017).
24. Inthavong, K. et al. Geometry and airflow dynamics analysis in the nasal cavity during inhalation. Clin. Biomech. 66, 97–106 (2019).
25. Zhang, Y. et al. Computational investigation of dust mite allergens in a realistic human nasal cavity. Inhalation Toxicol. 31, 224–235
(2019).
26. Basu, S., Frank-Ito, D. O. & Kimbell, J. S. On computational fluid dynamics models for sinonasal drug transport: Relevance of
nozzle subtraction and nasal vestibular dilation. Int. J. Numer. Methods Biomed. Eng. 34, 20 (2018).
27. Farzal, Z. et al. Comparative study of simulated nebulized and spray particle deposition in chronic rhinosinusitis patients. Int.
Forum Allergy Rhinol. 9, 746–758 (2019).
28. Kimbell, J. S. et al. Upper airway reconstruction using long-range optical coherence tomography: Effects of airway curvature on
airflow resistance. Lasers Surg. Med. 51, 150–160 (2019).
29. Kiaee, M., Wachtel, H., Noga, M. L., Martin, A. R. & Finlay, W. H. Regional deposition of nasal sprays in adults: A wide ranging
computational study. Int. J. Numer. Methods Biomed. Eng. 34, 20 (2018).
30. Brandon, B. M. et al. Comparison of airflow between spreader grafts and butterfly grafts using computational flow dynamics in a
cadaveric model. JAMA Facial Plastic Surg. 20, 215–221 (2018).
31. Brandon, B. M. et al. Nasal airflow changes with bioabsorbable implant, butterfly, and spreader grafts. Laryngoscope 20, 20 (2020).
32. Zhao, K., Scherer, P. W., Hajiloo, S. A. & Dalton, P. Effect of anatomy on human nasal air flow and odorant transport patterns:
Implications for olfaction. Chem. Sens. 29, 365–379 (2004).
33. Xi, J. & Longest, P. W. Numerical predictions of submicrometer aerosol deposition in the nasal cavity using a novel drift flux
approach. Int. J. Heat Mass Transf. 51, 5562–5577 (2008).
34. Shanley, K. T., Zamankhan, P., Ahmadi, G., Hopke, P. K. & Cheng, Y. S. Numerical simulations investigating the regional and
overall deposition efficiency of the human nasal cavity. Inhalation Toxicol. 20, 1093–1100 (2008).
35. Kelly, J. T., Prasad, A. K. & Wexler, A. S. Detailed flow patterns in the nasal cavity. J. Appl. Physiol. 89, 323–337 (2000).
36. Longest, P. W. & Vinchurkar, S. Validating CFD predictions of respiratory aerosol deposition: Effects of upstream transition and
turbulence. J. Biomech. 40, 305–316 (2007).
37. Perkins, E. L. et al. Ideal particle sizes for inhaled steroids targeting vocal granulomas: Preliminary study using computational
fluid dynamics. Otolaryngol. Head Neck Surg. 158, 511–519 (2018).
38. Tracy, L. F. et al. Impact of endoscopic craniofacial resection on simulated nasal airflow and heat transport. Int. Forum Allergy
Rhinol. 9, 900–909 (2019).
39. Hosseini, S. et al. Use of anatomically-accurate 3-dimensional nasal airway models of adult human subjects in a novel methodology
to identify and evaluate the internal nasal valve. Comput. Biol. Med. 103896, 20 (2020).
40. Doorly, D. J., Taylor, D. J. & Schroter, R. C. Mechanics of airflow in the human nasal airways. Respir. Physiol. Neurobiol. 163, 100–110
(2008).
41. Baghernezhad, N. & Abouali, O. Different SGS models in Large Eddy Simulation of 90 degree square cross-section bends. J. Tur‑
bulence N50, 20 (2010).
42. Ghahramani, E., Abouali, O., Emdad, H. & Ahmadi, G. Numerical investigation of turbulent airflow and microparticle deposition
in a realistic model of human upper airway using LES. Comput. Fluids 157, 43–54 (2017).
43. Basu, S. et al. Numerical evaluation of spray position for improved nasal drug delivery. Sci. Rep. 10, 1–18 (2020).
44. V’kovski, P., Kratzel, A., Steiner, S., Stalder, H. & Thiel, V. Coronavirus biology and replication: Implications for SARS-CoV-2. Nat.
Rev. Microbiol. 20, 1–16 (2020).
45. Finlay, W. H. The Mechanics of Inhaled Pharmaceutical Aerosols: An Introduction (Academic Press, 2001).
46. Moreno-Eutimio, M. A., López-Macías, C. & Pastelin-Palacios, R. Bioinformatic analysis and identification of single-stranded
RNA sequences recognized by TLR7/8 in the SARS-CoV-2, SARS-CoV, and MERS-CoV genomes. Microbes Infect. 22, 226–229
(2020).
47. Wang, J., Tang, K., Feng, K. & Lv, W. High temperature and high humidity reduce the transmission of COVID-19. SSRN 3551767,
20 (2020).
48. Wang, M. et al. Temperature significantly changed COVID-19 transmission in 429 cities. medRxiv 20, 20 (2020).
49. Lakdawala, S. & Gaglia, M. What we do and do not know about COVID-19’s infectious dose and viral loads. Web link. Accessed
20 Feb 2021.
50. Zwart, M. P. et al. An experimental test of the independent action hypothesis in virus-insect pathosystems. Proc. R. Soc. B Biol.
Sci. 276, 2233–2242 (2009).
51. Wang, D. et al. Population bottlenecks and intra-host evolution during human-to-human transmission of SARS-CoV-2. bioRxiv
20, 20 (2020).
Scientific Reports | (2021) 11:6652 | https://doi.org/10.1038/s41598-021-85765-7 11
Vol.:(0123456789)You can also read