Synuclein oligomers interact with ATP synthase and open the permeability transition pore in Parkinson's disease
←
→
Page content transcription
If your browser does not render page correctly, please read the page content below
Edinburgh Research Explorer

-synuclein oligomers interact with ATP synthase and open the
permeability transition pore in Parkinson’s disease
Citation for published version:
Ludtmann, MHR, Angelova, PR, Horrocks, MH, Choi, M, Rodrigues, M, Baev, AY, Berezhnov, AV, Yao, Z,
Little, D, Banushi, B, Al-Menhali, AS, Ranasinghe, RT, Whiten, DR, Yapom, R, Singh Dolt, K, Devine, MJ,
Gissen, P, Kunath, T, Jaganjac, M, Pavlov, EV, Klenerman, D, Abramov, AY & Gandhi, S 2018, '-synuclein
oligomers interact with ATP synthase and open the permeability transition pore in Parkinson’s disease',
Nature Communications, vol. 9, 2293. https://doi.org/10.1038/s41467-018-04422-2

Digital Object Identifier (DOI):
10.1038/s41467-018-04422-2

Link:
Link to publication record in Edinburgh Research Explorer

Document Version:
Publisher's PDF, also known as Version of record

Published In:
Nature Communications

Publisher Rights Statement:
Open Access This article is licensed under a Creative Commons Attribution 4.0 International License, which
permits use, sharing, adaptation, distribution and reproduction in any medium or format, as long as you give
appropriate credit to the original author(s) and the source, provide a link to the Creative Commons license, and
indicate if changes were made. The images or other third party material in this article are included in the article’s
Creative Commons license, unless indicated otherwise in a credit line to the material. If material is not included
in the article’s Creative Commons license and your intended use is not permitted by statutory regulation or
exceeds the permitted use, you will need to obtain permission directly from the copyright holder. To view a copy
of this license, visit http://creativecommons.org/licenses/by/4.0/.

General rights
Copyright for the publications made accessible via the Edinburgh Research Explorer is retained by the author(s)
and / or other copyright owners and it is a condition of accessing these publications that users recognise and
abide by the legal requirements associated with these rights.

Take down policy
The University of Edinburgh has made every reasonable effort to ensure that Edinburgh Research Explorer
content complies with UK legislation. If you believe that the public display of this file breaches copyright please
contact openaccess@ed.ac.uk providing details, and we will remove access to the work immediately and
investigate your claim.

Download date: 10. Oct. 2021
ARTICLE
                  DOI: 10.1038/s41467-018-04422-2                OPEN

                  α-synuclein oligomers interact with ATP synthase
                  and open the permeability transition pore in
                  Parkinson’s disease
                  Marthe H.R. Ludtmann1,2, Plamena R. Angelova1, Mathew H. Horrocks3,4,5, Minee L. Choi6,7,
                  Margarida Rodrigues3, Artyom Y. Baev8, Alexey V. Berezhnov9, Zhi Yao6,7, Daniel Little10, Blerida Banushi10,
                  Afnan Saleh Al-Menhali11, Rohan T. Ranasinghe3, Daniel R. Whiten3, Ratsuda Yapom12, Karamjit Singh Dolt12,
1234567890():,;

                  Michael J. Devine 10,13, Paul Gissen 10, Tilo Kunath 12, Morana Jaganjac11, Evgeny V. Pavlov14,
                  David Klenerman3,15, Andrey Y. Abramov1 & Sonia Gandhi6,7

                  Protein aggregation causes α-synuclein to switch from its physiological role to a pathological
                  toxic gain of function. Under physiological conditions, monomeric α-synuclein improves ATP
                  synthase efficiency. Here, we report that aggregation of monomers generates beta sheet-rich
                  oligomers that localise to the mitochondria in close proximity to several mitochondrial pro-
                  teins including ATP synthase. Oligomeric α-synuclein impairs complex I-dependent respira-
                  tion. Oligomers induce selective oxidation of the ATP synthase beta subunit and
                  mitochondrial lipid peroxidation. These oxidation events increase the probability of perme-
                  ability transition pore (PTP) opening, triggering mitochondrial swelling, and ultimately cell
                  death. Notably, inhibition of oligomer-induced oxidation prevents the pathological induction
                  of PTP. Inducible pluripotent stem cells (iPSC)-derived neurons bearing SNCA triplication,
                  generate α-synuclein aggregates that interact with the ATP synthase and induce PTP
                  opening, leading to neuronal death. This study shows how the transition of α-synuclein from
                  its monomeric to oligomeric structure alters its functional consequences in Parkinson’s
                  disease.

                  1 Department of Molecular Neuroscience, UCL Institute of Neurology, London WC1N 3BG, UK. 2 Royal Veterinary College, 4 Royal College St, Kings Cross,

                  London NW1 0TU, UK. 3 Department of Chemistry, University of Cambridge, Lensfield Road, Cambridge CB2 1EW, UK. 4 EaStCHEM School of Chemistry,
                  University of Edinburgh, David Brewster Road, Edinburgh EH9 3FJ, UK. 5 UK Dementia Research Institute, University of Edinburgh, Edinburgh, UK. 6 Sobell
                  Department of Motor Neuroscience and Movement Disorders, UCL Institute of Neurology, Queen Square, London WC1N 3BG, UK. 7 The Francis Crick
                  Institute, 1 Midland Road, King’s Cross, London NW1 1AT, UK. 8 Educational-Experimental Centre of High Technologies, Laboratory of Biophysics and
                  Biochemistry, Tashkent, Uzbekistan. 9 Institute of Cell Biophysics, Russian Academy of Sciences, Pushchino 142290, Russia. 10 MRC Laboratory for Molecular
                  Cell Biology, University College London, Gower Street, London WC1E 6BT, UK. 11 Toxicology and Multipurpose Department, Anti-Doping Lab Qatar, Sport
                  City Road, PO Box 27775, Doha, Qatar. 12 MRC Centre for Regenerative Medicine, Institute for Stem Cell Research, School of Biological Sciences, The
                  University of Edinburgh, Edinburgh EH16 4UU, UK. 13 Department of Neuroscience, Physiology and Pharmacology, University College London, London WC1E
                  6BT, UK. 14 Department of Basic Sciences, New York University College of Dentistry, NY 10010, USA. 15 UK Dementia Research Institute, University of
                  Cambridge, Cambridge CB2 0XY, UK. These authors contributed equally: Marthe H.R. Ludtmann, Plamena R. Angelova, Mathew H. Horrocks.
                  Correspondence and requests for materials should be addressed to A.Y.A. (email: a.abramov@ucl.ac.uk) or to S.G. (email: sonia.gandhi@ucl.ac.uk)

                  NATURE COMMUNICATIONS | (2018)9:2293                      | DOI: 10.1038/s41467-018-04422-2 | www.nature.com/naturecommunications                       1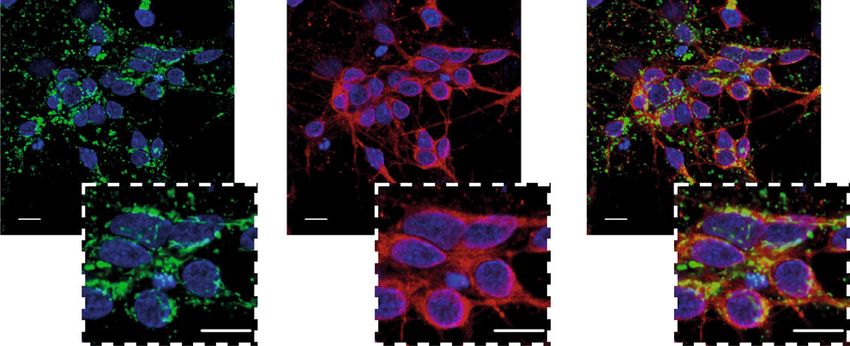
ARTICLE NATURE COMMUNICATIONS | DOI: 10.1038/s41467-018-04422-2
P
rotein aggregation and mitochondrial dysfunction are two high levels of dopamine5, the tendency for it to self-aggregate and
central pathogenic processes in both familial and sporadic form oligomers, and eventually fibrils also increases6. Aggregation
Parkinson’s disease (PD). However, the way in which these of α-synuclein from its monomeric to oligomeric form leads to
two processes converge to cause neurodegeneration is unknown. structural conformation changes in the protein that mediate the
Missense mutations1,2, and duplications or triplications of the toxic effects of α-synuclein within cells7–9.
SNCA gene, which encodes α-synuclein, lead to autosomal domi- We recently reported that α-synuclein, in its monomeric state,
nant early-onset PD3,4, that is clinically and pathologically similar interacts with, and regulates ATP synthase to improve the effi-
to sporadic PD. Genetic and biochemical data suggest that, as the ciency of ATP production10. Here we investigate whether the
concentration of α-synuclein increases, especially in the presence of mitochondrial function of α-synuclein is structure-specific, and
a 4h 8h 24 h
0 1 2 3 0 1 2 3 0 1 2 3
b
Number of species
250 160 50 80 80
4h 120 4h 8h 24 h 8h 24 h
200 120 40 60 60
150 80 30
80 40 40
100 20
40 40 20 20
50 10
0 0 0 0 0 0
1 2 3 4 5 0.0 0.4 0.8 1.2 1.6 0 1 2 3 4 5 0.0 0.4 0.8 1.2 1.6 0 1 2 3 4 5 0.0 0.4 0.8 1.2
Maximum width Integrated intensity Maximum width Integrated intensity Maximum width Integrated intensity
(μm) (x105 photons) (μm) (x105 photons) (μm) (x105 photons)
c NaCN FCCP
NaCN
3000 FCCP 2200 Oligomers Oligomers
Monomers 1800
2800 2000
1600
2600 1800
NADH, AU
NADH, AU
NADH, AU
1400
2400 1600
1200
2200 1400 + CsA
1000 – CsA
1200
2000 800
1000
1800 600
800
1600 400
0 100 200 300 400 0 100 200 300 400 500 0 5 10 15 20 25 30 35
Time (s) Time (s) Time (min)
d FCCP
e f 1.2 Oligomers FCCP g
1.2 Oligomers 0.25 Oligomers
Rh123 F0/F1, normalised
Monomers
Rh123, normalised
60 1.0
Rh123, normalised
1.0 Oligomers 0.20
% Depolarisation
0.8 0.8
40 *** *** 0.15
Astrocytes
Neurons
0.6 0.6 Control
20 0.10 CsA
0.4 0.4
0.05
Astrocytes
0.2 0 0.2
Neurons
0.0 0.0 0.00
0 2 4 6 8 10 12 0 5 10 15 20 25 30 35 40 0 5 10 15 20 25 30 35 40 45 50
Time (min) Time (min) Time (min)
h i Fluo-4 TMRM Merge 1.2 Oligomers
FCCP FCCP
1.2 Glutamate 1.2 Glutamate
Monomers Oligomers 1.0
Rh123, normalised
Rh123, normalised
0 min
1.0
Fluorescence,
1.0
0.8
normalised
0.8 0.8
0.6
0.6 0.6
0.4 Fluo-4
0.4 J
4 min
0.4 High laser 10 s intervals TMRM
0.2
0.2 0.2
0.0
0.0 0.0
0 1 2 3 4 5 6
7 Time (min)
2.0 2.0
6
1.8 1.8
Time until PTP
opening (min)
Fura-2 ratio
Fura-2 ratio
5
1.6 1.6 4
1.4 1.4 ***
3
1.2 1.2 2
1.0 1.0 1
0.8 0.8 0
0 2 4 6 8 10 12 14 16 0 2 4 6 8 10 12 14 16 18 20 Control Oligomers
Time (min) Time (min)
2 NATURE COMMUNICATIONS | (2018)9:2293 | DOI: 10.1038/s41467-018-04422-2 | www.nature.com/naturecommunications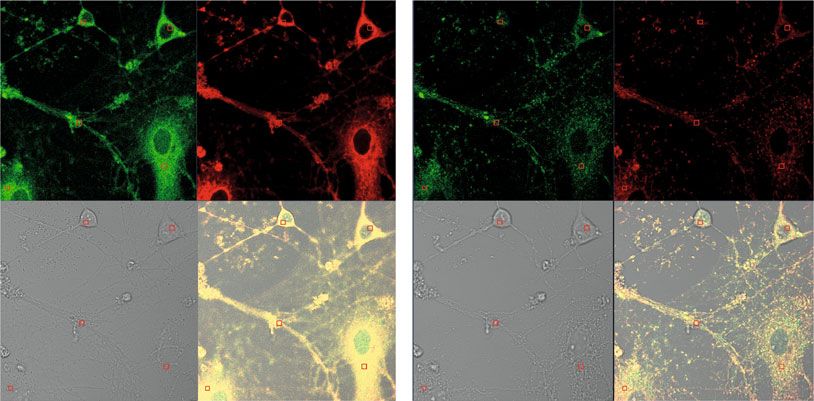
NATURE COMMUNICATIONS | DOI: 10.1038/s41467-018-04422-2                                                                                   ARTICLE

therefore adopted a range of methods including single-molecule                 cells with oligomers, in some neurons, induced a sudden drop in
biophysical measurements, super-resolution microscopy, elec-                   mitochondrial NADH, which could be induced by rapid activation
trophysiology, and dynamic fluorescent neuronal imaging to                      of NADH consumption due to uncoupling of mitochondria or by
describe the location and functional mechanism of oligomeric                   mitochondrial permeability transition pore (PTP) opening and
species of α-synuclein, compared to monomeric species. We show                 redistribution of NADH to cytosol (Fig. 1c). Inhibitor of mPTP
that α-synuclein oligomers come into close proximity with, and                 cyclosporin A (CsA) prevented this transient drop in mitochon-
exert, functional effects on several mitochondrial proteins. This              drial NADH level (Fig. 1c). Impairment of complex I function
study focuses on its specific interaction with ATP synthase due to              may affect the mitochondrial membrane potential (ΔΨm).
the previously reported physiological interaction with α-synu-                 Application of oligomers (~1 nM oligomers) induced slow mito-
clein, and the putative role of ATP synthase in the regulation and/            chondrial depolarisation, reflected in the slow increase in Rh123
or composition of the PTP.                                                     intensity (Fig. 1d, e). This gradual depolarisation of the ΔΨm is in
                                                                               accordance with oligomer-induced impairment of respiration and
Results                                                                        reduced electron flow through the electron transport chain.
Generation and characterisation of aggregated α-synuclein. We                  Monomers alone did not induce mitochondrial depolarisation,
generated aggregated forms of recombinant α-synuclein that were                and may even hyperpolarise mitochondria, as previously shown10.
characterised using a highly sensitive single-molecule method                     Application of oligomers (~3 nM oligomers) also induced
termed Single Aggregate Visualisation by Enhancement (SAVE)                    sharp transient increases in Rh123 fluorescence intensity, which
imaging, which uses single-molecule fluorescence microscopy to                  appeared as discrete mitochondrial depolarisation events that
detect the benzothiazole salt Thioflavin-T (ThT)11. Upon binding                resembled PTP opening (Fig. 1f). When cells were pre-incubated
to β-sheet structures, ThT fluorescence increases allowing indivi-              with the PTP inhibitor cyclosporine A, the oligomer-induced
dual aggregated species to be detected (Fig. 1a). This can be fitted            PTP-like events were abolished (Fig. 1g).
to a two-dimensional Gaussian distribution to determine the                       PTP opening in mitochondria can be triggered by two major
aggregate width along the longest axis (full-width half maximum),              stimuli, calcium and reactive oxygen species (ROS). First we
in addition to the integrated intensity of each species (Fig. 1b).             tested whether a physiological calcium stimulus, low concentra-
From 2 h onwards, the number of diffraction limited fluorescent                 tion of glutamate (1 μM), could trigger PTP opening in the
puncta increases, which represents the emergence of oligomers. At              presence of oligomers (~1 nM oligomers). Application of
later time points (24 h), fibrils as long as 5 µm are observed. The             glutamate to WT rat neurons leads to a rapid cytosolic calcium
total integrated intensity also increases, representing the increased          influx with no significant alteration in the basal ΔΨm
crossed β-sheet content in the larger aggregates (Fig. 1b).                    (Supplementary Fig. 1). Incubation of WT rat neurons with
   For this study, we utilised time points characteristically                  monomers for 6–9 min prior to the addition of glutamate-
represented by Fig. 1a (8 h), in which ~1% of the aggregation                  induced a similar cytosolic calcium and ΔΨm response to control
mixture has formed β-sheet-rich oligomeric structures, and the                 (Fig. 1h). Conversely, exposure to oligomeric α-synuclein prior to
remaining 99% is monomeric. As a paired control to the oligomer                glutamate stimulation resulted in a glutamate-induced cytosolic
preparation, monomer sample from the starting time point of the                calcium response that was associated with rapid and transient
aggregation was used.                                                          depolarisation with incomplete recovery to baseline, which
                                                                               resembled PTP opening (Fig. 1h). Next, we assessed whether
Oligomers induce mitochondrial dysfunction in whole cells. To                  oligomers altered the PTP threshold in response to laser-induced
investigate the effect of structural conformation on mitochondrial             ROS production. Cells loaded with fluo-4 and tetramethylrhoda-
function, monomers and oligomers were applied to primary rat                   mine methyl ester (TMRM) (ΔΨm; Fig. 1i), were treated with
co-cultures of neurons and astrocytes and the autofluorescence of               oligomers and then exposed to high laser power. High laser power
mitochondrial NADH (selected from NADH/NADPH auto-                             generates ROS, which in turn triggers PTP opening that leads to a
fluorescence determined by activation and inhibition of NADH                    rapid mitochondrial depolarisation reflected by a rapid fall in
consumption—see Fig. 1c) was assessed. 100 nM monomeric α-                     TMRM signal (Fig. 1i). This is then followed by an increase in the
synuclein induced a decrease in NADH autofluorescence in                        cytosolic fluo-4 fluorescence as the mitochondrial calcium
wildtype (WT) neurons (Fig. 1c) suggesting consumption of                      redistributes to the cytosol (note the appearance of TMRM drop
NADH through activation of respiration. In contrast, oligomers                 before fluo-4 increase; Fig. 1i). The threshold for PTP opening
(100 nM monomers, ~1 nM oligomers) induced a slow and pro-                     was significantly lower in oligomer-treated cells when compared
gressive increase of NADH in mitochondria (Fig. 1c) confirming                  to control conditions (HBSS only, p < 0.001; Fig. 1i) suggesting
inhibition of complex I by oligomeric α-synuclein (in agreement                that oligomers lower the threshold for ROS-induced PTP opening
with previous reports)12. However, more prolonged exposure of                  in neuronal co-cultures.

Fig. 1 Characterisation of oligomers and their effect on mitochondria. a Representative SAVE images of early oligomers (4 h), late oligomers (8 h), and
fibrils (24 h). Zoom and representative two-dimensional Gaussian distribution fits are shown in the insets. The scale bar is 5 µm and 1 µm in the zoom, and
the colour bar shows the Gaussian amplitude (×104 photons). b Quantification of aggregation. Each detected species was fitted to a two-dimensional
Gaussian distribution, and histograms of the widths (FWHM) along the longest axis, and the total integrated intensities are shown for each time-point. c
Representative traces from single experiments, of NADH autofluorescence in WT neurons exposed to either monomers (n = 15 cells), oligomers (n = 32
cells), or oligomers ± CsA (n = 9 cells and n = 6 cells, respectively). d Representative Rh123 traces of cells challenged with oligomers. e Quantification of
mitochondrial depolarisation upon either monomeric or oligomeric application. N = 3 experiments; Oligomers: n ≥ 60 neurons/astrocytes; Monomers: n ≥
50 neurons/astrocytes. f Representative Rh123 traces of cells challenged with oligomers. g Representative Rh123 traces of cells challenged with oligomers
± CsA. h Representative traces of Rh123 and fura-2 in WT neurons exposed to glutamate in the presence of monomers or oligomers. i Representative
images of WT rat neurons labelled with fluo-4 (cytosolic calcium) and TMRM (ΔΨm) before (0 min) and after (4 min) high laser exposure which
represents PTP opening. A representative trace of TMRM and Fluo-4 fluorescence where the drop in TMRM fluorescence precedes increase in Fluo-4
fluorescence. Quantification of the time until PTP opening in WT cells pre-exposed to oligomeric α-synuclein. N = 3 experiments; n = 43 cells for control
and n = 20 cells for oligomers. Two-tailed Student’s t-test for e and i. Scatter points represent individual cells for e and i. Scale bar = 10 μm. Data
represented as mean ± SEM. *p < 0.05; **p < 0.01; ***p < 0.001

NATURE COMMUNICATIONS | (2018)9:2293                      | DOI: 10.1038/s41467-018-04422-2 | www.nature.com/naturecommunications                         3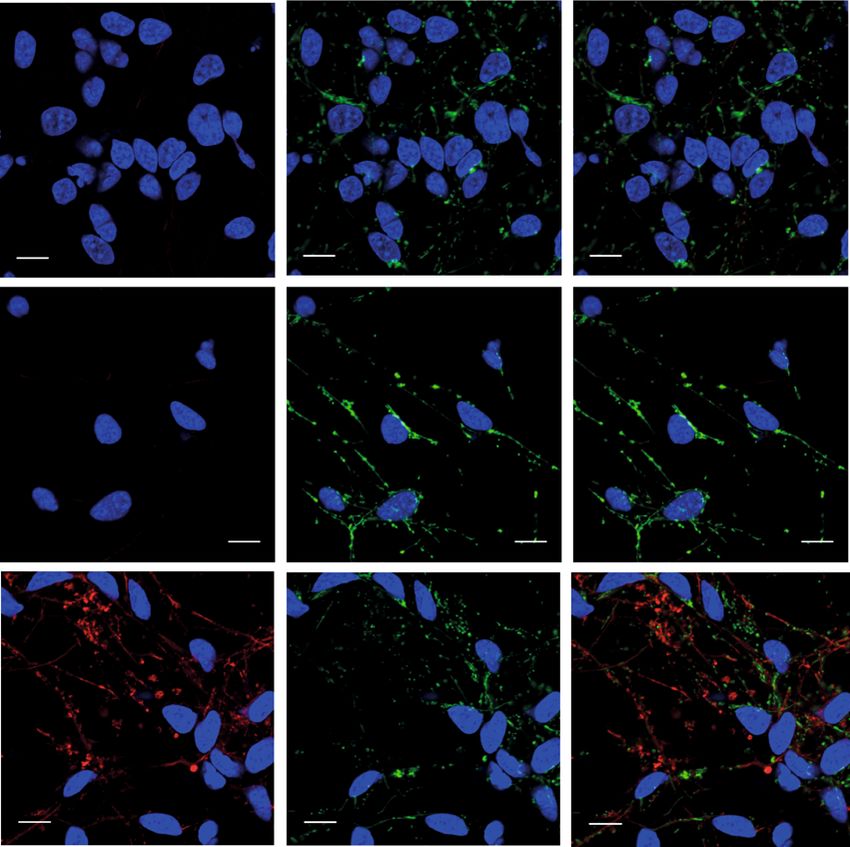
ARTICLE NATURE COMMUNICATIONS | DOI: 10.1038/s41467-018-04422-2
Oligomers induce PTP opening in isolated mitochondria. In First, a swelling assay on isolated mitochondria was per-
order to determine whether PTP opening was a direct effect of formed13, in which mitochondrial swelling was estimated from
oligomers within mitochondria, or a downstream effect of sec- the kinetics of the intensity of the transmitted light. Monomers
ondary cellular pathways, the effect of α-synuclein on isolated (100 nM) or oligomers (100 nM monomer, ~1 nM oligomers)
mitochondria was investigated. were applied to energised mitochondria for 3–5 min, followed by
a 240 ala 240
Monomers
240 Oligomers
ala
220 220 ala 220
200 200 200
D, AU
D, AU
D, AU
180 180 180
160 160 25 µM Ca2+ 160
25 µM Ca 2+
25 µM Ca2+
140 140 140
120 Control 120 120
0 100 200 300 400 500 600 700 0 100 200 300 400 500 600 700 0 100 200 300 400
Time (s) Time (s) Time (s)
b Swelling mitochondria
leads to rupturing of Mitoplast
outer mitochondrial OMM
membrane
IMM
Excised ΔΨ
patch
c d e
O
S
0 pA
C
50 pA 0 pA O
C
20 s 50 pA
50
mV
0
2s S
–50
50
C
mV
0 20 pA
–50 50 mV
1s
f O
g
i ii
70 mV
C IV O
III O
O II C
60 mV I
C C
50 mV O 0 pA
C 0 pA
40 mV O iii iv
C 50 pA
10 pA 20 s
50
mV
0.5 s 0
–50
h 1400 i 5/5
Closed Open 100
mPTP detection frequency
1200 11/13
80
1000
Points count
(% patches)
800 60
600
SubCond 40
400
20
200 2/20
0 0
0.300 0.315 0.330 0.345 0.360 0.375 –] +] s
l[ l[ er
ro ro om
Absolute current, nA nt nt lig
Co Co O
j CsA k l
30,000 Basal 3000 Basal
10 pA
CSA
10 s ADP
Points count
0 pA
Points count
20,000 2000
30 mV
–30 mV
10,000 1000
ADP
50 pA
10 s
0 0
0.00 0.01 0.02 0.03 0.04 0.05 0.07 0.08 0.09 0.10 0.11 0.12
0 pA
Absolute current, nA Absolute current, nA
4 NATURE COMMUNICATIONS | (2018)9:2293 | DOI: 10.1038/s41467-018-04422-2 | www.nature.com/naturecommunications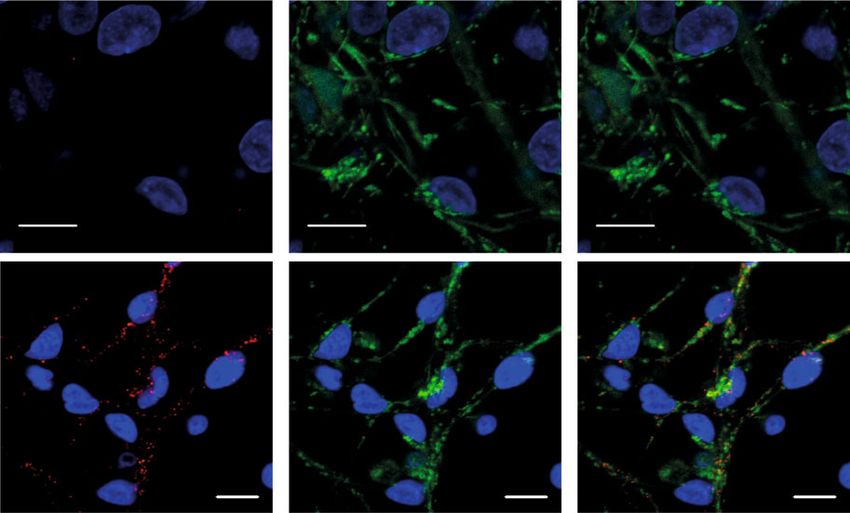
NATURE COMMUNICATIONS | DOI: 10.1038/s41467-018-04422-2                                                                                                 ARTICLE

stepwise additions of calcium applied to trigger PTP opening. In                             activity and oligomer-induced PTP were not detected in the
the presence of monomers, PTP opening and mitochondrial                                      presence of the antioxidant Trolox in the pipette.
swelling were triggered after three additions of 25 μM calcium
(Fig. 2a), whereas oligomers triggered opening after the first
                                                                                             Oligomers interact with the mitochondrial ATP synthase. We
addition of 25 µM calcium.
                                                                                             previously demonstrated that monomeric α-synuclein interacts
   Next, we employed mitochondrial electrophysiology to char-
                                                                                             with ATP synthase using co-immunoprecipitation and proximity
acterise the alteration in membrane conductance that occurs
                                                                                             ligation assay (PLA). Here we investigated whether oligomeric α-
across the inner mitochondrial membrane in response to α-
                                                                                             synuclein similarly interacts with ATP synthase. To distinguish
synuclein. Mitoplasts were prepared from isolated mitochondria
                                                                                             monomeric from oligomeric α-synuclein within cells, we utilised
and patch-clamp experiments were performed (Fig. 2b). Negative
                                                                                             a conformation-specific filament antibody, raised against aggre-
control mitoplasts were prepared by passive swelling in substrate-
                                                                                             gated α-synuclein.
free and calcium-free media. Positive control mitoplasts were
                                                                                                Due to the difficulty in preserving aggregate conformation with
prepared by swelling induced by calcium-treatment of energised
                                                                                             biochemical methods, we adopted visualisation methods to study
mitochondria to activate PTP. As expected, mitoplasts prepared
                                                                                             at high precision the location and proximity of the α-synuclein
in the absence of calcium exhibited little or no ion channel
                                                                                             aggregate to the mitochondrial protein. The specificity of the
activity (Fig. 2c), while calcium-treated mitochondria demon-
                                                                                             antibody for oligomers was tested by exposing WT rat co-cultures
strated high conductance channel activity (Fig. 2d, e), with
                                                                                             to either 500 nM monomers or 500 nM oligomers (500 nM
properties resembling the multiple conductance channel or PTP
                                                                                             monomers, ~5 nM oligomers) and performing immunocyto-
characterised by an averaged peak conductance of ~3.6 nS.
                                                                                             chemistry (Fig. 3a lower panel). In cells with exogenously added
Channel activity induced by α-synuclein was compared to
                                                                                             oligomers, a signal could be detected 1 h following addition of
channel activity seen in calcium-treated mitoplasts.
                                                                                             oligomers. After 1 day, and at 7 days, there was a significant
   When oligomers (~1–3 nM oligomers; 100–300 nM mono-
                                                                                             increase in the signal intensity and appearance of protein
mers) were present in the pipette, all patches showed discrete ion
                                                                                             aggregates within the oligomer-treated cells, reflecting the potent
channel activity (average transition size of 0.46 ± 0.15 nS), not
                                                                                             ability of the oligomers to seed aggregation in the host cell14 and
seen in control (Fig. 2f for typical single channel behaviour and
                                                                                             for such aggregates to be detected by the antibody. Monomer-
Table 1). Furthermore, in 85% of these oligomer-treated patches
                                                                                             treated cells did not show a significant signal using the filament
(Fig. 2i), channel activity was then followed, within 10 min, by the
                                                                                             Ab (Fig. 3a upper panel).
opening of a megachannel (averaged peak conductance 1.9 ± 0.4
                                                                                                Double immuno-labelling using the filament α-synuclein
nS) (Fig. 2g and inset i–iv; Table 1) with the properties
                                                                                             antibody and an antibody raised against ATP synthase subunit
resembling the PTP channel as seen in our control experiments
                                                                                             α in WT rat co-cultures exposed to oligomers (Fig. 3b)
in the presence of calcium (Fig. 2d, e, h). Channel activity induced
                                                                                             demonstrated areas of co-localisation of aggregated α-synuclein
by oligomers was inhibited by CsA and partially inhibited by
                                                                                             and the ATP synthase. To overcome the diffraction limit of
ADP further confirming its relationship to PTP (Fig. 2j–l).
                                                                                             conventional confocal microscopy, super-resolution microscopy
Altogether, the detection frequency of PTP-like activity in the
                                                                                             was employed11,15. DNA-PAINT utilises fluorophore labelled
presence of oligomers was comparable to the detection frequency
                                                                                             DNA imaging strands that transiently bind to their complemen-
of Ca2+-induced PTP-like channel, and increased when com-
                                                                                             tary docking strands that are conjugated to secondary antibodies
pared to channel activity seen in the absence of calcium (Fig. 2i).
                                                                                             (see schematic diagram, Fig. 3c). We used two different docking
   Monomers (300 nM) induced small occasional channels, and
                                                                                             strand sequences with their complementary imaging strand pairs
rarely induced a megachannel that exhibited a lower peak
                                                                                             labelled with either ATTO655 or CY3B to simultaneously image
conductance to the positive control calcium-induced PTP or
                                                                                             α-synuclein aggregates and ATP synthase, respectively. Due to the
oligomer-induced PTP (Table 1). Oligomer-induced channel
                                                                                             high photon numbers from these fluorophores, we achieved a

 Table 1 Alpha-synuclein-induced channel activity and PTP opening in mitochondrial inner membrane patches

                                                              [−] Control        [+] Control       Monomers         Oligomers       Oligomers + Trolox (in the pipette)
 IMM basal membrane conductance [nS]                          1.26±0.28          0.24±0.02         0.29±0.12        1.6±0.5         0.52±0.2
 Channel occurrence, % of total recordings                    27                 50                50               100             0
 Channel predominant transition size [nS]                     0.31±0.16          0.75±0.53         0.46±0.26        0.46±0.15       N/A
 PTP occurrence, % of total recordings                        10                 100               25               85              0
 PTP peak conductance [nS]                                    2.5±1.5            3.1±0.8           1.3±1.3          1.9±0.4         N/A
 Time until onset of PTP development [min]                    3                  1–3               5                9               N/A
 IMM: inner mitochondrial membrane; PTP: permeability transition pore

Fig. 2 Oligomers but not monomers induce PTP opening. a Mitochondrial swelling was measured by changes in optical density (D) in the presence of buffer,
monomers, and oligomers. Complete mitochondrial swelling was achieved by the addition of 5 μM alamethicin. b Schematic diagram of mitoplast preparation
and patch-clamp experiment. c Patch clamp recording of the inner membrane from control mitoplasts prepared in calcium-free media in the absence of
mitochondrial energy substrates. d Patch clamp recording of the inner membrane from control mitoplasts prepared in calcium media in the presence of
succinate showing activation of PTP. e Typical multi-conductance state of single PTP channel, induced by calcium (positive control). f Novel channel activity
detected in the presence of α-synuclein oligomers in the pipette solution, other conditions the same as in a. g Oligomer-induced gradual development of
channel activity (i and ii), which later transformed into full conductance channel resembling PTP (iii) which was inactivated/closed by the application of high
negative potential (iv). h Current amplitude histogram of the channel shown in e. i Detection frequency of the PTP channel in different experimental conditions.
j Effects of PTP inhibitors CSA (1 µM) and ADP (1 mM) on channel activity. k, l Current amplitude histogram of the channel shown in j

NATURE COMMUNICATIONS | (2018)9:2293                                    | DOI: 10.1038/s41467-018-04422-2 | www.nature.com/naturecommunications                       5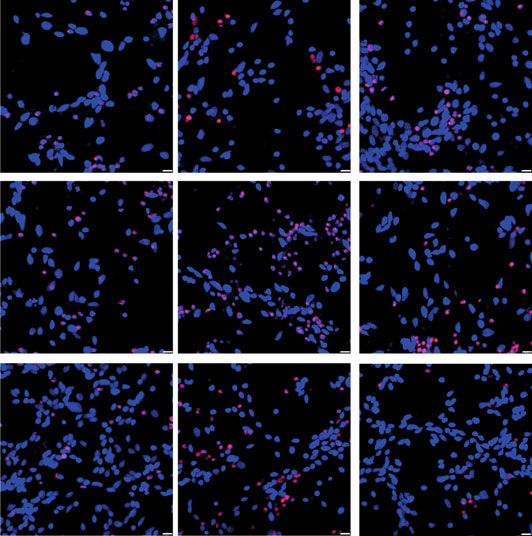
ARTICLE                                                                                                                    NATURE COMMUNICATIONS | DOI: 10.1038/s41467-018-04422-2

precision of 28 nm and 29 nm for ATP synthase and α-synuclein,                                   aggregates of α-synuclein are co-localised with the ATP synthase
and because each antibody could be localised multiple times using                                (Fig. 3c). To further quantify this, we determined the association
the PAINT methodology, we measured more than 500,000                                             quotient, Q, for the ATP synthase and α-synuclein filament
localisations in each channel, achieving a resolution of 45–108 nm                               localisations, which is a measure of the coincidence between the
and 46 nm for α-synuclein and ATP synthase, respectively. At                                     images (see Methods). This was determined to be 0.48. Similar
this resolution, there were clear areas within the cell in which                                 experiments were performed with antibodies to an outer

             a                1h               1 day           7 days      b            ATP synthase Ab                                Filament Ab                 Merge
             Monomers

                                                                            Oligomers
             Oligomers

             c                Diffraction limited                  ATP synthase Ab                                              Filament Ab                     Merge
             Astrocyte
             Neuron

                                               Imaging
                         Docking strand        strand
                                Biotin
                                          Streptavidin
                                          Secondary antibody

             d           ATP synthase Ab                                                         e                         12
                           Filament Ab                   MAP2 Ab          Merge                                                      Endogenous control
                                                                                                                                     Monomers
                                                                                                                                                          ***
                         Untreated                                                                                         10
                                                                                                     PLA signal per cell

                                                                                                                                     Oligomers
                                                                                                                            8

                                                                                                                            6

                                                                                                                            4
                                                                                                                                              NS
                         Monomers                                                                                           2

                                                                                                                            0

                                                                                                 f    ATP synthase Ab
                                                                                                         Filament Ab                           TOMM20                Merge
                         Oligomers                                                                   Oligomers

6                                    NATURE COMMUNICATIONS | (2018)9:2293                                                   | DOI: 10.1038/s41467-018-04422-2 | www.nature.com/naturecommunications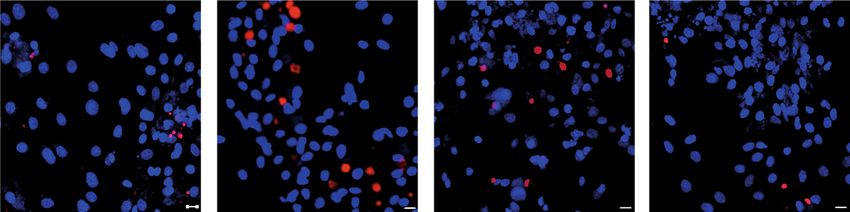
NATURE COMMUNICATIONS | DOI: 10.1038/s41467-018-04422-2 ARTICLE
mitochondrial protein, TOMM20, and an inner mitochondrial lipid peroxidation in mitochondrial membranes of neurons,
membrane protein, Complex 1 (resolution = 154 nm and 58 nm, astrocytes, and mixed processes (Fig. 4f–i).
respectively). Regions of co-localisation were also observed Taken together, oligomers generate ROS as an intrinsic
between α-synuclein and inner and outer membrane proteins property of the oligomer, and are able to oxidise lipid membranes
(co-incidence coefficients of 0.31 for TOMM20; 0.62 for Complex at their site of action, in particular at the inner mitochondrial
1) reflecting the reported potential interactions of α-synuclein membrane.
with complex 1 and TOMM20 in the literature (Supplementary
Fig. 2).
To further explore a potential interaction between aggregated α- Oligomeric α-synuclein oxidises ATP synthase subunits.
synuclein and ATP synthase, in situ proximity ligation assay (PLA; Excessive production of ROS can damage lipid, proteins, and
Fig. 3d) was utilised. 500 nM monomers, oligomers (500 nM other molecules. The formation of extremely harmful ROS can
monomers, ~5 nM oligomers), or buffer were applied to rat co- mediate direct oxidation of proteins18,19. In particular, hydroxyl
cultures and a PLA signal between the antibodies against filament radical readily oxidises sulphur-containing amino acids like
α-synuclein and ATP synthase subunit α was observed, confirm- methionine and cysteine, thus altering protein conformation and
ing an interaction between aggregated α-synuclein and ATP function. Using redox proteomics, we investigated oxidative
synthase. Microtubule-associated protein 2 (MAP2) staining was posttranslational modifications (PTMs) of the ATP synthase in
used to identify neuronal cells. Oligomer-treated cells showed a mitochondrial fractions treated with either monomers or oligo-
significantly increased interaction between the oligomers and ATP mers. The obtained data revealed significant oligomer-dependent
synthase compared to the equivalent concentration of monomers oxidative modifications of ATP synthase subunit β but not the
only or control preparation (p < 0.01; Fig. 3e). The mitochondrial ATP synthase subunit α, and selected other mitochondrial pro-
protein, TOMM20, was probed for to validate the mitochondrial teins shown for comparison. (Table 2). Treatment with 100–500
localisation of the PLA signal (Fig. 3f). Further, a PLA was carried nM α-synuclein (~1–5 nM oligomer) led to a 6–8-fold increase in
out to probe for complex I and filament α-synuclein to act as a the number of oxidised amino acids compared to control
positive control for an interaction of α-synuclein with another (untreated) samples, while treatment with 100–500 nM monomer
mitochondrial protein (Supplementary Fig. 3A). As a negative only led to a 3–4-fold increase in oxidised amino acids compared
control a PLA between the nuclear histone H3 and filament α- to untreated (Table 2; Supplementary Table 1). To quantify these
synuclein was used (Supplementary Fig. 3B, C). effects, we immunoprecipitated the ATP synthase from the iso-
lated mitochondria fractions, and then analysed the ratio of
peptides with oxidised methionine vs non-oxidised ([Met(O)]/
[Met]) peptides. This analysis revealed a highly significant
Oligomers induce non-enzymatic ROS production. Oligomers increase of some Met(O) peptides compared to Met peptides of
are potent inducers of cellular ROS7, and we hypothesised that this ATP synthase subunit β on oligomer treatment. A representative
contributes to the oligomer-specific effects. To test whether aggre- data of the ratio of four such peptides, one strongly affected by
gates of α-synuclein are intrinsically redox-active, we employed a treatment with oligomers (SLQDIIAILGMDELSEEDKLTVSR),
cell-free method of testing oxidation which relies on dihy- and the others not significantly altered is shown in Supplemen-
droethidium (DHE) oxidation after application of α-synuclein16. tary Fig. 6.
Xanthine/xanthine oxidase ROS production was used as a positive One of the most common modifications was found to be
control (Fig. 4a, b). Application of 300 nM monomers (Fig. 4a, b) oxidised methionine. Beside cysteine, methionine is another
did not induce any significant oxidation of DHE. However, appli- sulphur-containing AA implicated in the antioxidant protection
cation of oligomers (300 nM monomers, ~3 nM oligomers) induced of proteins in order to preserve their structure and function20,21.
oxidation of DHE in the absence of cells (Fig. 4a, b). Although oxidation of methionine can be reversed, this PTM may
Previously we have shown that oligomers could induce lipid act as a regulatory switch, and can inhibit the phosphorylation of
peroxidation17. Oligomers may be able to induce targeted adjacent amino acids sites, such as serine, threonine, or tyrosine,
oxidation at the site of their action, that is, in the vicinity of thereby altering protein function. However, the function of
ATP synthase at the inner mitochondrial membrane. Membrane oxidation of the sites in ATP synthase highlighted with this data,
lipid peroxidation was tested using C11-BODIPY 581/591, (Fig. is not yet known.
4c). An increase in lipid peroxidation following application of
oligomers (500 nM monomers, ~5 nM oligomers) in intact
neurons and astrocytes was observed, in agreement with previous Oligomer-induced toxicity is dependent on PTP opening. To
findings15 (Fig. 4d, e, i). Next, C11-BODIPY 581/591-loaded cells investigate whether oligomer-induced PTP opening was respon-
were permeabilized using digitonin to isolate the mitochondria, sible for oligomer-induced toxicity, monomeric (500 nM) or oli-
allowing an assessment of mitochondrial lipid peroxidation gomeric α-synuclein was applied to cells overnight and cell death
(Fig. 4c). Application of oligomers to permeabilized cells induced was quantified by assessing the ratio of propidium iodide (PI) and
Hoechst positive cells. Oligomers (500 nM monomer, ~5 nM
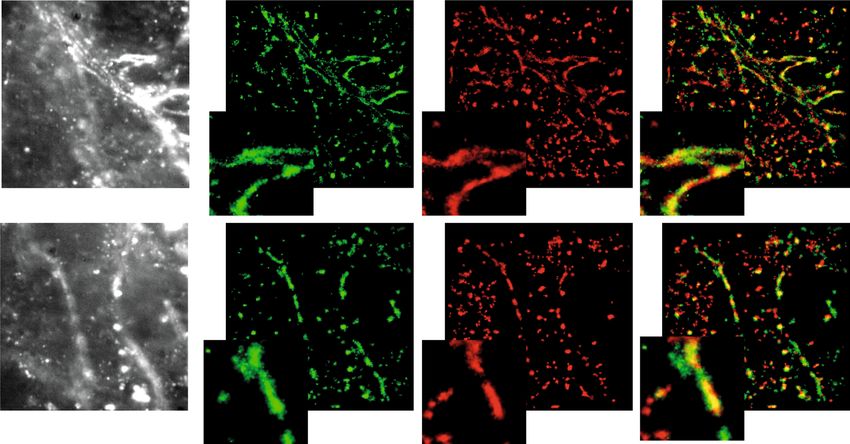
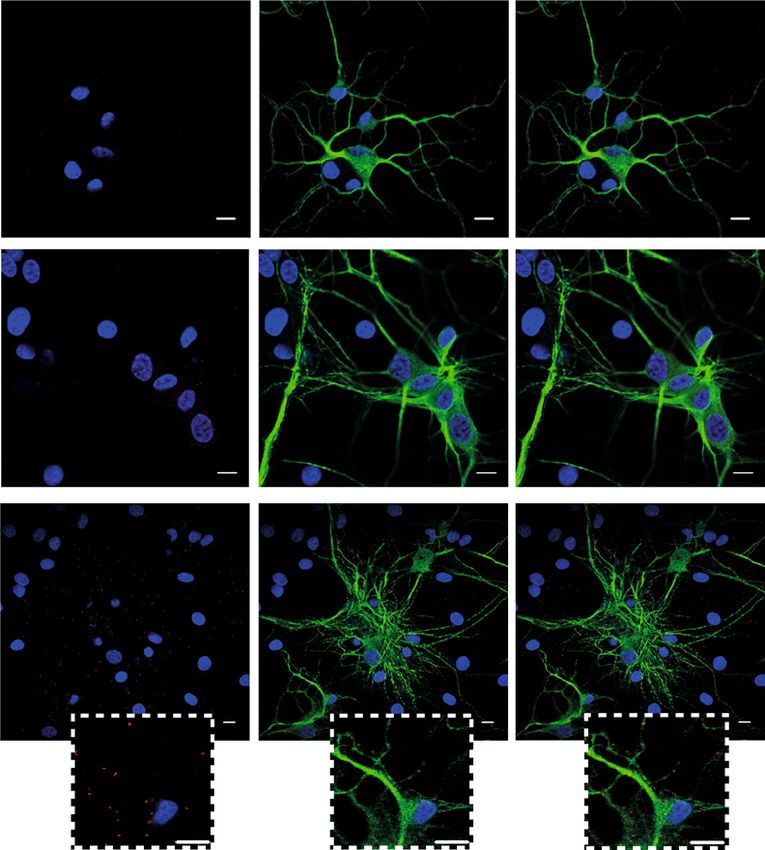
Fig. 3 Oligomers co-localise with ATP synthase. a Representative images of rat neuronal co-cultures treated with either monomers or oligomers over
7 days and probed with a filament specific antibody. The nucleus can be seen in blue (DAPI). b Representative immunocytochemistry images of rat
neuronal co-cultures treated with oligomers. The cells were probed for ATP synthase subunit-α and filament α-synuclein. The nucleus can be seen in blue
(DAPI). Scale bar = 10 μm. c Left: diffraction limited image of α-synuclein (scale bar = 5 µm). Right: super-resolved images of α-synuclein and ATP
synthase and merged imaged (scale bars are 500 nm). Schematic diagram of DNA-PAINT: The secondary antibody conjugated with a docking strand binds
the primary antibody. A fluorophore labelled complementary imaging DNA strand binds the docking strand on the secondary antibody allowing super-
resolution imaging. d Representative PLA images of cells treated with either monomers, oligomers or no synuclein probing for ATP synthase subunit α and
filament α-synuclein. Cultures were counterstained with the neuronal marker, MAP2. Scale bar = 10 μm. e Quantification of PLA signals per cell. N = 3
experiments. Oligomers: n = 182 cells; Monomers: n = 117; Control: n = 134 cells. f Representative PLA images of cells treated with oligomers probing for
ATP synthase subunit α and filament α-synuclein. TOMM20 was probed to validate the mitochondrial localisation of the PLA signal. Two-tailed Student’s t-
test for e. Scatter points represent number of puncta per cell. Data represented as mean ± SEM. ***p < 0.001
NATURE COMMUNICATIONS | (2018)9:2293 | DOI: 10.1038/s41467-018-04422-2 | www.nature.com/naturecommunications 7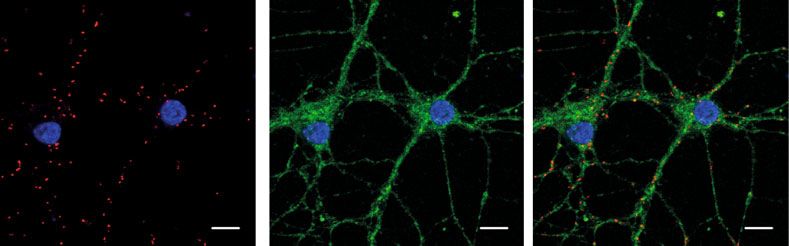
ARTICLE NATURE COMMUNICATIONS | DOI: 10.1038/s41467-018-04422-2
oligomers) alone induced a significant increase in cell death SNCA triplication iPSCs exhibit early PTP opening. In familial
compared to buffer control (p < 0.001; Fig. 4j, k). Co-incubation PD, there is a correlation between the number of SNCA alleles
with a PTP inhibitor (CsA) was able to reduce this cell death and severity of pathology22. To recapitulate the SNCA gene
significantly (p < 0.05). Interestingly, co-incubation with a dosage effect in human systems, we utilised two models: (1)
mitochondrial-located antioxidant (MitoQ) was also effective in transgenic Shef4 human embryonic stem (hES) cells engineered
preventing oligomers induced cell death. to overexpress (OE) two different levels of SNCA, on an isogenic
a Xanthine oxidase Monomers Oligomers
2.0 2.0 2.0
HEt (530/380)nm
Xanthine
HEt (530/380)nm
HEt (530/380)nm
1.6 1.6 1.6
1.2 1.2 1.2
0.8 0.8 0.8
Cell-free Cell-free Cell-free
0.4 0.4 0.4
0 2 4 6 8 0 2 4 6 8 0 2 4 6 8 10
Time (min) Time (min) Time (min)
b c Bodipy C11 Bodipy C11/Digitonin
*** 581 nm 591 nm 581 nm 591 nm
1600 Basal
production (%)
Rate of ROS
1200
800 *** TPMT n n Merge TPMT n n Merge
400
NS p p
a a
0 a a
Xanthine/ Monomers Oligomers
Xanthine oxidase
d 1.4 Oligomers e 1.5 Oligomers
f 1.2 Oligomers
Bodipy-C11 (581/591)nm
Bodipy-C11 (581/591)nm
Bodipy-C11 (581/591)nm
1.1
1.4
1.0
1.3
1.3 0.9
1.2 0.8
1.2
0.7
1.1
0.6
Neurons Astrocytes Neuronal mitochondria
1.1 1.0 0.5
0 2 4 6 8 10 12 14 0 2 4 6 8 10 12 14 0 2 4 6 8 10 12
Time (min) Time (min) Time (min)
g h i Basal
1.2 Oligomers 1.0 Oligomers 1800 ***
Bodipy-C11 (581/591)nm
Oligomers
Bodipy-C11 (581/591)nm
0.9 1600 *** ***
Lipid peroxidation %
1.1
1400
Astrocytic mitochondria
Neuronal mitochondria
0.8
1.0 1200 ***
0.7 ***
1000
Mixed processes
0.9
0.6 800
Astrocytes
0.8 600
0.5
Neurons
400
0.7 0.4
Astrocytic mitochondria 200
Mixed processes
0.6 0.3 0
0 2 4 6 8 10 12 0 2 4 6 8 10 12 14
Time (min) Time (min)
j k Buffer
Control Oligomers Oligomers+CsA Oligomers+MitoQ 40 Oligomers
35 *** CsA
30 CsA + Oligomers
Cell death (%)
MitoQ
25 MitoQ + Oligomers
20
15 ** **
10
5
0
8 NATURE COMMUNICATIONS | (2018)9:2293 | DOI: 10.1038/s41467-018-04422-2 | www.nature.com/naturecommunications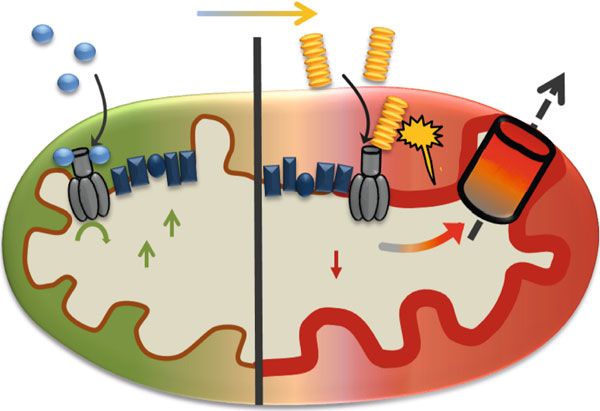
NATURE COMMUNICATIONS | DOI: 10.1038/s41467-018-04422-2                                                                                   ARTICLE

background (Supplementary Fig. 4A), and (2) inducible plur-                    the triplication neurons suggests that the aggregated forms of α-
ipotent stem cells (iPSCs) from a PD patient with a triplication in            synuclein within the cell lead to premature PTP opening. The
the SNCA locus, a control unaffected first-degree relative23 and an             PTP opening threshold in triplication neurons was further tested
isogenic control (Supplementary Fig. 5A, B). iPSC-derived cor-                 in response to laser-induced ROS. Administering a high laser
tical neurons from three disease, three control independent                    power induced earlier PTP opening in triplication lines compared
clones, and one isogenic control clone were generated using                    to control cells which could be delayed by preincubation of the
standard protocols, and experiments were performed on a                        neurons with CsA (p < 0.001; Fig. 6d, e; hESC α-syn OE,
minimum of three independent inductions. These protocols                       Supplementary Fig. 4F-H).
generated cultures that were 90% neuronal (as demonstrated by                     Vulnerability to cell death of the triplication neurons was
Tuj1 positive staining), and 70% of the neurons demonstrated                   assessed in the presence or absence of oligomers (Fig. 6f). Basal
glutamate-induced calcium responses (Supplementary Fig. 5A, B).                cell death was increased in triplication neurons compared to
   Immunocytochemistry using the conformation-specific fila-                     control and isogenic control neurons (Fig. 6g). Incubation with
ment α-synuclein antibody demonstrated a higher signal in the                  500 nM oligomeric (~5 nM oligomers) α-synuclein significantly
triplication neurons (Fig. 5a), suggesting higher levels of                    increased the basal death in controls (p < 0.05; Fig. 6g). Co-
endogenous aggregated α-synuclein in triplication neurons                      application of the PTP inhibitor CsA prevented the oligomer-
compared to control and isogenic control. PLA showed a                         induced toxicity and restored cell death levels back to basal.
significant increase in the number of fluorescent puncta in the                     In human SNCA triplication and ES α-synuclein OE neurons,
SNCA triplication neurons showing that endogenous aggregated                   high levels of endogenously aggregated α-synuclein lead to lower
α-synuclein in the iPSC-derived neuronal model interacts with                  ΔΨm, impaired mitochondrial respiration and a lower threshold
the ATP synthase (p < 0.001; Fig. 5b). Puncta could also be                    for PTP opening.
observed in control iPSC neurons potentially reflecting the
existence of low levels of physiological conformers of α-synuclein
in control neurons. The mitochondrial protein, TOMM20, was                     Discussion
used to validate the mitochondrial localisation of the PLA signal.             Studies in cell lines and transgenic mice have previously observed
   Δψm was assessed in hES and iPSC-derived neurons using                      mitochondrial pathology associated with synucleinopathy27–32.
TMRM. At days 70–90 post-differentiation, triplication neurons                 However, the nature of the toxic α-synuclein aggregate, and the
demonstrated reduced ΔΨm compared to control and isogenic                      mechanism by which it induces mitochondrial pathology remains
control cells (Fig. 5c, d; hESC α-syn OE, Supplementary Fig. 4B).              unresolved. Applying single-molecule methods (to select aggre-
Further, depolarisation upon application of oligomycin (complex                gates by their structure and size) to isolated mitochondria, pri-
V inhibitor) revealed that the ΔΨm in triplication neurons is                  mary rodent neurons, and human iPSC-derived neurons
maintained by the ATP synthase working in the reverse mode                     permitted a tractable mechanism of α-synuclein induced toxicity
(ATPase; Fig. 5e; hESC α-syn OE, Supplementary Fig. 4C).                       to be resolved. Our study identifies that α-synuclein oligomers
Interestingly, the NADH redox index, which was assessed in % by                induce mitochondrial dysfunction, ultimately leading to neuronal
maximal activation of NADH mitochondrial consumption by                        death by activating the mitochondrial PTP. The mitochondrial
FCCP (0%), and maximal inhibition of NADH consumption by                       PTP may therefore represent a convergence between protein
mitochondrial ETC inhibitor, sodium cyanide (100%) in triplica-                aggregation and neuronal mitochondrial dysfunction in PD.
tion neurons was significantly higher compared to control (p                       Super-resolution microscopy, and proximity ligation assays,
ARTICLE                                                                                              NATURE COMMUNICATIONS | DOI: 10.1038/s41467-018-04422-2

 Table 2 Oxidation of amino acids by treatment with α-synuclein

 Accession Description               Gene       ΣCoverage                                    Σ# Unique Peptides                 Σ# Modified AA                   #   MW
                                                                                                                                                                AAs [kDa]
                                                C        100      100   500   500            C    100     100    500    500     C 100     100    500     500
                                                         M        O     M     O                   M       O      M      O         M       O      M       O
 G3V6D3        ATP synthase          Atp5b      58.22    61.81    50.47 55.95 58.22          19   20      16     18     19      1 3       6      4       8      529    56.3
               subunit beta
 F1LP05/       ATP synthase          Atp5a1 36.89        41.95    39.78      37.79 39.42 14 14            14     12     13      2   3     0      2       3      553    59.8
 P15999        subunit alpha
 P04636        Malate                Mdh2      44.97 39.64 38.17             32.25   38.46 11     10      9      7      9       2   2     2      2       1      338    35.7
               dehydrogenase,
               mitochondrial
 Q66HF1        NADH-                 Ndufs1    33.98     29.16    32.74      31.91   20.77 17     15      15     15     9       1   0     0      1       0      727    79.4
               ubiquinone
               oxidoreductase
               75 kDa subunit,
               mitochondrial
 P10860        Glutamate             Glud1     25.27     31.18    32.44      23.12   27.96   10 11        11     8      10      0 0       1      1       0      558    61.4
               dehydrogenase
               1, mitochondrial

 C: untreated control; M: monomers; O: oligomers; 100: 100 nM; 500: 500 nM

mechanical swelling assay of isolated mitochondria, and (3)                                  oligomeric complexes are therefore able to oxidise their target
electrophysiological detection of a megachannel in mitoplasts,                               proteins in the inner mitochondrial membrane, and additionally
which together confirmed that oligomeric but not monomeric α-                                 induce lipid peroxidation of the mitochondrial membrane.
synuclein, can induce PTP. The molecular identity of PTP                                     Notably, free radical scavenger/antioxidant in isolated mito-
remains controversial. In early studies, proposed candidates have                            chondrial preparations (using Trolox) and whole cells (MitoQ),
included ANT, VDAC, phosphate carrier PiC, and misfolded                                     prevents the oligomer-induced PTP opening, presumably through
proteins36–40. More recent evidence suggests that the ATP syn-                               preventing oligomer-induced oxidation events. This supports the
thase components can be critically involved in the formation of                              conclusion that the oligomer induces the PTP via inducing oxi-
PTP channel either through reorganisation of C-subunit ring or                               dation of target proteins and mitochondrial lipids, while the
through dimerisation of ATP synthase complex, although an                                    monomer is unable to so.
essential role of ATP synthase in PTP formation has been ques-                                  This mechanism may be relevant in the human brain during
tioned41–47. In this study, we do not attempt to define the com-                              the course of PD. SNCA mutations, and in particular the SNCA
position of the PTP, especially in light of the debate in the                                triplication, lead to an early onset autosomal dominant form of
literature regarding this. However, our data suggests that the                               PD with dementia, associated with widespread α-synuclein
probability of PTP opening may be regulated by an interaction                                aggregation throughout the cortex and midbrain. Moreover,
between monomeric and oligomeric α-synuclein with ATP syn-                                   there is a correlation between the SNCA gene dosage (and α-
thase, and that oligomer-induced oxidation events increase                                   synuclein expression level) and disease severity. We utilised
the probability of PTP opening in disease. Understanding why                                 human neurons expressing different levels of endogenous α-
the ‘pathological’ oligomer specifically opens the PTP, while the                             synuclein on an isogenic background, and control and iPSC-
‘physiological’ monomer is unable to do so, is fundamental to                                derived neurons bearing a SNCA triplication, to model the effect
understanding how aggregation induces mitochondrial toxicity.                                of increased expression and aggregation of α-synuclein in disease.
   One major difference between monomer and oligomer lies in                                 Elevated endogenous expression of α-synuclein induces mito-
the enriched β-sheet, hydrophobic structure that enables the                                 chondrial dysfunction, characterised by impaired respiration and
oligomer to interact with the inner mitochondrial membrane and                               mitochondrial membrane depolarisation. Notably endogenous α-
form channels, which we have demonstrated occurs in isolated                                 synuclein aggregates in these models also interact with mito-
mitochondria preparations. The second major difference is the                                chondrial proteins, impair respiration, and induce early PTP
unique intrinsic property for oligomeric structures to generate                              opening and neuronal death. The neuronal death in these models
ROS independently of cellular enzymatic systems, a property that                             can be prevented by the use of PTP inhibitors, or by preventing
has been recognised for other aggregates of amyloidogenic pro-                               oligomer-induced oxidation events within the mitochondria.
teins48. Interestingly we have previously shown that, in its                                    Our data proposes the hypothesis that monomeric form of α-
unfolded state, the monomeric form of α-synuclein interacts with                             synuclein, under normal conditions, interacts with and enhances
ATP synthase. Here we utilise a conformation-specific antibody                                the efficiency of ATP synthase. During disease, aggregation of
combined with PLA and super-resolution microscopy to                                         monomeric α-synuclein is triggered, and this generates a series of
demonstrate that, in the oligomeric state, α-synuclein still comes                           intermediate oligomers with increasing enrichment of β sheet
into close proximity with ATP synthase. Whilst both mono-                                    structures. These structures are in close proximity to inner
mers10 and oligomers can interact with the ATP-synthase, they                                mitochondrial membrane proteins, and act to inhibit complex 1
exert different effects on the ATP synthase function: monomers                               function, and generate targeted oxidation events on interacting
improve the efficiency of ATP synthesis10. In contrast, one major                             proteins, and lipids. Aggregates of α-synuclein generate a pool of
consequence of oligomers when applied to isolated mitochondria                               bioenergetically compromised mitochondria under oxidative
is to induce oxidative modifications, specifically to the ATP                                  stress. Oligomer-induced oxidation events ultimately lead to
synthase β subunit, demonstrated by redox proteomics. The ATP                                opening of a megachannel, the mitochondrial permeability
synthase is known to be susceptible to oxidative/nitrosative                                 transition event (Fig. 7). Additionally, oligomers sensitise cells to
stress49. PTMs of specific residues of ATP synthase induced by                                known PTP triggers as they induce increased levels of ROS
ROS can affect both the catalytic activities of ATP synthase and                             production and calcium dysregulation, lowering the threshold for
potentially induce its PTP-forming activity31. Redox-active                                  PTP opening in response to other stimuli8,9,50. Aging is a major

10                               NATURE COMMUNICATIONS | (2018)9:2293                                  | DOI: 10.1038/s41467-018-04422-2 | www.nature.com/naturecommunications
NATURE COMMUNICATIONS | DOI: 10.1038/s41467-018-04422-2 ARTICLE
a b ATP synthase Ab
Filament ATP synthase Merge Filament Ab TOMM20 Ab Merge
Control
Control
Triplication
Isogenic
control
***
PLA signal per cell
15
Triplication
10
5
0
Control Triplication
c d 180 e 1800 Rotenone FCCP
Oligomycin
Control Triplication 160 ***
NS 1600
140 ***
1400
TMRM, AU
120
TMRM, %
100 1200
80
1000
60
40 800 Control
20 600 Triplication
0
Control Isogenic Triplication 0 1 2 3 4 5
control Time (min)
f 4000 NaCN 4000 NaCN
g
FCCP FCCP 100
3500
3500 80 ***
Redox index, %
3000
NADH, AU
NADH, AU
2500 3000 60
2000 2500 40
1500
2000 20
1000
Control Triplication
500 1500 0
0 20 40 60 80 100 120 140 0 20 40 60 80 100 120 140 160 180 Control Triplication
Time (s) Time (min)
Fig. 5 Impaired mitochondrial function in SNCA triplication iPS derived neurons. a Representative ICC images of control, isogenic control, and triplication
cells probed for filament α-synuclein. The nucleus can be seen in blue (DAPI). b Representative PLA images and quantification of control and triplication iPS
derived neurons showing a close proximity between filament α-synuclein and ATP synthase with the nucleus in blue (DAPI). TOMM20 was probed for to
validate the mitochondrial localisation of the PLA signal. N = 3 experiments; control n = 155 cells, and triplication n = 115 cells. c Representative images of
control and triplication iPS derived neurons loaded with TMRM and d ΔΨm quantification. N = 3 experiments, n ≥ 32 cells. e Representative traces of TMRM
fluorescence in control and SNCA triplication neurons after addition of oligomycin (2 μg/ml), rotenone (1 μM), and FCCP (1 μM). f Representative trace of
NADH in control and triplication iPS derived neurons. FCCP is applied to maximise respiration and therefore minimise the NADH pool and NaCN is added to
block the mitochondrial respiration and therefore maximise the NADH pool. g Quantification of the redox index in control (N = 3 experiments, n = 112 cells)
and triplication iPS derived neurons (N = 3 experiments, n = 148 cells). Two-tailed Student’s t-test for b, d, g. b Scatter points on scatter column represent
number of puncta per cell. d, g Scatter points represent individual cells/areas. Data represented as mean ± SEM. *p < 0.05; **p < 0.01; ***p < 0.001
factor in PD, and although difficult to recapitulate in vitro, it is work resolves how a change in the structure of a protein transi-
likely that age-related decline in bioenergetics, redox homeostasis, tioning to its oligomeric state, alters its functional consequence.
and mitochondrial calcium capacity, contribute to the aggregate Such insights are fundamental to understanding how the process
induced pathology to accelerate pathogenesis. Mitochondrial PTP of protein aggregation generates toxic oligomeric species that may
opening may therefore be a common pathway by which oligo- be directly pathogenic in neurodegenerative diseases.
meric α-synuclein induces cell death in human neurons. This
NATURE COMMUNICATIONS | (2018)9:2293 | DOI: 10.1038/s41467-018-04422-2 | www.nature.com/naturecommunications 11ARTICLE NATURE COMMUNICATIONS | DOI: 10.1038/s41467-018-04422-2
a b 1 5 10 15 20 25 30 µMFerutinin c
120
% cells with PTP opening
0 min 12 min 20 min 3000 ***
100
2500
80
TMRM, AU
Control
2000
60
1500
40
1000
Control 20
500
Triplication 0
0
0 2 4 6 8 10 12 14 16 18 20 Control Triplication
Time (min)
d High laser
e f Buffer Oligomers Oligomers/CsA
7 *** ***
1.0 6 NS
TMRM, normalised
Control
5
Time (min)
0.8 Triplication
Triplication + CsA 4
0.6
3
0.4 2
0.2 1
Isogenic
0
0.0
control
Control
Triplication
Triplication
0 1 2 3 4 5 6 7
+Csa
Time (min)
Triplication
g 80 Control Isogenic Triplication
NS
70
control
NS
*
60 *
Cell death (%)
*
50 * *
NS NS
40 *
NS
30
20
10
0
Buffer
Oligomers
Oligomers
Buffer
Oligomers
Oligomers
Buffer
Oligomers
Oligomers
+ CsA
+ CsA
+ CsA
Fig. 6 Lowered PTP opening threshold and increased cell death in SNCA triplication iPS derived neurons. a Representative images of mitochondria labelled
with TMRM before ferutinin was added (0 min), immediately before mPTP opening (12 min), and after mPTP opening (20 min). b Representative traces of
PTP opening in control and triplications in response to ferutinin. c Proportion of cells (%) that fully opened PTP in response to 25 μM ferutinin. N = 3
experiments, control n = 125 cells, and triplication n = 82 cells. d Representative traces of PTP opening in SNCA triplication neurons ± CsA in response to
high laser. e Quantification of the time until laser-induced PTP opening in control (N = 3 experiments; n = 77 areas), SNCA triplication neurons (N = 3
experiments; n = 82 areas), and SNCA triplication neurons + CsA (N = 3 experiments; n = 49 areas). f Representative images and g quantification of cell
death in control, isogenic control, and triplication neurons challenged with control buffer or oligomers ± CsA. N = 3 experiments, n ≥ 763 cells. g Scatter
points represent individual fields of view. Two-tailed Student’s t-test for c. One-way ANOVA with Bonferroni correction (e, g). Scatter points represent
sampled fields of view. Data represented as mean ± SEM. Scale bar = 10 μm. *p < 0.05; **p < 0.01; ***p < 0.001
Methods
Animals. Sprague–Dawley rat pups 1–3 days postpartum (University College Monomers Oligomers
Ca2+
London breeding colony) of either sex were used for neuronal co-cultures and Ca2+ Ca2+
experimental procedures were performed in full compliance with the United
Kingdom Animal (Scientific Procedures) Act of 1986. ROS
III
UQ II I
II III IV
PT PTP opening
ATP
se
IV I UQ ATP P
syntha synthase LP
WT rat neuronal co-cultures. Cultures of midbrain neurons and glial cells were Δψm
prepared from postnatal Sprague–Dawley pups (day 1–3; UCL breeding colony). ADP ATP
Δψm Ca2+
Midbrains were placed in ice-cold HBSS (Ca2+, Mg2+-free; Invitrogen). The tissue
LP
was minced, trypsinized (0.1% for 10 min at 37 °C), triturated and plated on poly- LP
D-lysine-coated coverslips. The cells were cultured in Neurobasal medium (Invi-
trogen) supplemented with B-27 (Invitrogen), 2 mM L-Glutamine and penicillin
(50 I.U./ml)/streptomycin (50 μg/ml). The cultures were maintained at 37 °C (5%
CO2) and the media changed twice a week. Cells were used at 12–15 days in vitro. Fig. 7 Schematic diagram of oligomeric α-synuclein effects on
Neurons were easily distinguishable from glia as they appeared brighter with mitochondria. Monomeric α-synuclein interacts with ATP synthase and
smooth rounded somata with distinct processes. Neurons lay just above the focal improves the efficiency of ATP synthesis. Oligomeric α-synuclein also
plane of the glial layer.
interacts with ATP synthase but conversely, impairs respiration, and
depolarises the mitochondria. Oligomers induce ROS production, leading to
iPSC-derived neurons. iPSC control lines SFC840-03-01, SFC840-03-03, and lipid peroxidation and oxidation of key mitochondrial proteins. Together,
SNCA triplication lines SFC831-03-01, SFC831-03-03, and SFC831-03-05 were
derived and characterised at the University of Oxford, James Martin Stem Cell these oligomer-induced events open the mitochondrial permeability
Facility, and control iPSC line SBAD04-01 was derived and characterised at the transition pore
University of Newcastle from Lonza fibroblasts CC-2511, Lot 264781, by the
StemBANCC consortium51,52. iPSC lines AST3 and AST8 were derived from a LDN (100 nM Abcam) in knockout DMEM (ThermoFisher), followed by
patient with a SNCA triplication, NAS6 and NAS7 were derived from an unaffected maturation in N2B27 medium (ThermoFisher) supplemented with BDNF and
first-degree relative23. iPSCs were cultured on matrigel in Essential 8 medium GDNF (20 ng/ml and 10 ng/ml, Peprotech)53. Cells were passaged using accutase
(ThermoFisher) and passaged using collagenase. Differentiation of cells into neu- after 11 days, and seeded onto plates coated with poly-l-ornithine, laminin and
rons was induced by dual SMAD inhibition using SB431542 (10 μM, Abcam) and fibronectin (Sigma). Cells were passaged approximately three more times before
12 NATURE COMMUNICATIONS | (2018)9:2293 | DOI: 10.1038/s41467-018-04422-2 | www.nature.com/naturecommunicationsYou can also read