Prefrontal Responses during Proactive and Reactive Inhibition Are Differentially Impacted by Stress in Anorexia and Bulimia Nervosa
←
→
Page content transcription
If your browser does not render page correctly, please read the page content below
The Journal of Neuroscience, May 19, 2021 • 41(20):4487–4499 • 4487

Behavioral/Cognitive

Prefrontal Responses during Proactive and Reactive
Inhibition Are Differentially Impacted by Stress in Anorexia
and Bulimia Nervosa
 Margaret L. Westwater,1,2 Flavia Mancini,3 Adam X. Gorka,2 Jane Shapleske,4 Jaco Serfontein,4
Christian Grillon,2 Monique Ernst,2 Hisham Ziauddeen,1,5p and Paul C. Fletcher1,5p
1
 Department of Psychiatry, Addenbrooke’s Hospital, University of Cambridge, Cambridge CB2 0SZ, United Kingdom, 2National Institute of Mental Health,
National Institutes of Health, Bethesda, Maryland 20892, 3Computational and Biological Learning Laboratory, Department of Engineering, University of
Cambridge, Cambridge CB2 1PZ, United Kingdom, 4Adult Eating Disorders Service, Cambridgeshire and Peterborough NHS Foundation Trust, Cambridge
CB21 5EF, United Kingdom, and 5Wellcome-MRC Institute of Metabolic Science, University of Cambridge, Cambridge CB2 0QQ, United Kingdom

Binge eating is a distressing, transdiagnostic eating disorder symptom associated with impulsivity, particularly in negative mood states.
Neuroimaging studies of bulimia nervosa (BN) report reduced activity in frontostriatal regions implicated in self-regulatory control, and
an influential theory posits that binge eating results from self-regulation failures under stress. However, there is no direct evidence that
psychological stress impairs self-regulation in binge-eating disorders, or that any such self-regulatory deficits generalize to binge eating in
underweight individuals (i.e., anorexia nervosa bingeing/purging subtype; AN-BP). We therefore determined the effect of acute stress on
inhibitory control in 85 women (BN, 33 women; AN-BP, 22 women; 30 control participants). Participants underwent repeated functional
MRI scanning during performance of the Stop-signal anticipation task, a validated measure of proactive (i.e., anticipation of stopping)
and reactive (outright stopping) inhibition. Neural and behavioral responses to induced stress and a control task were evaluated on 2
consecutive days. Women with BN had reduced proactive inhibition, while prefrontal responses were increased in both AN-BP and BN.
Reactive inhibition was neurally and behaviorally intact in both diagnostic groups. Both AN-BP and BN groups showed distinct stress-
induced changes in inferior and superior frontal activity during both proactive and reactive inhibition. However, task performance was
unaffected by stress. These results offer novel evidence of reduced proactive inhibition in BN, yet inhibitory control deficits did not gen-
eralize to AN-BP. Our findings identify intriguing alterations of stress responses and inhibitory function associated with binge eating,
but they counsel against stress-induced failures of inhibitory control as a comprehensive explanation for loss-of-control eating.

     Significance Statement
     Binge eating is a common psychiatric syndrome that feels uncontrollable to the sufferer. Theoretically, it has been related to
     reduced self-regulation under stress, but there remains no direct evidence for this link in binge-eating disorders. Here, we examined
     how experimentally induced stress affected response inhibition in control participants and women with anorexia nervosa and buli-
     mia nervosa. Participants underwent repeated brain scanning under stressful and neutral conditions. Although patient groups had
     intact action cancellation, the slowing of motor responses was impaired in bulimia nervosa, even when the likelihood of having to
     stop increased. Stress altered brain responses for both forms of inhibition in both groups, yet performance remained unimpaired.
     These findings counsel against a simple model of stress-induced disinhibition as an adequate explanation for binge eating.

Received Nov. 10, 2020; revised Jan. 23, 2021; accepted Mar. 2, 2021.
                                                                                                                 staff for the study. We also thank the participants for time and dedication to this project; the nursing staff
   Author contributions: M.L.W., F.M., J. Shapleske, J. Serfontein, H.Z., and P.C.F. designed research; M.L.W.
                                                                                                                 and radiographers for assisting the study protocol; and Dr. Bram Zandbelt for sharing the Stop-signal
and H.Z. performed research; M.L.W., F.M., A.X.G., C.G., M.E., and P.C.F. contributed unpublished reagents/
                                                                                                                 anticipation task code. In addition, we thank the Beat Eating Disorders charity for advertising the study.
analytic tools; M.L.W. analyzed data; M.L.W. wrote the paper.                                                       p
                                                                                                                      H.Z. and P.C.F. jointly supervised this research.
   Funding was provided by the Bernard Wolfe Health Neuroscience Fund to P.C.F. and H.Z. and a Wellcome
                                                                                                                    The authors declare no competing financial interests.
Trust Investigator Award to P.C.F. (Reference No. 206368/Z/17/Z). M.L.W. was supported through the National
Institutes of Health-Oxford-Cambridge Scholars Program and a Cambridge Trust fellowship. F.M. was                   Correspondence should be addressed to Margaret L. Westwater at mw658@cam.ac.uk.
supported by research grants from Versus Arthritis, the Experimental Psychological Society, and a Career            https://doi.org/10.1523/JNEUROSCI.2853-20.2021
Development Award from the Medical Research Council (MR/T010614/1). A.X.G., C.G., and M.E. were                  Copyright © 2021 Westwater et al.
supported by the Intramural Research Program of the National Institute of Mental Health (reference                  This is an open-access article distributed under the terms of the Creative Commons Attribution 4.0
#ZIAMH002798). We thank the Wellcome Trust/National Institute for Health Research Clinical and                   International license, which permits unrestricted use, distribution and reproduction in any medium provided
Translational Research Facilities, and the Wolfson Brain Imaging Center for providing equipment and support      that the original work is properly attributed.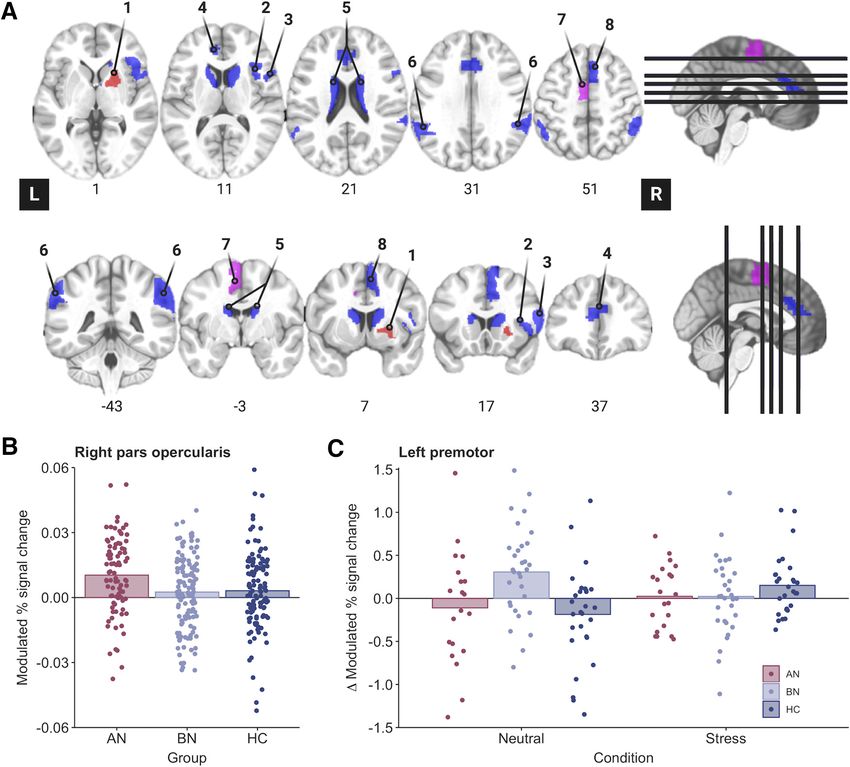
4488 • J. Neurosci., May 19, 2021 • 41(20):4487–4499                                                Westwater et al. · Stress and Inhibition in Anorexia and Bulimia

Introduction                                                           precuneus, ACC, and dlPFC responses to palatable food cues in
Anorexia nervosa (AN) and bulimia nervosa (BN) are eating dis-         BN moderated the association between stress and binge eating in
orders (EDs) that share cardinal symptoms, including recurrent         daily life (Fischer et al., 2017).
binge eating and compensatory behaviors (e.g., vomiting). Binge            Here, we investigated the effect of acute stress on two key in-
eating occurs in both BN and the binge eating and purging sub-         hibitory modes in women with AN-BP and BN, and in unaf-
type of AN (AN-BP; American Psychiatric Association, 2013a),           fected control participants. Participants attended a 2 d inpatient
and it engenders substantial distress and impairment (Udo and          study session, which included repeated fMRI scanning under
Grilo, 2018). Although binge eating has been related to aberrant       neutral and stressful conditions. Patient groups were expected to
reward and self-regulatory processing (Schienle et al., 2009;          have reduced reactive inhibition and inferior frontostriatal activ-
Frank et al., 2011; Berner and Marsh, 2014), its pathophysiologi-      ity at baseline, which would be exacerbated by acute stress. We
cal correlates remain poorly characterized.                            predicted baseline proactive inhibition to be reduced in BN but
    An influential model posits that binge eating emerges follow-      augmented in AN-BP compared with control participants, align-
ing negative affective states, which reduce an individual’s            ing with restrictive AN (AN-R; Bartholdy et al., 2017). However,
capacity for self-control, thereby leading to loss-of-control eating   both groups were expected to show stress-induced proactive in-
(Heatherton and Baumeister, 1991). While elevated trait impul-         hibition impairments and correspondingly altered frontoparietal
sivity in BN (Fischer et al., 2008) and AN-BP (Hoffman et al.,         activity. Finally, exploratory analyses related inhibitory control
2012) lends support to this model, experimental studies of self-       measures to laboratory-based eating behavior.
regulation are more equivocal because of inconsistencies across
neural and behavioral findings (Lock et al., 2011). For example,       Materials and Methods
fMRI studies of adolescent (Marsh et al., 2011) and adult (Marsh       Participants
et al., 2009; Skunde et al., 2016) BN report reduced frontostriatal    We recruited 85 women (mean 6 SD age, 23.96 6 3.98 years) through
activity during conflict and action inhibition trials on Simon         posted advertisements, the Beat Eating Disorders charity, and an adult
Spatial and Go/NoGo tasks, respectively, yet behavioral impair-        ED service in Cambridgeshire. Eligible volunteers were age 18–40 years,
                                                                       English speaking, had normal or corrected-to-normal vision, and, for
ments were observed only on the Simon Spatial task in adult
                                                                       patient groups, met DSM-5 (Diagnostic and Statistical Manual of Mental
patients with BN. Altered brain activity without behavioral            Disorders, fifth edition) diagnostic criteria for either AN-BP or BN.
impairment could indicate either inefficient or compensatory           Healthy control subjects with a lifetime psychiatric disorder were ineli-
neural responses to preserve task performance. Interestingly, de-      gible. Patient volunteers with binge-eating disorder, neurodevelopmental
spite unaffected Stop-signal performance, augmented medial             disorders, lifetime serious mental illness (e.g., bipolar or psychotic disor-
prefrontal and anterior cingulate cortex (ACC) activity on failed      ders), and/or substance or alcohol use disorders (SUDs) in the past
Stop-signal trials has predicted the subsequent onset of ED            6 months were excluded. For all groups, exclusion criteria included the
behaviors (Bartholdy et al., 2019).                                    following: left handedness; estimated IQ , 80; body mass index (BMI)
    Inconsistencies across levels of analysis and cognitive tasks      . 29.9 kg/m2; MRI contraindications (e.g., pregnancy, some metallic
could partly reflect heterogeneity within the theoretical construct    implants); metabolic, neurological, or cardiovascular diseases (e.g., ane-
                                                                       mia); lactation, bariatric surgery; and high nicotine dependence, as per
of “self-control.” Behavioral and neurobiological data support
                                                                       the Fagerström Test for Nicotine Dependence (FTND; Heatherton et al.,
related but dissociable forms of impulsivity, including temporal       1991). While not an exclusion criterion for the study, all participants
impulsivity and response inhibition, or “inhibitory control,”          who were prescribed psychotropic medication reported taking a stable
which is the capacity to slow or stop a response tendency (Dalley      dose for at least 2 weeks before participation, aligning with the recom-
et al., 2011). As binge-eating episodes are characterized by a         mendations of Frank et al. (2018). The study was approved by the
sense that one cannot stop eating (i.e., an ongoing behavior), in-     Cambridge East Research Ethics Committee (reference 17/EE/0304),
hibitory control tasks perhaps best model this behavior.               and all participants provided signed informed consent.
Theoretical frameworks suggest that inhibitory control is modu-             Participants were matched on age, IQ and, for BN and HC groups, BMI
lated by proactive (i.e., goal-directed preparation of stopping)       (t(61) = 0.19, p = 0.85; Table 1). Moreover, rates of binge eating and purging, cur-
and reactive (stimulus-driven action cancellation) processes           rent treatment, comorbid psychopathology, and medication use (Extended
(Aron, 2011), which have both shared and unique neural corre-          Data Table 1-1) did not differ significantly between patient groups. All AN-BP
lates. Bilateral frontoparietal and basal ganglia regions form a       participants reported recurrent objective binge eating, and the majority (n = 19)
broad inhibitory control network that subserves both processes,        endorsed purging behaviors.
but bilateral superior parietal and right-dominant, frontal, tem-      Study design
poral, and parietal regions have been uniquely related to proac-       Participants underwent the same study procedure, as described
tive and reactive inhibition, respectively (Zandbelt et al., 2013;     previously (Westwater et al., 2020; Fig. 1A). Briefly, potential volunteers
van Belle et al., 2014). Therefore, distinctions between proactive     completed a telephone screening and self-report questionnaire of psy-
and reactive inhibition should be considered when interrogating        chopathology symptoms (American Psychiatric Association, 2013b)
self-regulatory impairments associated with binge EDs.                 before attending an outpatient screening session at Addenbrooke’s
    Finally, efforts to validate the model must consider the impact    Hospital (Cambridge, UK). One hundred eligible volunteers completed
of mood states on self-regulatory control. Although momentary          the outpatient screening session, where they provided informed consent
stress precedes binge eating and purging in BN (Berg et al., 2013)     and a fasting blood sample for the assessment of full blood count and
and AN (Culbert et al., 2016), it is unknown whether inhibitory        thyroid hormones. Then, participants’ height, weight, and body compo-
                                                                       sition (via dual-energy X-ray absorptiometry) were measured before a
control mediates this association. Acute stress increases palatable
                                                                       clinical assessment, in which the Eating Disorder Examination (version
food preference among male dieters, which co-occurs with
                                                                       16; (Cooper and Fairburn, 1987) and Structured Clinical Interview for
augmented fronto-limbic-striatal functional connectivity and           DSM-5 (First et al., 2015) were administered to determine ED diagnoses
reduced connectivity between the ventromedial and dorsolateral         and comorbid psychopathology, respectively. Participants also com-
prefrontal cortex (dlPFC; Maier et al., 2015). Thus, stress may        pleted the National Adult Reading Test (Blair and Spreen, 1989) to
impair goal-directed prefrontal control, instead evoking habitual      determine their estimated IQ, and the FTND was used to assess nicotine
responding to food. Indeed, stress-induced decreases in bilateral      dependence. To reduce participant burden, patient participants who
Westwater et al. · Stress and Inhibition in Anorexia and Bulimia J. Neurosci., May 19, 2021 • 41(20):4487–4499 • 4489
Table 1. Clinical and demographic information
AN (n = 22) BN (n = 33) HC (n = 30) Analysis
Characteristics Mean SD Mean SD Mean SD X2(df), F(df), W, t(df) p Value
2
Age (years) 24.6 4.7 23.6 3.9 23.9 3.5 X (2) = 0.8 0.69
BMI (kg/m2) 16.4 1.4 22.0 2.4 21.9 2.1 X2(2) = 48.4 ,0.001
IQa 116 5 114 5 114 5 X2(2) = 3.2 0.21
Age of onset (years) 15.6 2.4 16.2 3.1 t(51.8) = 0.8 0.42
Illness duration (years) 9.0 5.8 7.4 4.0 t(34.4) = 1.1 0.27
Beck Depression Inventory 35.3 12.0 32.7 10.5 2.4 2.8 X2(2) = 57.7 ,0.001
Trait Anxiety Inventory 63.1 10.4 62.8 7.3 33.0 6.9 F(2) = 151.1 ,0.001
Barratt Impulsiveness Scale 66.2 14.0 68.4 11.1 56.7 6.3 F(2) = 10.4 ,0.001
Eating Disorder Examination Questionnaire 4.4 0.8 4.6 0.8 0.2 0.2 X2(2) = 58.0 ,0.001
Eating disorder examination ratingsb
Objective binge-eating episodes 38.1 47.9 23.0 29.1 W = 317.5 0.43
Subjective binge-eating episodes 9.5 12.8 6.6 6.2 W = 341.5 0.93
Vomiting episodes 43.5 51.6 24.2 31.0 W = 304.0 0.31
Laxative episodes 1.1 3.4 2.0 3.9 W = 421.5 0.18
Exercise episodes 7.4 13.6 10.9 9.4 W = 478.5 0.04
N % N % N % X2(df) p Value
Comorbid diagnoses
Anxiety disorder 3 13.6 3 9.1 X2(1) = 0.3 0.69
Major depressive episode 15 68.2 16 48.5 X2(1) = 2.1 0.15
Personality disorder 2 9.1 5 15.2 X2(1) = 0.4 0.69
Any current treatment 13 59.0 15 45.5 X2(1) = 1.0 0.32
Psychotherapy 9 40.9 9 27.3 X2(1) = 1.1 0.29
Medication 10 45.5 10 30.3 X2(1) = 1.3 0.25
Prior restrictive AN 14 63.6 10 30.3 X2(1) = 6.0 0.01
Group differences were evaluated using one-way ANOVA and, for non-normally distributed data, the nonparametric Kruskal–Wallis test. The two-samples t test (two-sided), Mann–Whitney U test, and x 2 test were used to
assess differences between AN and BN groups. For type and dose of prescribed medications, see Extended data Table 1-1.
a
Estimated full-scale IQ from the National Adult Reading Test.
b
ED examination ratings reflect counts over the previous 28 d.
lived outside of Cambridgeshire (n = 12) completed the screening session As described previously (Zandbelt and Vink, 2010) and in Figure 1C,
remotely. Participants who underwent remote screening completed all a background of three horizontal lines was present throughout the task.
blood sampling and anthropometric measurements during the overnight On each trial, a bar moved at a constant speed from the bottom line,
study session. reaching the top line in 1000 ms. The main task (i.e., Go-signal trials)
Eighty-five women (AN-BP, n = 22 women; BN, n = 33 women; HC, involved stopping the moving bar as it reached the middle line by press-
n = 30 women) were eligible for the 2 d overnight study session. Study ing a button with one’s right index finger, yielding a target response time
sessions began at either 8:00 A.M. or 9:00 A.M., and participants’ height (RT) of 800 ms. On a minority of trials, Stop-signals were presented
and weight were measured before a standardized breakfast and a cogni- where the moving bar stopped automatically before reaching the middle
tive testing battery. Following a mid-morning snack, participants began line. Participants were instructed to withhold their response in the event
a 6 h fast. A cannula was placed ;1 h before MRI scanning on day 1, of a Stop-signal. The probability of a Stop-signal occurring on a given
and blood samples for cortisol and gut hormones were acquired at fixed trial ranged from 0% to 33% and was indicated by the color of the mid-
timepoints (Westwater et al., 2020). Participants began MRI scanning dle line (green, 0%; yellow, 17%; amber, 20%; orange, 25%; red, 33%).
between 1:30 P.M. and 2:30 P.M. to control for diurnal fluctuations in The initial Stop-signal onset time was set to 500 ms (i.e., 300 ms
cortisol. While scanning, participants performed the Stop-signal antici- before the target response time) for each Stop-signal probability level.
pation task (SSAT; Zandbelt and Vink, 2010) twice, immediately prema- Throughout the task, the Stop-signal onset time was adjusted using a
nipulation and postmanipulation, and manipulation order (stress vs staircase procedure (with steps of 25 ms) depending on stopping accu-
neutral) was counterbalanced across participants. Then, participants had racy, ensuring approximately equal numbers of successful and failed
an unsupervised ad libitum meal, and those who did not meet their esti- Stop-signal trials.
mated energy requirements were offered an evening snack. This free- Trials were presented in either baseline or experimental “blocks” that
choice meal simulated naturalistic circumstances under which partici- were composed of 12–15 trials each. The interstimulus interval was
pants who suffer with binge eating would experience urges to binge, 1000 ms. During baseline blocks, participants responded to trials in
where stress-induced increases in consumption would lend support to which the Stop-signal probability was 0%, as indicated by the green
theoretical models of binge eating (Heatherton and Baumeister, 1991). Stop-signal probability cue. Experimental blocks were composed of Go-
The study protocol was identical on day 2, and participants were dis- signal trials with a Stop-signal probability .0% (i.e., nongreen cues) and
Stop-signal trials (also nongreen cues). Stop-signal trials occurred pseu-
charged following the meal.
dorandomly throughout experimental blocks, and the Stop-signal proba-
bility level varied across trials. Distinct trial orders were used for
Stop-signal anticipation task preinduction and postinduction runs to account for practice effects
The SSAT measures both proactive and reactive inhibition. “Proactive within each day, where the trial orders were the same across participants
inhibition” describes a goal-directed process, elicited by predictive cues, and scan sessions. Simulations to determine the optimal trial order indi-
which restrains actions in preparation for stopping. In contrast, “reactive cated that correlations between the different model regressors were suffi-
inhibition” is a stimulus-driven process, where a salient signal triggers ciently weak to generate parameter estimates.
action cancellation. Task stimuli were presented using Presentation soft- In total, the SSAT included 474 trials: 234 Go-signal trials with a
ware (version 20; Neurobehavioral Systems), and code may be retrieved Stop-signal probability of 0%, 180 Go-signal trials with a Stop-signal
from https://github.com/bramzandbelt/SSAT. probability .0% (30 yellow, 48 amber, 54 orange, 48 red), and 60 Stop-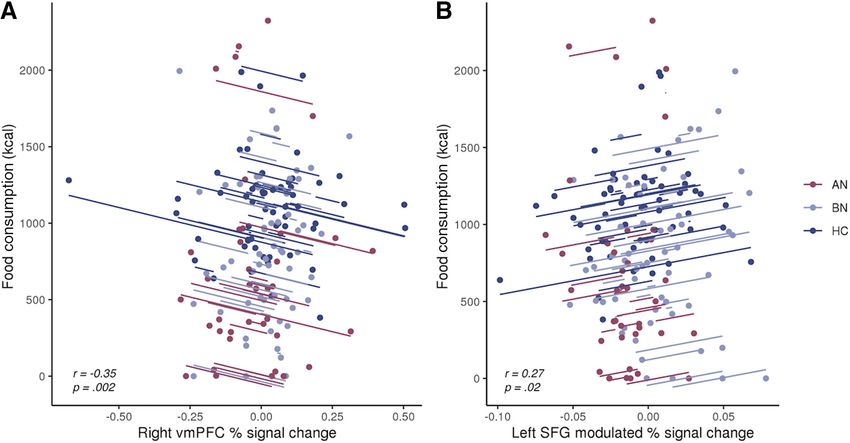
4490 • J. Neurosci., May 19, 2021 • 41(20):4487–4499                                                                                  Westwater et al. · Stress and Inhibition in Anorexia and Bulimia

Figure 1. Overview of study design and Stop-signal anticipation task. A, Diagram of inpatient study protocol with representative timeline. Participants were randomized to either a stress
induction or control task on each day, which was completed in the MR scanner. Created with BioRender.com. See Extended Data Figure 1-1 for plasma cortisol responses (percentage change
from baseline) to the stress and control tasks. B, Participant ratings of subjective stress and electrical stimulation. The stress manipulation induced a significantly greater change in subjective
stress compared with the neutral task. Participants rated the electrical stimulation as more painful, intense, and unpleasant following stress as compared with the control task, where stimula-
tion was intended to be detectable but not unpleasant (Westwater et al., 2020). Ratings did not differ significantly by group (all p values .0.05). Error bars indicate the SEM. C, Schematic of
SSAT trial types adapted from Zandbelt and Vink (2010). Left, On Go-signal trials, participants were instructed to respond when a moving bar reached the middle line. The target response time
was 800 ms on each 1000 ms trial (1000 ms intertrial interval). Middle, A minority of trials (25%) were Stop-signal trials, where the moving bar stopped automatically before reaching the mid-
dle line. Participants were instructed to withhold their response in the event of a Stop-signal. Right, To index proactive inhibition, the probability of a Stop-signal occurring on a given trial
ranged from 0% to 33%, as indicated by colored cues. Participants were told that Stop-signals would never occur on green (baseline) trials, but the likelihood of a Stop-signal occurring
increased across yellow to red trials.

signal trials (6 yellow, 12 amber, 18 orange, 24 red). In other words, the                          task (i.e., neutral condition) on each day. In each condition, participants
proportion of Stop-signal trials was 25%. Two 24 s rest blocks were pre-                            solved multiple-choice, mental math problems of varying difficulty while
sented after one-third and two-thirds of the trials had elapsed. The task                           in the MR scanner; however, participants were motivated to respond
duration was 16 min 36 s. Participants completed a behavioral practice                              accurately in the stress induction, whereas performance was not eval-
session before fMRI scanning on day 1, in which they were trained on the                            uated during the control task. Moreover, incorrect responses elicited
Go and Stop tasks. Participants were notified that it was equally important                         negative feedback (e.g., “Your performance is below average.”) in the
to stop the moving bar at the target and to withhold their response in the                          stress task, and uncontrollability, a central aspect of psychological stress,
presence of a Stop-signal. We informed participants that Stop-signals                               was engendered through the delivery of mild electrical stimulation to the
would never occur on trials with green cues, and the likelihood of a Stop-                          abdomen at variable frequencies and intensities. Importantly, subjective
signal occurring was lowest on “yellow” cue trials and highest on “red”                             ratings of stimulation intensity, unpleasantness, and pain did not differ
cue trials, increasing as the cue color transitioned to red. On day 2, partici-                     significantly across groups, indicating that abdominal stimulation was
pants were reminded of the task instructions before scanning.                                       suitable for ED participants (Fig. 1B). Subjective stress ratings were col-
                                                                                                    lected immediately preinduction and postinduction, and these served to
Stress induction                                                                                    validate the stress manipulation. As psychological stress is inherently
To enable within-subject assessment of stress responses, participants                               grounded in one’s subjective experience of the stressor, self-report rat-
completed either an acute, psychological stress induction or a control                              ings were viewed as the primary index of stress rather than physiological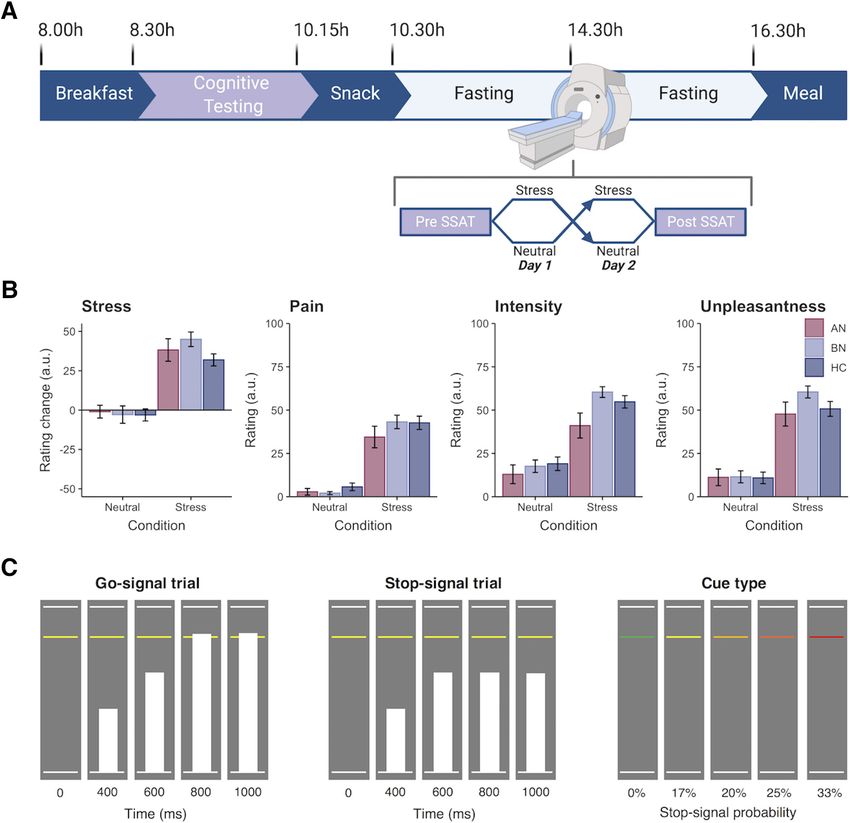
Westwater et al. · Stress and Inhibition in Anorexia and Bulimia J. Neurosci., May 19, 2021 • 41(20):4487–4499 • 4491
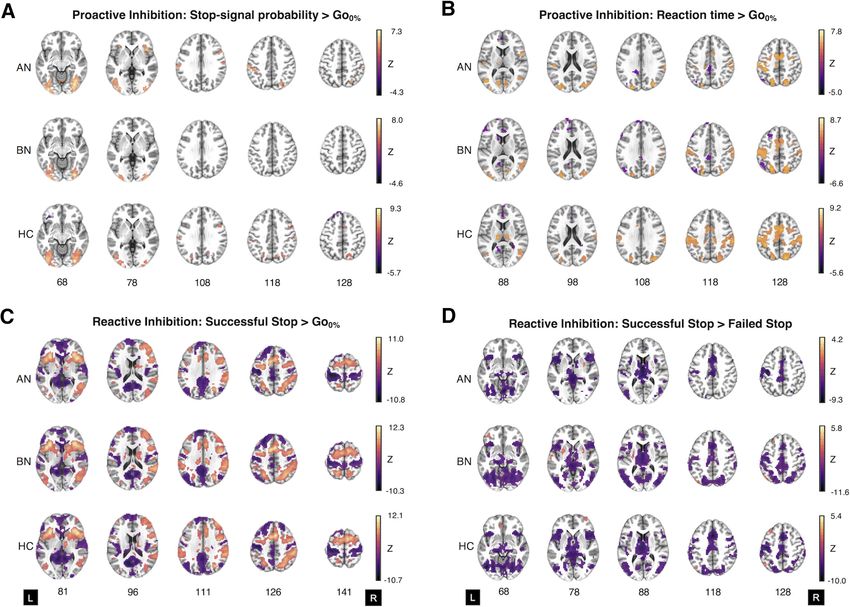
Figure 2. Region of interest analyses identify altered inferior frontal and premotor activity during proactive inhibition in anorexia and bulimia nervosa. A, ROI analyses were conducted in
eight regions that have previously been associated with proactive and reactive inhibition (Zandbelt et al., 2011; van Belle et al., 2014), as follows: right putamen (1), right opercular inferior
frontal gyrus (2), right ventral inferior frontal gyrus (3), bilateral pregenual anterior cingulate cortex (4), bilateral caudate (5), bilateral superior parietal cortices (6), left premotor cortex (7),
and right pre-supplementary motor cortex (8). Blue regions were used in the analysis of both proactive and reactive inhibition, whereas pink and red regions were unique to proactive and reac-
tive analyses, respectively. ROIs are displayed in neurological orientation (L, left). B, The parametric effect of Stop-signal probability was related to increased right inferior frontal gyrus (pars
opercularis) activity in the AN-BP group relative to control participants (p = 0.005). C, A three-way interaction indicated that the parametric effect of reaction time was related to decreased left
premotor activity in the BN group compared with control participants following the stress induction (p , 0.001).
correlates, which vary substantially across sexes (e.g., cortisol) and control task, stimulation was delivered at predictable intervals and a con-
remain poorly characterized in women (Kajantie and Phillips, 2006; Ali stant intensity, corresponding to the participant’s detection threshold.
et al., 2020). Details of the task structure have been described previously Trains consisting of five pulses were delivered at an interpulse interval of
(Westwater et al., 2020) and are summarized in the following sections. 0.55 s with an intertrain interval of 2 s. Shock delivery was not contin-
Electrical stimulation. Throughout each task, “physical distractors” gent on performance. We instructed participants to verbally communi-
were delivered to the abdomen in the form of mild electrical stimulation, cate if the stimulation became painful at any time, in which case it would
using a DS7A constant current stimulator (Digitimer). Before MRI scan- be reduced. No participants reported discomfort during the tasks, and
ning, the intensity of electrical stimulation was calibrated for each partic- subjective ratings of the stimulation were acquired immediately follow-
ipant to account for interindividual variability in shock tolerance. Two ing the task.
radio-translucent electrodes (model EL509, BIOPAC Systems) were Mental arithmetic control and stress task. Math task stimuli were
filled with isotonic paste (model GEL101, BIOPAC Systems) and posi- presented in MATLAB, using Psychophysics Toolbox (version 3;
tioned to the right of the subject’s navel, between dermatomes T10 and Brainard, 1997), and code is available at https://github.com/mwestwater/
T12. During the calibration procedure, participants indicated (1) when STRIvE-ED. On each day, participants completed 25 practice problems
the stimulation was detectable but not uncomfortable, corresponding to of variable difficulty, and they were instructed to try their best to select
pain ratings of 0–2; and (2) when the stimulation first became uncom- the correct answer without taking too much time. Stimuli were pre-
fortable but not painful (pain ratings of 5–7; 0, no pain; 10, very painful). sented for a maximum of 30 s, and participants had to respond by select-
Each shock pulse lasted 500 ms. ing one of the three choices. Feedback was presented for 2500 ms either
For the stress induction, shocks were delivered in 5–20 pulse sequen- 500 ms after the response or after the 30 s period elapsed. The next trial
ces with an interpulse interval range of 0.1–1 s and an intertrain interval was presented following a variable interval (500–2500 ms; jitter, 100 ms).
range of 0.1–3.9 s, which were randomly sampled in MATLAB (version Both the stress induction and control task included 48 multiple-
2017b; MathWorks). Shock intensity was manually adjusted between the choice mental arithmetic problems, which were matched on difficulty.
participant’s two threshold values throughout the induction. For the Before the stress induction, participants were encouraged to respond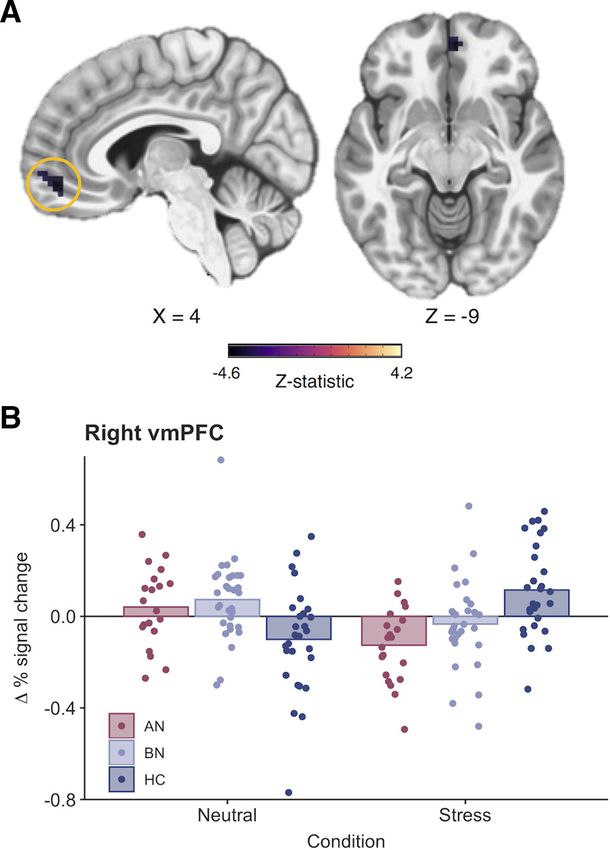
4492 • J. Neurosci., May 19, 2021 • 41(20):4487–4499                                                                 Westwater et al. · Stress and Inhibition in Anorexia and Bulimia

accurately, and they were informed that only data from participants             Table 2. SSAT Performance metrics by group and condition
whose performance met the average group accuracy could be used in the                                     Neutral                                  Stress
study. Additionally, they were told that physical distractors would be
delivered to their abdomen, and that they would be monitored on a live                                 Pre           Post          Pre           Post
video feed to check that they were paying attention to the task.                Measure          Group Mean 6 95% CI Mean 6 95% CI Mean 6 95% CI Mean 6 95% CI
Conversely, before the control task, participants were told that their per-
                                                                                SSRT (ms)   AN              273 6 5             269 6 7              278 6 5             268 6 5
formance would not be evaluated and that they would not be watched.
                                                                                            BN              271 6 5             268 6 5              270 6 5             270 6 5
Both tasks had the same trial structure as the practice task; however, for
                                                                                            HC              270 6 6             268 6 4              271 6 5             267 6 4
the stress induction, the initial stimulus presentation and response time
                                                                                Go Trial 0% AN            814.4 6 1.1         808.7 6 1.1          818.5 6 1.2          813.2 6 1.1
(30 s in the practice task) was set to 10% less than the participant’s aver-
age response time on the practice task. Accurate responses on three con-        (ms)        BN            820.7 6 1.0         815.0 6 0.9          821.0 6 1.0          816.7 6 0.9
secutive trials shortened the maximal response window by 10% to                             HC            823.6 6 1.1         817.7 6 1.0          818.9 6 1.1          814.4 6 1.0
ensure low performance. As the sliding response window reduced the
overall task duration, the intertrial interval was set to 6 s on every sixth                              Mean (SD)           Mean (SD)            Mean (SD)            Mean (SD)
trial to ensure that the task was sufficiently long for the stress induction    Stop accuracy AN          58.7 (4.1)          57.7 (4.7)           58.6 (4.2)           58.8 (3.7)
to be effective. Participants received negative feedback to nonresponses        (%)           BN          60.2 (5.2)          59.3 (6.0)           60.1 (5.2)           58.6 (4.2)
and incorrect responses, whereas no feedback was provided for correct                         HC          59.5 (4.7)          59.1 (5.4)           57.5 (5.1)           57.7 (4.7)
responses. At the end of the task, participants were informed that their        Accuracy      AN          98.3 (3.8)          99.1 (0.9)           98.0 (1.9)           99.2 (0.9)
performance did not meet the group average. For the control task, the           (%)           BN          98.7 (1.3)          98.9 (1.9)           97.4 (5.7)           99.4 (0.7)
stimulus presentation and response time was 30 s on each trial, and feed-                     HC          98.0 (3.3)          99.3 (0.9)           98.4 (1.7)           99.3 (0.9)
back was only provided to indicate correct responses.                           “Accuracy” represents the percentage of Go-signal trials on which participants made a response.

Image acquisition
MR scanning was completed at the Wolfson Brain Imaging Center at
Addenbrooke’s Hospital on a 3 T Siemens SkyraFit scanner, fitted with a         Functional NeuroImages) software (Cox, 1996). For each subject, ana-
32-channel, GRAPPA (generalized autocalibrating partial parallel acqui-         tomic scans were coregistered with a linear transformation (AFNI pro-
sition) parallel-imaging head coil. On each day, 1.0 mm isotropic T1-           gram 3dAllineate) and averaged across days via 3dMean. The averaged
weighted structural images were acquired (TE = 2.95 ms; TR = 2300 ms;           structural image was then processed with the standard FreeSurfer recon-
flip angle = 9°; acquisition matrix = 256  256 mm). Echoplanar images          all pipeline. The resulting white matter and ventricle segmentations were
were acquired across 30 interleaved slices with the following parameters:       resampled to 3 mm isotropic resolution and eroded by 1 voxel along
TR = 1600 ms; TE = 23 ms; flip angle = 78°; acquisition matrix = 64  64;       each axis. The remaining preprocessing steps were completed with the
3.0 mm isotropic voxels; 631 volumes. One participant was excluded for          afni_proc.py python script, in which functional images were slice time
an incidental finding of white matter abnormalities, and this participant       corrected, realigned to the minimum outlier functional volume, coregis-
was followed up clinically.                                                     tered to the subject’s skull-stripped averaged anatomical image, nonli-
                                                                                nearly warped to the MNI152_T1_2009c template, and smoothed using
Data analysis—SSAT performance                                                  a 6 mm FWHM kernel. The first three principal components from the
We assessed proactive inhibition by examining the effect of Stop-signal         time series of lateral third and fourth ventricle sources were estimated
probability on RT, where participants tend to slow responding as the            and regressed from functional volumes, along with six head motion pa-
likelihood of having to stop increases (Vink et al., 2005, 2006;                rameters and their first-order derivatives. Local white matter was
Verbruggen and Logan, 2009a; Zandbelt and Vink, 2010). Impaired pro-            regressed from functional volumes using the fast ANATICOR pipeline
active inhibition would be evident in a failure to increase RT when Stop-       (Jo et al., 2010). Functional volumes with a Euclidean norm motion de-
signal probability increases, as this would suggest weaker anticipation of      rivative .0.5 mm were censored, and participants with .10% of vol-
stopping. Reactive inhibition was indexed as Stop-signal reaction time          umes censored were excluded from group-level analysis.
(SSRT), which represents the latency of the inhibition process. SSRT was            Functional MRI data from prestress, poststress, preneutral, and post-
computed using the integration method (Verbruggen and Logan, 2009b)             neutral sessions were available from n = 84, n = 79, n = 80, and n = 81
across all Stop-signal probability levels with go omission replacement          participants, respectively. One participant was excluded from analysis
(Verbruggen et al., 2019). Slower SSRTs would reflect greater latency of        because of white matter abnormalities. In addition, five poststress, four
the inhibitory process and therefore impaired reactive inhibition.              preneutral, and two postneutral runs were excluded because of excessive
    Behavioral data were analyzed in R (R Core Team, 2015). Aligning            head motion. A technical error resulted in the exclusion of one addi-
with previous reports (Zandbelt and Vink, 2010; Zandbelt et al., 2011),         tional postneutral session. During a preneutral session, echoplanar
Go-signal RTs that were .1.5 times the interquartile range below the            image acquisition had to be stopped because of a technical error; how-
25th percentile or above the 75th percentile of the RT distribution at          ever, as ;70% of functional volumes had been acquired for this partici-
each probability level, as well as on failed Stop-signal trials, were defined   pant, their preneutral run was included in the group-level analysis.
as outliers. To minimize positive skew, a rank-based inverse normal                 Statistical analysis followed a two-level procedure, where successful
transformation was applied to RTs (R package RNOmni; McCaw, 2019)               Stop-signal trials, failed Stop-signal trials, and Go-signal trials with non-
before analysis. Analyses of proactive inhibition (trial RT) and reactive       0% Stop-signal probability were modeled as regressors of interest in the
inhibition (SSRT) were conducted using the linear mixed-effects model-          first-level general linear models. In line with previous work (Zandbelt
ing (LMM) R package nlme (Pinheiro et al., 2016), where fixed effects of        and Vink, 2010; Zandbelt et al., 2011), we included two amplitude mod-
group, condition, and time were included in both models, with random            ulators, RT and Stop-signal probability level, for Go-signal trials. AFNI
intercepts for within-subject variables nested within the subject’s ran-        models one regressor for the constant magnitude of the blood oxygen-
dom effect. Additionally, fixed and random effects for probability level        ation level-dependent (BOLD) response and separate regressors for each
(linear and quadratic terms) were included in the proactive inhibition          amplitude per timepoint unlike other packages that partition the var-
LMM. Group differences were tested via nonorthogonal contrasts, com-            iance of regressors sequentially. However, as RT (in this context, a mea-
paring each patient group to the control group, and model results are           sure of the tendency to withhold a response) and Stop-signal probability
reported accordingly. Normality of the model residuals was determined           contrasts may provide complementary information, both were used as
by visual inspection of quantile–quantile plots.                                measures of proactive inhibition. In addition, incorrect Go-signal trials
                                                                                and rest blocks were included as nuisance regressors; Go-signal trials
Data analysis—fMRI                                                              with a Stop-signal probability of 0% were not modeled, thus constituting
Image data were preprocessed and analyzed using FreeSurfer (version             an implicit baseline. Regressors were created by convolving g functions
6.0; Dale et al., 1999; Fischl et al., 1999) and AFNI (Analysis of              coding for response onset (or Stop-signal delay for successful Stop-signal
Westwater et al. · Stress and Inhibition in Anorexia and Bulimia J. Neurosci., May 19, 2021 • 41(20):4487–4499 • 4493
Figure 3. Whole-brain activation in women with anorexia nervosa and bulimia nervosa, and control participants during the Stop-signal anticipation task. A–D, Two-sample t tests of the
parametric effect of Stop-signal probability versus the implicit baseline (i.e., Go0% trials; A), the parametric effect of reaction time versus the implicit baseline (B), successful Stop-signal versus
the implicit baseline (C), and successful Stop-signal versus failed Stop-signal activation for AN-BP, BN, and control groups (D). A and B represent proactive inhibition contrasts, whereas C and D
relate to reactive inhibition. Maps represent significant clusters (voxelwise p value , 0.001, FWE cluster probability p value , 0.05) and are presented in neurological orientation (L, left). For
details on cluster size, coordinates, and associated test statistics, see Extended Data Figures 3-1, 3-2 3-3, 3-4.
trials) with a canonical hemodynamic response function. Within each Next, we examined whether a group-by-time-by-condition interac-
subject run, we computed the following four contrast images: (1) the tion related to differences in whole-brain activation. Whole-brain analy-
parametric effect of RT on Go-signal activation (proactive inhibition); ses were completed using the linear mixed-effects modeling AFNI
(2) the parametric effect of Stop-signal probability on Go-signal activa- program 3dLME (Chen et al., 2013), where general linear tests were
tion (proactive inhibition); (3) successful stop versus failed Stop-signal implemented to test a priori contrasts of interest (e.g., AN . HC, BN .
trials (reactive inhibition); and (4) successful Stop-signal versus Go-sig- HC, stress . neutral, post . pre). As the model tested a three-way inter-
nal trials with 0% Stop-signal probability (reactive inhibition). We gener- action (AN . HC p stress . neutral p post . pre), lower-order interac-
ated two contrasts for reactive inhibition as there is no consensus on tion and main effects were also included. Both F- and z-statistics are
which contrast is most appropriate when investigating this inhibitory reported for each effect. The resulting group-level statistical maps were
mode. Beta estimates were determined using restricted maximum likeli- tested for significance using cluster-level inference [cluster-defining
hood estimation. threshold, p , 0.001, k = 18.8; cluster probability, p , 0.05, familywise
We conducted two group analyses for each contrast. First, we exam- error (FWE) corrected]. Updated versions of 3dFWHMx and
ined associations between diagnostic group (AN . HC and BN . HC), 3dClustSim were used to correct for multiple comparisons, as these pro-
condition (stress vs neutral), time (pre vs post), and their interaction and grams incorporate a mixed autocorrelation function to model non-
the BOLD response in seven predefined regions of interest (ROIs; Fig. Gaussian noise structure and reduce false-positive rates (Eklund et al.,
2A). The a priori ROI selection was based on findings from previous 2016; Cox et al., 2017). For visualization, the mean percentage signal
functional imaging studies of the SSAT (Zandbelt and Vink, 2010; change was extracted from significant whole-brain clusters using
Zandbelt et al., 2011), proactive and reactive inhibitory control networks 3Dmaskave.
(van Belle et al., 2014), and NeuroSynth (https://neurosynth.org) clusters
associated with “Stop-signal” and “response inhibition” terms. Averaged Exploratory analysis of inhibitory control and ad libitum consumption
b -estimates were extracted from each ROI, as it was defined anatomi- We used LMMs to test whether SSRT, Barratt Impulsiveness scores
cally in the Brainnetome atlas (Fan et al., 2016), using 3dmaskave. For (BIS-11; Patton et al., 1995), or brain regions implicated in the fMRI
each ROI, main and interaction effects were tested in an LMM, and ran- analyses explained variance in subsequent food intake (in kilocalories).
dom intercepts for condition and time were included within the random As described previously (Westwater et al., 2020), one participant
effect of the individual. As seven ROIs were tested per contrast, our a declined to initiate the ad libitum meal on day 2, and another reported
threshold was reduced to p = 0.05/7 = 0.007. severe nausea before the meal. We therefore modeled observations from4494 • J. Neurosci., May 19, 2021 • 41(20):4487–4499 Westwater et al. · Stress and Inhibition in Anorexia and Bulimia
Figure 4. Impaired proactive inhibition in bulimia nervosa is associated with increased superior frontal gyrus activity. A, Reaction time increased as a function of Stop-signal probability in all
groups; however, a significant group-by-probability interaction showed that women with BN did not slow to the same degree as control participants in response to increasing Stop-signal prob-
ability (p = 0.003). B, C, This impairment in proactive inhibition was associated with greater activity in the left superior frontal gyrus (k = 25 voxels, z = 4.58, MNIX,Y,Z = 23, 33, 54; cluster-
defining threshold, p , 0.001; FWE-corrected cluster probability, p , 0.05) in BN relative to control participants. C, A three-way interaction was related to stress-induced increases in the right
superior frontal gyrus in women with BN relative to those with AN-BP (k = 34 voxels, z = 4.52, MNIX,Y,Z = 22, 54, 36; cluster-defining threshold, p , 0.001; FWE-corrected cluster probability,
p , 0.05). The size, coordinates, and test statistics of significant clusters from the whole-brain linear mixed-effects analysis of proactive inhibition are reported in Extended Data Figure 4-1.
Results are displayed in neurological orientation (L, left). Individual values are overlaid on the mean modulated percentage signal change by group. Error bars indicate the SEM.
83 participants for these exploratory analyses. For consistency, SSRT and Stop-signal probability ( b = 0.01, t(1019) = 13.08, p , 0.0001);
neural responses were modeled from postmanipulation runs only. however, this effect was nonlinear, as a significant quadratic
Each model included fixed effects of group (AN . HC and BN . HC), probability term suggested that RT slowing plateaued with
condition, and impulsivity measure, where random intercepts for within- increasing Stop-signal probability ( b = 5.07, t(57,919) = 5.28,
subject variables were included within the subject’s random effect. Models
p , 0.0001). RT on non-0% Go-signal trials was significantly
of SSRT and brain responses also included a person-centered random slope
for these variables. Exploratory results were considered statistically signifi-
decreased postmanipulation (i.e., at time 2; b = 0.14, t(169) =
cant at p = 0.05. 8.49, p , 0.0001), which is consistent with the expected prac-
tice effects within each scanning session. Moreover, a significant
group-by-probability interaction indicated poorer proactive inhi-
Results bition in the BN group relative to control participants (b = 6.54,
Behavioral t(1012) = 2.97, p = 0.003; see Fig. 4A), where women with BN
Manipulation check demonstrated a smaller increase in RT relative to increasing Stop-
As previously reported (Westwater et al., 2020), both subjective signal probability. The addition of higher-order interaction terms
stress (Fig. 1B) and negative affect were significantly increased did not significantly improve model fit (x 2(13) = 16.11, p = 0.19),
following the stress induction relative to the control condition. indicating that proactive inhibition was not significantly affected by
Moreover, a group-by-condition interaction identified stress- acute stress. RT on 0% Stop-signal probability trials did not differ
induced plasma cortisol decreases in participants with BN, but between AN (p = 0.37) or BN (p = 0.96) and control participants,
not in those with AN-BP, compared with control participants indicating equivalent performance on the baseline response task
(Extended Data Fig. 1-1; Westwater et al., 2020), aligning with (Table 2).
previous reports of blunted stress responses in this disorder
(Pirke et al., 1992; Monteleone et al., 2011; Ginty et al., 2012). No effect of patient group or stress on reactive inhibition
We predicted that both the AN-BP and BN groups would demon-
Reduced proactive inhibition in bulimia nervosa strate impaired reactive inhibition relative to control participants
We anticipated proactive inhibition would be impaired in BN following the acute stress induction. The significant main effect of
and augmented in AN-BP while stress-induced impairments time indicated that SSRT was reduced postmanipulation ( b =
would be observed in both groups. RT increased with greater 3.29, t(166) = 3.23, p = 0.002). However, all other main andWestwater et al. · Stress and Inhibition in Anorexia and Bulimia J. Neurosci., May 19, 2021 • 41(20):4487–4499 • 4495
interaction effects on SSRT were nonsignificant (all p
values . 0.05; Table 2). Data met the assumptions of the race
model, as evidenced by faster RTs on failed Stop-signal trials com-
pared with Go-signal trials where Stop-signals could occur (b =
21.5, t(339) = 39.4, p , 0.0001).
Functional MRI
Proactive inhibition
Examination of the parametric effects of Stop-signal probability
and RT identified increased neural responses across frontoparie-
tal regions that comprise the proactive inhibition network (Fig.
3A,B, Extended Data Fig. 3-1, Extended Data Fig. 3-2), indicating
successful experimental manipulation of proactive inhibition.
ROI analyses. Increasing Stop-signal probability was associ-
ated with greater right inferior frontal gyrus (IFG) activity in the
AN-BP group relative to control participants ( b = 0.007, t(81) =
2.91, p = 0.005; Fig. 2B). IFG activity decreased postmanipulation
(i.e., at time 2) across all groups ( b = 0.006, t(156) = 3.20,
p = 0.002). In addition, the parametric effect of RT on left premo-
tor cortex activity was related to a three-way interaction, where
the BOLD response decreased in participants with BN relative to
control participants following the stress induction ( b = 0.62,
t(151) = 3.48, p , 0.001; Fig. 2C).
Whole-brain analyses. Increasing RT was related to reduced
left supplementary motor area (SMA) activity postmanipulation
(Extended Data Fig. 4-1). Moreover, the effect of Stop-signal
probability was significantly affected by time, where activity
across the proactive inhibition network generally decreased post-
manipulation (Extended Data Fig. 4-1). In line with behavioral find-
ings, the effect of Stop-signal probability also differed significantly
by group, where the parameter was related to increased activity in
the left superior frontal gyrus (SFG) in BN relative to control partic- Figure 5. Stress reduces right ventromedial prefrontal cortex activity in women with anorexia
nervosa (binge/purge subtype) during reactive inhibition. A, A significant three-way interaction
ipants (k = 25 voxels, z = 4.58; Fig. 4B, Extended Data Fig. 4-1). A
indicated that right vmPFC activity was significantly reduced following acute stress compared with
significant three-way interaction was associated with right SFG ac- the neutral condition in the AN-BP group relative to the control group (k = 32 voxels, z =
tivity (k = 19 voxels, F(22,31) = 10.77). As this effect was not captured 4.19, MNIX,Y,Z = 4, 45, 9; cluster-defining threshold, p , 0.001; FWE-corrected cluster proba-
by our a priori contrasts, we conducted an additional general linear bility, p , 0.05). The size, coordinates, and test statistics of significant clusters from the whole-
test, which examined the three-way interaction in BN versus AN- brain linear mixed-effects analysis of reactive inhibition are reported in Extended Data Figure 5-1.
BP. This test indicated augmented SFG activity in BN relative to B, Change in the average percentage signal change for the vmPFC cluster from preinduction to
AN-BP following stress (k = 34 voxels, z = 4.52; Fig. 4C, Extended postinduction across conditions. Individual values are overlaid on the mean change in percentage
Data Fig. 4-1) as patient groups had opposing functional responses signal change (post – pre) by group.
to stress in this cluster.
Whole-brain analyses. On Stop . Go-signal trials, neural
Reactive inhibition responses were significantly reduced across the inhibitory control
Analyses of reactive inhibition (Stop . Go-signal and Stop . network postmanipulation (Extended Data Fig. 5-1). Activity in left
FailedStop trials) indicated increased neural responses across the in- middle temporal, thalamic, posterior insular, occipital, and inferior
hibitory control network (Fig. 3C, Extended Data Fig. 3-3, Extended frontal clusters was reduced postmanipulation during Stop .
Data Fig. 3-4) with markedly similar activation patterns across FailedStop trials. Moreover, left precentral gyrus activity on Stop .
groups. FailedStop trials was increased on the stress day relative to the neu-
ROI analyses. The main effect of group and all interaction tral day. Finally, a three-way interaction indicated reduced activity
effects were nonsignificant across all ROIs for both reactive inhibi- in the right ventromedial PFC (vmPFC) during reactive inhibition
tion contrasts. A significant main effect of time was related to right (Stop . FailedStop trials) in the AN-BP group relative to the
pre-supplementary motor cortex (b = 0.02, t(156) = 3.51, control group following stress (k = 32 voxels, z = 4.19; Fig. 5).
p , 0.001), ACC (b = 0.01, t(156) = 2.79, p = 0.006), and bilateral
superior parietal cortex activity (b = 0.02, t(156) = 4.46,
p , 0.001) on Stop . Go-signal trials, where activity declined post- Associations with food intake
manipulation. Moreover, the main effects of condition (b = 0.01, We previously reported that AN-BP and BN groups consumed
t(82) = 2.77, p = 0.007) and time (b = 0.01, t(156) = 3.14, p = 0.002) less in the buffet (Extended Data Fig. 6-1) than the control
were associated with ACC activity during Stop . FailedStop trials, group, and intake was unaffected by stress (Westwater et al.,
where deactivation was less negative on the stress day and postma- 2020). On the stress day, women with AN-BP and BN, and con-
nipulation (i.e., at time 2). As a time-by-condition interaction term trol participants consumed [mean (SD)] 898 kcal (872), 873 kcal
was not significantly related to ACC activity, the observed differen- (409), and 1099 kcal (335), respectively. AN-BP, BN, and control
ces likely reflect BOLD variability across scan days that was not spe- groups ate 849 kcal (806), 941 kcal (560), and 1129 kcal (294),
cific to the stress induction. respectively, on the neutral day.4496 • J. Neurosci., May 19, 2021 • 41(20):4487–4499 Westwater et al. · Stress and Inhibition in Anorexia and Bulimia
Figure 6. Associations between prefrontal responses during inhibition and ad libitum consumption. A, Greater vmPFC responses during reactive inhibition (Successful Stop vs Failed Stop)
were negatively related to food consumption during the free-choice meal. For the contents of the meal and corresponding macronutrient information, see Extended Data Figure 6-1. B,
Increased left superior frontal gyrus responses to greater Stop-signal probability were positively associated with food intake. Observations within the same participant are modeled with a line
of best fit that reflects the overall brain–behavior association. While effects were derived from linear mixed-effects models, repeated-measures correlations were computed for visualization,
using the rmcorr R package (Bakdash and Marusich, 2017).
Here, we examined whether brain regions demonstrating dif- compensatory responses may also explain increased right IFG
fering neural responses between groups (e.g., left premotor cor- responses in the AN-BP group during intact proactive inhibition.
tex, right IFG, left SFG) or in a group-by-condition-by-time Alternatively, given the role of the pars opercularis in “braking”
interaction (right SFG, right vmPFC) explained variance in food motor responses (Swann et al., 2012; Aron et al., 2014), increased
intake. Left SFG responses during proactive inhibition predicted activity could reflect improved proactive adjusting in individuals
increased kilocalorie intake (z-scored; b = 4.06, t(71) = 2.42, with AN-BP on the neural level, complementing previous behav-
p = 0.02), and vmPFC responses during reactive inhibition were ioral reports in AN-R (Bartholdy et al., 2017). Exploratory analy-
negatively related to consumption ( b = 1.00, t(71) = 3.38, ses found that left SFG responses predicted increased postscan
p = .0012; Fig. 6). These associations were observed in the full calorie intake. This finding lends additional support to the
sample and did not differ significantly by group or condition. notion of inefficiencies across the proactive inhibitory network
The effects of SSRT, trait impulsivity, and all interaction terms that may relate to abnormal eating behavior, specifically over-
were nonsignificant (all p values . 0.05). consumption. As this association was not moderated by disorder
status, this finding might suggest a general–rather than a diagno-
sis-specific—association between left SFG activation during pro-
Discussion active inhibition and food intake. However, our sample may
As failed self-regulation in response to stressors has gained trac- have lacked sufficient statistical power to detect small interaction
tion as a putative mechanism of binge eating, it has become effects, and future studies with larger sample sizes will be critical
increasingly important to characterize the precise self-regulatory to determining whether and how this relationship differs
deficits associated with binge-eating disorders. We assessed the between AN-BP, BN, and control groups.
impact of induced stress on inhibitory control in women with Acute psychological stress altered right SFG and left premotor
AN-BP, BN, and matched control participants, reporting three cortex responses during proactive inhibition, as well as right
key findings. First, women with BN, but not AN-BP, had vmPFC activity during outright stopping, differently between
reduced proactive inhibition, yet both groups demonstrated groups. Specifically, stress augmented right SFG responses to
increased prefrontal responses during the anticipation of stop- increasing Stop-signal probability in the BN group relative to the
ping compared with the control group. Second, we found stress- AN-BP group. In women with BN, these stress-induced increases
induced changes in the neural correlates of proactive and reactive in SFG responses perhaps compensated for concomitant
inhibition, with notable differences across diagnostic groups. decreases in premotor activity during RT slowing, thus preserv-
Third, AN-BP and BN groups had intact reactive inhibition, and ing task performance. Indeed, increased prefrontal activity has
neither proactive nor reactive inhibition performance was been reported in healthy adults following pain stress, where acti-
affected by acute stress. vation was presumed to support working memory performance
We report novel evidence of reduced proactive inhibition in (Porcelli et al., 2008).
BN relative to control participants, which co-occurred with One explanation for reduced poststress vmPFC responses
increased activity in the left dorsolateral SFG. Increased left SFG in women with AN-BP relative to control participants, who
activity and concurrent performance deficits could reflect ineffi- showed augmented responses, could be stress-induced altera-
cient recruitment of other regions within the inhibitory control tions in inter-regional modulation (Veer et al., 2011). The
network, namely inferior and middle frontal gyri, which share re- vmPFC is the primary cortical target of limbic projections
ciprocal connections with the SFG (Li et al., 2013). Inefficient or (Averbeck and Seo, 2008), and stress-induced increases inYou can also read