A review of the damage caused by wild mammalian herbivores to primary production in New Zealand - Envirolink Grant: 1841-ESRC502
←
→
Page content transcription
If your browser does not render page correctly, please read the page content below
A review of the damage caused by wild
mammalian herbivores to primary
production in New Zealand

Envirolink Grant: 1841-ESRC502

Prepared for:   Environment Southland

June 2018
A review of the damage caused by wild mammalian
herbivores to primary production in New Zealand

Contract Report: LC3232

A. David M. Latham, M. Cecilia Latham, Bruce Warburton
Manaaki Whenua – Landcare Research

Reviewed by:                                             Approved for release by:
Grant Norbury                                            Chris Jones
Capability Leader, Wildlife Ecology & Management         Portfolio Leader – Managing Invasives
Manaaki Whenua – Landcare Research                       Manaaki Whenua – Landcare Research

Disclaimer

This report has been prepared by Manaaki Whenua – Landcare Research for Environment Southland. If used by
other parties, no warranty or representation is given as to its accuracy and no liability is accepted for loss or
damage arising directly or indirectly from reliance on the information in it.

© Landcare Research New Zealand Ltd and Environment Southland 2018

This information may be copied and distributed to others without limitation, provided Landcare Research New
Zealand Ltd and Environment Southland are acknowledged. Under no circumstances may a charge be made
for this information without the written permission of Landcare Research and Environment Southland.
Contents

Summary ....................................................................................................................................................................... v
1          Introduction .....................................................................................................................................................1
2          Damage to primary production by wild herbivores .........................................................................3
           2.1        Arable crops .......................................................................................................................................................... 3
           2.2        Plantation forests ................................................................................................................................................ 5
           2.3        Pasture depletion – evidence from exclosures ........................................................................................ 6
           2.4        Forage depletion – indirect estimates ........................................................................................................ 9
           2.5        Separating the effects of multiple wild herbivore species ................................................................ 18

3          Factors influencing decisions about herbivore control ................................................................ 19
4          Post-control stocking rate decisions ................................................................................................... 21
5          Conclusions and research priorities ..................................................................................................... 22
6          References ..................................................................................................................................................... 23

                                                                                     ~ iii ~
Summary
Project and Client
Wild mammalian herbivores can compete with domestic livestock for forage and
damage other production assets, including horticulture and silviculture. Environment
Southland contracted Manaaki Whenua to review the damage caused by wild
mammalian herbivores to primary production in New Zealand. The review was carried
out between September 2017 and June 2018.
Findings
With the exception of brushtail possums (Trichosurus vulpecula) and European rabbits
(Oryctolagus cuniculus), there have been no direct quantitative assessments of
pasture or crop depletion from wild mammalian herbivores on New Zealand farmland.
Possums and rabbits can significantly deplete forage and reduce stocking rates of
livestock.
Based on indirect estimates using dry matter consumption by wild herbivores
converted to stock unit equivalents, all species of wild herbivores that occur on New
Zealand farmland have the potential to reduce stocking rates if they obtain a large
amount of their food from forage and occur at moderate to high densities.
There are only sparse quantitative data on the damage caused by wild herbivores to
horticulture and silviculture in New Zealand.
The process that farmers use to decide whether to control wild herbivores on their
properties is complex. However, they do use available information to weigh up the
expected costs and benefits of control. Less clear is how they respond to changes in
forage availability following pest control: for example, do they alter their stocking
rates of livestock to maximise marketable products?
Conclusions and Recommendations
The lack of quantitative data on the impacts of wild herbivores on production assets is
a significant knowledge gap. Even less is known about the impacts of these animals
on production landscapes when multiple species occur sympatrically, as is often the
case.
A better quantitative understanding of damage in relation to pest density is needed
for effective management, and we recommend this as a research priority for
candidate species agreed upon by land owners, management agencies and research
organisations.
-v-1 Introduction
The primary resource for dry stock or dairy animals is pasture production (forage), and the
main marketable products are beef, lamb, venison, milk, wool, and deer velvet. The
economically astute farmer must optimise the use of forage to maximise these marketable
products (Glimp 1988; Hunt et al. 2014), within acceptable environmental limits. Many
farmers understand this optimisation challenge and are accomplished in its practice. They
operate within the ebb and flow of seasonal forage availability to optimise their annual
stocking rates and production from livestock (Macleod & Macintyre 1997; Matthews et al.
1999; Morris 2013). However, many farms around the world are shared by native or
introduced wild herbivorous mammals, and these animals also consume forage and compete
with livestock. If a large proportion of the available forage is eaten by wild herbivores, then
the carrying capacity of livestock will, at least in theory, be reduced (Quinn 1968; Trdan &
Vidrih 2008; Scroggie et al. 2012; Cooke et al. 2013; Davis et al. 2016). If the farmer does not
place some value on the wild herbivores that are eating the available forage, such as for
hunting or intrinsic reasons, they may be viewed as pests by the farmer, or legally defined as
such by management authorities, and therefore controlled.
Despite the potential for wild herbivores to be pests, the relationship between the amount of
forage consumed by wild herbivores and its effect on stocking rates remains poorly
understood (Spurr & Jolly 1981; Cowan 2007; Davis et al. 2016), particularly when multiple
wild species occur sympatrically on the same property (e.g. Parkes 2001; Mutze et al. 2016;
Lush et al. 2017). Similarly, the costs and benefits of controlling wild herbivores to reduce
their consumption of the available forage have not been well quantified (Norbury & Reddiex
2005), especially in relation to the decisions farmers make about adjusting their stocking
rates following control, or as pest numbers increase.
Starting in the late 18th century and continuing until the early 20th century, a wide variety of
wild herbivorous mammals were introduced into New Zealand for utility (a source of wild
meat) and sport hunting (King 2005; Latham & Nugent 2017b). Nine species occur at
comparatively high densities across large tracts of agricultural New Zealand, including: dama
(or tammar) wallaby (Notamacropus eugenii), Bennett’s wallaby (N. rufogriseus), common
brushtail possum (Trichosurus vulpecula), European rabbit (Oryctolagus cuniculus), European
(or brown) hare (Lepus europaeus), fallow deer (Dama dama), red deer (Cervus elaphus), feral
goat (Capra hircus), and feral pigs (Sus scrofa). All of these species have diets that overlap
those of domestic livestock (Parkes et al. 1996; Norbury 2001; Sadleir & Warburton 2001;
Cowan 2007; Latham & Nugent 2017b), and some are maintenance or spill-over hosts for
important agricultural diseases, such as bovine tuberculosis (TB), which is caused by the
bacterium Mycobacterium bovis (Coleman & Cooke 2001; Nugent et al. 2015).
In concert with their unwanted impacts on native vegetation and ecosystems (Veblen &
Stewart 1982; Wardle et al. 2001; Latham et al. 2017), their actual or perceived competition
with domestic livestock for forage has meant that their populations have been lethally
controlled, primarily by shooting and poisoning, for around 100 years (Sadleir & Warburton
2001; Nugent et al. 2012; Warburton & Livingstone 2015; Latham & Nugent 2017b).
Controlling wild herbivores on New Zealand farmland is predicted to become increasingly
important for some species as they expand into previously unoccupied areas (or reinvade
areas from which they were historically eradicated), increase in number, and potentially cause
-1-more damage (Fraser et al. 2000; Latham, Latham & Warburton 2016; Latham & Nugent
2017a).
Despite the known spatial and dietary overlap between wild herbivores and livestock in New
Zealand, there is a surprising dearth of quantitative data on the damage wild mammals cause
to agricultural, horticultural and silvicultural systems. For example, despite 140 years of
European rabbit control in New Zealand, few studies have quantified forage depletion by
rabbits (Lough 2009), and those that have, have been short-term studies conducted
exclusively in dry short-tussock grassland in the central South Island (Norbury & Norbury
1996; Norbury et al. 2002; Scroggie et al. 2012). Apart from limited data for possums (Spurr &
Jolly 1981; Dodd et al. 2006), there are, to our knowledge, no direct quantitative assessments
of pasture or crop depletion (i.e. using experimental exclosures) for the other species of wild
mammalian herbivores on New Zealand farmland.
However, a number of studies have used qualitative or indirect methods to estimate the
economic costs of forage depletion by these herbivores on New Zealand farmland
(Warburton & Frampton 1991; Cowan 2007). Moreover, studies from other parts of the world
have assessed damage to production assets for some species of wild mammalian herbivores
(e.g. see reviews for wild deer in the United Kingdom: Gill 1992b and Putman et al. 2011),
which may be relevant to production landscapes in New Zealand. These studies are generally
limited by a lack of information about the actual abundance or density of the wild herbivore
relative to the depletion of pasture biomass, or other production assets. Instead, indirect
indices of herbivore abundance are often used (e.g. surveys of faecal accumulation, active
burrow counts, or spotlight night counts) (Putman et al. 2011; Latham, Nugent et al. 2012;
Forsyth et al. 2015). This results in an inability to determine per capita forage consumption
from forage off-take studies, but it does permit pest density–impact functions (or damage
functions) to be derived, and in some cases these may be useful for identifying relative
abundance thresholds above which control could be triggered (Hone 2007; Putman et al.
2011; Norbury et al. 2015).
The aim of this paper is to review the literature, including relevant overseas evidence, to
assess the impacts of wild herbivores on primary production, especially agriculture, in New
Zealand. In the absence of studies directly measuring per capita forage off-take using
experimental exclosures, we used an indirect method to estimate forage depletion by wild
herbivores: dry matter (DM) consumption of forage per unit time, converted to ewe
equivalents (Warburton & Frampton 1991), and compared it with the annual DM
consumption (550 kg) of one New Zealand stock unit (i.e. a ewe) to estimate its potential
effect on livestock carrying capacity (Cowan 2007; Morris 2013). This information permits
density–impact functions to be estimated, assuming a linear relationship for forage depletion
(Statham 1994; Fleming et al. 2002), and we present some examples of these.
We also assessed the extent to which the economic impacts predicted by qualitative and
quantitative methods trigger farmers to control wild herbivores on their land, compared with
behavioural factors such as self-identity and subjective norms, or regulatory frameworks
within regional pest management plans.
Finally, we reviewed published and grey literature to determine whether farmers respond to
changes in forage availability following pest control by altering their stocking rates of
livestock to maximise marketable products.
-2-2 Damage to primary production by wild herbivores
2.1 Arable crops
Damage to arable crops by wild herbivores in New Zealand is well known, although most
evidence is anecdotal or qualitative (e.g. Warburton 1986; Butcher 2000; McIlroy 2005;
Norbury & Flux 2005; NPCA 2012, 2015). Crop damage can be locally severe but is often
concentrated at the edges of crops, nearest to cover such as forest or scrub (Wheeler &
Nicholas 1987; Butcher 2000; Warburton 2005a; Trdan & Vidrih 2008). Nevertheless, the
actual or perceived damage to crops and plantation forests (see below) was a key factor for
many species being designated as pests, especially in the late 19th and early 20th centuries,
and the ensuing control operations against them (Wodzicki 1950; Caughley 1983; Nugent &
Fraser 1993). Control operations reduced their densities in many agricultural areas, and,
although variable, control also alleviated much of the damage from wallabies (Catt 1975),
rabbits (Gibb et al. 1978), and red deer (Caughley 1983; Batcheler 1986; Nugent 2005) on
production assets. If the densities or distributions of wild herbivores are permitted to increase
as a result of relaxed levels of pest control, or the effectiveness of biological control agents
decreases (e.g. rabbit haemorrhagic disease virus [RHDV]), damage to arable crops may
increase (Fraser et al. 2000; Lough 2009; Latham, Latham & Warburton 2016; Latham &
Nugent 2017a).
Possums feed on cereal crops and fodder crops planted for livestock, such as oats, lucerne,
chou moellier (Brassica oleracea var. acephala), swedes and turnips (Gilmore 1965; Butcher
2000). In an exclusion experiment, Spurr and Jolly (1981) reported losses caused by possums
of up to 26% in a swede crop, and estimated that the lost yield from a 0.4 ha block over 3
months would have supported 336 ewe equivalents for one day. Possums also eat a wide
variety of other fruits, vegetables and garden flowers (summarised in Butcher 2000).
Rabbits can cause significant damage to a wide variety of cereal and horticultural crops in
some parts of the world, including Australia (Wheeler & Nicholas 1987) and Britain (Bell et al.
1998; Dendy et al. 2004). Robust data from exclosure experiments on crop damage caused by
rabbits are lacking for New Zealand. However, palatability and acceptability trials to identify
suitable baits for controlling rabbits in Australasia have shown that a number of arable crops
are readily eaten, such as carrots, oats and barley (Rowley 1963a, b; Nugent et al. 2012),
suggesting damage to some types of crops may occur and be at least locally severe. Damage
to vegetables from rabbits in New Zealand gardens is well known but not quantified (NPCA
2012). Similarly, hares damage market garden crops (e.g. asparagus, cabbages, cauliflower
and lettuces) and cereal crops (e.g. corn, wheat and maize) (NPCA 2015), but there are no
estimates of the economic cost of this damage in New Zealand.
Damage to crops by deer in New Zealand is also well known, but evidence is anecdotal or
qualitative. Complaints by farmers about damage to their crops began in the early 20th
century as deer numbers increased following liberations in the mid to late 19th century
(Caughley 1983). This led to the influential report by Perham (1922), in which he detailed the
extensive damage deer caused to crops, pasture and silviculture, and this was the first
attempt by the New Zealand Forest Service to wrestle control of deer management from the
Department of Internal Affairs. It was a convincing report, showing photographs of deer
damage to crops, but it lacked quantitative data about the magnitude of the damage, per
-3-capita consumption, and effects on stocking rates. Nearly one century later little new
knowledge has been gained about deer damage to crops (and pasture) in New Zealand.
Many documents report that deer damage crops (e.g. Caughley 1983; Fraser et al. 2000;
Nugent 2005; Latham & Nugent 2017b), but rarely are the types of crops itemised and, to our
knowledge, the magnitude of the damage is not quantified. Damage to swede crops has
been reported by farmers from Southland, with about 44% of farmers in that region being
concerned about the level of damage deer cause to crops and pasture (Latham, Craddock-
Henry, et al. 2012). Sika deer (Cervus nippon) also feed on swede crops in central North Island
(Davidson 1979).
The economic damage caused by red deer and Eurasian wild pigs to crops, especially wheat,
maize and sunflower, averaged about NZ$3.4–5.3/km2 per year in the least affected counties
in Hungary (Bleier et al. 2012). For the Hungarian counties most affected by deer and pigs,
damage estimates were much higher (NZ$500.65/km2 per year; Bleier et al. 2012). Crop
damage in Hungary was positively correlated with the relative abundance (based on hunting
bag data) of red deer and wild pigs (Figure 1). Assuming that hunting effort and hunter
success were equal across counties, an assumption often violated (Mysterud et al. 2007;
Pettorelli et al. 2007), the figure shows that damage increases exponentially as harvest
reaches about 0.8 deer/km2. The relationship for pigs is not as strong and is primarily driven
by one high observation corresponding to a harvest of 1.75 pigs/km2. If this information is
put into the context of a pest density–impact function, the trend lines best represent the
‘resistant’ or ‘moderately resistant’ relationships presented in Norbury et al. 2015. This means
that crops are comparatively resistant to damage caused by, particularly, deer up to a
threshold of c. >0.8 deer harvested/km2 or >1 pig harvested/km2. The patterns are indicative
of the damage these two species might cause to crops in New Zealand.
Presumably damage by deer in New Zealand is most severe around the edges of crop fields,
as has been shown elsewhere (Trdan & Vidrih 2008; Putman et al. 2011). However, if wild
deer are sufficiently abundant and undisturbed by humans, damage may be more severe and
occur further from crop edges. As some species of deer (e.g. fallow deer and red deer) have
increasingly expanded into farmland via natural dispersal, farm escapes and human-assisted
liberations (Fraser et al. 2000; Latham & Nugent 2017a), damage to crops and increased
potential for conflict between neighbouring land owners with different values towards wild
deer may increase (Latham et al. 2017). In a similar vein, quantitative data on the damage
caused by wallabies and goats to crops are sparse or absent (Warburton 1986; Parkes et al.
1996).
The lack of quantitative data on the impacts of wild herbivores on crops and pasture is a
significant knowledge gap. It has major implications for control, raising questions such as is
their feeding activity negatively affecting production assets, and if it is, what level of control is
needed to mitigate this damage? Moreover, wildlife management agencies are increasingly
required to justify their control operations in terms of animal welfare; i.e. how many pest
animals need to be killed to reduce the damage they cause, and is there evidence the desired
outcomes have been achieved following control?
-4-Figure 1: Economic damage to crops in 19 counties in Hungary (some points overlap) in relation
to an index (hunter harvest) of wild red deer (Cervus elaphus) and Eurasian wild pig (Sus scrofa)
abundance (data are from Bleier et al. 2012). Importantly, the x-axis does not represent
absolute density, which is unknown.
2.2 Plantation forests
In New Zealand, damage by dama and Bennett’s wallabies to young trees, particularly Pinus
radiata, in newly planted production forests has been observed, but it is generally minor and
restricted to 50–100 m from the forest edge (Warburton 2005a, b). The only quantitative
measure of damage by wallabies to production forests in New Zealand comes from P. radiata
in Waimate State Forest, South Island. Bennett’s wallabies removed up to 20% of needles
from seedlings near the forest edge, sometimes eating the entire apical buds and killing the
seedlings (seedling survival ranged from 83–98% in the plots assessed) (Warburton 1986).
Possum damage to plantation forests in New Zealand is generally low, with minor economic
costs in most areas, but damage can be locally severe, with around 50% loss of 3-year-old
seedlings at some sites (Warburton 1978; also see Clout 1977; Jacometti et al. 1997). The
majority of possum damage involves needle clipping and damage to lateral branches, and it
is negatively correlated with tree maturity (Jacometti et al. 1997). In Australia, local and
seasonal damage by native wallabies and common brushtail possums to seedlings in native
eucalypt and exotic pine plantations has been severe in some areas (McNally 1955; Wilkinson
& Neilsen 1995; Di Stefano 2004).
Although not quantified, the damage caused by hares to plantation forests in New Zealand is
considered significant (Norbury & Flux 2005). Hares eat the apical buds of pine seedlings and
can strip the bark and lower branches from willow, poplar and citrus plantings (NPCA 2015).
-5-In Europe, rabbits and hares can cause significant damage to tree plantations, particularly in
winter when they are food limited (Gill 1992a). In Britain, rabbits have killed or damaged all
seedlings within small forestry blocks days to weeks after planting (Lanier 1976), and hares
have a characteristic habit of moving down a row of planted trees, browsing each in turn
(Springthorpe & Myhill 1985). Damage by lagomorphs (hares and rabbits) to seedlings in
larger forestry blocks is probably highest near forest edges (Gill 1992a).
Agroforestry research in New Zealand has shown that red deer and goats debark P. radiata
until they are about 8 years old (Knowles 1991). Goats can be particularly detrimental to the
survival of young pines (Hawke 1991). However, P. radiata are comparatively resilient to
debarking, and provided the wound is less than one-third of the tree’s circumference no
significant loss of value occurs (Knowles 1991). Other plantation species, such as lodgepole
pine (Pinus contorta), Scots pine (P. sylvestris) and Douglas fir (Pseudotsuga menziesii) are
less resilient to bark-stripping and antler rubbing, and are more likely to be severely
damaged or killed by these activities (Simberloff et al. 2003). Sika deer do little damage to
pine trees in agroforestry environments in New Zealand (Knowles 1991), but they can cause
severe damage to a variety of tree species in their native Japan by stripping bark to eat in
summer (when food is most abundant), possibly to obtain essential minerals (Ando et al.
2004). Pine needles and bark made up 10% of the diet of sambar deer (Rusa unicolor) in
coastal Manawatū, North Island (Stafford 1997).
Deer damage to plantation forests has been quantified in some temperate forest systems in
the Northern Hemisphere (Gill 1992b). Red deer in Europe have little impact on young trees
when they occur at low densities of c. 2 deer/km2, but tree growth and survival decline
quickly as the density of deer increases (starting at c. 3–4.5 deer/km2) (Holloway 1967; Kraus
1987). At very high densities (25–50 red deer/km2), young trees are killed and regeneration is
prevented (Holloway 1967; Cummins & Miller 1982). Tree survival in Britain and Germany was
unaffected by roe deer (Capreolus capreolus) at densities of 6–10 deer/km2 (Holloway 1967;
Stehle 1986), but browsing damage to conifers was strongly positively associated with an
index (faecal pellet counts) of roe deer density (Ward et al. 2008). Fallow deer at very high
densities (c. 100 deer/km2) severely reduced tree survival in Britain (Putman et al. 1989). It is
unlikely that fallow deer, or other deer species, in New Zealand would attain the density
reported by Putman et al. (1989), although herds congregating in a plantation forest could
theoretically cause similar damage if they were limited by a lack of other sources of food.
Feral pigs have been found to be capable of eating and killing large numbers of seedlings in
plantation forests in the USA (Wood & Brenneman 1977).
2.3 Pasture depletion – evidence from exclosures
With the exception of possums and rabbits, there are no published studies that have directly
assessed forage depletion by wild herbivores in New Zealand. To our knowledge, only two
studies have quantified forage off-take by possums using an experimental exclosure
approach (Spurr & Jolly 1981; Dodd et al. 2006). A field trial using wild, free-ranging possums
in pasture–forest margins in Waikato, New Zealand, found that possums ate sufficient pasture
to affect stocking rates (Dodd et al. 2006). They found that pasture yield was significantly
greater inside exclosure plots compared with outside at sites where possums were not
controlled (by c. 3 kg DM/ha/day in late winter and c. 7 kg DM/ha/day in late spring). In
-6-comparison, there were no significant differences inside and outside exclosure plots at sites
where possum control took place (Dodd et al. 2006). Conversely, Spurr and Jolly (1981) found
no significant reduction of pasture yield that could be definitely attributable to possums.
However, they suggest their results reflect the limitations of the trials (exclosures may have
had a modified micro-climate and they only covered a small area) rather than a lack of
significant possum damage.
European rabbits became established in New Zealand in the 1860s and spread rapidly in
association with sheep farming (Wodzicki 1950). By the 1870s rabbits were considered a
major agricultural pest in rabbit-prone areas, particularly in semi-arid Central Otago and the
MacKenzie district, reducing forage otherwise available for livestock and causing erosion and
soil loss at high densities (Kerr et al. 1983). Rabbit densities peaked in the 1940s, but control,
particularly using sodium fluoroacetate (compound 1080), which was first used in New
Zealand in the 1950s, greatly reduced their numbers and damage in many areas (Nugent et
al. 2012). A report in 1978 stated that rabbits had not seriously affected farm production
since about 1960, except in a few localities (Gibb et al. 1978). However, as no studies directly
estimated forage depletion pre-1960, or until 1994 (Norbury & Norbury 1996), it is difficult to
determine what effect rabbits have had on farm production (relative to other factors) over
time. In addition to short-term direct forage depletion, it has also been predicted that
stocking rates of livestock may be reduced if seed banks of palatable species are destroyed
and do not recover once rabbits are reduced to low numbers (Leigh et al. 1989).
The three studies that have directly assessed forage depletion by rabbits in New Zealand
span the introduction of RHDV, which was introduced in 1997, and therefore they also span a
range of rabbit densities (Parkes et al. 2002). Norbury and Norbury (1996) reported that more
pasture biomass accumulated where rabbits were prevented from grazing dry tussock
grassland in Central Otago. They found that rabbits reduced yield by c. 84% in spring and c.
98% in summer. This work was done before the release of RHDV, and rabbit numbers ranged
from 30–76 rabbits per spotlight kilometre (Norbury & Norbury 1996). Rabbit numbers
declined to low numbers (3–6 rabbits per spotlight km) following the release of the original
strain of RHDV, and this had a significant effect on pasture off-take (Norbury et al. 2002).
Before the virus, about 74% of accumulated pasture biomass was removed by rabbits,
compared with 34% after the virus had reduced rabbit numbers (Norbury et al. 2002). Rabbits
had a detectable impact on pasture offtake 4–6 years after the release of the virus. Pasture
grazed by rabbits and sheep on low productivity farms in Central Otago during 2001–2003
accumulated only when rabbit numbers were low (c. ≤ 10 rabbits per spotlight km) (Scroggie
et al. 2012). If rabbit numbers increased to c. 20 or more per spotlight kilometre on these
properties, pasture biomass did not accumulate in any season, and predicted stocking rates
fell to zero in the most productive season, spring, at ≥ 10 rabbits per spotlight km (Scroggie
et al. 2012).
On higher productivity farms (at which hares were also present), pasture biomass still
accumulated when lagomorphs reached c. 50 per spotlight kilometre in spring and summer
and 10–20 per spotlight kilometre in winter (Scroggie et al. 2012). Nevertheless, this had a
noticeable effect on predicted stocking rates, with dry stock equivalents declining from 13 to
5 and from 6 to 0 in summer and winter (the primary food-limiting seasons for livestock in
New Zealand; Dodd et al. 2006), respectively, when there were c. 30 lagomorphs per spotlight
kilometre (Scroggie et al. 2012). Since these studies, rabbit numbers have increased to pre-
-7-RHDV levels in some rabbit-prone areas (e.g. Lough 2009; Latham, Latham, Nugent et al.
2016) as immunity to the original RHDV strain has increased (Parkes et al. 2008). Presumably
this has resulted in concomitant increases in pasture off-take by rabbits, but this has not
been quantified.
In Australia, Short (1985) estimated from exclosure studies that 16 rabbits ate as much forage
as one sheep, but noted that not all feed taken by rabbits would be eaten by sheep. Similarly,
grazing pressure from rabbits at one site in South Australia was estimated at seven times the
average maximum stocking rate in that area (Mutze 1991; also see Zaller 1986). At ‘light to
moderate’ abundances, rabbits in Australia have been estimated to eat c. 10–47% of pasture
biomass (Gooding 1955). At ‘heavy’ or ‘very heavy’ infestations they eat between 62 and 77%,
and between 86 and 100%, respectively. Based on an interactive grazing model developed by
Barlow (1987), the economic loss caused by rabbits in productive sheep grazing systems in
New Zealand was estimated at $NZ1.1–2.1 per rabbit (1980s values, and assuming a gross
margin per stock unit of $NZ21). Clearly this imposes significant costs on New Zealand
agriculture. Attempts to estimate the average annual production loss due to rabbits
(including control costs) in the 1990s ranged from $NZ22 million (c. $NZ34 million present
value; Parkes 1995) to $NZ50 million (c. $NZ74 million present value; Hackwell & Bertram
1999).
Some species of deer, especially roe deer, fallow deer and red deer, are overabundant in
parts of Britain and Europe (Apollonio et al. 2010). Here they can reduce pasture biomass
(Rutter & Langbein 2005; Trdan & Vidrih 2008), but their damage is usually localised (Putman
et al. 2011). Moreover, damage caused by deer to agriculture accounted for comparatively
few of the total number of reported cases of damage to agriculture by any species of wildlife
(e.g. c. 1% in Britain in the 1990s; Putman & Moore 1998), and most of these reports were
related to damage to arable crops like barley, wheat, maize and sugar beet (e.g. Putman &
Kjellander 2003).
As for New Zealand, few studies have directly estimated forage depletion by wild deer in
Europe, and there are few objective data available for estimating the national economic
significance of the damage caused by deer to agriculture. Red deer reduced forage grown for
hay and silage near a forest border in Slovenia by an average 50% DW yield on plots not
protected from their grazing compared with protected plots (Trdan & Vidrih 2008). On some
of the most heavily affected sites, DW yield was reduced by 80%, but these were located
immediately adjacent to forests that provided deer with cover (Trdan & Vidrih 2008; also see
Putman et al. 2011). To our knowledge nothing is known about the effect of forage depletion
by wild deer on stocking rates or livestock production in Europe (Putman & Moore 1998;
Putman et al. 2011). Theoretically, however, such large reductions in pasture yield as reported
from Slovenia (Trdan & Vidrih 2008) should negatively affect stocking rates, or in the case of
hay and silage, force farmers to obtain additional winter feed from other sources. In North
America, damage caused by native deer to agriculture is considered a major problem, but
this also appears to be primarily to crops like corn, rather than pasture (Côté et al. 2004).
Similarly, the distribution of introduced wild deer in Australia overlaps with livestock and may
affect stocking rates, but this has not been quantified (Davis et al. 2016).
We are unaware of any overseas studies that have directly assessed forage depletion by other
species of wild herbivores present in New Zealand (e.g. macropods). However, some studies
-8-may be indicative of the damage these species might have on New Zealand pastures. Grazing
by red kangaroos (Osphranter rufus) significantly impeded the accumulation of annual and
perennial grass biomass, but not the biomass of forbs, in an exclusion experiment in
destocked open shrubland in Western Australia (Norbury et al. 1993). Although red
kangaroos primarily graze the pasture layer, whereas dama and Bennett’s wallabies also
browse woody species, it is likely that the damage caused by wallabies at high densities in
New Zealand does not differ greatly from that reported by Norbury et al. (1993) (also see
Warburton 2005a, b). We acknowledge, however, that this comparison may be affected by
different mechanisms driving the arid Australian system versus the New Zealand system
(Caughley 1987; Choquenot & Parkes 2001).
Feral goats in Australia have caused significant economic losses by eating pasture and
competing with livestock, particularly sheep in semi-arid rangeland (Harrington 1982; Parkes
et al. 1996). Henzell (1989) estimated a net average cost per feral goat to sheep graziers in
Australia of NZ$14.7 (present value) per goat (this cost accounts for profits farmers can make
from mustering and selling feral goats). The total average annual loss to sheep production
due to feral goats in Australia in the early 1990s was estimated to be c. NZ$32.5 million
(present value) (Parkes et al. 1996). Feral goats in New Zealand are most common in rocky
habitats such as cliffs along river gorges and in some forest and shrub systems, and therefore
tend to overlap pasture used by domestic livestock less than in the rangelands of Australia
(Parkes 2005). Thus, the net average cost per feral goat to sheep farmers in New Zealand
would probably be substantially less than in Australia.
Although omnivorous, feral pigs primarily consume plant matter (McIlroy 2005). Where they
overlap agriculture, feeding and rooting by feral pigs can cause significant damage to pasture
and crops (e.g. Gong et al. 2009; Bengsen et al. 2014; Gentle et al. 2015). Although feral pig
populations are limited by pasture availability in some areas (e.g. the rangelands of Australia),
they have little influence on variation in pasture biomass in those areas (Choquenot 1998).
Choquenot (1998) stated that because pigs are inefficient grazers and usually occur at low
average densities relative to other domestic and wild herbivores, competition with domestic
livestock for pasture is probably negligible in most areas. However, an economic analysis of
the economic damage caused by vertebrate pests in Australia found that feral pigs
contributed significantly to annual economic losses for grain producers and the sheep
industry (c. NZ$9 million present value) (see Table 3.13 in Gong et al. 2009). Feral pigs can
also directly affect domestic livestock, particularly sheep, via predation of new-born lambs
(Pavlov & Hone 1982; Choquenot et al. 1997; McIlroy 2005; Latham, Craddock-Henry et al.
2012). In New Zealand, loss of lambs to pigs is rare and localised, except in back-country
farms close to native forest (McIlroy 2005). Also, pigs can indirectly affect livestock by
maintaining and transmitting TB (Nugent et al. 2015).
2.4 Forage depletion – indirect estimates
Much of the information about DM consumption of forage by wild herbivores has not been
directly quantified. An alternative method is to derive estimates of DM consumption using
foraging studies from their domesticated counterparts and multiply these estimates by the
density of the wild herbivore population. This approach has a number of limitations. For
example, the proportion of daily DM intake from forage compared to other food sources (e.g.
-9-browse) will be different between domestic and wild herbivores (e.g. red deer, Nugent 2005;
pigs, Lincoln College 1972; Gentle et al. 2015). Although this proportion can be quantified
from dietary analysis, these techniques are not without bias, particularly when diet includes a
variety of plants with different digestibility or decomposition rates (Barker 1986).
Moreover, the amount of food wild herbivores obtain from pasture will be spatially and
temporally variable. For some species, such as possums (Butcher 2000) and deer (Bleier et al.
2016), it will vary depending on their proximity to the forest–agricultural edge, and pasture in
the diet may be more important in some seasons than in others. For example, in some areas
feral pigs increase their use of crops and pastures in summer compared to the rest of the
year (McIlroy 1989). Daily food intake requirements also vary with the animal’s age and
seasonal changes in the nutritional quality of the forage (Hudson & White 1985). These
factors have been quantified for domestic livestock (e.g. https://deernz.org;
https://beeflambnz.com; accessed 15 May 2018), but not for wild herbivores.
Estimated stock unit equivalents for each species of wild herbivore in agricultural New
Zealand are presented in Table 1. Values vary from 105 possums consuming the equivalent of
one SU, to 0.4 and 0.56 for red deer and fallow deer, respectively. For red deer, for example,
this means that one mature deer consumes the same amount of DM forage as 2.5 sheep.
These values need to be used cautiously, however, as they can vary greatly within a species,
primarily because the amount of forage eaten by individuals is influenced by a number of
location- and season-specific factors. These include the physiological condition of the animal,
nutritional and digestibility characteristics of the forage, and climatic conditions (Crawley
1983).
For example, Rayner (2010) estimated a maximum daily intake rate of c. 151 g kg-0.75 for
rabbits in improved semi-arid pasture in Central Otago (equivalent to 7.3 rabbits equalling
one SU; Table 1), but up to c. 223 g kg-0.75 in semi-improved pastures (equivalent to five
rabbits equalling one SU). Moreover, both of these estimates are substantially higher than
those estimated by Short (1985) and Cooke (2014) in semi-arid chenopod shrublands in
Australia (i.e. 16.5 rabbits to one SU; Table 1). They are also higher than estimates (74–80 g
per rabbit per day) derived using allometric relationships (Nagy et al. 1990). Rayner (2010)
attributed differences between studies to the physical and nutritional characteristics of the
vegetation, its availability to rabbits, and competition among wild and domestic herbivores
(which were excluded in the Rayner 2010 experiments).
- 10 -Table 1: Daily dry matter (DM) forage consumption and stock unit (SU) equivalents for the common species of wild herbivores present in agricultural areas
of New Zealand. SU equivalents were calculated as the number of individuals of a given species required to consume the annual DM eaten (550 kg) by one
New Zealand SU (i.e. one ewe)
Daily forage
Total daily
a Description of total daily Reference for total consumption 1 SU
Species Weight consumption Proportion of pasture in diet b
consumption assumption daily consumption (kg pasture equivalent
(kg DM/head)
DM/head)
Brushtail – 0.0478 Cowan 2007 30% 0.0144 105
possum – 0.080 Dodd et al. 2006
c
25% (winter) 0.0200 (winter) 45
c
1–2.1 SU depending on size, 3-year
Fallow d
– 2.71 average = 1.8 (but consumption varies Deer Industry NZ 100% 2.71 0.56
deer
depending on age and season)
1.5–3.5 SU depending on size, 3-year
d
Red deer – 3.77 average = 2.5 (but consumption varies Deer Industry NZ 100% 3.77 0.40
depending on age and season)
Meat goat (40 kg) consumes 1.2 kg Meat and Wool New Meat goats consume 30%
Feral goat – 1.05 DM/head/day; fibre goat (30 kg) Zealand 2008; Parker pasture, fibre goats consume 1.05 1.43
consumes 0.9 kg DM/head/day 1998 50% pasture
24% (16% of diet biomass from
– 1.25 500 meal units (MU) per year for a pig Gentle et al. 2015 grasses + 8% from forage 0.3 5
to reach a live weight of 91 kg by 6 sorghum in Queensland
Feral pig
months = 1.37 MU per day. Lincoln College 1972,
1.25 1 MU = 0.91 kg DM pasture based on 90 kg 100% 1.25 1.2
domestic pig
Dama
4.4 kg 0.151 100% 0.151 10
wallaby g DM/day = 0.20 * (g body mass
0.79
) Warburton &
Bennett’s (Nagy et al. 1990) Frampton 1991
13 kg 0.356 100% 0.356 4.2
wallaby
- 11 -Daily forage
Total daily
a Description of total daily Reference for total consumption 1 SU
Species Weight consumption Proportion of pasture in diet b
consumption assumption daily consumption (kg pasture equivalent
(kg DM/head)
DM/head)
0.75 Cooke 2014; Short
1.5 kg 0.092 g DM/day = 68 / (kg body mass ) 100%. 0.092 16.5
European 1985
rabbit 151 g DM / kg body mass
0.75
1.5 kg 0.205 Rayner 2010 100% 0.205 7.3
(in improved semi-arid pastures)
3–4 kg, but
0.822
up to 5 kg. 0.215 g DM/day = 0.235 * g body mass Nagy 1987 100% 0.215 7
European Assumed 4 kg
hare
0.132 kg DM/day Perry & Robertson
– 0.132 100% 0.132 11.4
(in New Zealand tall tussock grasslands) 2012
a
Weights included only for those species for which allometric relationships were used to derive daily food intake (weights obtained from King 2005)
b
Assumes 1 SU consumes 550 kg DM per year
c
Assumes 1 SU consumes 328.5 kg DM per year (based on winter consumption of 900 g per day)
d
https://deernz.org; accessed 15 May 2018
- 12 -Choquenot (1998) estimated that the daily DM intake rate of pasture by feral pigs in
Australia’s rangeland could vary from 0 to 1.4 kg for an 85 kg pig and was primarily related to
available pasture biomass. Although these estimates are similar to those presented in Table 1,
they are substantially less than those estimated for slightly larger Iberian pigs (c. 110 kg)
grazing in natural pasture in southern Spain (3.6–4.0 kg per pig, Rodríguez-Estévez et al.
2008). All of these estimates are based on pigs obtaining food exclusively from pasture, and
this produces an SU equivalent of 1.2 pigs to one ewe. However, if feral pigs include a smaller
proportion of pasture in their diet (as shown by Gentle et al. 2015), the SU equivalents can be
as much as five pigs to one ewe.
Most estimates of pasture consumption are derived from large domestic or semi-
domesticated pigs (c. 100 kg or more). Weights of feral pigs in New Zealand vary widely but
are likely to be more like 40 kg on average (King 2005). This means that per capita
consumption by feral pigs in New Zealand will be less than reported above, and the ratio of
pigs to SU equivalents will be higher. Therefore, unless the density of feral pigs is high, they
are unlikely to have a noticeable impact on stocking rates, although they do destroy pasture
with their rooting (McIlroy 2005). The results from Table 1 (if not corrected for the average
weight of feral pigs in New Zealand) may be more relevant for the damage caused by larger-
bodied feral pigs in North America and Eurasian wild pigs in Europe (weight range 44–320 kg,
Seward et al. 2004; Meijaard et al. 2011).
Hypothetical density–impact functions, assuming a linear relationship between forage
depletion and pest density (Statham 1994; Fleming et al. 2002) are shown for fallow deer and
red deer in Figure 2, and Bennett’s wallaby and dama wallaby in Figure 3. To create these, we
used the classification of Morris (2013) to acknowledge that different grassland types in
agricultural New Zealand have different carrying capacities of livestock per hectare and will
therefore be affected differently by the damage caused by wild herbivores. The three
grassland types included flat to rolling pasture, hill country pasture, and high-country pasture
(Table 1 in Morris 2013). For each of these grassland types we estimated the reduction in SUs
as a function of wild herbivore density (assuming the amount of pasture consumed per
individual remains constant as pest density increases) using the SU equivalents in Table 1
above. For both species of deer, the SU equivalent in Table 1 assumes that their diet
comprises 100% pasture. However, Nugent (2005) reports that around forest margins, only
70–80% of deer diet comprises grasses and herbs, with the remainder taken as browse.
Accordingly, we also present reductions in SUs assuming deer diet is composed of a lesser
amount of pasture (75%, the average from Nugent 2005, and a hypothetical average of 50%)
(Figure 2). The SU equivalent for wallabies in Table 1 assumes their diet comprises 100%
pasture; however, for illustrative purposes, we also present SU reductions assuming wallaby
diet is composed of 75% and 50% pasture (Figure 3).
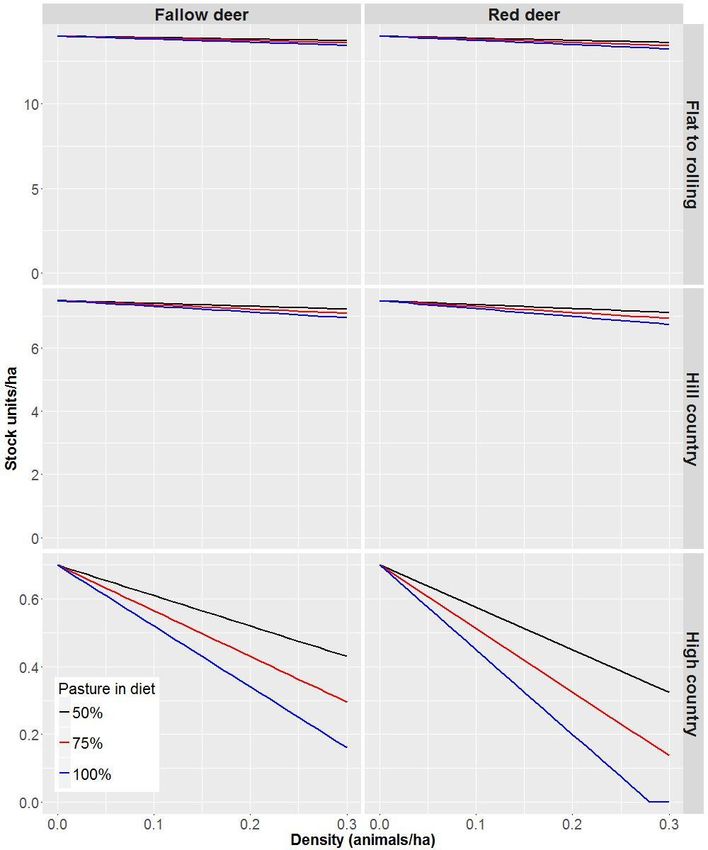
Fallow deer at high densities (0.3/ha) could reduce stocking rates per hectare by 1.9–3.9% in
flat to rolling country and 3.6–7.2% in hill country (Figure 2). For an average farm in North
Island hill country (530 ha, Morris 2013), this would represent a loss of between NZ$17,600
and NZ$35,000 per year (Table 2). In the high country, stocking rates would be reduced by
38–77% at high densities of fallow deer. Red deer at high densities (0.3/ha) could reduce
stocking rates per hectare by 2.7–5.4% in flat to rolling country and by 5–10% in hill country
(Figure 2). For an average farm in hill country, this would represent a loss of between
NZ$24,500 and NZ$49,000 per year (Table 2). In the high country, stocking rates would be
- 13 -reduced to nil at red deer densities of c. 0.28/ha. In reality, the densities of both these species
is likely to be substantially lower than 0.3/ha (Latham & Nugent 2017b), and therefore the
economic damage they cause will be substantially less than that estimated above.
Nevertheless, deer in parts of the USA and Europe can occur at densities comparable to or
higher than 0.3/ha (Côté et al. 2004; Putman et al. 2011), and historically they were in parts of
New Zealand (Forsyth et al. 2010). If permitted to increase in density on production
landscapes, our estimates are indicative of the economic damage deer have the potential to
cause.
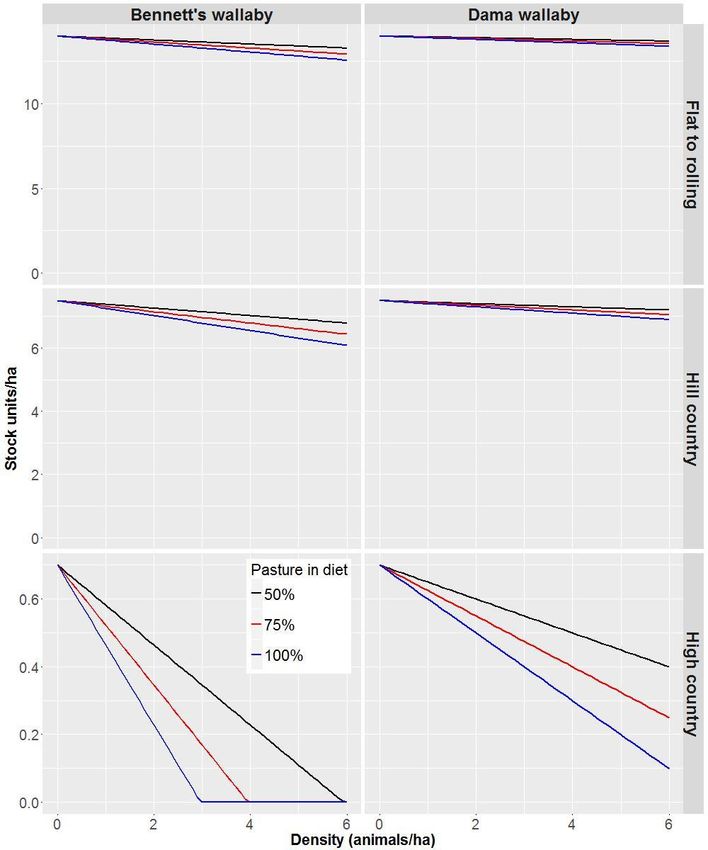
Dama wallaby at high densities (6/ha) could reduce stocking rates per hectare by 2.2–4.3% in
flat to rolling country and 4–8% in hill country (Figure 3). For an average farm in hill country,
this would represent a loss of NZ$19,500–$39 000 per year (Table 2). At intermediate
densities (3/ha) stocking rates per hectare would be reduced by 1.1–2.2% in flat to rolling
country and 2–4% in hill country (Figure 3). In the high country, stocking rates would be
reduced by 43–86% at high densities of dama wallabies. Bennett’s wallaby at high densities
(6/ha) could reduce stocking rates per hectare by 5–10% in flat to rolling country and 9.5–
18.9% in hill country (Figure 3). For an average farm in hill country, this would represent a loss
of NZ$46,000–$92,500 per year (Table 2). In the high country, stocking rates would be
reduced to zero at densities of ≥3/ha, but only if Bennett’s wallabies obtained 100% of their
diet from pasture.
We do not know if it is appropriate to use a density of 6/ha. Warburton (2005a) reports an
absolute density of >2–3 Bennett’s wallaby per hectare as comparatively high, but this
estimate was qualitative and came from a population being controlled. Therefore, we do not
know what the absolute density would be for an uncontrolled population in good habitat.
The absolute density for dama wallaby is also unknown, but given their smaller size we
assume that their densities in good habitat would be higher than for Bennett’s wallaby. In
contrast, the carrying capacity of Bennett’s wallaby has been estimated at 0.14/ha based on
an allometric relationship between body mass and density (Choquenot & Warburton 2006).
This is substantially lower than the estimates we used, but it is also lower than some
estimates for larger-bodied macropods; e.g. 0.11–0.17 per hectare for eastern grey kangaroos
(Macropus giganteus; 19–90 kg for males; 17–42 kg for females) (Hill et al. 1998), and 0.45
per hectare for western grey kangaroos (M. fuliginosus; 18–72 kg for males; 17–39 kg for
females) (Cheal 1986). The lack of robust data on absolute density is a significant knowledge
gap.
- 14 -Table 2: Stocking units of livestock with and without wild mammalian herbivores present on an
average-sized (530 ha) hill country farm in New Zealand. Estimated monetary losses from
reduced stock units are calculated assuming an average price of NZ$123 per ewe. Source:
http://www.ird.govt.nz/technical-tax/determinations/livestock/national-averages/livestock-
nationalavemarketvalues-2018.html
Pest density per Percent pasture in SU per hectare SU per hectare Monetary
Species
hectare diet without pest with pest loss (NZ$)
100% 7.5 7.230 17,586
0.15
50% 7.5 7.37 8,793
Fallow deer
100% 7.5 6.96 35,172
0.3
50% 7.5 7.23 17,586
100% 7.5 7.12 24,464
0.15
50% 7.5 7.31 12,232
Red deer
100% 7.5 6.75 48,929
0.3
50% 7.5 7.12 24,464
100% 7.5 7.20 19,597
3
50% 7.5 7.35 9,798
Dama wallaby
100% 7.5 6.90 39,195
6
50% 7.5 7.20 19,597
100% 7.5 6.79 46,204
3
Bennett’s 50% 7.5 7.15 23,102
wallaby 100% 7.5 6.08 92,408
6
50% 7.5 6.79 46,204
- 15 -Figure 2: Inferred reduction in stock units (SU) per hectare in the presence of increasing
densities of fallow deer (Dama dama) and red deer (Cervus elaphus). Reductions in SUs are
presented for three different grassland types in New Zealand, each with a different SU capacity
per hectare (flat to rolling: 14 SUs; hill country: 7.5 SUs; high-country: 0.7 SUs). Reductions in SU
per hectare are also shown, assuming that wild deer include different proportions of pasture in
their diets.
- 16 -Figure 3: Inferred reduction in stock units (SU) per hectare in the presence of increasing
densities of Bennett’s wallaby (Notamacropus rufogriseus) and dama wallaby (N. eugenii).
Reductions in SUs are presented for three different grassland types in New Zealand, each with a
different SU capacity per hectare (flat to rolling: 14 SU; hill country: 7.5 SU; high-country: 0.7
SU). Reductions in SU per hectare are also shown assuming that wallabies include different
proportions of pasture in their diets.
- 17 -2.5 Separating the effects of multiple wild herbivore species
So far this review has focused on the impacts of single species of wild mammalian herbivores
on New Zealand agricultural lands. However, most of these exotic species do not occur on
farmland or forest in isolation, and therefore their combined impacts should be assessed
(Rogers & Leathwick 1997). In these cases, disentangling the species-specific impacts of
sympatric grazing mammals is difficult (Hone 2007; Mutze et al. 2016). Also, it is often unclear
which wild herbivores must be managed to reduce the damage, and the level to which their
populations must be reduced. In New Zealand most of the studies that have assessed
damage by a species of wild herbivore have not attempted to separate the damage they
cause from that of other sympatric herbivores, including domestic livestock and waterfowl.
For example, Dodd et al. (2006) quantified the impacts of possums grazing on pasture
accumulation rates, but they were unable to discard the potential contribution of other
grazing herbivores, such as hares and rabbits, which were also present in the study area but
at lower densities. Likewise, Scroggie et al. (2012) could not disentangle the contributions of
hares and rabbits on forage depletion in semi-arid grassland in Central Otago. Thus, although
hares were often most common in areas where rabbit densities were low (Scroggie et al.
2012), the authors assessed stocking rates of sheep in relation to total lagomorph density.
In New Zealand semi-arid grasslands, rabbits are considered to have a larger effect on
stocking rates than sympatric hares and possums, primarily because of the exceedingly high
densities they can attain (e.g. 300 rabbits/ha, versus around 2 hares/ha and up to about 25
possums/ha in forest–pasture margins; Douglas 1970; Flux 2001; Cowan 2005; Norbury &
Flux 2005; Scroggie et al. 2012). Conversely, in other habitats elsewhere in the country (e.g.
South Island high country and montane grassland, central North Island), hares can be the
main mammalian grazer (Wong & Hickling 1999). In grassland reserves established on former
sheep-grazing lands in Australia, over-abundant large macropods have been shown to
impede the recovery of degraded native pastures (e.g. Norbury et al. 1993; de Preu 2006),
whereas other studies have found sympatric rabbit populations to be the main factors
preventing recovery (Leigh et al. 1989; Mutze 2006). More recently, Mutze et al. (2016) found
significant competition for food between rabbits and large macropods in Australian native
pastures. Regardless of contemporary kangaroo grazing pressure, the severely degraded
state of the pastures was perpetuated by rabbits, suggesting that historical damage by
rabbits was more severe than that caused by macropod grazing. Similarly, Dawson and Ellis
(1994) found marked competition between red kangaroos, rabbits and sheep in Australian
rangelands, with dietary overlap between sheep and kangaroos becoming more severe when
pasture conditions deteriorated during periods of droughts.
In Africa, competition for forage between cattle and grazing wildlife has been documented
(Prins 1992; Voeten & Prins 1999). However, Prins (2000) argues that this competition is
largely asymmetrical, with cattle competitively excluding wildlife species but not vice versa. In
contrast, Young et al. (2005) found that cattle grazed the grass cover to the same low levels
in plots with and without other grazing herbivores (primarily African bush elephant,
Loxodonta africana, and Burchell’s zebra, Equus burchelli), suggesting that cattle
compensated for the absence of competitors by increasing their food intake. This was
supported by observations that cattle feed significantly less in plots with elephants than in
plots without them (Young et al. 2005). The implications of this for New Zealand agricultural
systems might be that cattle, for example, can outcompete deer for forage and that deer
- 18 -change their feeding behaviour to include a greater proportion of browse. Alternatively, deer
may spatially separate from cattle and graze paddocks not stocked with cattle or other
livestock. Moreover, similar relationships may exist for species of sympatric wild herbivores;
for example, Bennett’s wallaby may outcompete deer (or vice versa) and cause a shift in the
proportional intake of forage to browse eaten by deer. Alternatively, at least at low to
moderate densities, they might not competitively exclude one another and their damage to
pasture may be additive.
An additional complexity is that coexisting species of wild herbivores might utilise available
forage differently (i.e. there might be some level of niche partitioning). For example, although
sheep and feral goats can eat similar pasture species in Australian rangelands (Landsberg &
Stol 1996), more than half the diet of domestic goats in New Zealand can be weed species
that are not eaten by coexisting domestic livestock (Meat and Wool New Zealand 2008).
Similarly, hares in New Zealand have been shown to eat proportionally fewer grass species in
pasture than rabbits (e.g. Blay 1989).
To shed further light on the relative contributions to damage caused by sympatric wild
herbivores, methods are needed to tease apart species-specific impacts. This can be done
qualitatively based on the evidence of different feeding behaviours. For example, domestic
and wild ungulates in New Zealand high country more often pull forage species out by their
roots compared with hares, and are more likely to erode soil with their hooves (Flux 1967).
These observations have been used to infer that ungulates do more damage to vegetation
than hares. Although this method can indicate which species causes the most damage, it
does not allow DM consumption per unit time to be estimated, and therefore potential
impacts on stocking rates.
Exclosure experiments are ideal. For example, Knowlton and Panapa (1982) erected three
permanent 20 m × 20 m plots in the Okataina Scenic Reserve, North Island, to assess the
damage to native forest by dama wallaby and red deer. One plot excluded only dama
wallaby, one plot excluded red deer and dama wallaby, and one plot was left open to both
mammalian herbivores as a control. This approach enabled the authors to determine that
plant species diversity was 57% higher where dama wallabies were excluded and 142% higher
where both species were excluded. Accordingly, they concluded that both species, but
particularly red deer, need to be removed or reduced to low levels to permit the recovery of
plant species diversity (also see Wright 2017). We recommend that a similar methodology be
used on agricultural land containing multiple species of sympatric wild herbivores to tease
apart their relative impacts.
3 Factors influencing decisions about herbivore control
Why do some farmers control wild herbivores on their properties and others do not? A
farmer’s decision-making process for controlling wild herbivores is influenced by many
complex behavioural and sociological factors (Parminter & Wilson 2003). Many of these
factors seem intuitive, despite being largely unquantified.
One method that has been used to help quantify these complex decision-making processes
is the Theory of Reasoned Action (a theory of human behaviour) (Fishbein & Ajzen 1975;
- 19 -You can also read