Participatory Asset Mapping - COMMUNITY RESEARCH LAB TOOLBOX - Community Science
←
→
Page content transcription
If your browser does not render page correctly, please read the page content below
Participatory
         Asset Mapping

                            A
                COMMUNITY   COMMUNITY
                RESEARCH    RESEARCH
                LAB         LAB
                TOOLBOX     TOOLBOX
                            TOOLKIT
                            APril 2012
COMMUNITY a program of
RESEARCH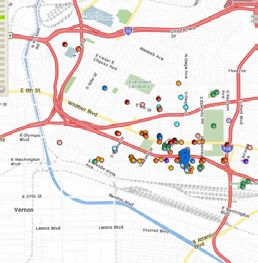
About Us Acknowledgments
Advancement Project Acknowledgments
Advancement Project (www.advancementprojectca.org) This toolkit was made possible through our work with
is a public policy change organization rooted in the civil Advancement Project’s Urban Peace Institute and such
rights movement. We engin eer large-scale systems organizations as the Alliance for a Better Community
change to remedy inequality, expand opportunity and open (ABC) and Community Coalition. Healthy City, through
paths to upward mobility. Our goal is that members of all the Community Research Lab, developed this toolkit with
communities have the safety, opportunity and health they funding from First 5 Los Angeles. This and other toolkits
need to thrive. Advancement Project’s Programs include: can be accessed through the Healthy City website at
Educational Equity, Equity in Public Funds, Healthy City, www.healthycity.org/toolbox.
and Urban Peace Institute.
Healthy City Content
Healthy City (www.healthycity.org) is an information Authors: Janice C. Burns, M.A.; Dagmar Pudrzynska Paul;
+ action resource that unites community voices, rigor- and Silvia R. Paz, B.A.
ous research and innovative technologies to solve the
root causes of social inequity. We transform how people Editors: Taisha Bonilla, M.T.S.; Deanna Cooke, Ph.D.;
access and use information about their communities. As and Tahirah Farris, AICP, M.PL
a program of Healthy City, the Community Research Lab
partners with community-based organizations to develop, Design
implement, and disseminate data/ mapping projects, tools,
and workshops that promote community knowledge and Rosten Woo and Colleen Corcoran / bycommittee.net
Community Based Participatory Action Research.
For more information, visit
www.advancementprojectca.org or contact us at
(213) 989-1300.
Copyright Dec. 2011 Advancement Project – Healthy City
Updated April 2012
All rights reserved. Use and reproduction of these mate-
rials in any format should be credited to Advancement
Project- Healthy City Community Research Lab. Materials
are not to be used or sold for commercial purposes
or profit.
PARTICIPATORY ASSET MAPPING 1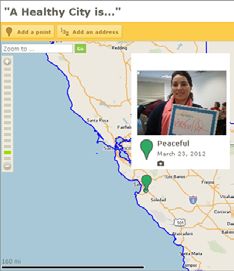
About the Toolbox                                             About this Toolkit
Healthy City supports communities in identifying, organiz-    How can this toolkit be used?
ing, and sharing its collective voice with decision makers
at the local and state levels. Through the Community          ++ As an instructional toolkit for using and applying
Research Lab, we share best practices and methods for            Participatory Asset Mapping. Community-Based
Community-Based Organizations (CBOs) interested in               Organizations can use the concepts, methods, and
supporting their strategies with research that combines          tools provided, such as the Community-Engaged
community knowledge with Healthy City technology.                Mapping Facilitation Guide and Guide to Planning a
Toward this aim, we have developed the Community                 Community-Engaged Mapping Event, to host an event
Research Lab Toolbox.                                            or activity that collects knowledge and experiences
                                                                 from community members about local assets.
The toolbox presents research concepts, methods,
and tools through topical guides and toolkits such as         ++ As a workbook for workshops on using
Community Research, Participatory Asset Mapping, and             Participatory Asset Mapping as a tool for
a Short Guide to CBPAR (all of which can be accessed             identifying community strengths and supporting
at www.healthycity.org/toolbox). It is based on best             change initiatives. It can be used to help plan and
practices from our work with CBOs and a unique approach          facilitate a workshop on how to implement an asset
to the Community Based Participatory Action Research             mapping event in your organization or community.
(CBPAR) framework, which promotes research that:
                                                              ++ As a resource and information guide for conducting
1. Starts with issues and strategies then produces               research within the CBPAR framework.
   analysis that informs action

2. Uses mapping technology to engage organizations            What will you find in this toolkit?
   in the research process
                                                              ++ Key research concepts and methods
3. Is both community-based and place-based,
   often focusing on a geographic place such as a             ++ Additional Tools You Can Use, with in-depth
   neighborhood                                                  guides for applying the concepts and methods

The toolbox’s CBPAR framework explicitly focuses on           ++ Glossary terms in BOLD
community-based organizations that bring together com-
munity members to visualize and actualize research and        ++ Notes like the one below to write down any
its outcomes. This includes non-profit organizations that        thoughts or ideas you have as you read
operate in specific, local communities and are staffed by,
work with, represent, assist, and/or advocate on behalf
of residents of those communities on issues that affect        How can this toolkit be useful in your
their quality of life. These organizations have worked to      specific work or projects?
gain trust among community members and have brought
together a spectrum of people with varying ideas and
perspectives that unite around a particular set of concerns
relevant to a large portion of the community. Though
it may have utility for other groups, it supports these
organizations whose work directly engages community
members in creating change.

PARTICIPATORY ASSET MAPPING			                                                                                 2
This page left intentionally blank. PARTICIPATORY ASSET MAPPING 3
Contents

I.   What is Participatory Asset Mapping?		       6

II. Why should you do it?		                       7

III. When should you do it?		                     8

     -- Using Asset Maps in Advocacy and Policy		8

     -- Using Asset Maps in Community Outreach		8

     -- Using Asset Maps in Community Organizing		9

IV. How do you do it?		                           10

     Methods										10

     -- Community-Engaged Mapping 		10

     -- Social Investigation 		11

         Interviews

         Surveys

         Community Walks

     Tools										12

     -- Online Mapping                            12

PARTICIPATORY ASSET MAPPING			                         4
Contents
V. What do you do with your results? 13
-- Analysis 13
-- Reports 14
-- Presentations 14
-- Databases 14
VI. CONCLUSION: Community Knowledge on the Map 14
VII. Glossary 15
VIII. Additional tools you can use 18
-- Appendix A: Case Study: Using Participatory Asset Mapping for Advocacy and Policy
in Boyle Heights and East Los Angeles (Alliance for a Better Community) 19
-- Appendix B: HealthyCity.org WikiMaps User Guide (formerly Live Mapping) 20
-- Appendix C: Community-Engaged Mapping: Planning an Asset Mapping Event 23
-- Appendix D: Community-Engaged Mapping: Asset Mapping Facilitation Guide 26
-- Appendix E: Ethics in Community Based Participatory Action Research 40
IX. References 41
PARTICIPATORY ASSET MAPPING 5What is Participatory Asset
Mapping?
Imagine moving into a new neighborhood. As a new providing information about a community’s assets, or
resident of this neighborhood, you may want to know the the status, condition, behavior, knowledge, or skills that
location of the closest major grocery store or the largest a person, group, or entity possesses, which serves as a
library, the best local restaurant or elementary school. You support, resource, or source of strength to one’s self and
may have many options for finding this information but others in the community. Together, these two concepts
your best option would be to ask someone who lives there. inform Participatory Asset Mapping, a process where
Your new neighbors could direct you to the location of community members collectively create asset maps by
the grocery store or elementary school, as well as offer a identifying and providing the information about their own
wealth of information, contacts, and personal experiences community’s assets on a map.
about them.
In Participatory Asset Mapping, community members
Now, imagine working with a group of your neighbors to specifically identify community assets. Community
identify the locations of these local resources and places Assets include citizen associations and local institutions.
on a map, with information and personal experiences Citizen Associations reflect informal and formal institu-
about each. This would be the beginnings of your own tions found within a community, such as social groups,
Participatory Asset Mapping activity. Participatory Asset recreation programs, churches, and block clubs.i Local
Mapping combines the concepts of participatory mapping Institutions reflect institutions that reach into the com-
and asset mapping. Participatory Mapping is the process munity, such as non-profit organizations, businesses, social
of creating a tangible display of the people, places, and service agencies, health services (hospitals and clinics),
experiences that make up a community, through com- libraries, schools (children and adult schools), colleges or
munity members themselves identifying them on a map. universities.ii
Asset mapping is the general process of identifying and
Community members can provide knowledge about their individual What do you consider an “asset’? what
assets and community assets. Participatory Asset Mapping is a are some of your community assets?
process where they specifically identify Community Assets, which
include citizen associations and local institutions.
COMMUNITY ASSETS
INDIVIDUAL ASSETS
ift a
ls
G
so
f Individu
Ci
tiz ns
en Associatio
Loc
al Institutions
PARTICIPATORY ASSET MAPPING 6Why Should You Do
Participatory Asset Mapping?
Participatory Asset Mapping can support strategic plan-
ning efforts by building on existing community strengths. It Participatory Asset
recognizes human capital and the capacity of individuals to Mapping can help
use their own hearts, heads, and hands to build and create
positive structures in their communities. As a Community communities:iii
Based Participatory Action Research (CBPAR) process,
it promotes community involvement and participation. It ++ build on and expand existing com-
can build community cohesion and empowerment, bring munity strengths
community members together to generate a shared
awareness and understanding of community assets, as a ++ Facilitate community involvement
method of facilitating community involvement in research, in research and action
decision-making, and action.
++ generate a shared awareness and
Community assets can be easy to identify, locate, and understanding of community assets
map, especially when community residents are the sources
of the information. For example, you can plan and hold a ++ Articulate and communicate spatial
Participatory Asset Mapping event that brings together knowledge to external agencies
a group of community residents to identify and discuss
the assets in their community. The discussion may begin ++ Manage resources, community
with community members defining the term “asset” or development, and planning
confirming and enhancing a proposed definition. Using
their definition and through facilitated dialogue, they can ++ identify and potentially increase
identify the places that fit this definition on a map, in capacity within communities
the process, finding out about assets they may not have
been familiar with or that their neighbors have similar per-
spectives about. See Appendix C: Community-Engaged
Mapping: Planning an Asset Mapping Event on page 23
for information about planning this type of event.
Participatory Asset Mapping can also lead to discussions
and maps that not only reflect community assets, but
also barriers to accessing them. During the Participatory
Asset Mapping events discussed in Appendix A (pg.
19), many residents stated that they did not go to local
grocery stores because they felt they were unsafe. This
reveals how organizations can use this research method to
identify places that can become assets through targeted
improvement.
PARTICIPATORY ASSET MAPPING 7When Should You Do
Participatory Asset Mapping?
Strategies that involve Participatory Asset Mapping allow Using Asset Maps in Advocacy and Policy
communities to take a strengths-based and place-based
approach to community development.iv In your work or Maps that highlight the availability or lack of community
organization, consider the following: assets can present a powerful tool, when trying to make
a case for needed policy, whether locally or on a state
level. Such maps can focus on community assets, how to
Are you: strengthen them and in turn how this would help address
community needs. Other supporting community data can
be presented on a map alongside your mapped assets,
ƗƗWorking in/expanding the scope of such as charts or personal narratives. The case study
your work into a new neighborhood? in Appendix A highlights one example of an organiza-
tion that used participatory asset mapping to support
ƗƗworking in a neighborhood where policy changes in the communities that they served.
there appears to be a lack of qual-
ity resources and services?
Using Asset Maps in Community Outreach
ƗƗInterested in finding out which
community resources residents Mapping your community’s assets helps visualize the
use and consider assets and why? networks of service organizations, community organiza-
tions, neighborhood associations, and other groups that
ƗƗSeeking to identify which resources exist to serve the community. Community organizations
are missing from the community? can use these maps to network among each other and
create a database of assets that community members
ƗƗEngaging and working with com- can access and maintain. These new connections can
munity members to improve existing also serve as a means to outreach to a wider span of the
resources? community to further strengthen community resources.
If an asset map was combined with data showing other
community information (such as where most people live or
If you answered “yes“ to any of the questions above, the number and locations of parks and recreation spaces),
Participatory Asset Mapping can provide critical research organizations can use asset maps for targeted outreach
and information that can benefit your strategy. to residents that represent specific neighborhoods or
demographics.
Asset maps created through a Participatory Asset
Mapping process can identify and illustrate the existing or
potential connections between groups, organizations, and
institutions. The following section highlights three specific
strategies that have used these types of asset maps:
PARTICIPATORY ASSET MAPPING 8Using Asset Maps in Community Organizing community resources. Participatory Asset Mapping can
also be used as a tool to raise community awareness and
By involving community members in the creation of asset empowerment and show the impact of these organizing
maps, the process itself can be an organizing tool. In addi- efforts.vi For example, many community members identi-
tion, the asset maps themselves can serve as useful tools fied the school that is located in the center of the map
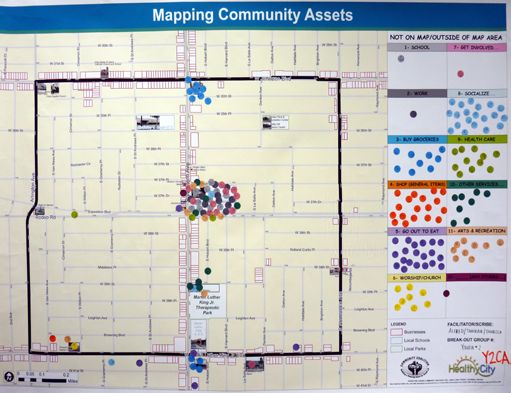
for organizing.v The “Mapping Community Assets“ map below as a major asset because, in addition to education,
below provides an example of asset maps created as a it offered other services for families such as a health clinic.
result of and to inform community organizing. Community
organizers and residents engaged in Participatory Asset
Mapping to identify local assets by specific community
asset categories such as grocery stores, churches, and what are some other ways you/others
so forth (the Asset Mapping Worksheet at the end of have used asset maps?
Appendix D was used as a guide for the map below, where
the color coding, represents different types of resources).
Through these activities, the community confirmed that
organizing to improve one particular unsafe and unused
local park could transform it from a deficit to an asset.
By engaging community residents in a process of identify-
ing existing or missing community assets, organizations
can paint a clear picture of the overall status of the com-
munity and organize around the cause of strengthening
PARTICIPATORY ASSET MAPPING 9How Do You Do Participatory
Asset Mapping?
Now that you are familiar with what Participatory Asset
Mapping is, why it is useful, and instances when it can be Methods
used, you may be interested in how to do it.
First, start with your research question. Think about Community-Engaged Mapping (CEM)
the issue or project that you are working on. Think about
the types of community assets that you are interested in Community-Engaged Mapping (CEM) is a group
capturing or the specific information that you need about mapping exercise designed to answer specific research
these assets. In conducting a participatory asset mapping questions and gather feedback from community members
activity, typical research questions may include: (who live, work or attend school in the area), for the purpose
of developing place-based planning, policy, and interven-
++ Which places (such as parks or businesses) do tions.viii It can be described as a focus group around a map.
residents go to most in the community? Do they It involves community dialogue over maps of a particular
consider these places assets? place or geographic area (such as a neighborhood) about
community members’ experience with the physical environ-
++ What types of ‘ ’ assets exist in this ment of that place. With Community-Engaged Mapping,
community? Examples of ‘ ’ could be community members are formed into small, breakout
‘health’ assets, ‘educational’ assets, or ‘arts and groups that allow them to collectively discuss and map
recreation’ assets. their communities (for this exercise, when using large paper
maps, breakout groups should be no more than 10-12 people
Appendix D (Asset Mapping Facilitation Guide, pg. 26) per group; when using computers and maps online, they
includes a list of different types of assets that may be help- should be no more than 4-5 people per computer).
ful in creating a research question about assets. You can
also refer to the Community Research toolkit for details Community-Engaged Mapping can be used to have
on how to create a research question. community residents identify locations of: local assets;
assets that they travel outside of their neighborhood
Next, choose a method and tool to collect information to access; resources that community members believe
about assets. The method is how you will collect this infor- can be improved or developed to become assets; and
mation; it’s the process by which you collect it. The tool is resources that are missing. The map on page 11 shows
what you use to record or document the information that results of a Community-Engaged Mapping event focused
you collect. You can combine any of the following methods on Community Assets; it is a digitized version of all of the
and tools to collect community assets. Use the methods maps created at the event combined (which included the
as the means for collecting the information and the tools map on page 9). Community members identified places
as the place to document and record this information. in the community that they frequented and whether or
Many methods and tools exist to help organizations and not they were assets by giving those resources grades
communities apply Participatory Asset Mapping to identify (for information about the asset categories listed, see the
the locations of and their experiences with community Asset Mapping Worksheet on pgs. 35-36). Appendices C
assets. Here, we highlight a few. (pg. 23) and D (pg. 26) provide step by step instructions
on planning, implementing, and facilitating a Community-
Engaged Mapping exercise or event.
PARTICIPATORY ASSET MAPPING 10Places Identified within the Vision for Change Focus Area as Assets/Non-Assets
thin the Vision for Change Focus Area as Assets/Non-Assets By Category
W 29th Pl
are not research subjects, A+but participants in the
WW30th
29thSt
Pl
S La Salle Ave
Cimarron St
S Hobart Blvd
Places People Frequent Within the
Brighton Ave
Halldale Ave
research process. During interviews, it is important to
Dalton Ave
W 30th St A+
10th Ave
W 30th St
S La Salle Ave
Cimarron St
S Hobart Blvd
Raymond Ave
Kenwood Ave
Van Buren Pl
Brighton Ave
Halldale Ave
Community by Category and Grade
Walton Ave
Dalton Ave
W 30th St W 30th St
Arts and Recreation simultaneously
W 31st St develop a positive rapport and gather
W 31st St
Buy Groceries
A+
useful information. AB positive rapport refers to a
W Jefferson Blvd B
A+ Get Involved
B C
B
A A A
B
A
harmonious
C B
relationship
B
A
between the interviewer and
AB B B
A A A B ABDB B A
D Go Out to Eat A
B A CA the interviewee, thus
W 35th St
building
B A CA
A B
trust and allowing for the W
A B A A B St
W 35th
free flow of information.ix BThere W 35thare several different
S Budlong Ave
Health Care A A B
Denker Ave
B St
St Ave
8th Ave
W 35th Pl
S St Andrews Pl
Other W 35th Pl W 35th Pl
S St Andrews Pl
W 35th Pl
types of questions you may want to include in
B your
9th Ave
B
Denker
B 6th Ave B B B
7th Ave
B-/C+
Cimarron St
B-/C+
3rd Ave
Other Services
3rd Ave
W 36th St B B
W 36th St
interview, but mainly you’ll be focusing on descriptive
5th Ave
B W 36th St B
4th Ave
Cimarron
School
2nd Ave
2nd Ave
questions, which are meant to gather information
S Van Ness Ave
S Van Ness Ave
Shop (General Items) W 36th Pl W 36th Pl
C about a particular topic, such as community assets,
Raymond Ave
Socialize C
W 37th St W 37th St W 37th St W 37th St
S Gramercy Pl
and many times will be open-ended to allow for the
S Gramercy Pl
S Catalina St
Ruthelen St
Work
Expo
Ruthelen St
sition W 37th Pl
e
Blvd
interviewee
W 37th Pl
to
W speak
37th Pl freely. Remember thatWif37thyou’re
Av
Worship/Church A
Expo A A+ A+F A Pl
sition B A A A+F
9th
Pl A A B F A B B B BA B A+ A A
A = It is an asset
A A
A A B B B focused on developing
A
A A an
W 37th
A B F asset
Dr
B B B BAmap, you’ll need to
F = I go there, but it is not an asset B
AA B
A A+ A B B
A A A B B B
Rodeo Rd B A A A A A AA A B A gather
Exposition Blvd geographical B information,
AA B
A A+ A B B
A
such as addresses
B A A A A A AA A B A Exposition Blvd
Coliseum St Rodeo Rd
F A+ B
or ZIP codes during the F
interview process.
Sutro Ave
W 38th St A+ B W 38th St
S Hobart Blvd
A
W 38th St
Cimarron St
S Hobart Blvd
Walton Ave
A
S Budlong Ave
++ Surveys A W 38th Pl
Cimarron St
Rolland Curtis Pl D
A W 38th Pl A
W 38th Pl
Middleton Pl
B
If you decide to do aAWDsurvey 39th St asking residents and
Norumbega Ct
Roxton Ave
Ave
B
A
organizations to identify assets in their community,
OlmstedAve
B Middleton Pl
S Gramercy Pl
Ave
W 39th St A B
Brighton Ave
Westside Ave
Welland Ave
A A B A
Arlington Ave
you have many different B W 39th Ploptions—in person,
Arlington
A A AA A C
S Gramercy Pl
Hepburn
A W 39th St A B
Brighton Ave
C A A
W 39th Pl ABA A
telephone, e-mail, Aetc. AYou will have to choose the
C
Pl
Dublin Ave
Leighton
A Ave
C
S St Andrews Pl
S Wilton
W 39th Pl
type that is right for you and the audience you’re
6th Ave
Leighton Ave F F B Leighton Ave
S Wilton Pl
tryingBlvd to reach. ForAveexample, B in Leighton
communities with
S St Andrews Pl
Sutro Ave
Browning Leighton Ave
Browning Blvd F F
A C
low literacy rates written surveys may not be Browning Blvd
A Browning
B Blvd W Martin Luther King Jr Blvd
CB C A C ideal and you
C may want to turn to other methods
S Gramercy Pl
C B C
Social Investigation F+ A
(For more detailed information on surveys as B
S Western Ave
W 41st St BC W 40th Pl
Ave
S St Andrews Pl
S Raymond Ave
Ave Ave
La Salle Ave
Halldale Ave
Denker Ave
CB
Dalton Ave
C C
S Harvard Blvd
general data collection Ctools, Cplease refer to the
S Hobart Blvd
8th Ave
S Gramercy Pl
lvd
S Normandie
k B
9thNess
W 41st Dr C W 41st St
S Western Ave
B W 41st St F+
S Normandie Ave
A- B
t
Pl
S Van Ness Ave
Social Investigation er is a broad term that encompasses “Community
W 41st Pl Research Toolkit”).x
La Salle Ave
Halldale Ave
Denker Ave
im
S St Andrews
Dalton Ave
S Van
S Harvard Blvd
S Hobart Blvd
Le W 41st Pl
Garthwaite Walk W 41st Pl
many dA
v different methods
e
Av
e of gathering community knowl-
W 41st Dr A-
ee lvd ite
Sutro Ave
W 41st Pl
edge
Cr tB
through a community-engaged approach. With + + Community Walks
5th Ave
4th Ave
r w a W
e W 41st Pl
i m a rth Miles
Social
ed by Healthy City, August e
L02009. Investigation,
Places/Assets/Non-Assets
0.1 G 0.2 community members
Identified by Community collect
Participants June andfor Change A
6, 2009. Vision community
Community Map walk is a method where you walk
ntified by Community Coalition, 2008. School data from LAUSD and L.A. County Office of the Assessor, 2008. Geographic data from Navteq, 2009.
map information on an individual basis, which may be through a neighborhood of interest to map out and col-
combined at a later time. Organizations
Map created by Healthy City, Augustmay2009.
conduct lect information
Places/Assets/Non-Assets about
Identified by Community that neighborhood’s
Participants resources
June 6, 2009. Vision for Change
Area Identified by Community Coalition, 2008. School data from LAUSD and L.A. County Office of the Assessor, 2008. Geographic data from Navteq, 2009.
Community Map
social investigation before or as an alternative to a group and dynamics. It provides a first-hand view of the
mapping session such as Community-Engaged Mapping community, its people, and its assets and can naturally
to effectively identify community assets and create asset provide all the location information you need to put your
maps. These methods differ from traditional information assets on the map. A small map can be used as a tool
gathering methods in that they focus on gathering infor- to directly record asset locations, as well as a guide for
mation directly from people and communities, instead of your walk. You can combine the walk with interviews
about people and communities (from secondary sources). of community members along your walk, to find out
Widely recognized and used methods of social investiga- more about specific assets in detail. A community walk
tion include interviews, surveys, and community walks, also offers the opportunity to take pictures and video
which are further described below. of local assets, that can be placed on a map using the
tools outlined on the next page.
++ Interviews
Conducting interviews is a very common way of
collecting information from all types of audiences.
When conducting interviews with community
members, it is important to keep in mind that they
PARTICIPATORY ASSET MAPPING 11is available for the state of California).vii You can also search
Tools for community services, research and share community
data, or create charts.
Online Mapping HealthyCity.org’s “Wikimaps” feature (formerly “Live
Mapping“) allows communities to place points and draw
Online mapping is mapping software that is available on lines and shapes on a map. You can use Wikimaps to
the internet through various sources and organizations facilitate a participatory mapping process and easily add
(such as Healthy City, Google Maps, etc.). As a tool for points, pictures, video, and detailed information from
Participatory Asset Mapping, it can be used to work community members about the places they consider
with community members to plot, map, and view their assets. The added benefit of comparing the asset maps
assets with just the click of a button. Multiple users that you create with the secondary data available on the
can access the same map to add points that represent website makes it a powerful asset mapping tool. For step-
assets and information about them. Although different by-step instructions on using Wikimaps, see Appendix B:
mapping tools are available both on and off the internet HealthyCity.org Wikimaps User Guide (pg. 21) and visit
for a variety mapping purposes, we have highlighted http://www.healthycity.org.
two online mapping websites because of their cost
(free!) and usefulness in facilitating Participatory Asset Google Maps—“My Maps”
Mapping. The HealthyCity.org and Google websites
offer mapping with different features, yet both allow
you to create, save and share maps, mapping features
needed most for Participatory Asset Mapping.
Healthy City— “Wikimaps” (formerly “Live
Mapping”)
http://maps.google.com/maps
Google is a website known for its search feature that
enables searches for information, including places (such
as businesses), web pages, images, videos, across the
world. It offers free mapping capability, particularly as a
guide for on-the-ground navigation of places and routes.
http://www.healthycity.org It also provides the ability to create personalized maps
through the “My Maps” feature.
The Healthy City data and mapping website is California’s
information + action resource for service referrals and The website’s My Maps feature allows you to create
social change. Healthy City provides a free platform for countrywide maps of places and routes and add text,
community organizations without access to specialized photos, or video. You can share the maps with others, who
software to create and manipulate professional maps. can either view the map or make edits. You can add local
Organizations can use their own data or choose from an businesses and other locations to your map by searching
extensive list of administrative, secondary data available near a location. For further directions, on how to navigate
from many reliable and widely used sources for various Google Maps, please visit their maps support page at:
geographies throughout California such as census tracts, http://maps.google.com/support.
cities, counties, and so forth (Note: the data and mapping
PARTICIPATORY ASSET MAPPING 12What Do You Do With Your
Participatory Asset Mapping
Results?
What are the best ways to analyze and present the
information you collect back to the community? Below Qualitative Data Analysis:
you’ll find some examples of different data analysis and Looking for Themes in
presentation options.
the Dataxi
Analysis ++ Read the data and note any common
ideas or themes.
Participatory Asset Mapping can provide a straightforward
framework for analysis. When using online mapping tools ++ Create categories or major topic
(such as the ones highlighted on pg. 12), you can receive areas and reorganize the data into
an instant picture of community assets, that may help these categories
answer your original research question . A quick review
and analysis would be observing those areas where assets ++ List emerging themes after reading
are clustered compared to areas where assets are sparse. again, to identify sub-categories to
When using table-sized, paper maps in particular, you may step #2
also use a Geographic Information System (GIS) to
input the locations identified by community members. ++ Rank the order of each theme by
You can digitize the points placed by participants onto how frequently they appear
the table-sized maps by importing them into a GIS map-
ping platform and software. The identified community ++ Summarize the themes that emerge
resources can be sorted by different themes relevant to
the Participatory Asset Mapping activity. For example, the ++ Determine your findings by high-
total number of assets identified can be counted by any lighting key patterns or results
specific categories that may have been identified (such
as grocery stores, schools, etc). You can search resident
responses for key words relevant to your original research
question or goal for mapping assets.
You can highlight the common themes from the maps
Participatory Asset Mapping can also yield extensive and discussion notes, such as which assets were identi-
qualitative data, in the form of experiences, perspec- fied most by community members and where they were
tives, and information relayed by community members. located. Again, use your original research question to help
This data can be analyzed to uncover general themes. To uncover these themes and guide your analysis. Specific
analyze this qualitative data, you can use standard focus stories, events, examples, experiences, and observations
group data analysis methods, reading discussion notes to provided by community members should also be noted,
find commonalities, according to the break-out groups (in especially as they relate to common themes. Other
the case of Community-Engaged Mapping) and generally information, questions, or concerns that arose, that were
across all of the assets collected. The list above includes outside the scope of the activity, should also be noted.
useful steps in analyzing the qualitative data gathered
through a community asset mapping process.
PARTICIPATORY ASSET MAPPING 13Reports database that was created through an asset-mapping
process, visit UC Santa Cruz’s Educational Partnership
Using the right approach, reports can be easy to read and Center website).xii This type of data presentation can
distribute, and offer a formal way of showing results of your prove useful as long as it is organized in a clear to under-
participatory asset mapping. Including a well-formatted stand and easy to refer to manner.
asset map automatically creates a visual feature that
most readers can reference and identify with. By placing
it alongside a more detailed write-up of community demo-
graphics, it provides the audience with a comprehensive
picture of a community. For example, if your goal is to use Conclusion: Community
the asset map to influence policies around development
in the community, providing maps and resident testimony Knowledge on the Map
in one report can be a powerful tool. The length and tone
of a report may depend on the audience.
Participatory Asset Mapping offers a visual representa-
Presentations tion of community knowledge. It produces critical pictures
of community knowledge and goals that can be used to
Sometimes presenting your findings to a group of people achieve recognition of community strengths and imple-
may be intimidating, but including asset maps in your pre- ment place-based solutions. The asset maps created
sentation is guaranteed to elicit some “ooohs” and “aaahs” through Participatory Asset Mapping go beyond maps
from your audience. Using the tools referenced earlier in that highlight need, beginning the conversation with what
this toolkit, you’ll be able to provide your audience with works and what’s here in the community, instead of what
the visuals necessary to convey the community’s assets, doesn’t work and what’s missing. They represent a socially
as seen through the eyes of the residents either through or culturally distinct understanding of the community, and
embedding your map directly into your presentation or include information that may be excluded from main-
going to the online location of your asset map for an stream maps that represent the views of groups outside
interactive presentation. Some benefits of doing presenta- of the community. In combination with other Community
tions include being able to answer any questions that the Based Participatory Action Research tools and methods,
audience may have, and guiding your audience through Participatory Asset Mapping and the results that it pro-
the asset mapping process with visuals, hand-outs, and duces can act a medium of empowerment, promoting
other details that may not have been appropriate for a research by and for community members actively seeking
formal report. Presentations, if packaged in a portable to strengthen their community.
format such as video, webinars, or Power Point slides,
can also be easily shared among those who could not For further step by step instructions for using and applying
attend in person. many of the methods described in the previous sections,
see the tools and references included in the Additional
Tools You Can Use Section (Appendices A-E).
Databases
In addition to providing assets as points on a map, since
you collected information directly from the community,
you can develop an asset database that is relevant to the
needs of the people living in it. An Asset database can
be disseminated electronically, posted for reference on a
website, or created into a hard-copy reference guide for
community assets. It can include all types of details on the
services, including languages spoken, child care options,
transportation options, and service areas. Having all of this
valuable information in one database can prove extremely
helpful for direct service providers who may need to refer
clients to several different types of services to provide
comprehensive assistance (for an example of a service
PARTICIPATORY ASSET MAPPING 14Glossary
Asset research that involves all stakeholders throughout the
The status, condition, behavior, knowledge, or skill that a research process, from establishing the research ques-
person, group, or an entity possesses and which serves tion, to developing data collection tools, to analysis and
as a support, resource, or source of strength to one’s self dissemination of findings.
and others in the community.
Individual Assets – Assets which can also be referred Community-Engaged Mapping
to as gifts of individuals, such as skills, training, education, A group mapping exercise designed to answer specific
specific talents, networks, and monetary resources. research questions and gather neighborhood-level pri-
mary data from community members (who live, work or
Community Assets – Citizen Associations, which can attend school in the area), for the purpose of developing
include informal and formal institutions found within a place-based planning, policy, and interventions.
community, such as social groups, recreation programs,
churches, and block clubs. Local Institutions, which
include institutions that reach into the community, such Community Walk
as businesses that create local job opportunities, social A data collection method where researchers walk
service agencies, health services (hospitals and clinics), through a neighborhood of interest to map out and col-
libraries, schools (children and adult schools), colleges or lect information about that neighborhood’s resources and
universities. dynamics, for the purpose of community organizing and
development.
Asset Mapping
The general process of identifying and providing informa- Data
tion about the strengths and resources of a community Measurements of any characteristics of interest. Ex: How
on a map. It supports strategic planning efforts to address many children live here? How do teenagers feel about
community issues by building on resources and strengths. homework? What type of detergent is most popular
among grocery store shoppers? How many liquor stores
are there in my neighborhood?
Breakout Groups
Small groups of people created or divided up from a large
group of people to discuss, or do an activity related to, a Focus Groups
specific question, issue or topic (with each small group A primary data collection method that involves interview-
usually reporting their discussion back to the large group). ing participants in a group generally composed of no more
than 10 people who were selected because they share
certain characteristics relevant to the purpose of the
Coding research. For example, if your research question focuses
A systematic way in which to condense extensive data on the quality of food in the community, your focus group
sets into smaller analyzable units through the creation of may include residents (parents, children, business owners)
categories and concepts derived from the data.xiii who live locally and regularly depend on the food outlets
in your community of interest.
Community
A group of people living in the same locality, a group of Geographies
people sharing common interests or similar identity, or the Spatial (non-physical) boundaries (also, units) for which
district or locality in which such groups live. data is collected. On the HealthyCity.org site, these are
shapes that represent boundaries, usually established by
socio-political decisions, for which secondary or admin-
Community Based Participatory Action istrative data is collected. Here are just a few common
Research (CBPAR) geographies.
CBPAR aims to address the practical concerns of people
in a community. CBPAR is a collaborative approach to
PARTICIPATORY ASSET MAPPING 15Glossary
Census tract – A census tract is a small, relatively per- Interviews
manent statistical subdivision of a county delineated by a A primary data collection method which involves the use
local committee of census data users for the purpose of of open-ended questions aimed to obtain information spe-
presenting data. Census tract boundaries normally follow cific to research needs in a one-on-one setting between
visible features, but may follow governmental unit bound- a researcher and a participant.
aries and other non-visible features in some instances;
they always nest within counties. Designed to be rela-
tively homogeneous units with respect to population “Live Mapping” on HealthyCity.org (see also
characteristics, economic status, and living conditions at Wikimaps)
the time of establishment, census tracts average about A past feature on HealthyCity.org that allowed multiple
4,000 inhabitants. They may be split by any sub-county users to plot points, lines and shapes on the same map
geographic entity. simultaneously, which was revamped, enhanced, and
renamed “Wikimaps.“
Block group – A block group is a subdivision of a census
tract (or, prior to 2000, a block numbering area). It is the
smallest geographic unit for which the Census Bureau Neighborhood
tabulates data. A block group consists of all the blocks A district or area with distinctive characteristics, or the
within a census tract, beginning with the same number. physical space of a localized area.
Block groups generally contain 600 - 3,000 people.
ZIP Code – A ZIP (Zone Improvement Plan) Code is a Participatory Asset Mapping
five-, seven-, nine-, or eleven-digit code assigned by the A process where community members collectively create
U.S. Postal Service to a section of a street, a collection of asset maps by identifying and providing the information
streets, an establishment, structure, or group of post office about their own community’s assets on a map. It com-
boxes, for the delivery of mail. The Census uses the ZIP bines the concepts of participatory mapping and asset
Code Tabulation Area (ZCTA) instead of the ZIP Code for mapping.
data. A ZIP Code Tabulation Area is a geographic area that
approximates the delivery area for a 5-digit or a 3-digit ZIP
Code. ZCTAs do not precisely depict the area within which Participatory Mapping
mail deliveries associated with that ZIP Code occur. Participatory mapping refers to mapping practices that
engage communities and community knowledge directly
in the mapping process. It supports communities to
Geographic Information System (GIS) articulate and communicate their knowledge, record
Geographic Information System (GIS) is a computer and archive local knowledge, advocate for change, and
application used to store, view, and analyze geographical address communities’ issues. Participatory mapping, in its
information, or information associated with a location. various forms, provides a critical visual representation of
Typically, a GIS is used for creating and handling maps. GIS community knowledge about a place.
allows researchers to identify spatial (see term) patterns
among problems and resources.
Methodology
The ideas, rules and procedures that guide research.
Ground-truth data
The action of exploring the validity of data and information
based on the account of community members. Pursuing Qualitative Data
on-the-ground knowledge to verify data claims; also, the Data or information that is descriptive and cannot be
process of checking data and maps against reality, which measured. Ex. color, smell, perception of safety, etc.
may involve checking the map against other data sources
or traveling to the place where the data were collected.
Quantitative Data
Data or information expressed numerically, can be
counted, measured and analyzed statistically.
PARTICIPATORY ASSET MAPPING 16Glossary
Place Surveys
An area with definite or indefinite boundaries, a locality. Tools used for collecting all types of data, which usually
involve participants completing a written questionnaire,
sometimes administered in-person, over the telephone,
Primary Data or through an electronic survey system.
Original data collected by the researcher specifically for
the purpose in mind. For example, collecting data from
police officers about their attitudes on domestic violence, Visualization
in order to compare those attitudes among different types A means of presenting data in a visual form to provide
of officers. alternative means of analysis and understanding. Both
charts and maps are examples of visualization techniques.
Research Ethics
The principles and rules that guide how people should Wikimaps on HealthyCity.org (formerly “Live
be treated, when they are participants in a research Mapping”)
process or project Formerly “Live Maps”, this feature has been completely
revamped and enhanced, and has the new name of
“Wikimaps”. As did Live Maps, Wikimaps enable multiple
Secondary Data people to plot points on the same map, adding descrip-
Data that have been collected for another purpose and tions, photos, and/or videos to each point. A Wikimap is
now are available for other researchers to use for their a great tool for participatory mapping, since it can quickly
purposes. For example, the California Department of and easily be used to capture community knowledge
Public Health collects data on births and deaths of the about community issues and assets, utilized for commu-
California population; we can use this in community health nity planning sessions, and many more possibilities.
assessments even though we did not do the primary data
collection.
Social Investigation
A broad term that encompasses many different methods
of gathering community knowledge through a commu-
nity-engaged approach. These methods are separate from
traditional information gathering methods in that they
focus on gathering information directly from people and
the community, instead of about people (from secondary
sources).
Spatial
Associated with a position in space, most often a real loca-
tion on the ground (e.g. a street address). This may also
refer to a conceptually defined or hypothetical position in
space (e.g., the strength of interpersonal relationships).
Spatial Analysis
Any analytical process in which the position of the data is
considered to be an essential component of the analysis
PARTICIPATORY ASSET MAPPING 17ADDITIONAL TOOLS YOU CAN USE
The following tools provide further instructions for
implementing a Participatory Asset Mapping activity:
ƗƗAppendix A: Case Study: Using Participatory Asset Mapping for Advocacy
and Policy in Boyle Heights and East Los Angeles (Alliance for a Better
Community)
ƗƗAppendix B: HealthyCity.org wikimaps User Guide
ƗƗAppendix C: Planning a Community-Engaged Mapping Event
ƗƗAppendix D: Community-Engaged Mapping: Asset Mapping Facilitation Guide
ƗƗAppendix E: Ethics in Community Based Participatory Action Research
PARTICIPATORY ASSET MAPPING 18APPENDIX A
Case Study
Using Participatory Asset Mapping for Advocacy
and Policy in Boyle Heights and East Los Angeles
In 2010, the Alliance for a Better Community (ABC), a policy Research Questions: Where are the Healthy
organization established to respond to and shape Latino Food and Recreational Assets?
policy in Los Angeles, conducted a Community Health
Assessment of Boyle Heights and East Los Angeles. As ABC and Healthy City created several research questions
part of this assessment, ABC partnered with Healthy City to identify healthy food and recreational assets:
to research and analyze the affect of the built environment
on community health in the defined areas and propose ++ What is the community’s access to healthy food
policy goals to address identified concerns. Through options and safe recreational spaces?
Participatory Asset Mapping, ABC gathered first-hand
knowledge from community members about local food ++ Where do residents go to buy healthy food in the
and recreation/physical activity assets and resources and community?
any issues surrounding access to them.
++ Where do they go for recreation/physical activity
resources in the community?
++ Are there food and physical activity locations that
residents avoid? If yes, where are they located
and why do residents avoid them?
Data Collection: Community-Engaged
Mapping with Live Mapping* (*now
Wikimaps)
During April and May 2010, ABC held eight Community-
Engaged Mapping events throughout Boyle Heights and
East Los Angeles, with over 240 youth and adult residents
participating. These mapping events gathered knowledge
from community residents on the quality of resources
available to them and built environment issues that
affected the accessibility of those resources. Residents
were asked to identify the food and recreation locations
that they did or did not frequent in their community. As
shown in the picture on the right, the HealthyCity.org Live
Mapping tool was used to document the locations of and
information about the health and recreational assets in
the community.
PARTICIPATORY ASSET MAPPING 19The agreed definition of a community asset confirmed Advocacy and Policy with participants in each session was “a positive place or program that makes the community a safe, healthy, ABC included results from community residents and the and great place to live.” Community members identified Participatory Asset Mapping events in its policy analysis the resources that they frequented in their community, and recommendations on community health in these as well as places they knew of but did not frequent, for communities. Findings supported policy recommenda- healthy food and physical activity. They also graded each tions to increase the availability and accessibility of quality resource they identified using the scale “A” through “F.” food options and adequate physical activity spaces, and They provided a brief description of why they gave each implementing measures to make existing resources safer resource a particular grade (with an “A” grade representing for community members.xiv Further information about an asset and an “F” grade representing a resource that its policy recommendations can be found ABC’s 2011 was not an asset). For example, one resident graded a policy report Places, Spaces & People: How the Urban local park with a ‘C’ because of insufficient programming Environment Impacts Health in Boyle Heights and East for older youth. Community members then identified spe- Los Angeles.xv cific physical and built environment issues around each resource to determine any barriers that kept them from using those resources. Analysis The identified community resources were sorted for each mapping session location and a two-mile radius to show the grade distribution of resources in each area. In addition, of the combined total number of resources identified in each session, those that received a grade of a “B” or below were scanned for a qualitative analysis of the descriptions representing each grade. Any description that mentioned how does this case study relate to your concerns for safety around a particular resource was coded own work and interest in participatory and mapped to visually display locations people perceived asset mapping? to be unsafe. The map of perceived unsafe places was then compared to the map of all identified environmental design issues to see if there is any relationship between the built environment and people’s perceptions of a place being unsafe. Community residents gave many of the local food and physical activity resources a “B“ or higher, deeming them assets to the community. Nearly 30% of all resources identified were places that residents avoided, usually because they felt unsafe. Residents commented that they typically visited multiple stores to meet all of their food needs, and, in some cases, these stores had quality meat but lacked fresh fruits and vegetables. Although 27% of residents regarded local parks as quality spaces, they often avoided them because of lack of programming and safety concerns. PARTICIPATORY ASSET MAPPING 20
APPENDIX B

    HealthyCity.org
    WikiMaps User Guide*
Formerly “Live Maps”, this feature has been com-
pletely revamped and enhanced, and has the new                Wikimaps: Above & Beyond Live Maps
name of “Wikimaps”. As did Live Maps, Wikimaps
enable multiple people to plot points on the same             ++ greater control for facilitators
map, adding descriptions, photos, and/or videos to
each point. Wikimaps are great for gathering data             ++ easier to gather input
from community residents – whether it be map-
ping assets in the community or noting areas that             ++ access multiple views of the data you
need improvement. To create a Wikimap and start                  collect
collecting community data, follow the steps below.

Setting up a Wikimap

Step 1:

In the My Account section, Click Live Maps in the left
column, then click Create a Wikimap.

Step 2:

Create your Wikimap’s profile. Provide a Title and set the
Focus area to the region you want the map zoomed in on.
Then tell your audience about the purpose of your map
by giving the map a description.

Step 3:

Define what category of points, lines and/or shapes you
want participants to map. You may also just have one
category of data you plan to add to the map. You can
change the color and style of flag for each category.

Step 4:

Define what information you want people to add to each
point. You can limit participants’ input to one field for
general comments about the point, or you can specify
additional details you want to collect. For example, if you
are mapping Farmers Markets, you could add a field for
the “date” and “time” that the market is open. You could
request that participants score the markets by marking
“A-F.”

PARTICIPATORY ASSET MAPPING			                                                                      21
Step 5: Choose how you want participants to add information to the map. For example, you can pick points and addresses to represent a specific place, lines to represent a path or route, shapes to draw a region. Step 6: Advanced settings are available if you want to provide additional context to your Wikimap, or change the labels on your map. For example, if you want to share your map with a Spanish-speaking audience, you could substitute a Spanish translation of the map text, buttons, and instruc- tions. Click on Change Labels to begin adding or replacing text. Finally, click Submit Well Done! You have created your Wikimap and can now access your Wikimap’s profile page under “Wikimaps > My Wikimaps in the Account section. Share a link to your map Share your map by sending a link, sharing it on the HealthyCity.org Connect page, or sharing it with a Healthy City Group or Story. If you want to share the link to your Wikimap with a Group or Story, just click Change link. In all cases, you can choose to share the “Add points” version of the map so that participants can add to the map, or the “View only” version so you can show your work to others without them adding points. Adding data to the map Step 1:: Time to get community data on the map. Multiple users will be able to add points simultaneously, and at various locations. Use the “Add points” link provided on the profile page to get to the interactive Wikimap. Participants need not have a Healthy City account to participate. Step 2: Once a person has arrived at this interactive Wikimap page, they can add their data. Just click on an icon at the upper left hand corner of the map. In this example, a person can: click on the Add a point icon, then on the map to add a point; or, click on Add an address. A window will appear that allows you to name and describe this point. You can also add photos and video. Fill in details and click Submit. DONE! The first point has been added to your Wikimap. *The steps, images, and tool outlined above are subject to change with- out notice. In the case that this guide is not current at the time of use, you can visit www.HealthyCity.org for the most up-to-date information. PARTICIPATORY ASSET MAPPING 22
APPENDIX C

Community-Engaged Mapping:
Planning an Asset Mapping Event
A Community-Engaged Mapping event is best facilitated         Step 1: Develop mapping exercise,
through well coordinated mapping events or sessions.          participation format and plan for analysis
During the events or sessions, participants can be asked
to assess the neighborhood, public safety, and community      ++ Develop mapping exercise and data
assets in breakout sessions. The breakout groups should          collection tools
be made up of 10–12 participants each if using table-sized
maps, 4–5 participants if using online maps. Participants     ++ Develop data collection tools based
will be asked to critically think about the neighborhood         on the format you would like to use to address
layout, building structures, and community assets. During        your research question.
a Community-Engaged Mapping event that focuses on
assets, participants are asked to identify and share their      -- Remember the importance of understanding the
knowledge about local community resources and assets.              geographic component of your data –
From this phase, locations and accessibility of existing           do you need addresses? Zip codes?
community assets and locations and needs for new
assets will also be identified. At the end of entire event,     -- Will you use web-based tools?
participants will re-convene as a general body to report           Like healthycity.org!
back on their discussions and to participate in a dialogue
on next steps.                                                  -- Will you need to create original forms?

In planning this event, organizations should outreach         ++ Determine the best
to community stakeholders to participate in the map-             participation format
ping sessions, particularly those who reside or attend
school in the focus area (Note: All participants should         -- Will you collect this data in person?
be screened prior to the event to make sure they meet
the inclusion criteria (must be residents or knowledgeable      -- What format will best collect the information you
of the focus area and be one of the above mentioned                are seeking?
targets). Organizations will need appropriate materials and
equipment, such as table-sized maps of the focus area or        -- Do you want to have the opportunity for group
computers with internet access. Staff should be trained            discussion?
to facilitate discussion around these maps to highlight
positive community resources and assets. To frame the           -- Do you have interests beyond data collection
analysis, it is ideal that the mapping exercise should be          (organizing, coalition building, etc.)?
conducted separately with the following distinct target
populations for better analysis of the data collected (for    ++ Based on the format (how many people)
instance, adults vs. youth or community residents vs.            and tools (Web-based), start early to locate and
organizational staff).                                           secure the location for your event.

                                                              ++ Participant Recruitment plan

                                                              ++ Prepare and test web-based and/or
                                                                 other tools for data collection

PARTICIPATORY ASSET MAPPING			                                                                                23
You can also read