Locality-Sensitive Hashing for Earthquake Detection: A Case Study of Scaling Data-Driven Science - VLDB Endowment
←
→
Page content transcription
If your browser does not render page correctly, please read the page content below
Locality-Sensitive Hashing for Earthquake Detection:
           A Case Study of Scaling Data-Driven Science
                        Kexin Rong∗, Clara E. Yoon†, Karianne J. Bergen‡, Hashem Elezabi∗,
                                  Peter Bailis∗, Philip Levis∗, Gregory C. Beroza†
                                                                       Stanford University

ABSTRACT
In this work, we report on a novel application of Locality Sensitive
Hashing (LSH) to seismic data at scale. Based on the high wave-                                P       S                         P       S
form similarity between reoccurring earthquakes, our application
identifies potential earthquakes by searching for similar time series
                                                                                                   P       S                         P       S
segments via LSH. However, a straightforward implementation of
this LSH-enabled application has difficulty scaling beyond 3 months
of continuous time series data measured at a single seismic station.
As a case study of a data-driven science workflow, we illustrate how
                                                                                        Figure 1: Example of near identical waveforms between occur-
domain knowledge can be incorporated into the workload to improve
                                                                                        rences of the same earthquake two months apart, observed at three
both the efficiency and result quality. We describe several end-to-
                                                                                        seismic stations in New Zealand. The stations experience increased
end optimizations of the analysis pipeline from pre-processing to
                                                                                        ground motions upon the arrivals of seismic waves (e.g., P and S
post-processing, which allow the application to scale to time se-
                                                                                        waves). This paper scales LSH to over 30 billion data points and
ries data measured at multiple seismic stations. Our optimizations
                                                                                        discovers 597 and 6123 new earthquakes near the Diablo Canyon
enable an over 100× speedup in the end-to-end analysis pipeline.
                                                                                        nuclear power plant in California and in New Zealand, respectively.
This improved scalability enabled seismologists to perform seismic
analysis on more than ten years of continuous time series data from                        In this paper, we present an innovative use of LSH—and associ-
over ten seismic stations, and has directly enabled the discovery of                    ated challenges at scale—in large-scale earthquake detection across
597 new earthquakes near the Diablo Canyon nuclear power plant                          seismic networks. Earthquake detection is particularly interesting in
in California and 6123 new earthquakes in New Zealand.                                  both its abundance of raw data and scarcity of labeled examples:
                                                                                           First, seismic data is large. Earthquakes are monitored by seis-
PVLDB Reference Format:
Kexin Rong, Clara E. Yoon, Karianne J. Bergen, Hashem Elezabi, Pe-                      mic networks, which can contain thousands of seismometers that
ter Bailis, Philip Levis, Gregory C. Beroza. Locality-Sensitive Hashing                 continuously measure ground motion and vibration. For example,
for Earthquake Detection: A Case Study of Scaling Data-Driven Science.                  Southern California alone has over 500 seismic stations, each col-
PVLDB, 11 (11): 1674-1687, 2018.                                                        lecting continuous ground motion measurements at 100Hz. As a
DOI: https://doi.org/10.14778/3236187.3236214                                           result, this network alone has collected over ten trillion (1013 ) data
                                                                                        points in the form of time series in the past decade [5].
                                                                                           Second, despite large measurement volumes, only a small fraction
1.     INTRODUCTION                                                                     of earthquake events are cataloged, or confirmed and hand-labeled.
   Locality Sensitive Hashing (LSH) [29] is a well studied com-                         As earthquake magnitude (i.e., size) decreases, the frequency of
putational primitive for efficient nearest neighbor search in high-                     earthquake events increases exponentially. Worldwide, major earth-
dimensional spaces. LSH hashes items into low-dimensional spaces                        quakes (magnitude 7+) occur approximately once a month, while
such that similar items have a higher collision probability in the hash                 magnitude 2.0 and smaller earthquakes occur several thousand times
table. Successful applications of LSH include entity resolution [65],                   a day. At low magnitudes, it is difficult to detect earthquake signals
genome sequence comparison [18], text and image search [41, 52],                        because earthquake energy approaches the noise floor, and con-
near duplicate detection [20, 46], and video identification [37].                       ventional seismological analyses can fail to disambiguate between
                                                                                        signal and noise. Nevertheless, detecting these small earthquakes
* Department    of Computer Science
† Department                                                                            is important in uncovering sources of earthquakes [24, 32], improv-
                of Geophysics
‡ Institute for Computational and Mathematical Engineering                              ing the understanding of earthquake mechanics [49, 58], and better
                                                                                        predicting the occurrences of future events [38].
Permission to make digital or hard copies of all or part of this work for                  To take advantage of the large volume of unlabeled raw mea-
personal or classroom use is granted without fee provided that copies are               surement data, seismologists have developed an unsupervised, data-
not made or distributed for profit or commercial advantage and that copies
bear this notice and the full citation on the first page. To copy otherwise, to
                                                                                        driven earthquake detection method, Fingerprint And Similarity
republish, to post on servers or to redistribute to lists, requires prior specific      Thresholding (FAST), based on waveform similarity [25]. Seismic
permission and/or a fee. Articles from this volume were invited to present              sources repeatedly generate earthquakes over the course of days,
their results at The 44th International Conference on Very Large Data Bases,            months or even years, and these earthquakes show near identical
August 2018, Rio de Janeiro, Brazil.                                                    waveforms when recorded at the same seismic station, regardless
Copyright 2018 VLDB Endowment 2150-8097/18/07.                                          of the earthquake’s magnitude [27, 56]. Figure 1 illustrates this
DOI: https://doi.org/10.14778/3236187.3236214

                                                                                     1674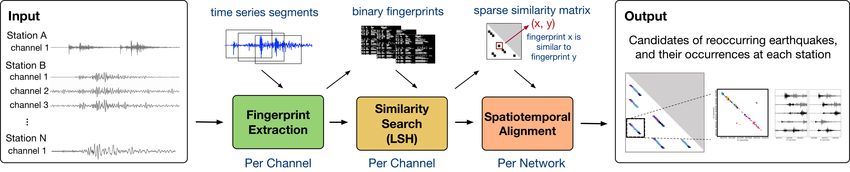
phenomenon by depicting a pair of reoccurring earthquakes that                Beyond these contributions to a database audience, our solution
are two months apart, observed at three seismic stations in New               is an open source tool, available for use by the broader scientific
Zealand. By applying LSH to identify similar waveforms from seis-             community. We have already run workshops for seismologists at
mic data, seismologists were able to discover new, low-magnitude              Stanford [2] and believe that the pipeline can not only facilitate
earthquakes without knowledge of prior earthquake events.                     targeted seismic analysis but also contribute to the label generation
   Despite early successes, seismologists had difficulty scaling their        for supervised methods in seismic data [50].
LSH-based analysis beyond 3-month of time series data (7.95 × 10⁸                The rest of the paper proceeds as follows. We review background
data points) at a single seismic station [24]. The FAST implemen-             information about earthquake detection in Section 2 and discuss
tation faces severe scalability challenges. Contrary to what LSH              additional related work in Section 3. We give a brief overview of the
theory suggests, the actual LSH runtime in FAST grows near quadrat-           end-to-end detection pipeline and key technical challenges in Sec-
ically with the input size due to correlations in the seismic signals:        tion 4. Sections 5, 6 and 7 present details as well as optimizations in
in an initial performance benchmark, the similarity search took 5             the fingerprint extraction, similarity search and the spatiotemporal
CPU-days to process 3 months of data, and, with a 5× increase                 alignment steps of the pipeline. We perform a detailed evaluation
in dataset size, LSH query time increased by 30×. In addition,                on both the quantitative performance improvements of our optimiza-
station-specific repeated background noise leads to an overwhelm-             tions as well as qualitative results of new seismic findings in Section
ing number of similar but non-earthquake time series matches, both            8. In Section 9, we reflect on lessons learned and conclude.
crippling throughput and seismologists’ ability to sift through the
output, which can number in the hundreds of millions of events.               2.    BACKGROUND
Ultimately, these scalability bottlenecks prevented seismologists
                                                                                 With the deployment of denser and increasingly sensitive sensor
from making use of the decades of data at their disposal.
                                                                              arrays, seismology is experiencing a rapid growth of high-resolution
   In this paper, we show how systems, algorithms, and domain
                                                                              data [30]. Seismic networks with up to thousands of sensors have
expertise can go hand-in-hand to deliver substantial scalability im-
                                                                              been recording years of continuous seismic data streams, typically
provements for this seismological analysis. Via algorithmic design,
                                                                              at 100Hz frequencies. The rising data volume has fueled strong
optimization using domain knowledge, and data engineering, we
                                                                              interest in the seismology community to develop and apply scalable
scale the FAST workload to years of continuous data at multiple sta-
                                                                              data-driven algorithms that improve the monitoring and prediction
tions. In turn, this scalability has enabled new scientific discoveries,
                                                                              of earthquake events [21, 40, 42].
including previously unknown earthquakes near a nuclear reactor in
                                                                                 In this work, we focus on the problem of detecting new, low-
San Luis Obispo, California, and in New Zealand.
                                                                              magnitude earthquakes from historical seismic data. Earthquakes,
   Specifically, we build a scalable end-to-end earthquake detection
                                                                              which are primarily caused by the rupture of geological faults, ra-
pipeline comprised of three main steps. First, the fingerprint extrac-
                                                                              diate energy that travels through the Earth in the form of seismic
tion step encodes time-frequency features of the original time series
                                                                              waves. Seismic waves induce ground motion that is recorded by seis-
into compact binary fingerprints that are more robust to small varia-
                                                                              mometers. Modern seismometers typically include 3 components
tions. To address the bottleneck caused by repeating non-seismic
                                                                              that measure simultaneous ground motion along the north-south,
signals, we apply domain-specific filters based on the frequency
                                                                              east-west, and vertical axes. Ground motions along each of these
bands and the frequency of occurrences of earthquakes. Second, the
                                                                              three axes are recorded as a separate channel of time series data.
search step applies LSH on the binary fingerprints to identify all
                                                                                 Channels capture complementary signals for different seismic
pairs of similar time series segments. We pinpoint high hash colli-
                                                                              waves, such as the P-wave and the S-wave. The P-waves travel along
sion rates caused by physical correlations in the input data as a core
                                                                              the direction of propagation, like sound, while the S-waves travel
culprit of LSH performance degradation and alleviate the impact
                                                                              perpendicular to the direction of propagation, like ocean waves. The
of large buckets by increasing hash selectivity while keeping the
                                                                              vertical channel, therefore, better captures the up and down motions
detection threshold constant. Third, the alignment step significantly
                                                                              caused by the P-waves while the horizontal channels better capture
reduces the size of detection results and confirms seismic behavior
                                                                              the side to side motions caused by the S-waves. P-waves travel the
by performing spatiotemporal correlation with nearby seismic sta-
                                                                              fastest and are the first to arrive at seismic stations, followed by the
tions in the network [14]. To scale this analysis, we leverage domain
                                                                              slower but usually larger amplitude S-waves. Hence, the P-wave
knowledge of the invariance of the time difference between a pair
                                                                              and S-wave of an earthquake typically register as two “big wiggles”
of earthquake events across all stations at which they are recorded.
                                                                              on the ground motion measurements (Figure 1). These impulsive
   In summary, as an innovative systems and applications paper, this
                                                                              arrivals of seismic waves are example characteristics of earthquakes
work makes several contributions:
                                                                              that seismologists look for in the data.
    • We report on a new application of LSH in seismology as                     While it is easy for human eyes to identify large earthquakes on
       well as a complete end-to-end data science pipeline, including         a single channel, accurately detecting small earthquakes usually
       non-trivial pre-processing and post-processing, that scales to         requires looking at data from multiple channels or stations. These
       a decade of continuous time series for earthquake detection.           low-magnitude earthquakes pose challenges for conventional meth-
    • We present a case study for using domain knowledge to im-               ods for detection, which we outline below. Traditional energy-based
       prove the accuracy and efficiency of the pipeline. We illustrate       earthquake detectors such as a short-term average (STA)/long-term
       how applying seismological domain knowledge in each com-               average (LTA) identify earthquake events by their impulsive, high
       ponent of the pipeline is critical to scalability.                     signal-to-noise P-wave and S-wave arrivals. However, these de-
    • We demonstrate that our optimizations enable a cumulative               tectors are prone to high false positive and false negative rates at
       two order-of-magnitude speedup in the end-to-end detection             low magnitudes, especially with noisy backgrounds [28]. Template
       pipeline. These quantitative improvements enable qualitative           matching, or the waveform cross-correlation with template wave-
       discoveries: we discovered 597 new earthquakes near the                forms of known earthquakes, has proven more effective for detecting
       Diablo Canyon nuclear power plant in California and 6123               known seismic signals in noisy data [15, 57]. However, the method
       new earthquakes in New Zealand, allowing seismologists to              relies on template waveforms of prior events and is not suitable for
       determine the size and shape of nearby fault structures.               discovering events from unknown sources.

                                                                           1675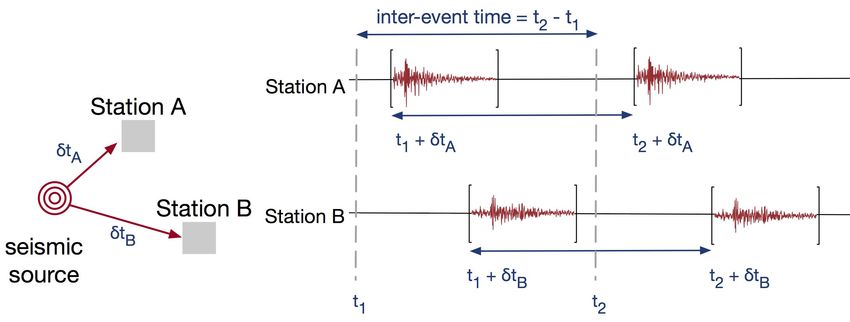
As a result, almost all earthquakes greater than magnitude 5                 contribute to the advance of the state-of-the-art LSH algorithms; in-
are detected [26]. In comparison, an estimated 1.5 million earth-               stead, we show that classic LSH techniques, combined with domain-
quakes with magnitude between 2 and 5 are not detected by con-                  specific optimizations, can lead to scientific discoveries when ap-
ventional means, and 1.3 million of these are between magnitude                 plied at scale. Existing work shows that LSH performance is sensi-
2 and 2.9. The estimate is based on the magnitude frequency dis-                tive to key parameters such as the number of hash functions [23, 52];
tribution of earthquakes [31]. We are interested in detecting these             we provide supporting evidence and analysis on the performance im-
low-magnitude earthquakes missing from public earthquake cata-                  plication of LSH parameters in our application domain. In addition
logs to better understand earthquake mechanics and sources, which               to the core LSH techniques, we also present nontrivial preprocess-
inform seismic hazard estimates and prediction [32, 38, 49, 58].                ing and postprocessing steps that enable an end-to-end detection
   The earthquake detection pipeline we study in the paper is an                pipeline, including spatiotemporal alignment of LSH matches.
unsupervised and data-driven approach that does not rely on su-                    Our work targets CPU workloads, complementing existing efforts
pervised (i.e., labeled) examples of prior earthquake events, and is            that speed up similarity search on GPUs [34]. To preserve the in-
designed to complement existing, supervised detection methods. As               tegrity of the established science pipeline, we focus on optimizing
in template matching, the method we optimize takes advantage of                 the existing MinHash based LSH rather than replacing it with po-
the high similarity between waveforms generated by reoccurring                  tentially more efficient LSH variants such as LSH forest [10] and
earthquakes. However, instead of relying on waveform templates                  multi-probe LSH [45]. While we share observations with prior
from only known events, the pipeline leverages the recurring nature             work that parallelizes and distributes a different LSH family [61],
of seismic activities to detect similar waveforms in time and across            we present the unique challenges and opportunities of optimizing
stations. To do so, the pipeline performs an all-pair time series               MinHash LSH in our application domain. We provide performance
similarity search, treating each segment of the input waveform data             benchmarks against alternative similarity search algorithms in the
as a “template” for potential earthquakes. This pipeline will not               evaluation, such as set similarity joins [47] and an alternative LSH
detect an earthquake that occurs only once and is not similar enough            library based on recent theoretical advances in LSH for cosine sim-
to any other earthquakes in the input data. Therefore, to improve               ilarity [7]. We believe the resulting experience report, as well as
detection recall, it is critical to be able to scale the analysis to input      our open source implementation, will be valuable to researchers
data with a longer duration (e.g., years instead of weeks or months).           developing LSH techniques in the future.
                                                                                Time Series Analytics. Time series analytics is a core topic in
                                                                                large-scale data analytics and data mining [39, 44, 68]. In our appli-
3.    RELATED WORK                                                              cation, we utilize time series similarity search as a core workhorse
  In this section, we address related work in earthquake detection,             for earthquake detection. There are a number of distance metrics for
LSH-based applications and time series similarity search.                       time series [22], including Euclidean distance and its variants [69],
                                                                                Dynamic Time Warping [51], and edit distance [62]. However,
Earthquake Detection. The original FAST work appeared in the                    our input time series from seismic sensors is high frequency (e.g.
seismology community, and has proven a useful tool in scientific                100Hz) and often noisy. Therefore, small time-shifts, outliers and
discovery [24, 25]. In this paper, we present FAST to a database                scaling can result in large changes in time-domain metrics [19].
audience for the first time, and report on both the pipeline composi-           Instead, we encode time-frequency features of the input time series
tion and optimization from a computational perspective. The results             into binary vectors and focus on the Jaccard similarity between the
presented in this paper are the result of over a year of collaboration          binary feature vectors. This feature extraction procedure is an adap-
between our database research group and the Stanford earthquake                 tation of the Waveprint algorithm [9] initially designed for audio
seismology research group. The optimizations we present in this                 data; the key modification made for seismic data was to focus on
paper and the resulting scalability results of the optimized pipeline           frequency features that are the most discriminative from background
have not previously been published. We believe this represents a                noise, such that the average similarity between non-seismic signals
useful and innovative application of LSH to a real domain science               is reduced [13]. An alternative binary representation models time
tool that will be of interest to both the database community and                series as points on a grid, and uses the non-empty grid cells as a set
researchers of LSH and time-series analytics.                                   representation of the time series [48]. However, this representation
   The problem of earthquake detection is decades old [6], and many             does not take advantage of the physical properties distinguishing
classic techniques—many of which are in use today—were devel-                   background from seismic signals.
oped for an era in which humans manually inspected seismographs
for readings [35, 66]. With the rise of machine learning and large-
scale data analytics, there has been increasing interest in further             4.    PIPELINE OVERVIEW
automating these techniques. While FAST is optimized to find many                  In this section, we provide an overview of the three main steps of
small-scale earthquakes, alternative approaches in the seismology               our end-to-end detection pipeline. We elaborate on each step—and
community utilize template matching [15,57], social media [54], and             our associated optimizations—in later sections, referenced inline.
machine learning techniques [8, 64]. Most recently, with sufficient                The input of the detection pipeline consists of continuous ground
training data, supervised approaches have shown promising results               motion measurements in the form of time series, collected from
of being able to detect non-repeating earthquake events [50]. In                multiple stations in the seismic network. The output is a list of
contrast, our LSH-based detection method does not rely on labeled               potential earthquakes, specified in the form of timestamps when the
earthquake events and detects reoccurring earthquake events. In the             seismic wave arrives at each station. From there, seismologists can
evaluation, we compare against two supervised methods [50,55] and               compare with public earthquake catalogs to identify new events, and
show that our unsupervised pipeline is able to detect qualitatively             visually inspect the measurements to confirm seismic findings.
different events from the existing earthquake catalog.                             Figure 2 illustrates the three major components of the end-to-end
Locality Sensitive Hashing. In this work, we perform a detailed                 detection pipeline: fingerprint extraction, similarity search, and spa-
case study of the practical challenges and the domain-specific so-              tiotemporal alignment. For each input time series, or continuous
lutions of applying LSH to the field of seismology. We do not                   ground motion measurements from a seismic channel, the algorithm

                                                                             1676
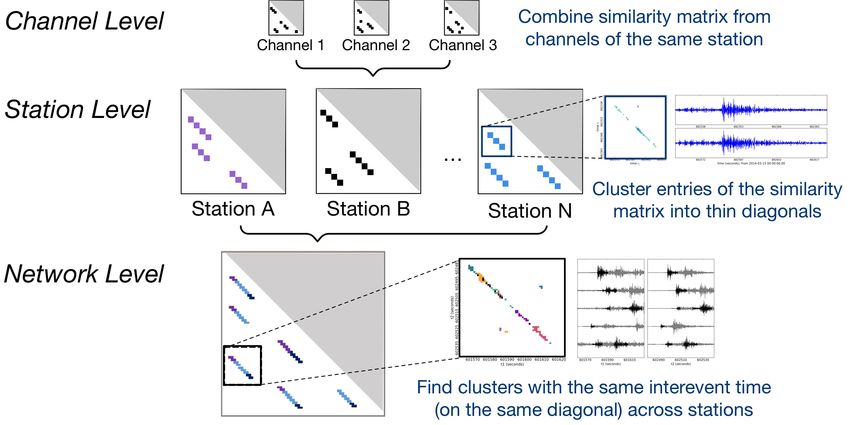
Figure 2: The three steps of the end-to-end earthquake detection pipeline: fingerprinting transforms time series into binary vectors (Section 5);
similarity search identifies pairs of similar binary vectors (Section 6); alignment aggregates and reduces false positives in results (Section 7).

slices the input into short windows of overlapping time series seg-
ments and encodes time-frequency features of each window into a
binary fingerprint; the similarity of the fingerprints resembles that
of the original waveforms (Section 5). The algorithm then performs
                                                                                      Time Series        Spectrogram            Wavelet
an all pairs similarity search via LSH on the binary fingerprints and
identifies pairs of highly similar fingerprints (Section 6). Finally,
like a traditional associator that maps earthquake detections at each
station to a consistent seismic source, in the spatiotemporal align-
ment stage, the algorithm combines, filters and clusters the outputs
                                                                                   Binary Fingerprint   Top Coefficient      MAD Normalization
from all seismic channels to generate a list of candidate earthquake
detections with high confidence (Section 7).                                 Figure 3: The fingerprinting algorithm encodes time-frequency
   A naı̈ve implementation of the pipeline imposes several scalability       features of the original time series into binary vectors.
challenges. For example, we observed LSH performance degrada-
tion in our application caused by the non-uniformity and correlation         prints in place of the time series (Section 5.1). We then describe a
in the binary fingerprints; the correlations induce undesired LSH            new optimization that parallelizes and accelerates the fingerprinting
hash collisions, which significantly increase the number of lookups          generation via sampling (Section 5.2).
per similarity search query (Section 6.3). In addition, the similarity
search does not distinguish seismic from non-seismic signals. In the         5.1    Fingerprint Overview
presence of repeating background signals, similar noise waveforms               Inspired by the success of feature extraction techniques for in-
could outnumber similar earthquake waveforms, leading to more                dexing audio snippets [13], fingerprint extraction step transforms
than an order of magnitude slow down in runtime and increase in              continuous time series data into compact binary vectors (finger-
output size (Section 6.5). As the input time series and the output of        prints) for similarity search. Each fingerprint encodes representative
the similarity search becomes larger, the pipeline must adapt to data        time-frequency features of the time series. The Jaccard similarity of
sizes that are too large to fit into main memory (Section 6.4, 7.2).         two fingerprints, defined as the size of the intersection of the non-
   In this paper, we focus on single-machine, main-memory execu-             zero entries divided by the size of the union, preserves the waveform
tion on commodity servers with multicore processors. We parallelize          similarity of the corresponding time series segments. Compared to
the pipeline within a given server but otherwise do not distribute           directly computing similarity on the time series, fingerprinting in-
the computation to multiple servers. In principle, the parallelization       troduces frequency-domain features into the detection and provides
efforts extend to distributed execution. However, given the poor             additional robustness against translation and small variations [13].
quadratic scalability of the unoptimized pipeline, distribution alone           Figure 3 illustrates the individual steps of fingerprinting:
would not have been a viable option for scaling to desired data vol-             1. Spectrogram Compute the spectrogram, a time-frequency
ume. As a result of the optimizations described in this paper, we are               representation, of the time series. Slice the spectrogram
able to scale to a decade of data on a single node without requiring                into short overlapping segments using a sliding window and
distribution. However, we view distributed execution as a valuable                  smooth by downsampling each segment into a spectral image.
extension for future work.                                                       2. Wavelet Transform Compute two-dimensional discrete Haar
   In the remaining sections of this paper, we describe the design                  wavelet transform on each spectral image. The wavelet coeffi-
decisions as well as performance optimizations for each pipeline                    cients serve as a lossy compression of the spectral images.
component. Most of our optimizations focus on the all pairs similar-             3. Normalization Normalize each wavelet coefficient by its me-
ity search, where the initial implementation exhibited near quadratic               dian and the median absolute deviation (MAD) on the full,
growth in runtime with the input size. We show in the evaluation                    background dominated dataset.
that, these optimizations enable speedups of more than two orders                4. Top coefficient Extract the top K most anomalous wavelet
of magnitude in the end-to-end pipeline.                                            coefficients, or the largest coefficients after MAD normal-
                                                                                    ization, from each spectral image. By selecting the most
                                                                                    anomalous coefficients, we focus only on coefficients that are
5.    FINGERPRINT EXTRACTION                                                        most distinct from coefficients that characterize noise, which
  In this section, we describe the fingerprint extraction step that en-             empirically leads to better detection results.
codes time-frequency features of the input time series into compact              5. Binarize Binarize the signs and positions of the top wavelet
binary vectors for similarity search. We begin with an overview of                  coefficients. We encode the sign of each normalized coeffi-
the fingerprinting algorithm [13] and the benefits of using finger-                 cient using 2 bits: −1 → 01, 0 → 00, 1 → 10.

                                                                          1677
5.2     Optimization: MAD via sampling
   The fingerprint extraction is implemented via scientific modules
such as scipy, numpy and PyWavelets in Python. While its runtime                         General Purpose Hashing             Locality-Sensitive Hashing
grows linearly with input size, fingerprinting ten years of time series
data can take several days on a single core.                                       Figure 4: Locality-sensitive hashing hashes similar items to the
   In the unoptimized procedure, normalizing the wavelet coeffi-                   same hash “bucket” with high probability.
cients requires two full passes over the data. The first pass calculates
the median and the MAD1 for each wavelet coefficient over the                      Hash table construction. Each hash table stores an independent
whole population, and the second pass normalizes the wavelet rep-                  mapping of fingerprints to hash buckets. The tables are initialized
resentation of each fingerprint accordingly. Given the median and                  by mapping hash signatures to a list of fingerprints that share the
MAD for each wavelet coefficient, the input time series can be parti-              same signature. Empirically, we find that using t = 100 hash ta-
tioned and normalized in parallel. Therefore, the computation of the               bles suffices for our application, and there is little gain in further
median and MAD remains the runtime bottleneck.                                     increasing the number of hash tables.
   We accelerate the computation by approximating the true median                  Search. The search queries the hash tables for each fingerprint’s
and MAD with statistics calculated from a small random sample                      near neighbor candidates, or other fingerprints that share the query
of the input data. The confidence interval for MAD with a sample                   fingerprint’s hash buckets. We keep track of the number of times the
size of n shrinks with n1/2 [59]. We further investigate the trade-off             query fingerprint and candidates have matching hash signature in the
between speed and accuracy under different sampling rates in the                   hash tables, and output candidates with matches above a predefined
evaluation (Section 8.3). We empirically find that, on one month                   threshold. The number of matches is also used as a proxy for the
of input time series data, sampling provides an order of magnitude                 confidence of the similarity in the final step of the pipeline.
speedup with almost no loss in accuracy. For input time series of
longer duration, sampling 1% or less of the input can suffice.
                                                                                   6.2     Optimization: Hash signature generation
                                                                                      In this subsection, we present both memory access pattern and
6.    LSH-BASED SIMILARITY SEARCH                                                  algorithmic improvements to speed up the generation of hash signa-
   In this section, we present the time series similar search step                 tures. We show that, together, the optimizations lead to an over 3×
based on LSH. We start with a description of the algorithm and                     improvement in hash generation time (Section 8.1).
the baseline implementation (Section 6.1), upon which we build                        Similar to observations made for SimHash (a different hash family
the optimizations. Our contributions include: an optimized hash                    for angular distances) [61], a naı̈ve implementation of the MinHash
signature generation procedure (Section 6.2), an empirical analysis                generation can suffer from poor memory locality due to the sparsity
of the impact of hash collisions and LSH parameters on query                       of input data. SimHash functions are evaluated as a dot product
performance (Section 6.3), partition and parallelization of LSH that               between the input and hash mapping vectors, while MinHash func-
reduce the runtime and memory usage (Section 6.4), and finally,                    tions are evaluated as a minimum of hash mappings corresponding
two domain-specific filters that improve both the performance and                  to non-zero elements of the input. For sparse input, both functions
detection quality of the search (Section 6.5).                                     access scattered, non-contiguous elements in the hash mapping vec-
                                                                                   tor, causing an increase in cache misses. We improve the memory
6.1     Similarity Search Overview                                                 access pattern by blocking the access to the hash mappings. We
   Reoccurring earthquakes originated from nearby seismic sources                  use dimensions of the fingerprint, rather than hash functions, as the
appear as near-identical waveforms at the same seismic station.                    main loop for each fingerprint. As a result, the lookups for each
Given continuous ground motion measurements from a seismic                         non-zero element in the fingerprint are blocked into rows in the hash
station, our pipeline identifies similar time series segments from the             mapping array. For our application, this loop order has the addi-
input as candidates for reoccurring earthquake events.                             tional advantage of exploiting the high overlap (e.g. over 60% in
   Concretely, we perform an approximate similarity search via Min-                one example) between neighboring fingerprints. The overlap means
Hash LSH on the binary fingerprints to identify all pairs of finger-               that previously accessed elements in hash mappings are likely to get
prints whose Jaccard similarity exceeds a predefined threshold [17].               reused while in cache, further improving the memory locality.
MinHash LSH performs a random projection of high-dimensional                          In addition, we speed up the hash signature generation by re-
data into lower dimensional space, hashing similar items to the same               placing MinHash with Min-Max hash. MinHash only keeps the
hash table “bucket” with high probability (Figure 4). Instead of                   minimum value for each hash mapping, while Min-Max hashkeeps
performing a naı̈ve pairwise comparisons between all fingerprints,                 both the min and the max. Therefore, to generate hash signatures
LSH limits the comparisons to fingerprints sharing the same hash                   with similar collision probability, Min-Max hash reduces the num-
bucket, significantly reducing the computation. The ratio of the av-               ber of required hash functions to half. Previous work showed the
erage number of comparisons per query to the size of the dataset, or               Min-Max hash is an unbiased estimator of pairwise Jaccard similar-
selectivity, is a machine-independent proxy for query efficiency [23].             ity, and achieves similar and sometimes smaller mean squared error
                                                                                   (MSE) in estimating pairwise Jaccard similarity in practice [33]. We
Hash signature generation. The MinHash of a fingerprint is                         include pseudocode for the optimized hash signature calculation in
the first non-zero element of the fingerprint under a given random                 Appendix D of extended Technical Report [53].
permutation of its elements. The permutation is defined by a hash
function mapping fingerprint elements to random indices. Let p
denote the collision probability of a hash signature generated with a
                                                                                   6.3     Optimization: Alleviating hash collisions
single hash function. By increasing the number of hash functions k,                   Perhaps surprisingly, our initial LSH implementation demon-
the collision probability of the hash signature decreases to pk [43].              strated poor scaling with the input size: with a 5× increase in input,
                                                                                   the runtime increases by 30×. In this subsection, we analyze the
1 For X = {x , x , ..., x }, the MAD is defined as the median of the absolute
             1 2         n                                                         cause of LSH performance degradation and the performance impli-
deviations from the median: MAD = median(|xi − median(X)|)                         cations of core LSH parameters in our application.

                                                                                1678
60                                               0.30                                                1.0

                                                                                                     Probability of Success
   Fingerprint y index                                                                                                        0.8
                                                                          0.25                                                                                 k=4, m=5
                                                                                                                              0.6

                                                                                 P(nonzero)
                         40                                                                                                                                    k=6, m=5
                                                                          0.20                                                0.4                              k=7, m=3
                                                                          0.15                                                0.2                              k=8, m=2
                         20                                                                                                                                    k=10, m=2
                                                                                                                              0.0
                                                                          0.10                                                   0.0   0.2    0.4    0.6     0.8           1.0
                         0                                                                                                    Jaccard Similarity
                              0   20   40     60        80    100   120
                                        Fingerprint x index                                      Figure 6: Theoretical probability of a successful search versus
                                                                                                 Jaccard similarity between fingerprints (k: number of hash functions,
Figure 5: Probability that each element in the fingerprint is equal
                                                                                                 m: number of matches). Different LSH parameter settings can have
to 1, averaged over 15.7M fingerprints, each of dimension 8192,
                                                                                                 near identical detection probability with vastly different runtime.
generated from a year of time series data. The heatmap shows
that some elements of the fingerprint are much more likely to be
non-zero compared to others.                                                                     hash functions increases, the expected average size of hash buckets
                                                                                                 decreases, which can lead to an order of magnitude speed up in the
                                                                                                 similarity search for seismic data in practice. However, to keep the
Cause of hash collisions. Poor distribution of hash signatures can
                                                                                                 success probability curve constant with increased hash functions,
lead to large LSH hash buckets or high query selectivity, significantly
                                                                                                 the number of matches needs to be lowered, which increases the
degrading the performance of the similarity search [10, 36]. For
                                                                                                 probability of spurious matches. These spurious matches can be
example, in the extreme case when all fingerprints are hashed into a
                                                                                                 suppressed by scaling up the number of total hash tables, at the cost
single bucket, the selectivity equals 1 and the LSH performance is
                                                                                                 of larger memory usage. We further investigate the performance
equivalent to that of the exhaustive O(n2 ) search.
                                                                                                 impact of LSH parameters in the evaluation.
   Our input fingerprints encode physical properties of the waveform
data. As a result, the probability that each element in the fingerprint
is non-zero is highly non-uniform (Figure 5). Moreover, finger-
                                                                                                 6.4                            Optimization: Partitioning
print elements are not necessarily independent, meaning that certain                               In this subsection, we describe the partition and parallelization of
fingerprint elements are likely to co-occur: given an element ai is                              the LSH that further reduce its runtime and memory footprint.
non-zero, the element a j has a much higher probability of being                                 Partition. Using a 1-second lag for adjacent fingerprints results
non-zero (P[ai = 1, a j = 1] > P[ai = 1] × P[a j = 1]).                                          in around 300M total fingerprints for 10 years of time series data.
   This correlation has a direct impact on the collision probability                             Given a hash signature of 64 bits and 100 total hash tables, the total
of MinHash signatures. For example, if a hash signature contains                                 size of hash signatures is approximately 250 GB. To avoid expensive
k independent MinHash of a fingerprint and two of the non-zero                                   disk I/O, we also want to keep all hash tables in memory for lookups.
elements responsible for the MinHash are dependent, then the sig-                                Taken together, this requires several hundred gigabytes of memory,
nature has effectively similar collision probability as the signature                            which can exceed available main memory.
with only k − 1 MinHash . In other words, more fingerprints are                                     To scale to larger input data on a single node with the existing
likely to be hashed to the same bucket under this signature. For                                 LSH implementation, we perform similarity search in partitions.
fingerprints shown in Figure 5, the largest 0.1% of the hash buckets                             We evenly partition the fingerprints and populate the hash tables
contain an average of 32.9% of the total fingerprints for hash tables                            with one partition at a time, while still keeping the lookup table
constructed with 6 hash functions.                                                               of fingerprints to hash signatures in memory. During query, we
Performance impact of LSH parameters. The precision and re-                                      output matches between fingerprints in the current partition (or in
call of the LSH can be tuned via two key parameters: the number of                               the hash tables) with all other fingerprints and subsequently repeat
hash functions k and the number of hash table matches m. Intuitively,                            this process for each partition. The partitioned search yields identical
using k hash functions is equivalent to requiring two fingerprints                               results to the original search, with the benefit that only a subset of
agree at k randomly selected non-zero positions. Therefore, the                                  the fingerprints are stored in the hash tables in memory. We can
larger the number of hash functions, the lower the probability of                                partition the lookup table of hash signatures similarly to further
collision. To improve recall, we increase the number of independent                              reduce memory. We illustrate the performance and memory trade-
permutations to make sure that similar fingerprints can land in the                              offs under different numbers of partitions in Section 8.3.
same hash bucket with high probability.                                                             The idea of populating the hash table with a subset of the input
   Formally, given two fingerprints with Jaccard similarity s, the                               could also be favorable for performing a small number of nearest
probability that with k hash functions, the fingerprints are hashed to                           neighbor queries on a large dataset, e.g., a thousand queries on
the same bucket at least m times out of t = 100 hash tables is:                                  a million items. There are two ways to execute the queries. We
                           m−1                                                                 can hash the full dataset and then perform a thousand queries to
                                  t
                P[s] = 1 − ∑ [      (1 − sk )t−i (sk )i ].                                       retrieve near neighbor candidates in each query item’s hash buckets;
                           i=0    i                                                              alternatively, we can hash only the query items and for every other
The probability of detection success as a function of Jaccard simi-                              item in the dataset, check whether it is mapped to an existing bucket
larity has the form of an S-curve (Figure 6). The S-curve shifts to                              in the table. While the two methods yield identical query results,
the right with the increase in the number of hash functions k or the                             the latter could be 8.6× faster since the cost of initializing the hash
number of matches m, increasing the Jaccard similarity threshold                                 table dominates that of the search.
for LSH. Figure 6 illustrates a near-identical probability of success                               It is possible to further improve LSH performance and memory
curve under different parameter settings.                                                        usage with the more space efficient variants such as multi-probe
   Due to the presence of correlations in the input data, LSH pa-                                LSH [45]. However, given that the alignment step uses the number
rameters with the same theoretically success probability can have                                of hash buckets shared between fingerprints as a proxy for similarity,
vastly different runtime in practice. Specifically, as the number of                             and that switching to a multi-probe implementation would alter this
                                                                                                 similarity measure, we preserve the original LSH implementation for

                                                                                              1679
Ground Motion                                                                   neighbor candidates a fingerprint generates is larger than a prede-
                                                                                fined percentage of the total fingerprints, we exclude this fingerprint
                                                                                as well as its neighbors from future similarity search. To capture
                                                                                repeating noise over a short duration of time, the filter can be applied
                                                                                on top of the partitioned search. In this case, the filtering threshold
                                    Time
                                                                                is defined as the percentage of fingerprints in the current partition,
Figure 7: The short, three-spike pattern is an example of similar               rather than in the whole dataset. On the example dataset above, this
and repeating background signals not due to seismic activity. These             approach filtered out around 30% of the total fingerprints with no
repeating noise patterns cause scalability challenges for LSH.                  false positives. We evaluate the effect of the occurrence filter on
                                                                                different datasets under different filtering thresholds in Section 8.2.
backwards compatibility with FAST. We compare against alternative
LSH implementations and demonstrate the potential benefits of
adopting multi-probe LSH in the evaluation (Section 8.4).                       7.    SPATIOTEMPORAL ALIGNMENT
                                                                                   The LSH-based similar search outputs pairs of similar fingerprints
Parallelization. Once the hash mappings are generated, we can
                                                                                (or waveforms) from the input, without knowing whether or not
easily partition the input fingerprints and generate the hash signa-
                                                                                the pairs correspond to actual earthquake events. In this section,
tures in parallel. Similarly, the query procedure can be parallelized
                                                                                we show that by incorporating domain knowledge, we are able to
by running nearest neighbor queries for different fingerprints and
                                                                                significantly reduce the size of the output and prioritize seismic
outputting results to files in parallel. We show in Section 8.3 that
                                                                                findings in the similarity search results. We briefly summarize the
the total hash signature generation time and similarity search time
                                                                                aggregation and filtering techniques on the level of seismic channels,
reduces near linearly with the number of processes.
                                                                                seismic stations and seismic networks introduced in a recent paper in
                                                                                seismology [14] (Section 7.1). We then describe the implementation
6.5             Optimization: Domain-specific filters                           challenges and our out-of-core adaptations enabling the algorithm
   Like many other sensor measurements, seismometer readings can                to scale to large output volumes (Section 7.2).
be noisy. In this subsection, we address a practical challenge of
the detection pipeline, where similar non-seismic signals dominate              7.1     Alignment Overview
seismic findings in runtime and detection results. We show that                    The similarity search computes a sparse similarity matrix M,
by leveraging domain knowledge, we can greatly increase both the                where the non-zero entry M[i, j] represents the similarity of finger-
efficiency and the quality of the detection.                                    prints i and j. In order to identify weak events in low signal-to-noise
Filtering irrelevant frequencies. Some input time series contain                ratio settings, seismologists set lenient detection thresholds for the
station-specific narrow-band noise that repeats over time. Patterns of          similarity search, resulting in large outputs in practice. For example,
the repeating noise are captured in the fingerprints and are identified         one year of input time series data can easily generate 100G of output,
as near neighbors, or earthquake candidates in the similarity search.           or more than 5 billion pairs of similar fingerprints. Since it is infea-
    To address this problem, we apply a bandpass filter to exclude              sible for seismologists to inspect all results manually, we need to
frequency bands that show high average amplitudes and repeating                 automatically filter and align the similar fingerprint pairs into a list
patterns while containing low seismic activities. The bandpass filter           of potential earthquakes with high confidence. Based on algorithms
is selected manually by examining short spectrogram samples, typi-              proposed in a recent work in seismology [14], we seek to reduce
cally an hour long, of the input time series, based on seismological            similarity search results at the level of seismic channels, stations
knowledge. Typical bandpass filter ranges span from 2 to 20Hz.                  and also across a seismic network. Figure 8 gives an overview of
Prior work [13, 14, 24, 25] proposes the idea of filtering irrelevant           the spatiotemporal alignment procedure.
frequencies, but only on input time series. We extend the filter to the         Channel Level. Seismic channels at the same station experience
fingerprinting algorithm and cutoff spectrograms at the corner of the           ground movements at the same time. Therefore, we can directly
bandpass filter, which empirically improves detection performance.              merge detection results from each channel of the station by sum-
We perform a quantitative evaluation of the impact of bandpass                  ming the corresponding similarity matrix. Given that earthquake-
filters on both the runtime and result quality (Section 8.2).                   triggered fingerprint matches tend to register at multiple channels
Removing correlated noise. Repeating non-seismic signals can                    whereas matches induced by local noise might only appear on one
also occur in frequency bands containing rich earthquake signals.               channel, we can prune detections by imposing a slightly higher
Figure 7 shows an example of strong repeating background signals                similarity threshold on the combined similarity matrix. This is to
from a New Zealand seismic station. A large cluster of repeating                make sure that we include either matches with high similarity, or
signals with high pairwise similarity could produce nearest neigh-              weaker matches registered at more than one channel.
bor matches that dominate the similarity search, leading to a 10×               Station Level. Given a combined similarity matrix for each seis-
increase in runtime and an over 100× increase in output size com-               mic station, domain scientists have found that earthquake events
pared to results from similar stations. This poses both problems for            can be characterized by thin diagonal shaped clusters in the matrix,
computational scalability and for seismological interpretability.               which corresponds to a group of similar fingerprint pairs separated
   We develop an occurrence filter for the similarity search by ex-             by a constant offset [14]. The constant offset represents the time
ploiting the rarity of the earthquake signals. Specifically, if a specific      difference, or the inter-event time, between a pair of reoccurring
fingerprint is generating too many nearest neighbor matches in a                earthquake events. One pair of reoccurring earthquake events can
short duration of time, we can be fairly confident that it is not an            generate multiple fingerprint matches in the similarity matrix, since
earthquake signal. This observation holds in general except for                 event waveforms are longer than a fingerprint time window. We
special scenarios such as volcanic earthquakes [12].                            exclude “self-matches” generated from adjacent/overlapping finger-
   During the similarity search, we dynamically generate a list of              prints that are not attributable to reoccurring earthquakes. After
fingerprints to exclude from future search. If the number of near               grouping similar fingerprint pairs into clusters of thin diagonals, we

                                                                             1680
7.2 Implementation and Optimization
The volume of similarity search output poses serious challenges
for the alignment procedure, as we often need to process results
larger than the main memory of a single node. In this subsection, we
describe our implementation and the new out-of-core adaptations of
the algorithm that enable the scaling to large output volumes.
Similarity search output format. The similarity search produces
outputs that are in the form of triplets. A triplet (dt, idx1, sim) is
a non-zero entry in the similarity matrix, which represents that
fingerprint idx1 and (idx1 + dt) are hashed into the same bucket sim
times (out of t independent trials). We use sim as an approximation
of the similarity between the two fingerprints.
Figure 8: The alignment procedure combines similarity search out-
puts from all channels in the same station (Channel Level), groups Channel. First, given outputs of similar fingerprint pairs (or the
similar fingerprint matches generated from the same pair of reoccur- non-zero entries of the similarity matrix) from different channels
ring earthquakes (Station Level), and checks across seismic stations at the same station, we want to compute the combined similarity
to reduce false positives in the final detection list (Network Level). matrix with only entries above a predefined threshold.
Naı̈vely, we could update a shared hashmap of the non-zero en-
tries of the similarity matrix for each channel in the station. However,
since the hashmap might not fit in the main memory on a single ma-
chine, we utilize the following sort-merge-reduce procedure instead:
1. In the sorting phase, we perform an external merge sort on
the outputs from each channel, with dt as the primary sort
key and idx1 as the secondary sort key. That is, we sort the
similar fingerprint pairs first by the diagonal that they belong
to in the similarity matrix, and within the diagonals, by the
start time of the pairs.
2. In the merging phase, we perform a similar external merge
sort on the already sorted outputs from each channel. This
Figure 9: Earthquakes from the same seismic sources has a fixed is to make sure that all matches generated by the same pair
travel time to each seismic station (e.g. δtA , δtB in the figure). The of fingerprint idx1 and idx1 + dt at different channels can be
inter-event time between two occurrences of the same earthquake is concentrated in consecutive rows of the merged file.
invariant across seismic stations. 3. In the reduce phase, we traverse through the merged file and
combine the similarity score of consecutive rows of the file
reduce each cluster to a few summary statistics, such as the bound- that share the same dt and idx1. We discard results that have
ing box of the diagonal, the total number of similar pairs in the combined similarity smaller than the threshold.
bounding box, and the sum of their similarity. Compared to storing
every similar fingerprint pair, the clusters and summary statistics Station. Given a combined similarity matrix for each seismic
significantly reduce the size of the output. station, represented in the form of its non-zero entries sorted by
their corresponding diagonals and starting time, we want to cluster
Network Level. Earthquake signals also show strong temporal
fingerprint matches generated by potential earthquake events, or
correlation across the seismic network, which we exploit to further
cluster non-zero entries along the narrow diagonals in the matrix.
suppress non-earthquake matches. Since an earthquake’s travel time
We look for sequences of detections (non-zero entries) along each
is only a function of its distance from the source but not of the
diagonal dt, where the largest gap between consecutive detections is
magnitude, reoccurring earthquakes generated from the same source
smaller than a predefined gap parameter. Empirically, permitting a
take a fixed travel time from the source to the seismic stations on
gap help ensure an earthquake’s P and S wave arrivals are assigned
each occurrence. Assume that an earthquake originated from source
to the same cluster. Identification of the initial clusters along each
X takes δtA and δtB to travel to seismic stations A and B and that the
diagonal dt requires a linear pass through the similarity matrix. We
source generates two earthquakes at time t1 and t2 (Figure 9). Station
then interactively merge clusters in adjacent diagonals dt − 1 and
A experiences the arrivals of the two earthquakes at time t1 + δtA
dt + 1, with the restriction that the final cluster has a relatively
and t2 + δtA , while station B experiences the arrivals at t1 + δtB and
narrow width. We store a few summary statistics for each cluster
t2 + δtB . The inter-event time ∆t of these two earthquake events is
(e.g. the cluster’s bounding box, the total number of entries) as
independent of the location of the stations:
well as prune small clusters and isolated fingerprint matches, which
∆t = (t2 + δtA ) − (t1 + δtA ) = (t2 + δtB ) − (t1 + δtB ) = t2 − t1 . significantly reduces the output size.
This means that in practice, diagonals with the same offset ∆t and The station level clustering dominates the runtime in the spa-
close starting times at multiple stations can be attributed to the same tiotemporal alignment. In order to speed up the clustering, we
earthquake event. We require a pair of earthquake events to be partition the similarity matrix according to the diagonals, or ranges
observed at more than a user-specified number of stations in order of dts of the matched fingerprints, and perform clustering in parallel
to be considered as a detection. on each partition. A naı̈ve equal-sized partition of the similarity
On a run with 7 to 10 years of time series data from 11 seismic matrix could lead to missed detections if a cluster split into two
stations (27 channels), the postprocessing procedure effectively partitions gets pruned in both due to the decrease in size. Instead,
reduced the output from more than 2 Terabytes of similar fingerprint we look for proper points of partition in the similarity matrix where
pairs to around 30K timestamps of potential earthquakes. there is a small gap between neighboring occupied diagonals. Again,
1681we take advantage of the ordered nature of similarity matrix entries. of the dataset, and enable an over 100× improvement in end-to-end
We uniformly sample entries in the similarity matrix, and for every processing time. We analyze each of these components in turn:
pair of neighboring sampled entries, we only check the entries in be- First, we apply a 1% occurrence filter (+ occur filter, Section 6.5)
tween for partition points if the two sampled entries lie on diagonals during similarity search to exclude frequent fingerprint matches
far apart enough to be in two partitions. Empirically, a sampling generated by repeating background noise. This enables a 2-5×
rate of around 1% works well for our datasets in that most sampled improvement in similarity search runtime while reducing the output
entries are skipped because they are too close to be partitioned. size by 10-50×, reflected in the decrease in postprocessing time.
Network. Given groups of potential events at each station, we Second, we further reduce the search time by increasing the
perform a similar summarization across the network in order to iden- number of hash functions to 8 and lowering the detection threshold
tify subsets of the events that can be attributed to the same seismic to 2 (+ increase #funcs, Section 6.3). While this increases the
source. In principle, we could also partition and parallelize the net- hash signature generation and output size, it enables around 10×
work detection. In practice, however, we found that the summarized improvement in search time for both datasets.
event information at each station is already small enough that it Third, we reduce the hash signature generation time by improving
suffices to compute in serial. the cache locality and reducing the computation with Min-Max hash
instead of MinHash (+ locality MinMax, Section 6.2), which leads
to a 3× speedup for both datasets.
8. EVALUATION Fourth, we speed up fingerprinting by 2× by estimating MAD
In this section, we perform both quantitative evaluation on perfor- statistics with a 10% sample (+ MAD sample, Section 5.2).
mances of the detection pipeline, as well as qualitative analysis of Finally, we enable parallelism and run the pipeline with 12 threads
the detection results. Our goal is to demonstrate that: (Section 5.2, 6.4, 7.2). As a result, we see an almost linear decrease
1. Each of our optimizations contributes meaningfully to the in runtime in each part of the pipeline. Notably, due to the overall
performance improvement; together, our optimizations enable lack of data dependencies in this scientific pipeline, simple paral-
an over 100× speed up in the end-to-end detection pipeline. lelization can already enable significant speedups.
The improved scalability enables us to scale analytics from 3
2. Incorporating domain knowledge in the pipeline improves months to over 10 years of data. We discuss qualitative detection
both the performance and the quality of the detection. results from both datasets in Section 8.5.
3. The improved scalability of the pipeline enables new scientific
discoveries on two public datasets: we discovered 597 new 8.2 Effect of domain-specific optimizations
earthquakes from a decade of seismic data near the Diablo Here, we investigate the effect of applying domain-specific opti-
Canyon nuclear power plant in California, as well as 6123 new mizations to the pipeline. We demonstrate that incorporating domain
earthquakes from a year of seismic data from New Zealand. knowledge could improve both performance and result quality.
Dataset. We evaluate on two public datasets used in seismological Occurrence filter. We evaluate the effect of applying the occur-
analyses with our domain collaborators. The first dataset includes rence filter during similarity search on the five stations from the
1 year of 100Hz time series data (3.15 billion points per station) New Zealand dataset. For this evaluation, we use a partition size of 1
from 5 seismic stations (LTZ, MQZ, KHZ, THZ, OXZ) in New month as the duration for the occurrence threshold; a >1% threshold
Zealand. We use the vertical channel (usually the least noisy) from indicates that a fingerprint matches over 1% (10K) other fingerprints
each station [3]. The second dataset of interest includes 7 to 10 in the same month. We report the total percentage of filtered fin-
years of 100Hz time series data from 11 seismic stations and 27 gerprints under varying thresholds in Table 1. We also evaluate the
total channels near the Diablo Canyon power plant in California [4]. accuracy of the occurrence filter by comparing the timestamps of
Experimental Setup. We report results from evaluating the filtered fingerprints with the catalog of the arrival times of known
pipeline on a server with 512GB of RAM and two 28-thread In- earthquakes at each station. In Table 1, we report the false positive
tel Xeon E5-2690 v4 2.6GHz CPUs. Our test server has L1, L2, rate, or the number of filtered earthquakes over the total number of
L3 cache sizes of 32K, 256K and 35840K. We report the runtime cataloged events, of the filter under varying thresholds.
averages from multiple trials. The results show that as the occurrence filter becomes stronger,
the percentage of filtered fingerprints and the false positive rate both
8.1 End-to-end Evaluation increase. For seismic stations suffering from correlated noise, the
In this subsection, we report the runtime breakdown of the base- occurrence filter can effectively eliminate a significant amount of
line implementation of the pipeline, as well as the effects of applying fingerprints from the similarity search. For station LTZ, a >1%
different optimizations. threshold filters out up to 30% of the total fingerprints without any
To evaluate how our optimizations scale with data size, we eval- false positives, which results in a 4× improvement in runtime. For
uate the end-to-end pipeline on 1 month and 1 year of time series other stations, the occurrence filter has little influence on the results.
data from station LTZ in the New Zealand dataset. We applied a This is expected since these stations do not have repeating noise
bandpass filter of 3-20Hz on the original time series to exclude noisy signals present at station LTZ (Figure 7). In practice, correlated
low-frequency bands. For fingerprinting, we used a sliding window noise is rather prevalent in seismic data. In the Diablo Canyon
with length of 30 seconds and slide of 2 seconds, which results in dataset for example, we applied the occurrence filter on three out of
1.28M binary fingerprints for 1 month of time series data (15.7M the eleven seismic stations in order for the similarity search to finish
for one year), each of dimension 8192; for similarity search, we use in a tractable time.
6 hash functions, and require a detection threshold of 5 matches out Bandpass filter. We compare similarity search on the same dataset
of 100 hash tables. We further investigate the effect of varying these (Nyquist frequency 50Hz) before and after applying bandpass filters.
parameters in the microbenchmarks in Section 8.3. The first bandpass filter (bp: 1-20Hz) is selected as most seismic
Figure 10 shows the cumulative runtime after applying each opti- signals are under 20Hz; the second (bp: 3-20Hz) is selected after
mization. Cumulatively, our optimizations scale well with the size manually looking at samples spectrograms of the dataset and exclud-
1682You can also read