Dynamics and Communication Structures of Nectar Foraging in Honey bees (Apis mellifera) - Corinna Thom
←
→
Page content transcription
If your browser does not render page correctly, please read the page content below
Dynamics and Communication Structures of
Nectar Foraging in Honey bees (Apis mellifera)

                  Dissertation zur Erlangung des

              naturwissenschaftlichen Doktorgrades

     der Bayerischen Julius-Maximilians -Universität Würzburg

                          vorgelegt von

                      Corinna Thom
                              Bonn

                        Würzburg, 2002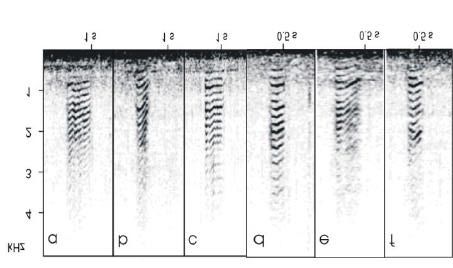
Eingereicht am:

Mitglieder der Promotionskommission:

Vorsitzender: Prof. Dr. R. Hedrich

Gutachter : Prof. Dr. J. Tautz

Gutachter: Prof. Dr. S. Fuchs

Tag des Promotionskolloquiums:

Doktorurkunde ausgehändigt am:

                                       2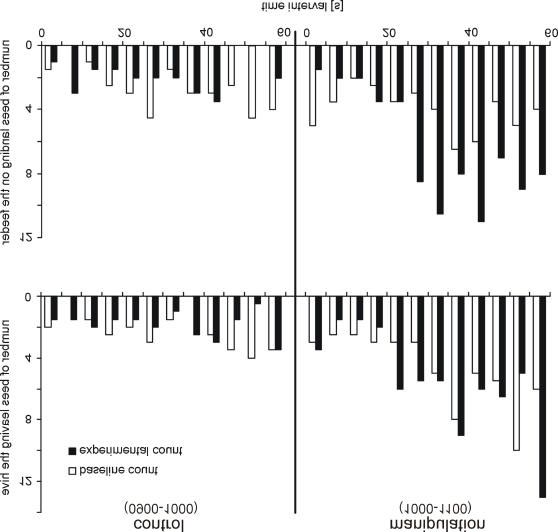
Table of Contents

GENERAL INTRODUCTION.........................................................................6
CHAPTER I
DYNAMICS IN THE ALLOCATION OF LABOR TO NECTAR
FORAGING IN HONEY BEES .......................................................................9
ABSTRACT ....................................................................................................... 10
INTRODUCTION ............................................................................................... 10
MATERIAL AND METHODS .............................................................................. 11
  STUDY SITE .................................................................................................................................11
  BEES AND OBSERVATION HIVE ....................................................................................................11
  SAMPLING AND MARKING TECHNIQUES .......................................................................................12
  BEHAVIORAL OBSERVATIONS......................................................................................................12
  DEFINITION OF A NECTAR FORAGER ............................................................................................13
  DATA ANALYSIS ..........................................................................................................................14
RESULTS.......................................................................................................... 15
  THE PERCENTAGE OF THE COLONY THAT FORAGED FOR NECTAR ................................................15
  THE ACTIVITY OF THE NECTAR FORAGERS ...................................................................................15
DISCUSSION ..................................................................................................... 18
  THE PERCENTAGE OF THE COLONY THAT FORAGED FOR NECTAR ................................................18
  THE ACTIVITY OF THE NECTAR FORAGERS ...................................................................................19
  ADAPTIVE VALUE OF COLONY-LEVEL CHANGES IN THE PERCENT , NOT THE ACTIVITY, OF THE
  NECTAR FORAGERS ......................................................................................................................20
  COMPARISON OF THE DEFINITIONS OF NECTAR FORAGERS ..........................................................20
  WHAT CAUSES THE DYNAMICS OF NECTAR FORAGING?...............................................................21
CHAPTER II
DO HONEY BEES PRODUCE A VOLATILE CHEMICAL TO ACTIVATE
FORAGERS? ..................................................................................................... 23
ABSTRACT ....................................................................................................... 24
INTRODUCTION ............................................................................................... 24
MATERIAL AND METHODS .............................................................................. 25
  BEES AND OBSERVATION HIVES ..................................................................................................25
  TRAINING OF BEES ......................................................................................................................26
  EXPERIMENTS .............................................................................................................................26
  BASELINE COUNTS ......................................................................................................................27
  STATISTICAL ANALYSIS ...............................................................................................................27

                                                                                                                                                   3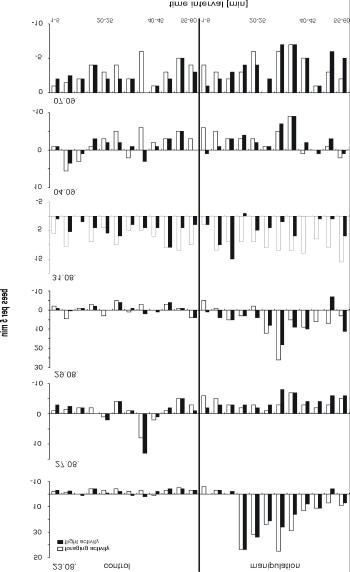
RESULTS.......................................................................................................... 28
DISCUSSION ..................................................................................................... 31
CHAPTER III
WORKER PIPING IN HONEY BEES: THE BEHAVIOR OF PIPING
NECTAR FORAGERS ................................................................................... 33
ABSTRACT ....................................................................................................... 34
INTRODUCTION ............................................................................................... 34
MATERIAL AND METHODS .............................................................................. 35
   STUDY SITE AND BEE COLONIES ..................................................................................................35
   TRAINING OF BEES ......................................................................................................................35
   SOUND ANALYSIS ........................................................................................................................36
   CONTEXT OF WORKER PIPING ......................................................................................................36
   BEHAVIOR OF PIPING AND NON-PIPING NECTAR FORAGERS .........................................................37
   STATISTICAL ANALYSIS ...............................................................................................................38
RESULTS.......................................................................................................... 38
   1. PIPING SIGNALS ARE FREQUENCY MODULATED .......................................................................38
   2. WORKER PIPING IS ASSOCIATED WITH NECTAR FORAGING.......................................................40
   3. IDENTITY OF PIPING NECTAR FORAGERS ..................................................................................42
   4. BEHAVIOR OF PIPING NECTAR FORAGERS ................................................................................43
   5. BEHAVIOR OF PIPING TREMBLE DANCERS ................................................................................45
   6. IDENTITY OF BEES THAT RECEIVED PIPING SIGNALS .................................................................50
   7. BEHAVIOR OF BEES AFTER THEY RECEIVED A PIPE...................................................................50
DISCUSSION ..................................................................................................... 51
CHAPTER IV
TREMBLE DANCING IN HONEY BEES CAN BE STIMULATED
DIRECTLY BY HIVE-EXTERNAL FACTORS ........................................... 55
ABSTRACT ................................................................................................................................. 56
INTRODUCTION ....................................................................................................................... 56
MATERIAL AND METHODS ................................................................................................. 57
   STUDY SITE AND OBSERVATION HIVES ........................................................................................57
   MEASURING DECISION TIME AND DANCES ...................................................................................58
   EXPERIMENT ...............................................................................................................................58
   STATISTICAL ANALYSIS ...............................................................................................................60
RESULTS.......................................................................................................... 61
   DANCES AND DECISION TIMES OF NECTAR FORAGERS THAT VISITED A NON- CROWDED VERSUS A
   CROWDED FEEDER .......................................................................................................................61
   DECISION TIMES OF NECTAR FORAGERS THAT VISITED NATURAL NECTAR SOURCES ...................66

                                                                                                                                             4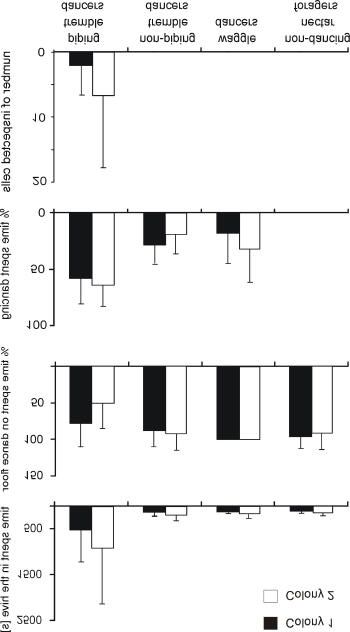
DISCUSSION ..................................................................................................... 67
SUMMARY ....................................................................................................... 71
REFERENCES................................................................................................... 74
APPENDIX........................................................................................................ 80
ZUSAMMENFASSUNG ...................................................................................... 81
CURRICULUM VITAE....................................................................................... 85
PUBLICATIONS ................................................................................................ 88
ACKNOWLEDGEMENTS .................................................................................. 90
ERKLÄRUNG ................................................................................................... 91

                                                                                                                 5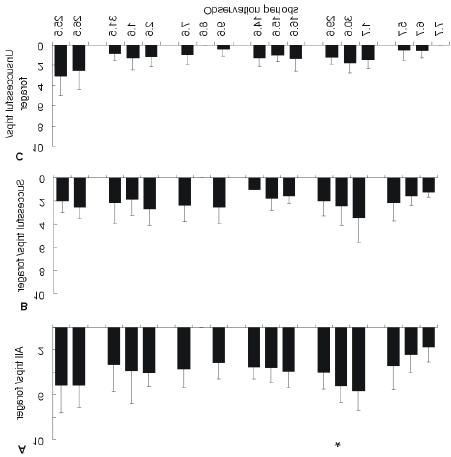
General Introduction
The tremendous ecological success of social insects is based on the internal organization of their
colonies. Social insects coordinate their action without central control. The mechanisms that
organize their colonies are the division of labor, whereby members specialize in a subset of all
tasks the colony has to perform, and the coordination and behavioral integration of individuals
(Oster & Wilson 1978, Wilson 1987, Hölldobler & Wilson 1990, Bourke & Franks 1995).
Division of labor allows individuals to concentrate their task performance, and thus to specialize
to tasks. Integrating the specialized members into colony processes, and coordinating their
combined action then allows the colony to efficiently master several tasks at the same time
(Oster & Wilson 1978, Seeley 1995).
      The most basic division of labor in social insect colonies exists between the reproductive
and the non-reproductive individuals. A further division of labor exists between the non-
reproductive individuals, the workers, of the colony. Two general patterns of division of labor
among workers are recognized: 1. temporal polyethism, in which the worker’s physiological
state and its probability of task performance are correlated with age, and specializations are
therefore temporary, and 2. physical polyethism, in which workers are morphologically adapted
to certain tasks, and thus permanently specialized. While physical polyethism is observed only in
relatively few species, temporal polyethism is widespread among social insects (Wilson 1971,
Hölldobler & Wilson 1990, Oster & Wilson 1978). This is possibly because a system with
flexible specializations can react more efficiently to environmental changes than a system with
permanent specialization, and has thus an advantage in most environments (Seeley 1995).
      The mechanisms that allocate a colony’s labor among different tasks are various and
operate on several levels. One principal factor that ensures an efficient allocation of labor is
communication among colony members. Communication has been defined in several ways, but
generally occurs when information given by one group member influences the behavior of
another group member in a way that benefits the sender of the information (e.g. Wilson 1971,
Bradbury and Vehrencamp 1998 ). A social insect usually benefits from releasing information to
colony members, because the reproductive interests of the sender and receiver of information in
a colony are closely related to each other and depend on the state of their common colony. Both
sender and receiver of information can either be an individual or a group. Thus, information can

                                                                                                     6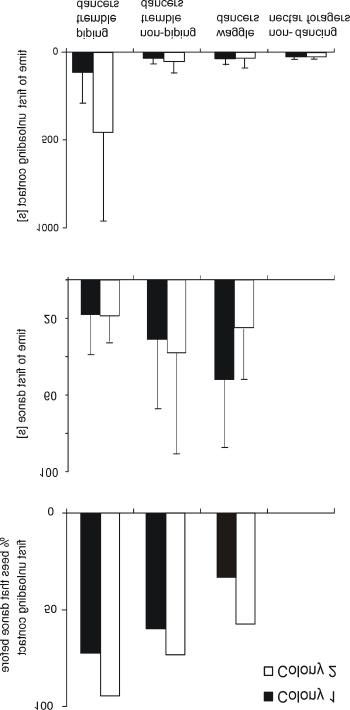
General Introduction

flow from individual to individual, from the individual to the group and from the group to the
individual.
       There are two general ways of how information can be transmitted: 1. via signals that are
shaped by natural selection specifically to convey information (e.g. recruitment dances), and 2.
via cues that convey information although they have not been shaped by natural selection to do
so (e.g. degree of crowding at a food source) (Lloyd 1983, Seeley 1995). The process of group
integration is largely a matter of information flow from the group to the individual, so that each
individual can tune its activities in accordance with the activities of the other group members.
When information flows from a group to an individual, cues are usually predominant over
signals. A group will typically produce cues as a by-product of their combined actions that
individuals can use to tune their behavior in on the group. On the other hand, specific signals that
inform about the state of a group will only rarely evolve (Seeley 1995).
      The modes of communication in social insects are extremely diverse and include chemical,
visual, acoustical, and tactile signals (e.g. Hölldobler & Wilson 1990, Bradbury and Vehrencamp
1998). The best studied communication signal in social insects is probably the waggle dance of
the honey bee (Apis mellifera). The waggle dance serves to recruit foragers to profitable food
sources and is part of a complex feedback system. This system allows a honey bee colony to
efficiently allocate workers among the two subtasks of foraging, nectar collection and nectar
reception, and to concentrate the nectar collectors’ effort on the most profitable food sites (e.g. v.
Frisch 1967, Lindauer 1948, Seeley 1995). Thus, the foraging communication system allows
honey bees to forage efficiently in an unpredictable environment. Although the foraging
communication of honey bees has long fascinated researchers, we are only beginning to
understand how the interactions of the system components organize the task of foraging (e.g. v.
Frisch 1967, Lindauer 1948, Nieh 1993, Kirchner 1993, Kirchner & Lindauer 1994, Seeley
1995). In this thesis, I examine several aspects of honey bee foraging to achieve a better
understanding of how communication serves to allocate labor and to integrate the behavior of
colony members into the colony’s collective foraging effort.
    In the first of the thesis’ four chapters, I address the basic question of how a honey bee
colony organizes its nectar foraging effort from day to day. I do so by examining the dynamics of
two factors that largely determine colony foraging effort, the number and activity of a colony’s
nectar foragers. The following three chapters are then devoted to the foraging communication
system of the honey bees. In the second chapter, I investigate whether honey bees produce a

                                                                                                    7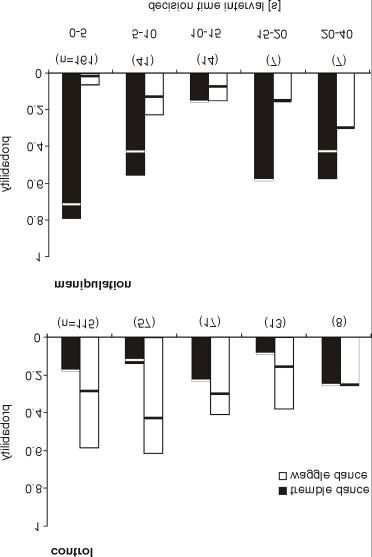
General Introduction

chemical signal to quickly activate nectar foragers. A fast volatile signal may complement as an
activating signal the waggle dance, which activates foragers relatively slow and in a restricted
area of the hive, but more specific as to quality and location of a food source. The third chapter
introduces a signal that functions in the foraging communication system, the brief piping signal
of nectar foragers (Nieh 1993, Kirchner 1993). I experimentally establish the context of the
signal, examine its acoustic properties, and describe for the first time the unique behavior of the
nectar foragers that produce brief piping signals. I then discuss cause and function of the signal
in the foraging communication system.
   Some of my observations on the behavior of piping nectar foragers have implications for
another signal in the foraging communication system, the tremble dance. The tremble dance is
regularly performed by nectar foragers to adjust and coordinate the colony’s foraging effort
(Lindauer 1948, Kirchner 1993, Seeley 1992, Seeley et al. 1996). The cause of the tremble dance
was shown to be a long unloading delay for returning nectar foragers. Returning foragers unload
their nectar not into cells, but to a receive r bee. A shortage of receiver bees will lead to long
unloading delays, which stimulate nectar foragers to tremble dance and thus to recruit additional
nectar receiver bees. In the fourth chapter of my thesis, I examine whether hive-external tremble
dance factors can also directly stimulate tremble dancing, and discuss the implications this has
for the function of the tremble dance in the foraging communication system of the honey bee.

                                                                                                  8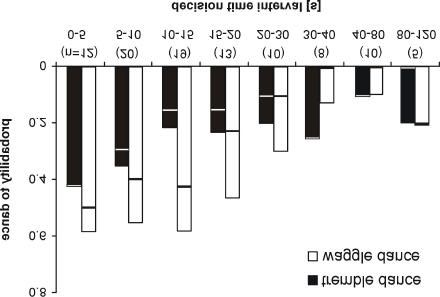
Chapter I

Dynamics in the allocation of labor to nectar foraging in a
honey bee colony

                                                              9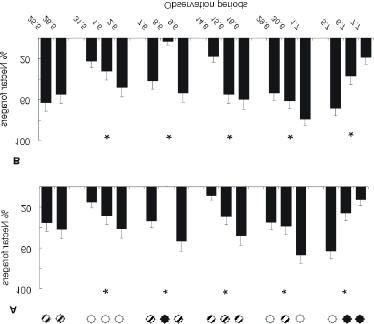
Dynamics of nectar foraging

Abstract
    In a honey bee colony, the adjustment of the labor devoted to nectar foraging is expected to
be adaptive, because foraging conditions strongly fluctuate. The proportion of a colony’s
workers engaged in nectar foraging and the ac tivity of each nectar forager are two parameters
that might be involved in the adjustment. In this study I measured for the first time the proportion
and activity of nectar foragers in a honey bee colony. Random samples of 50 bees were
individually marked and observed during 6 3- day observation periods in late spring and early
summer. Observations started at 0500 and lasted without interruption until 1900-2100 or until
foraging activity stopped. The identity of each marked bee that left or entered the hive and both
the departure and arrival times of the trips were recorded. A nectar forager was defined as a bee
that, after a trip of 10 min or longer, unloaded at least once a day liquid to a receiver bee (Fig. 1).
Between 0 and 67% of the workers engaged in nectar foraging on a given day, with a mean of 34
± 18% per day. The percent nectar foragers in the colony changed significantly between days in
5 of 6 observation periods (Fig. 2). On average, 66% of the nectar foragers made 1-4 foraging
trips per day, 34% made 5-10 trips, and no bee made more than 10 foraging trips per day (Fig.
3). The mean number of trips per nectar forager per day was 3.5 ± 1.3. The majority of the nectar
foragers (over 70%) foraged for 4.5 h or less, even though there were approximately 15 h of
daylight each day. The activity of the nectar foragers in the colony changed significantly
between days in only 1 of 6 observation periods (Fig. 4). The results of this study suggest that a
honey bee colony adjusts its daily foraging effort mainly by changing the number of nectar
foragers rather than the activity of the nectar foragers. This might enable a colony to exploit
nectar sources faster and more efficient. It is likely that the changes found in the allocation of
labor to nectar foraging are due to changes in the nectar that is available to the nectar foragers.

Introduction
   Division of labor is common to all insect societies and is regarded as one of the most
important factors in their ecological success (Bourke & Franks 1995, Hölldob ler & Wilson 1990,
Wilson 1985, 1987). A key feature of the division of labor in insect colonies is its plasticity.
Changing the allocation of workers among tasks enables a colony to respond adaptively to
changes in external and internal conditions (Gordon 1989, Robinson 1992, Seeley 1995).

                                                                                                          10
Dynamics of nectar foraging
Flowers, the ephemeral food sources of honey bees, are subject to strong temporal and spatial
fluctuations. Hence, adjustment of the foraging effort of a honey bee colony is likely to enhance
it’s ability to gather enough nectar for survival and reproduction. Although there are several
ways by which a colony can adjust the allocation of its workers among different task (Robinson
1992), one of the most important is the behavioral flexibility of the individual workers in a
colony. A colony’s rate of nectar collection is a function of three variables: (1) number of active
nectar foragers, (2) mean activity level of the nectar foragers, and (3) mean volume of the nectar
loads (Seeley 1995). Each of these variables might be adjusted by the behavioral flexibility of the
nectar foragers to cope with changing conditions. Some is known about the third variable: load
volume increases the higher the quality of the nectar source, and it decreases the greater the
distance of the source from the hive (Núnez & Giurfa 1996, Schmidt-Hempel et al. 1985).
However, the mean volume of nectar loads probably varies only by a factor of two or three
(Winston, 1987), while the number and the mean activity of nectar foragers may each vary by a
factor of ten or more. Thus, changes in the mean volume of nectar loads probably contribute
relatively little to the adjustment of a colony’s nectar foraging effort. By counting and observing
the nectar foragers in random samples of honey bee workers, I was able to monitor for the first
time changes in the number and the activity of the nectar foragers in an undisturbed honey bee
colony.
Material and Methods
Study site
The study was conducted in May, June and July, 1999, at the honey bee laboratory of the
University of Würzburg, Germany. The laboratory is surrounded by fruit orchards and rape
(Brassica napus) fields which provided nectar in May and June.
Bees and observation hive
Observations were made on one colony of the carniolan honey bee, Apis mellifera carnica. The
colony (about 4000 bees) was housed indoors in a three-frame observation hive with internal
dimensions of 65 cm * 45 cm * 5 cm, with an entrance tunnel leading outside. The colony
inhabited the hive since May, 1998, hence was well established by the time I began the
observations. No supplementary feeding was necessary. The queen and brood were restricted to
11Dynamics of nectar foraging
the lowest frame by a queen excluder, while the workers could move freely between the frames.
The upper two frames of the hive always provide d abundant storage room for the nectar that was
gathered by the foragers.
Sampling and marking techniques
A random sample of 50 bees was marked at about 2300 the night before I began each 3-day
period of observations. The random sample was obtained by placing paper grids, each with 150
rectangles, on both sides of the opened hive, and collecting from each rectangle the bee that was
closest to the center. These 300 bees were put in two small cages; from each cage 25 bees were
randomly selected, yielding a sub-sample of 50 bees. The other bees were then returned to the
observation hive. The bees of the sub-sample were individually marked by gluing number tags
(Opalithplättchen) to their thoraces. The marked bees were put back into their colony
immediately after marking; no aggressive interactions with other workers that might influence
the behavior of the marked bees were observed. The number of marked bees was recorded on
each day of observation.
Behavioral observations
Observations were made for three consecutive days (one observation period) after the marking of
the bees. Altogether, there were 6 observation periods. The data from 24 May 1999, the first day
of the first period, were not included in the analysis, as the observation methods were still being
refined. Observations started at 0500 and lasted without interruption until 1900-2100 or until
foraging activity stopped. During observations, the entrance tunnel and the unloading area inside
the hives’ entrance were watched to determine the identity of each marked bee that left or
entered the hive, and to record both departure and arrival times of these bees. The time records
enabled me to determine the number of trips per worker and the length of each trip (time outside
the hive). If only the departure or the arrival was observed, the number of trips per bee could still
be calculated, while the time the bee spent on this trip could not. It is very unlikely that both the
departure and the arrival of a marked bee were missed. Upon entry into the hive, each marked
bee was observed until either she unloaded liquid, by allowing another worker to put its
proboscis between her mandibles and suck up the regurgitated liquid, or she received food
herself, without prior unloading.
12Dynamics of nectar foraging
Definition of a nectar forager
Nectar foragers had to be distinguished from other bees entering the hive, such as pollen
foragers, water collectors, and bees returning from orientation flights. Only twice did I
observe a pollen forager, easily recognized by the conspicuous pollen loads, in the sample
of marked bees. Water collectors do not differ visibly from nectar foragers. However,
water collecting trips typically require less than 5 min outside the hive when a water source
is close to the hive (Park 1923, Robinson 1984, Kühnholz & Seeley 1997). The only water
source in the vicinity of Würzburg’s bee laboratory was about 15 m from the observation
hive, hence water collectors could easily have completed trips to the source in 5 min or
less. In any event, as long as water
collectors did not take longer than 10
min for their flights, I avoided
confusing water collectors with nectar
foragers because I used a 10-min flight
time as acceptance threshold for nectar
foragers. I did so to distinguish nectar
foragers from bees that made
orientation flights. Our reasoning for
using a 10-min acceptance threshold
was as follows: when I compared the
number of successful foraging trips
(liquid was brought back) of a given
duration to the number of unsuccessful
foraging trips (no liquid was brought
back) of the same duration, I found Fig. 1 The number of successful foraging trips
many more unsuccessful trips lasting of a certain duration (time outside the hive)
(A), compared to the number of unsuccessful
1-10 min than expected from the trips of the same duration (B).
number of successful (hence
confirmed) foraging trips (Fig. 1). This suggests that most of the orientation flights lasted
1-10 min. To be conservative, I considered only trips that lasted longer than 10 min as
possible foraging trips. Definition A, which is more conservative than Definition B, defines
as nectar foragers for a given day those bees that, at least once that day, unloaded liquid
13Dynamics of nectar foraging
after a trip longer than 10 min (“successful” nectar foragers). Thus, Def. A might exclude
foragers that were not able to gather nectar although an attempt was made (“ unsuccessful”
nectar foragers). Definition B defines as nectar foragers for a given day those bees that, at
least once that day, made a trip longer than 10 min. Thus, Def. B might include bees that,
although out for longer than 10 min, did not attempt to forage for nectar. Since the more
conservative Def. A includes only confirmed nectar foragers, it may reveal the dynamics of
nectar foraging clearer than Def. B, although the estimates of the percent nectar foragers
might be low. The values given in the Results are based on the data obtained with Def. A.
When Def. B is used, this will be noted in the text. Def. B will be considered mainly in the
Discussion.
Data analysis
The data obtained by observing the nectar foragers in the sample were used to estimate the
percent nectar foragers in the colony and the activity of the nectar foragers, that is the number of
foraging trips per nectar forager per day, as well as the time a nectar forager spent outside the
hive per day.
Standard deviations for the percent nectar foragers on a day were estimated with the method
given for binomial distributions by Sokal and Rohlf (1995). Confidence intervals (Sokal & Rohlf
1995) were used to detect significant changes in the percent nectar foragers between days within
each 3-day observation period. Every foraging trip was categorized as either “successful” (when
the bee unloaded liquid upon return), as “unsuccessful” (when the bee did not unload liquid
before she received nectar herself), or as “unidentified” (when the bee could not be observed).
The sum of all categories is the total number of foraging trips recorded. For each category, the
average number of trips per nectar forager per day was calculated, as well as the average number
of all trips per nectar forager per day. Means are given with one standard deviation. Kruskal-
Wallis Tests (Heath 1995) were used to detect significant changes in nectar foraging activity
between days within each 3-day observation period.
The mean daily temperature and the relative air humidity were recorded by the Deutscher
Wetterdienst. The weather station and the apiary are about 15 km apart. Data about temperature
and relative air humidity were used for Pearson Product Moment correlations with the percent
nectar foragers. The data were analyzed using Microsoft Excel ‘98 and the ‘99 edition of
Statistica.
14Dynamics of nectar foraging
Results
The percentage of the colony that foraged for nectar
The percent nectar foragers in the colony was estimated for each of the 17 days of observation
(Fig. 2A).
Fig. 2 A presents the percentage of the
colony that foraged for nectar when
Definition A is used. Good weather
(>18°C, no rain), is indicated by a light
sun, medium weather (15-18°C, light
rain showers) by a half-filled sun, and
bad weather (Dynamics of nectar foraging
Fig. 3 The
frequency
distribution of trips
per nectar forager
per day.
The mean number of trips per nectar forager per day was 3.5 ± 1.3. On average, a forager made
1.9 ± 0.7 successful trips, 1.2 ± 0.8 unsuccessful trips and 0.5 ± 0.35 unidentified trips per day. It
can be assumed that successful and unsuccessful trips were equally likely to be missed, therefore
no systematic bias in the counts of successful or unsuccessful trips is expected. The majority of
the nectar foragers (over 70%) foraged for 4.5 hrs or less even though there were approximately
15 hours of daylight each day.
Changes in the activity of the foragers, which might have influenced the colony’s nectar
foraging effort, occurred rarely: only in 1 (29.6.-1.7.) of the 6 observation periods did the mean
number of trips per nectar forager vary significantly between days (Fig. 4).
16Dynamics of nectar foraging
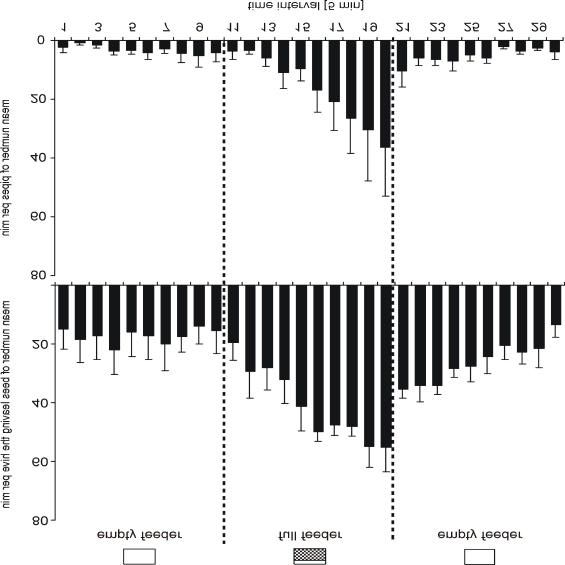
Fig. 4 The activity of the foragers (Def. A); means with one standard deviation.
A number of all trips/nectar forager/day, B number of successful trips/nectar
forager/day, C number of unsuccessful trips/nectar forager/day. Stars
indicate a significant change in activity between days.
Neither the number of successful nor the number of unsuccessful trips per forager changed
between days . The number of successful trips per forager was correlated with the percent nectar
foragers of the colony (r2 = 0.63, p < 0.001), while the number of unsuccessful trips per forager
was not correlated with the percent nectar foragers (p > 0.28). No correlation was found between
temperature and the activity of the nectar foragers (p = 0.48). The relative air humidity was
negatively correlated with the activity of the nectar foragers (r2 = 0.38, p = 0.007).
17Dynamics of nectar foraging
Discussion
Extensive work has been done on the foraging behavior of the honey bee (Seeley 1985,
Winston 1987), but little is known about the daily adjustments of a colony to its internal needs
and the external opportunities of foraging (Park 1929, Seeley 1995). By observing samples of
workers of one colony over the course of late spring and early summer, I measured for the first
time the percent nectar foragers in a colony. I also determined how the percent nectar foragers
and the activity of the nectar foragers changed between days. The conclusions drawn from the
results of this study are based on observations of one colony, and should thus be considered as
preliminary conclusions. However, this study serves as a starting point to further investigations
of the dynamics of nectar foraging in honey bees.
The percentage of the colony that foraged for nectar
The percentage of the colony that foraged for nectar was surprisingly high, up to 67% in one
observation period (29.6.-1.7.). Hence, in that period, only 33% of the colony were hive bees, i.e.
bees devoted exclusively to tasks within the hive. The high percent nectar foragers might have
been due to the small size of the colony (approximately one–fifth the population of a full-sized
colony (Winston 1987)). Small colonies of social insects have been found to put more energy
into foraging than large colonies, to foster growth of the colony’s population [Gordon 1991,
Winston & Ferguson 1985]. However, the temporal pattern of foraging traffic over a day closely
resembled the pattern found for full-sized colonies. Thus, it seems likely that the results are not
simply due to small colony size, but rather that the percent nectar foragers in a colony is often
higher than the 25% that were previously guessed (e.g. Seeley 1995).
To understand the dynamics in the allocation of labor to nectar foraging, not only the daily
mean percentage of foragers, but also the variation between days, is of interest. The percent
nectar foragers in the colony varied significantly between days (Fig. 2). It may be argued that the
significant changes in the percent foragers were due to the fact that each sample of bees was no
longer random on the second and third day of observation. Since a honey bee worker’s age and
task are strongly related to each other (Lindauer 1952, Oster & Wilson 1978, Rösch 1930, Seeley
1985), workers might have switched tasks as they were getting older in the three days of
observation. Thus, on the second and third day of observation there may have been more
foragers, typically the oldest workers, in the sample than was representative for the colony.
However, the percent nectar foragers was not significantly higher on the second or third day (p >
18Dynamics of nectar foraging
0.1 for a comparison of the mean percent foragers on day 1 vs. day 2 or 3) than on the first day.
Thus, it appears that the changes in percent foragers were not caused entirely by the aging of the
workers during each 3-day observation period. Hence I believe that change in the percent nectar
foragers was indeed involved in the adjustment of the colony’s foraging effort.
The activity of the nectar foragers
The average number of trips per nectar forager per day, 3.5 ± 1.3, was low compared to prior
studies which report means between 6-15 trips per day (Park 1929). In experiments involving
artificial feeders that provide sugar water, nectar foragers may make 150 trips or more per day
(Winston 1987). From this, it can be assumed that an average of 3.5 trips per forager per day did
not exhaust the foragers’ work capacity, especially as they spent on average only 4.5 hours
outside the hive, not making use of the other approximately 10 h of daylight each day. The low
number of hours per day that workers spent engaged in foraging raises the question of what
nectar foragers do inside the hive. This question is especially interesting given the high percent
nectar foragers in the colony. Great behavioral flexibility is generally assumed in honey bees, but
the transition from in-hive tasks to foraging tasks is regarded as a permanent, one-way
behavioral transition for a worker. In experiments, foragers could be induced to perform hive
duties only after severe manipulations of the colony’s age demography, that is, only after
virtually all the younger hive bees were removed from the colony (Milojevic 1940, Robinson et
al.1992, Rösch 1930, Winston & Fergusson 1985). More observations of individual nectar
foragers in undisturbed colonies will be needed to show what nectar foragers do inside the hive,
and hence to answer the question of whether the gap between hive bees and foragers is in fact as
wide as assumed.
To learn about the dynamics of nectar foraging, not only the mean activity of the foragers has
to be considered, but also whether the activity varied significantly between days. In fact, the
results of this study show with just one exception, that there were no significant differences in
mean foraging activity between the days of an observation period (Fig. 4). This suggests that a
honey bee worker tends to make a binary decision to either forage or not, rather than a graded
decision about the level of foraging activity.
19Dynamics of nectar foraging
Adaptive value of colony-level changes in the percent, not the activity, of the nectar foragers
The results reported here suggest that the percent nectar foragers of a colony is the most
important variable in the daily adjustment of the nectar foraging effort of a honey bee colony. As
this variable gets adjusted on the individual level by the behavioral flexibility of the workers, it
adjusts the foraging effort on the colony level.
Why is the percent nectar foragers adjusted more than the activity of the nectar foragers? A
colony should try to exploit the ephemeral nectar sources fast, to gain as much nectar as possible
before the flow stops. Hence, it might be adaptive for a colony to allocate many foragers to a
source, to exploit it quickly before unfavorable conditions stop the nectar flow, instead of
allocating fewer foragers which would need longer to exploit the source fully even if they raised
the level of their foraging activity.
It can also be hypothesized that coordinating the activity level of the nectar foragers would
hinder, rather than foster, an efficient exploitation of the nectar sources. A colony-level
adjustment requires coordinated actions at the individual level. For this, information has to be
shared. Recruitment signals like the waggle dance broadcast information about the nectar
availability and thus the need for more bees functioning as nectar foragers (v. Frisch 1967).
Therefore, the nectar foragers can adjust their numbers to the present situation by responding to
shared information. On the other hand, the activity of a forager should not depend on shared
information, but on each bees’ assessment of the quality of the particular source she is exploiting
(Seeley et al. 1991). When the source quits producing nectar, a worker should stop spending
energy on foraging trips, regardless of what the other nectar foragers are doing. Thus, in a
situation where the nectar foragers of a colony exploit sources with different properties, the
activity should differ between foragers. In a situation where most of the foragers exploit the
same source, all foragers might have a similar activity. This later situation might have been the
case on 1 July, the only day on which the activity of the foragers rose significantly (Fig. 4). This
day also had the highest percent nectar foragers; it is probable that a nectar rewarding plant came
into flower and was exploited by the majority of the foragers.
Comparison of the definitions of nectar foragers
For both definitions of a nectar forager it can be concluded that the percent nectar foragers in the
colony is the main variable for the adjustment of the colony’s foraging effort. When Def. B (a
nectar forager made at least one trip longer than 10 min on a given day) was applied, the mean
20Dynamics of nectar foraging
percent nectar foragers in the colony was 45 ± 20% per day. The mean percentage changed
significantly in 5 of 6 observation periods (Fig. 2B). The mean activity was 3.4 ± 1.4 trips per
forager per day and significant changes in activity between days occurred in only 2 of 6
observation periods. Significantly more bees making fewer trips were defined as nectar foragers
by Def. B as opposed to Def. A, possibly because unsuccessful foragers decided to stop foraging
sooner than successful ones. Estimates of the percent nectar foragers and their activity that are
based on the more conservative Def. A might be lower than they should be, but changes in the
pattern of nectar foraging might be easier to detect, as only the behavior of confirmed nectar
foragers was analyzed. The values found with the less conservative Def. B might be higher than
they should be. To know whether bees that are classified as unsuccessful nectar foragers really
are functioning as nectar foragers, it would be helpful to observe the bees for more than three
days. With longer observation periods, unsuccessful foragers might have been clearly classified
as nectar foragers on earlier days. Thus we might be able to understand better how unsuccessful
foragers contribute to the daily dynamics of nectar foraging.
What causes the dynamics of nectar foraging?
Although the question of what caused workers to decide for or against nectar foraging on a given
day cannot yet be fully answered, some clues are revealed by this study. Frequently, workers
made a few short flights, often before they started foraging. These flights were not long enough
to gather nectar, but it is possible that foragers checked former nectar sources and based their
foraging decisions on the information about the nectar availability at these sources. Also,
workers could have gathered information about the weather. Effects of the temperature on nectar
foragers have often been reported (Bräuninger 1964, Schuà 1952) , but sometimes, as in this
study, no causal relationship is found. Both temperature and relative air humidity could have an
indirect, rather than a direct effect on the foragers as they affect the state of flowers and hence
the nectar availability (Núnez 1977, Winston 1987). Rain can wash the nectar out of flowers and
it can take up to 24 h before enough nectar accumulates again to attract bees. I found a negative
correlation between humidity and the percent nectar foragers, which might have been caused by
the risk of rain for flying bees. In this study, direct and indirect effects cannot be separated from
each other. Thus, no definite answer can be given as to the cause of the dynamics in the
allocation of labor to nectar foraging, but fluctuations in the availability of nectar might have
been the major reason.
21Dynamics of nectar foraging
Studies of the dynamics of nectar foraging under conditions of controlled nectar availability
are needed, if possible on full-sized honey bee colonies, to reveal the link between the
adjustment of a colony’s foraging effort and the nectar availability. The number of recruitment
dances over a day may be a good indicator of the availability of nectar that is relevant for the
bees (not all available nectar is relevant for the bees, as not all nectar sources are discovered and
because nectar foragers selectively exploit the best of the nectar sources that are discovered
(Seeley 1986). If so, and if the number of dances on a given day can be related to the mean
percent nectar foragers at the same day, then this would show that the percent nectar foragers in a
colony gets adjusted in relation to the relevant nectar availability. Hence, the dance pattern of a
day might provide an easy test of the ecological factor underlying the adjustment of the percent
nectar foragers in a honey bee colony.
22Chapter II
Chapter II
Do honey bees produce a volatile chemical to activate
foragers?
23Activation of nectar foragers
Abstract
A honey bee colony frequently adjusts the number of its nectar foragers to changes in foraging
conditions. It is possible that workers use a volatile substance, e.g. a pheromone, to quickly
activate foragers in all regions of the hive. To test whether a foraging colony can activate
foragers of a non- foraging colony via a volatile substance, I connected two colonies with a glass
tube that allowed volatiles to drift between colonies. Each colony had access to a different green
house. During the experiment, one colony was allowed to forage odor- less sugar water. I then
recorded of the colony that did not have sugar water available the number of workers that each
left the hive and arrived at an empty feeder station per time unit. In 50 % of all experiments did
the foraging colony activate foragers of the non-foraging colony to visit an empty feeder station
with a volatile substance. The results show that nectar foragers can be activated via a volatile
substance. However, it remains to be investigated why foragers were not activated in all
experiments. It is possible that negative results were due to the weak state of the non-foraging
colony and cold weather at the time of experiment.
Introduction
Honey bee (Apis mellifera) colonies frequently adjust their foraging effort to changes in
foraging conditions (Park 1929, Seeley 1995, Thom et al. 2000). It has long been known that
waggle dancing honey bees can raise the number of foragers at nectar, pollen or water sources.
Waggle dancers recruit both novice and experienced foragers by communicating information
about the location and quality of a source (e.g. v. Frisch 1967). However, the recruitment rate of
waggle dancers is relatively low. On average, a waggle dancer recruits 1 or 2 foragers per 15 min
to a new source (v. Frisch 1967). Re-activation via the waggle dance of those nectar foragers that
already know the adve rtised source may be more efficient. However, only those nectar foragers
are likely to be reached by the signal that are on the dance floor, a small area close to the hive
entrance where most waggle dances are performed (Tautz 1996).
While indispensable to a colony’s foraging success, the waggle dance might serve to recruit
foragers to a specific food source rather than to generally raise the foraging effort by activating
foragers. Therefore, it is plausible to assume that honey bees employ other mechanisms than the
waggle dance to quickly activate nectar foragers.
24Activation of nectar foragers
Honey bees, like all other social insects, strongly rely on pheromones and other chemical
substances for communication (e.g. Winston 1987, Hölldobler and Wilson 1990). Several
pheromones are used to mark food and water sources for higher attraction and better orientation,
e.g. the Nasonov pheromone (v Frisch 1923, v. Frisch & Rösch 1926, Free & Racey 1966, Free
& Williams 1970, 1972), foodprint pheromones (Ribbands 1955, Lecomte 1956, Butler et al.
1969, Ferguson & Free 1979, Williams et al. 1981), a sting- produced compound, (Z)-11-
eicosen-1-ol (Pickett et al. 1982, Free et al. 1982), and food-marking pheromones (Ferguson &
Free 1979). These substances are also used to mark flowers, although flowers often (not always)
have an identifying odor themselves (v. Frisch 1967). The chemical marker may enhance flower
odor or make it better perceptible.
It is possible that honey bees produce volatile substances inside the hive for a fast activation
of the colony’s forager force. This activation signal might be used whenever foragers inside the
hive should be informed quickly about a favorable change of foraging conditions, but not about
the location of a source. This is e.g. in the morning, after rain, or whe n an established but
temporarily dried nectar source becomes suddenly available again.
In this study, I tested the hypothesis that volatile substances are produced in a foraging
colony that raise the colonies nectar foraging effort. I did this by allowing volatile substances
that were produced by a foraging colony to drift through a glass tube into another colony that did
not have access to food. The colonies had each access to a different green house, to control
foraging activity and to prevent e.g. flower odors from influencing the outcome of the
experiment.
Material and Methods
Bees and observation hives
The study was conducted in August and September, 2001, at the honey bee laboratory of the
University of Würzburg, Germany. Two colonies, Colony 1 and Colony 2, of the carniolan
honey bee, Apis mellifera carnica were used for the experiments The colonies were housed
outdoors in two-frame observation hives with internal dimensions of 45 * 45* 5 cm. A wedge in
the entrance of the hive directed incoming bees to the front side of the comb. The hives were
placed between two greenhouses. The front sides of the hives faced each other, so that the
entrance area of the one hive was exactly opposite the entrance area of the other hive. The
entrance tunnels of the hives led each into a different green house, and had each a length of
25Activation of nectar foragers
approximately 1 m. The colonies could at all times freely access their green house. The green
houses provided a space of 4 x 4 x 7 m for Colony 1, and of 5 x 4 x 7 m for Colony 2. About 18
cm2 of the glass near the junction of the hive and the entrance tunnel were removed and replaced
with a cloth mesh. The cloth mesh allowed volatile substances to drift off the dance floor, but
was too tight for bees to pass. A glass tube connected the meshed areas of the two hives. The
glass tube was 20 cm long, had a diameter of 5 cm, and each end of the tube widened to tightly
cover the meshed areas of one hive. A fan fitted in the middle of the glass tube controlled the
direction of the air flow in the tube.
Training of bees
A week prior to the first experiment, nectar foragers of both colonies were each trained to a
grooved-plate feeders located in the greenhouses (see v. Frisch, 1967 for description of training
techniques). Colonies could collect at a random time of day an unscented 2 molar sugar water
solution at the feeder. Random feeding times made food availability unpredictable for the
colonies, and prevented the training of nectar foragers to a specific feeding time. To allow
foragers to assess nectar availability at all times, the feeder was never removed from its location,
but replaced with a clean empty feeder when necessary.
Experiments
Experiments were done at the 23.8., 27.8., 29.8., 31.8., 4.9., and 7.9.2001, and lasted from
0900 to 1100. Experiments were divided into a control phase that lasted from 0900-1000, and a
manipulation phase that lasted from 1000-1100. During the entire experiment, the glass tube
connected the insides of the two hives, and the air flow was directed from Colony 2 (C2 ) to
Colony 1 (C1 ). Before and during the control of the experiment, no sugar water was available to
either colony. During the manipulation, sugar water was available to C2, but not to C1 . To
confirm that C2 was foraging during the manipulation, an assistant recorded the number of nectar
foragers from C2 that visited the feeder during the manipulation phase of all 6 experiments, and
during the control phase of 3 experiments. During both the control and manipulation of the
experiment, assistants counted for C1 the number of bees exiting the entrance tunnel into the
green house per 5 minutes (flight activity) as well as the number of bees landing on the empty
feeder station per 5 minutes (nectar availability assessment rate or “foraging” activity).
26Activation of nectar foragers
To prevent that nectar foragers from C1 , acquired a negative association between the empty
feeder and the volatile substances potentially coming from the foraging colony, I connected the
colonies also during the daily feeding times.
Baseline counts
To correct the flight and foraging activity of C1 for day-time fluctuations, I recorded the
baseline activities of C1 . On the 22.8., 24.8, 28.8., 3.9., and 6.9.2001, I connected the two hives
with the glass tube, but did not feed either colony during counts of the flight- and foraging
activity of C1 . These counts of the colony’s daily activity pattern (baselines) were done during
the same time of the day as the control (0900-1000) and manipulation counts (1000-1100) of the
experiments.
Statistical analysis
For compa rison of the median numbers of bees per 5 min in control and manipulation, I
subtracted the median of each time interval during the baseline count from the median of the
same time interval during the experiment.
To compare the average medians of control and manipulation, I subtracted the median of the
0900-1000 baseline counts from the median of each experimental control count, and the median
of the 1000-1100 baseline counts from the median of each manipulation count. I then averaged
the corrected medians for each control and manipulation. Values are negative when the baseline
count was higher than the experimental count.
For comparison of each flight and foraging activity between control and manipulation, I
compared (a) the activity between each time interval of control and manipulation to account for
delayed activation effects (therefore n = 12, because there were each 12 time intervals per control
and manipulation), and (b) the medians of all controls and manipulations (therefore n = 6,
because there were 6 experiments).
Measurements are given either as medians, or as average medians. Measurements of
variability are given as one standard deviation unless otherwise noted. Statistical tests were
performed according to Sokal and Rohlf (1995), and are given in the text. All data were analyzed
using the 1998 edition of Microsoft Excel and the 2000 edition of Statistica.
27Activation of nectar foragers
Results
To confirm that C2 was foraging during the manipulation when sugar water was available, we
recorded the number of foragers/ 5 min from C2 that visited the feeder during 3 control and 6
manipulation phases.
During the control of the experiment, 13.7 ± 11.6 foragers/ 5 min visited the empty feeder (n
= 3). During the manipulation, 88.2 ± 23.2 foragers visited the filled feeder (n = 6). The number
of foragers visiting the full feeder was significantly higher than the number of foragers visiting
the empty feeder (Mann-Whitney- U Test, p < 0.001) (Fig. 1).
Fig. 1 The median number of bees from Colony 2 that landed on the feeder during
each the control and the manipulation of the experiment.
To test whether volatile substances from C2 raise the flight or “foraging” activity (nectar
availability assessment rate) of C1 , we recorded the number of bees/ 5 min from C1 that exited
the hive or landed on the empty feeder. Fig. 2 shows the flight- and foraging activity per time
interval for each the baseline and the experimental count. During the 0900-1000 baseline count,
the average median flight activity of C1 was 3.0 ± 1.4 bees/5 min, and the foraging activity was
3.5 ± 1.6 bees/5 min. For the 1000-1100 baseline count, the values were 5.8 ± 2.3, and 5.3 ± 1.8.
During the control of the experiment, the flight activity of C1 was 1.8 ± 0.8 bees/5 min, and the
foraging activity 1.8 ± 1.1 bees/5 min. During the manipulation, these values were 5.4 ± 3.3 and
6.2 ± 3.5.
28Activation of nectar foragers
Fig. 2 The median number of bees from Colony 1 that exit the hive (upper panel) or
land on the empty feeder (lower panel) for each baseline and experimental count. The
black line indicates the end of the control and the according 0900 – 1000 baseline count,
as well as the start of the manipulation and the according 1000 - 1100 baseline count.
The flight activity and foraging activity did not differ between the 0900-1000 baseline count and
the control count of the experiment (G-test for goodness of fit, p = 1.000 and 0.115, respectively,
n = 12). Flight activity did not differ between the 1000-1100 baseline count and the manipulation
count of the experiment (p = 0.133, n = 12), but foraging activity was significantly higher during
the manipulation count than was expected from the baseline count (p = 0.004, n = 12).
29Activation of nectar foragers
To correct for activity fluctuations that were due to the time of the day, I subtracted the
baseline counts from the experimental counts. Fig. 3 shows the corrected values of the flight
activity and the foraging activity of C1 for each 5 in interval of the 6 experiments.
Fig. 3 The flight activity
(black bars) and foraging
activity (white bars) of
Colony 1 for each of the
six experiments.
To correct for fluctuations
that were due to the time
of day, the median
baseline value of the
interval was subtracted
from the according value
of the experimental count
in each time interval.
The dates notify when
each experiment was
performed.
When the corrected flight and foraging activity was compared between control and manipulation
of each experiment, the activity was significantly higher during the manipulation on August 23,
29 (Mann-Whitney- U Test, p < 0.015 for each comparison) and August 31 (p = 0.0497). On
August 27, activity was higher during the control than during the manipulation (p = 0.008 for
flight activity and 0.021 for foraging activity), and on September 4 and 7, activity did not change
30Activation of nectar foragers
between control and manipulation (p > 0.080 for each comparison). When the median flight and
foraging activity were compared between control and manipulation, the flight activity did not
differ between control and manipulation of the experiment (Mann-Whitney- U Test, p = 0.328, n
= 12), but the foraging activity was significantly higher during the manipulation than during the
control (p= 0.032).
During the control, the average median flight activity was -1.1 ± 3.8 bees/5 min, and the
average median foraging activity was 0.7 ± 6.4 bees/5 min (n = 6). During the manipulation, the
values were -0.9 ± 3.0 and 0.1 ± 5.3 bees/5 min, respectively. There was no difference in either
flight activity or foraging activity when the medians of all controls were compared to the
medians of all manipulations (Wilcoxon-test for paired samples, p = 0.917 for each comparison,
n = 6).
Discussion
In this study, I investigated whether a foraging colony produced volatile substances that
stimulated the flight or foraging activity of a non-foraging colony.
The results show that a foraging colony can produce volatile substances to activate nectar
foragers. In 50 % of the experiments, the foraging colony stimulated the non-foraging colony to
visit an empty feeder (Fig. 3). The unfavorable foraging conditions during experiments that were
due to the late time of year, e.g. small colony size, low foraging motivation, low temperature
(13.5 °C - 17.6 °C during the day), frequent rain and high humidity in the hive’s entrance
tunnels, might have lowered the motivation to produce, or to react to, an activating signal during
some of the experiments, and possibly caused the differences in the degree of forager activation
between experiments. The exact hive-external and internal conditions that support the production
of, or reaction to, a foraging stimulating substance remain to be investigated and involve the
questions about the chemical composition of the activating substance, its production and release.
In experiments where the non-foraging colony was stimulated to forage, the number of
foragers from the non-foraging colony that landed on the empty feeder increased approximately
30 minutes after the foraging colony first had access to food (Fig 3). This delay in forager
activation could reflect e.g. a feature of the production or release of the stimulating substance. It
is also possible that the delay in the activation of honey bee foragers indicates that a certain
31You can also read