Progressing implementation - of genetic selection in Australian honey bees by R. G. Banks, E. Frost, N. Chapman, V. Boerner, S. Walkom and M ...
←
→
Page content transcription
If your browser does not render page correctly, please read the page content below
Progressing implementation
of genetic selection
in Australian honey bees
by R. G. Banks, E. Frost, N. Chapman,
V. Boerner, S. Walkom and M. Ferdosi
August 2020
Progressing implementation of
genetic selection in Australian
         honey bees

  by R.G. Banks, E. Frost, N. Chapman, V. Boerner, S. Walkom and M. Ferdosi

                                August 2020

                 AgriFutures Australia Publication No. 21-087
                AgriFutures Australia Project No. PRJ-010257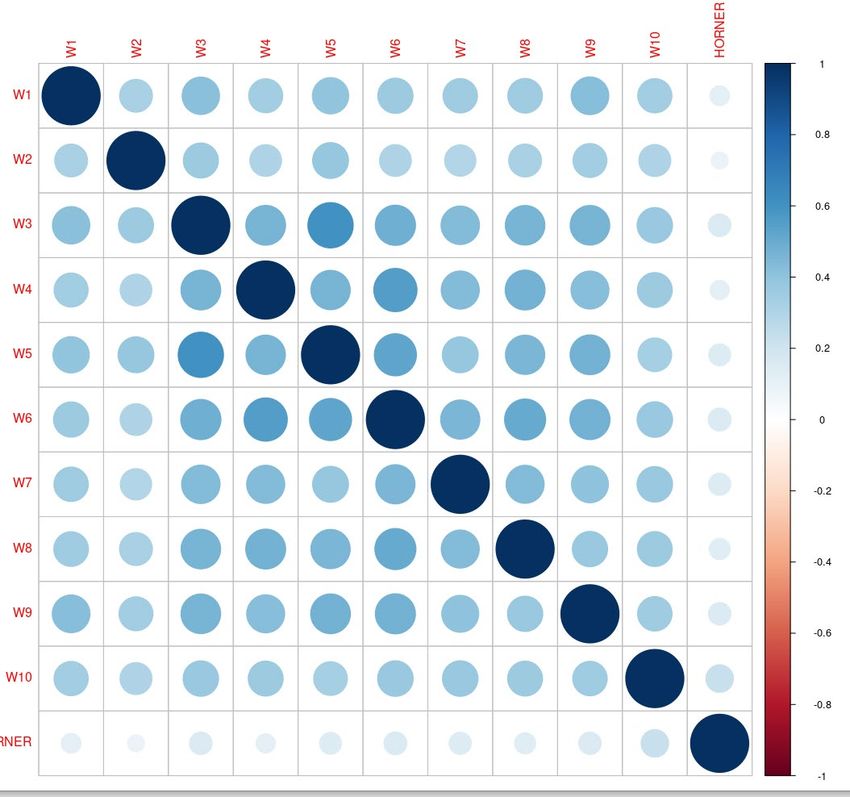
© 2021 AgriFutures Australia
All rights reserved.

ISBN 978-1-76053-194-2
ISSN 1440-6845

Progressing implementation of genetic selection in Australian honey bees
Publication No. 21-087
Project No PRJ-010257

The information contained in this publication is intended for general use to assist public knowledge and
discussion and to help improve the development of sustainable regions. You must not rely on any information
contained in this publication without taking specialist advice relevant to your particular circumstances.

While reasonable care has been taken in preparing this publication to ensure that information is true and correct,
the Commonwealth of Australia gives no assurance as to the accuracy of any information in this publication.

The Commonwealth of Australia, AgriFutures Australia, the authors or contributors expressly disclaim, to the
maximum extent permitted by law, all responsibility and liability to any person, arising directly or indirectly from
any act or omission, or for any consequences of any such act or omission, made in reliance on the contents of
this publication, whether or not caused by any negligence on the part of the Commonwealth of Australia,
AgriFutures Australia, the authors or contributors.

The Commonwealth of Australia does not necessarily endorse the views in this publication.

This publication is copyright. Apart from any use as permitted under the Copyright Act 1968, all other rights are
reserved. However, wide dissemination is encouraged. Requests and inquiries concerning reproduction and
rights should be addressed to AgriFutures Australia Communications Team on 02 6923 6900.

Researcher contact details

Robert Banks
Animal Genetics and Breeding Unit
University of New England
Armidale NSW 2351

02 6773 2425
rbanks@une.edu.au

In submitting this report, the researcher has agreed to AgriFutures Australia publishing this material in its edited
form.

AgriFutures Australia contact details

Building 007, Tooma Way
Charles Sturt University
Locked Bag 588
Wagga Wagga NSW 2650

02 6923 6900
info@agrifutures.com.au
www.agrifutures.com.au

Electronically published by AgriFutures Australia at www.agrifutures.com.au in August 2021

AgriFutures Australia is the trading name for Rural Industries Research & Development Corporation (RIRDC), a
statutory authority of the Federal Government established by the Primary Industries Research and Development
Act 1989.

                                                          ii
Foreword
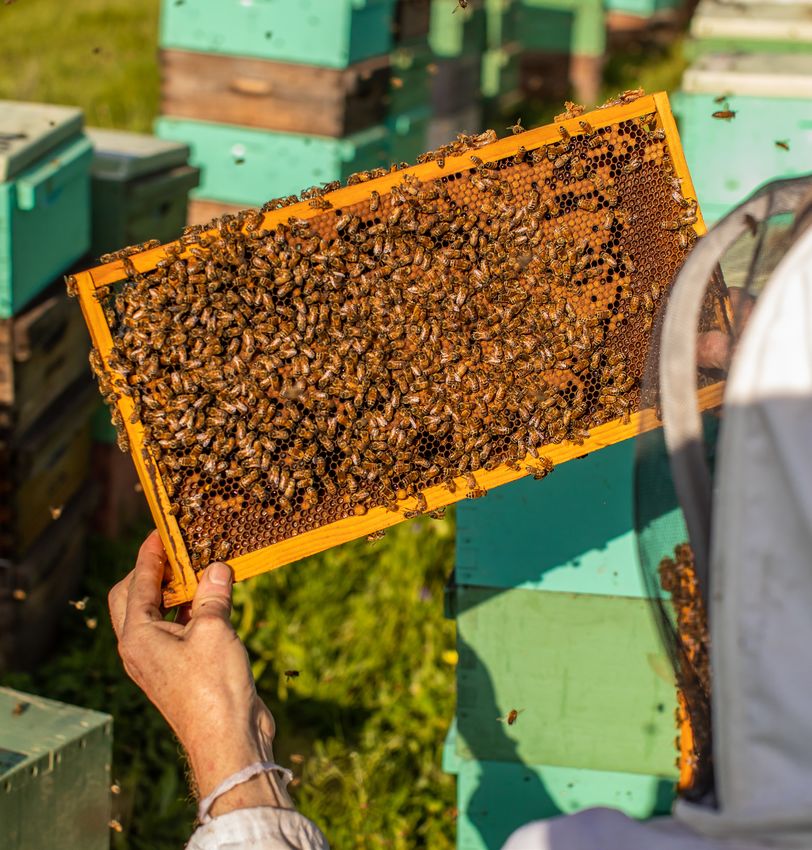
The European honey bee (Apis mellifera) is one of the most important insects in Australia because it
produces honey and provides pollination services. Pollination alone is worth more than $14 billion to
the Australian economy and requires about 530,000 hives each year. The declining terms of trade and
the increasing requirement of pollination services indicate the honey bee industry is ready for a
significant change. Genetic improvement has provided this step-change for animal industries over the
past 50 years. Now is the time for the honey bee industry to consider how genetic improvement could
be harnessed to meet pollination needs in the future.
Genetic improvement involves using a number of methods, including genomic tools, to drive
improvement in honey bee traits important to producers, such as honey production, temperament,
disease resistance and pollination services. Seeking genetic improvement of hives can increase the
viability of honey production, increase industry resilience in times of change, and increase pollination
efficiency and effectiveness. However, developing and implementing a genetic improvement plan for
any industry takes significant research and investment.
To develop a genetic improvement plan, the industry needs to understand if it is possible for the
honey bee to have a formal genetic improvement plan, how much such a plan would cost, and whether
the genetic variability exists to drive the improvements the industry needs. This research continues
work previously undertaken in the AgriFutures Australia project Genetic Evaluation of Australian
Honey Bees using BLUP procedures to understand and develop a genetic improvement plan for the
honey bee industry. This research collected data from queen bee breeders, genotyped queens and
sampled drones to establish genetic relationships, developed educational materials for queen bee
recording and selection, and considered how the honey bee industry could establish and fund a genetic
improvement plan through a queen bee evaluation program.
This project demonstrates that establishing estimated breeding values for queens around honey
production and other scored traits can be achieved at any scale. The project delivered DNA sampling
protocols for genomic identification and understanding of genetic relationships. A number of
scenarios were developed within this research for consideration by the honey bee industry on how a
genetic improvement program could be implemented and what the costs associated with this
implementation would be. While the research showed that a genetic improvement program was
achievable, a coordinating body would need to drive the implementation. The research has provided a
strong body of evidence on why and how to implement a genetic improvement program across the
honey bee industry.
This report for the AgriFutures Honey Bee & Pollination Program adds to AgriFutures Australia’s
diverse range of research publications. It forms part of our Growing Profitability Arena, which aims to
enhance the profitability and sustainability of our levied rural industries. Most of AgriFutures
Australia’s publications are available for viewing, free download or purchase online at
www.agrifutures.com.au
John Smith
General Manager, Research
AgriFutures Australia
iii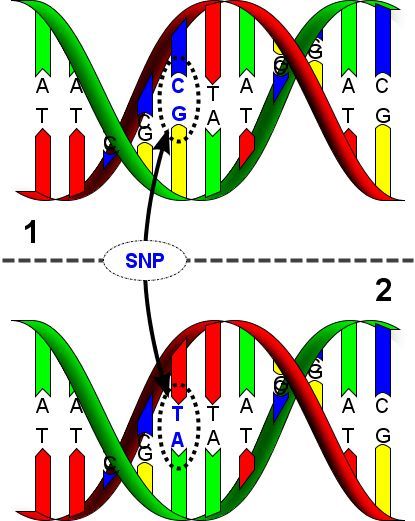
Acknowledgments
Discussions and guidance from Dr Doug Somerville and Professor Ben Oldroyd have been
invaluable, as have numerous discussions with a variety of industry stakeholders, both individually
and in workshops.

The support and patience of AgriFutures Australia is gratefully acknowledged, including their
flexibility with project timelines in the face of severe drought affecting collection of production data.

                                                    iv
Contents
Foreword.................................................................................................................................. iii
Acknowledgments ................................................................................................................... iv
Executive summary................................................................................................................ vii
Introduction .............................................................................................................................. 1
Objectives.................................................................................................................................. 4
Methodology ............................................................................................................................. 5
Results ....................................................................................................................................... 7
      1. Estimated breeding values for queens, based on data supplied by the Horner family .... 7
      2. Trial genotype analysis of sample data.......................................................................... 11
      3. A model for implementation of genetic evaluation and genomic selection in Australian
      honey bees ......................................................................................................................... 15
      4. Extension materials ....................................................................................................... 24
Implications ............................................................................................................................ 25
Recommendations .................................................................................................................. 26
Appendices .............................................................................................................................. 27
      1. Introduction to basic principles ..................................................................................... 28
      2. EBVs for scored and production traits – Horner family data, line C, 2018-19 ............. 47
      3. Correlations between EBVs for scored and production traits – Horner family data, line
      C, 2018-19 ......................................................................................................................... 52
      4. EBVs for ‘Honey production’ – Horner family data, line C, 2019-20 .......................... 53
      5. Basic principles ............................................................................................................. 56
      6. The rationale for coordinated investment ...................................................................... 59
      7. Background re industry challenges and comparisons with genetic evaluation and
      improvement schemes in other industries ......................................................................... 60
Glossary .................................................................................................................................. 63
References ............................................................................................................................... 64

                                                                             v
Tables
Table 1: Summary of honey production data provided by the Horner family ........................................ 7
Table 2: Summary of EBVs for ‘Honey production’ (including relatives’ information) using Horner
family data. ............................................................................................................................................. 9
Table 3: Five scenarios for implementation of genetic or genomic selection....................................... 17
Table 4: Estimated costs and potential returns for five scenarios ......................................................... 18
Table 5: Adoption across five scenarios ............................................................................................... 19
Table 6: Results for cost and profit per hive ......................................................................................... 22
Table 7: Five measured colonies (example) ......................................................................................... 29
Table 8: Average performance of five half-sibling colonies ................................................................ 31
Table 9: Queen C as the common reference point ................................................................................ 34
Table 10: Queen families and selection (example) ............................................................................... 35
Table 11: Combining EBVs from different traits ................................................................................. 37
Figures
Figure 1. Gross value of production of the Australian lamb industry, 1984-2003. ................................ 1
Figure 2: EBVs with and without relatives’ information. ....................................................................... 7
Figure 3: EBVs for Honey production for queen mothers and queens. .................................................. 8
Figure 4: Queens’ Overall EBVs for scored traits and ‘Honey production’. ........................................ 10
Figure 5: % complete removal and EBVs for ‘Honey production’, subset of queens .......................... 11
Figure 6: Number of individuals by source for DNA analysis ............................................................. 12
Figure 7: Level of relatedness of sources.............................................................................................. 13
Figure 8: Degree of relatedness among Western Australian sources .................................................... 14
Figure 9: Model of reference population and industry.......................................................................... 21
Figure 10: Ranking of colonies on EBV and phenotype....................................................................... 30
Figure 11: Half-sib EBVs for five colonies versus phenotypes ............................................................ 31
Figure 12: Hives in two locations (example) ........................................................................................ 33
Figure 13: Example of 10 SNPs for two individuals ............................................................................ 40
Figure 14: EBVs – using information from relatives ............................................................................ 42
Figure 15: EBVs – incorporating genomic information based on reading the DNA ............................ 43
Figure 16: Performance data needed to generate genomic EBVs of defined accuracy ........................ 44
Figure 17: Performance data needed to generate genomic EBVs of defined accuracy ........................ 59
viExecutive summary
What the report is about
This report extends the focus of an earlier Rural Industries Research and Development Corporation
project, Genetic Evaluation of Australian Honey Bees using BLUP procedures, by setting out the
principles of implementation of genetic and genomic selection in honey bees in Australia.
Genetic improvement, whether using modern genetic methods or those methods extended to include
use of genomic tools, provides scope for steady and valuable improvement in traits such as honey
production, temperament, disease resistance and pollination services. Such improvement can assist in
building viability of honey production, increase industry resilience in the face of current and potential
disease threats, and enhance pollination efficiency.
Who is the report targeted at?
The report includes material and recommendations relevant to queen breeders, queen multipliers,
providers of pollination services and beekeepers, and to research and extension personnel, and
industry consultation groups.
Where are the relevant industries located in Australia?
Beekeeping is located across the south-eastern states and in Western Australia. Queen breeding is
dependent on a relatively small number of enterprises, with a further relatively small number of
enterprises involved in multiplication. Pollination services are provided in a variety of locations
depending on the crop involved but are broadly across regions that support horticultural activity.
Background
Genetic improvement can be a very powerful strategy for building and maintaining industry
profitability for any species, but to date, application of systematic improvement has been limited in
the Australian honey bee industry. Genetic improvement can assist in meeting industry challenges,
and for this reason most livestock industries in developed countries have initiated industry-wide
genetic evaluation systems in the past two to three decades. The Australian honey bee industry has
commenced the genetic improvement journey with a previous AgriFutures Australia project, Genetic
Evaluation of Australian Honey Bees using BLUP procedures. This project has built on that work and
provides a base for the Australian honey bee industry to introduce a genetic improvement program.
Aims/objectives
The project aimed to outline the main elements in industry-wide implementation of modern genetic
and genomic improvement methods. The specific objectives were:
1. Collect more data on production and health traits from the Horner family breeding program
and, if possible, from queen breeders across Australia.
2. Genotype queens and, funds permitting, collect and process samples of drones and workers
from the Horners’ program, to build a genetic relationship map across their entire program.
3. Using pedigree data and genotypes, analyse the full population in that program and, subject to
availability of data, other programs.
4. Contribute to the development of educational material on queen bee breeding, to be
developed by NSW Department of Primary Industries (DPI). Contributions will include basic
material on recording and selection, and on managing inbreeding.
5. Genotype imported semen to allow inclusion of the new genetic sources to be properly
evaluated in the future through inclusion of source pedigree information.
vii6. Ascertain the scope for an expanded queen evaluation program aimed at systematic
evaluation of production and health traits under more environments than are considered at
present, including a benefit-cost analysis.
Methods used
The project included:
• Analysis of pedigree and performance data provided by the Horner family.
• Sampling and DNA analysis of colonies maintained by the Horner family and Better Bees
WA.
• Modelling of industry implementation to enable benefit-cost analysis.
Results/key findings
The key findings and results of the project were:
• Estimated breeding values (EBVs) for queens for ‘Honey production’ and scored traits,
demonstrating the capability to deliver this form of analysis on essentially any scale.
• Protocols for sampling for DNA analysis and, albeit on very much a pilot scale, initial results
for genetic relationships among colonies maintained by the Horner family and Better Bees
WA, based on that DNA analysis. The project has established a provider for ongoing DNA
analysis of the type required for genomic selection.
• Scenarios for implementation of genetic and genomic selection, and benefit-cost analysis of
those at industry scale. The key result here is that under very cautious assumptions,
investment in genetic and genomic selection by industry can be practical and profitable, but
that some form of underpinning coordination will likely be essential.
• No importation has occurred during the project and, accordingly, no genotyping of imported
genetic material has been done. The facility to do so has been identified through the
genotyping in the project.
Implications for relevant stakeholders
The implications of the report are relevant to all key stakeholder groups – industry, communities, and
policy makers. The implications are:
• Subject to the collection of suitable pedigree and performance data, estimated breeding values
(EBVs) for a variety of traits can be produced for honey bee breeding. EBVs will make
selection of superior queens more accurate, and hence enable faster and more valuable genetic
improvement.
• Genomic tools (i.e. based on reading the DNA of queens, or genotyping) are available at
practical cost and can enhance the effectiveness of genetic improvement.
• Selection can be applied to production, health and temperament traits (and potentially others),
and valuable genetic improvement achieved.
• Careful economic modelling shows that industry-scale recording and selection, including
genomic technologies, can be profitable under realistic scenarios, delivering economic
benefits to beekeepers, pollinators, queen breeders and the honey bee industry. The scale of
benefits will depend on the level of uptake, i.e. how many hives derive from genetically
superior queens. Profits per hive per year in the range $20-65, based solely on genetic
improvement of honey production, are achievable. At modest adoption across industry (20%
viiiof new hives per year), that equates to an additional $1m-$3m per year benefit to industry
(this is after the costs modelled for implementation).
• Queen breeders and honey producers can participate in implementing genetic improvement by
careful performance recording and either pedigree or DNA recording.
• The key requirements for effective genetic and genomic selection, including trait definitions
and the core of a genomic reference population, have been incorporated into the Rural
Research and Development for Profit Project, Plan Bee. Results presented in this report
indicate that Plan Bee can be a catalyst for significant increases in implementation and impact
of modern genetic and genomic methods to the benefit of all stakeholders in the Australian
honey bee industry.
• Industry implementation can be highly inclusive – open to queen breeders, multipliers,
pollinators and honey producers. The use of genomic methods in this context can be a catalyst
for very rapid and wide uptake because the requirements are either in place or very simple to
implement. Further, the inclusiveness can help industry ensure adaption to different
production regions and uses of honey bees, and assist in spreading and minimising the risk of
insufficient data recording, and of localised or widespread disease challenges.
• Genomic methods provide the opportunity for a step-change in the honey and pollination
industries. The key to this step-change is the ability to convert a focused investment in
recording and data analysis into very wide industry impact, making the most of the recording
of production, pollination, health and temperament traits. Achieving the step-change will
require coordination – different sectors working together – and sustained management and
investment, similar to that in place in other livestock industries.
• This step-change can dramatically improve the viability, sustainability and profitability of the
honey bee-based industries in Australia, in the same way that other livestock industries in this
country have been transformed by genetic improvement.
The opportunity should be grasped – industry working together to achieve this goal.
Recommendations
The model for industry-scale recording and selection should be progressed. This will involve the
following elements:
• Standardised trait definitions and recording protocols.
• Database capable of receiving and storing pedigree, performance and genotype data.
• Analysis tools (in place).
• A nucleus or core of recorded and genotyped queens.
• A strong communications program aimed at encouraging four main activities:
o Recording of key traits in colonies maintaining at least five hives.
o Submitting of hive samples for genomic testing, to establish relationship with the national
genomic reference population and the genetic merit of the hive (and hence queen)
sampled.
o Selection within the genomic reference to generate rapid genetic progress for important
traits.
o Widespread use of AI from elite genetic material to disseminate the genetic progress
being made.
• Development of an industry governance model, including mechanism for sustained funding,
and a business model for participation.
Industry should use the Plan Bee project as the focus for:
ix• Developing co-investment to sustain the model beyond the current R&D project.
• Encouraging participation by queen breeders and honey producers, who can contribute vital
trait data and pedigree and/or DNA data.
These recommendations are relevant to all stakeholders of genetic improvement of the Australian
honey bee industry.
xIntroduction
Genetic improvement can be a very powerful strategy for building and maintaining industry
profitability for any species, but to date, application of systematic improvement has been limited in
the Australian honey bee industry.
All agricultural industries face two continuing challenges:
• Declining terms of trade, meaning that prices received for products do not keep pace with
input costs (Mullen, 2010).
• Increasing prevalence of diseases, arising from climate change, increasing intensification and
increasing global trade movements, among other factors.
Genetic improvement can assist in meeting both these challenges, and for this reason most livestock
industries in developed countries have initiated industry-wide genetic evaluation systems through the
last two to three decades.
Australia has an excellent track record in developing and implementing industry-wide genetic
improvement systems. Examples include the Australian Dairy Herd Improvement Scheme (ADHIS,
now known as DataGene), BREEDPLAN for the beef industry, LAMBPLAN and MERINOSELECT
for the sheep industry, PIGBLUP for the pork industry, and extending into plants, TREEPLAN for the
plantation forestry industry.
In all cases, the introduction of these genetic improvement systems led to dramatic changes in the rate
of genetic progress, which in turn contributed to significantly improved profitability of the industry.
Taking the lamb industry as an example, LAMBPLAN was introduced in 1989, and within a short
time, industry gross value of production had started rising rapidly, a trend which has continued to the
present day:
Real Gross Value of Production ($m)
1,400
Lamb Industry Real On-Farm Income shows 3
1,200 phases:
a) pre-1991 - real income declining by $17m per year
1,000 b) 1990's - real income growing by $19m per year
c) 2000's - real income growing by $220m per year
Real Income ($m)
800
600
400
200
0
84
85
86
87
88
89
90
91
92
93
94
95
96
97
98
99
00
01
02
03
19
19
19
19
19
19
19
19
19
19
19
19
19
19
19
19
20
20
20
20
Year
Figure 1. Gross value of production of the Australian lamb industry, 1984-2003
1This chart shows the trends in lamb industry gross value of production, adjusted for inflation, over the
period 1984 to 2004. The initiation of LAMBPLAN in 1989 led to almost immediate change in the
industry income trend, mainly through enabling exports to the small but growing US market – which
demanded a larger, leaner lamb than was traditionally produced in Australia.
The turn-around in industry income accelerated further from 2000, as the expansion of the US market
was driven by the rapidly increasing availability of the larger and leaner lambs – which could only be
bred using the LAMBPLAN genetic information. Lamb industry income has continued growing
steadily since 2000, to be well over $3 billion in 2021 – a more than three-fold increase in inflation-
adjusted terms.
It is important to note that each industry has had to adapt modern genetic technologies to the
practicalities of that industry, taking account of:
• Scale of performance recording.
• The actual traits that need to be recorded – and how many there are.
• The timescale over which industry and private investment needs to be maintained.
These points are discussed in more detail in Appendix 7, but have been taken into account in the
modelling reported here.
Industry organisations involved in the development of such systems conduct benefit-cost analyses as
part of meeting their governance obligations. The results are favourable – benefit-cost ratios in the
range 3:1 up to 10:1 or more (links to example studies are included in the references).
The key point here is that industry-wide genetic improvement invariably requires sustained and
substantial effort, but is highly profitable for an industry.
The principles of genetic improvement for honey bees have been outlined in various papers and
reports, with some of the best deriving from Prof. Ben Oldroyd’s PhD studies (Oldroyd, 1984). Some
more recent papers are highlighted and discussed later in this report. A key observation is that it is not
lack of knowledge of how to conduct genetic improvement in honey bees in Australia that has held
back progress; rather, ready availability of basic tools coupled to sustained systematic recording and
at least a partly effective market for genetically superior queens have meant that the level of
systematic recording is very low, and there has to date been no means of comparing the merit of
queens available for sale.
Transferring learnings from other agricultural species to honey bees regarding genetic improvement
has been occurring through the past two decades in a small number of countries; in all cases built on
systematic data collection and genetic analysis.
The AgriFutures Australia project Genetic Evaluation of Australian Honey Bees using BLUP
procedures (2015) demonstrated proof-of-concept for application of best linear unbiased prediction
(or BLUP) methods to genetic evaluation of Australian bees. The datasets analysed in that project
were small, and limited in detail of pedigree, but results showed the existence of useful genetic
variation in production and health traits, providing the basis for genetic improvement.
The present project aimed to build on the Genetic Evaluation of Australian Honey Bees using BLUP
procedures project to apply the basic principles to larger datasets, conduct genomic analysis, develop
extension materials, and develop an economic model for wider-scale implementation of genetic and
genomic methods for honey bee selection. By demonstrating the practicality of data analysis to
generate EBVs and genotyping (reading the DNA, or genomic analysis), it was hoped that the project
would establish the foundation for wider adoption of performance recording and show industry how
to capitalise on the availability of DNA analysis to help in genetic improvement. This demonstration
would be augmented by developed extension materials made widely available.
2The outcomes of industry-wide implementation will be more effective breeding programs for
production, improved hive health and potentially improved pollination traits. Multiple genetically
linked genetic improvement programs for the beekeeping industry will ensure long-term viability of
the industry and a stable supply of quality honey bee colonies for pollination-dependent crops.
Currently, the industry is heavily reliant on a single breeding program for most queens produced in
the eastern states. This project serves to benchmark genetic relationships between the two main
sources of honey bee genetics in Australia in order to determine the degree of relatedness. This
information will guide further genetic improvement depending on how closely related Australian
honey bees are. Through this work, a domestic provider of genotyping services was secured, bringing
the Australian beekeeping industry closer to having access to fee-for-service genotyping, as is
standard for mammalian livestock industries.
The principles of estimation of genetic merit (i.e. generating EBVs), making use of EBVs, and the use
of DNA tools and methods in genetic improvement are set out in Appendix 1, and application of these
principles with industry data is addressed in the Discussion.
3Objectives
The project aimed to outline the main elements in industry-wide implementation of modern genetic
and genomic improvement methods. The specific objectives were:
Honey bee production and health analysis:
1. Collect more data on production and health traits from the Horner family breeding program
and, if possible, from queen breeders across Australia.
2. Genotype queens and, funds permitting, collect and process samples of drones and workers
from the Horners’ program, to build a genetic relationship map across their entire program.
3. Using pedigree data and genotypes, analyse the full population in that program and, subject to
availability of data, other programs.
Extension and education:
4. Contribute to the development of educational material on queen bee breeding, to be
developed by NSW Department of Primary Industries (DPI). Contributions will include basic
material on recording and selection, and on managing inbreeding.
Establishing a platform for ongoing genetic evaluation:
5. Genotype imported semen to allow inclusion of the new genetic sources to be properly
evaluated in the future through inclusion of source pedigree information.
6. Ascertain the scope for an expanded queen evaluation program aimed at systematic
evaluation of production and health traits under more environments than are considered at
present, including a benefit-cost analysis.
4Methodology
The aim of the project was to examine the scope to progress implementation of modern breeding
methods in honey bees in Australia, focused on:
• Identifying and analysing available datasets to produce EBVs for queens, if possible, for
honey production and other traits.
• Seeking out potential providers of DNA analysis services and, subject to identifying suitable
provider(s), analysing tissue samples from one or more breeding programs, to establish the
potential to obtain genotype information on queens for use in calculating EBVs and in
managing genetic diversity.
• Developing options or models for wider-scale implementation of these methods, taking
account of costs, practicality and potential benefits.
This project used three methods:
1. Analysis of pedigree and performance data provided by the Horner family.
The data was collected by the Horner family through the 2018-19 and 2019-20 seasons. Data was
provided for the C line maintained by the family, for 2018-19 and 2019-20, and the G line, for 2019-
20.
In each case, data was provided on the queen mother of each hive (i.e. the mother of the queen in that
hive).
The analysis to calculate the EBVs used the pedigree information, enabling information from half-sib
queens to contribute to the EBV for each queen.
The Horner family has maintained six distinct lines based on separate original sources for many years,
and has kept detailed records of subjectively scored traits and queen pedigree through that time. Each
line typically consists of about 100 queens, with 20-40 selected each year as sources of queen and
drone mothers (W. Horner, pers. comm.). Recently, the family has added the capacity to collect
individual hive weight data to their recording system, meaning that honey production can also be
evaluated.
Data was analysed using AGBU software tools. The basic model was to fit queen as the genetic factor
in analysis of the trait data, and where queen mother was known, to include this additional level of
pedigree information. All analyses were conducted with data batch, i.e. data from hives that had been
maintained in common locations through the production season.
2. Sampling and DNA analysis of colonies from the Horner family and Better Bees WA.
Elizabeth Frost (NSW DPI) coordinated sample collection in collaboration with the Horner family and
Better Bees WA. The sampling protocol is included in Appendix 5.
DNA analysis of the samples was conducted by the Australian Genome Research Facility (AGRF),
and the basic methods are outlined in Appendix 5, within the PowerPoint slides ‘Reading the DNA’.
Analysis of the genotype data to estimate relationships among colonies followed the method included
in Appendix 5.
3. Benefit-cost modelling of implementation of genetic and genomic selection.
Models were developed drawing on inputs from industry and NSW DPI expertise.
5The key elements of the model are:
• Numbers of hives at the ‘nucleus’ and the ‘commercial’ levels.
• Recording and genotyping costs at the ‘nucleus’ and the ‘commercial’ levels.
• RD&E costs.
• Rates of genetic progress in honey production under a) BLUP selection and b) genomic
selection.
The scenarios modelled reflect different combinations of recording and genotyping costs, and rates of
genetic progress achieved, across different scales of industry adoption.
The model was constructed in Excel, but is currently not packaged in a documented form. This could
be done.
6Results
1. Estimated breeding values for queens, based on data supplied
by the Horner family
EBVs for ‘Honey production’
Complete lists of the EBVs are included as Appendix 1; the following tables and charts summarise the
data and key points.
Table 1: Summary of honey production data provided by the Horner family
Line and Number of Number of Average Standard Standard
year queen queens (i.e. honey deviation of deviation of
mothers hives) with production honey EBV for
records (kg) production honey
(kg) production in
queens (kg)
C – 2018-19 20 88 41.5 18.2 3.4
G – 2019-20 18 88 123.3 42.8 8.0
Note that the production period for which the weight of honey was recorded was different in these two
datasets – data for line G in 2019-20 came from an entire production season, while data for line C in
2018-19, came from a part-season.
In both these analyses, the EBVs incorporate information on the half-siblings (half-sibs) of each hive
(others that share the same queen mother). The effect of including this information is illustrated in the
following chart – showing the EBVs with the relatives’ information included, and the EBVs without
relatives’ information, both plotted against the phenotype of the individual hive.
EBV v Phenotyope – G Line 2019-20
20.0
15.0
10.0
5.0 With
relatives'
EBV (kg)
0.0 information
-5.0 included
Own record
-10.0 only
-15.0
-20.0
-25.0
20 40 60 80 100 120 140 160 180 200
Phenotype (kg)
Figure 2: EBVs with and without relatives’ information
Here the EBV calculated using only the phenotype for each hive is shown by the x, and the EBV
calculated including information from related hives is shown by the dot.
7The dots are shifted away from the simple line for the ‘Own record only’ EBVs – and the shift reflects
the average performance of the half-sibs. For example, the queen highlighted by the red arrow has an
EBV with relatives’ information included of 8.31 kg, but based on her record alone, her EBV is 2.83
kg. The difference reflects the average performance of four half-sibs, which is 40 kg above the overall
mean.
Similarly, the queen highlighted by the blue arrow has an EBV with relatives’ information included of
-7.78 kg, but her EBV based on her own performance alone is -3.07 kg. The difference here reflects
that the average performance of her half-sibs is below average – it is 37 kg below the overall mean.
We know the half-sibs in this dataset because we know the queen mothers. This in turn means that the
analysis when we include the half-sibs’ information also delivers EBVs for the queen mothers, on the
same scale as for these queens. This is shown in the following chart:
Queen mother and queen – EBVs for Honey production (kg)
20
15
10
Breeding value (kg)
5
0
-5 Queens
-10 Queen mothers
-15
-20
-25
1
5
9
13
17
21
25
29
33
37
41
45
49
53
57
61
65
69
73
77
81
85
89
93
97
101
105
Individual
Figure 3: EBVs for Honey production for queen mothers and queens
The blue bars are the EBVs for ‘Honey production’ for the queens whose hive performance was
measured. The red bars are the EBVs for the mothers of those queens.
This chart has a very important message – the EBVs for the queens and for their mothers from the one
analysis have the same base – meaning that the EBVs for the queens can be directly compared with
the EBVs of their mothers.
If all the queen mothers are still available, it would be possible to select the genetically best
individuals across these two generations. In this dataset, if we select the highest EBVs across the
queens and the queen mothers, the highest is a queen mother, and her four daughters are in the top 14
out of 107 individuals. In this case, if we were to select the top individuals across the two generations
to be parents of the next generation, and assumed we need to pick 18 to be the queen mothers of that
next generation – keeping the same number of queen mothers – then five of the best 18 would be this
queen and her daughters.
This observation highlights an important point about EBVs that incorporate relatives’ information –
related individuals will end up with more similar EBVs than the EBVs based solely on individuals’
8own information. Because of this, if we select on EBVs, we will tend to pick more individuals from
the best-performing families than if the EBVs only use individuals’ own information.
This means that unless extra steps are taken, inbreeding will rise when we select on EBVs that include
relatives’ information – because the selected individuals will tend to be more related to each other
than a random sample of the population, or than a sample selected on EBVs that only use the
individuals’ own information.
These results tell us the range in the value of queens (and their mothers) for honey production:
– From best to worst in terms of genetic merit, using the G line data, there is a 34 kg range in
the value of the genes of queens for honey production (see Table 2 below).
– This means that if the best and worst EBV queens were mated to the same set of drones, and
the performances of their hives were measured, we would expect to see a 17 kg difference in
honey production over a season – worth about $100 on current prices.
Table 2: Summary of EBVs for ‘Honey production’ (including relatives’ information) using
Horner family data
Line and year Highest EBV Lowest EBV Range in EBVs Range in queen
(kg) (kg) (kg) mothers’ EBVs
C – 2018-19 28 -25.9 53.9 19.2
G – 2019-20 14.5 -19.6 34.1 27.2
EBVs for other traits
The Horners provided data on a number of other traits recorded on each hive in addition to weight of
honey produced. Those traits were:
• Chalkbrood
• Honey work
• Bee size
• Brood viability
• Lack of beetles
• Wax cleanliness
• Not lazy
• Quietness
These traits were scored on a 1-5 scale, and EBVs were calculated incorporating information from
relatives. The table of EBVs for these traits is included in Appendix 1.
It is interesting to examine the relationships between EBVs for the different traits – by calculating the
correlations among the EBVs. The full table of correlations is shown in Appendix 1, but some simple
observations can be included here:
• EBV for ‘Honey production’ has a small positive correlation with ‘Not lazy’ and ‘Quietness’.
• EBV for ‘Chalkbrood’ has small positive correlations with the EBVs for ‘Brood viability’,
‘Lack of beetles’, and ‘Not lazy’.
• EBV for ‘Honey work’ has small positive correlations with the EBVs for ‘Bee size’, ‘Lack of
beetles’, and ‘Quietness’.
• EBV for ‘Bee size has small positive correlations with the EBVs for ‘Brood viability’ and
‘Quietness’.
9• EBV for ‘Brood viability’ has small to moderate positive correlations with the EBVs for
‘Lack of beetles’ and ‘Not lazy’.
• EBV for ‘Not lazy’ has a moderate positive correlation with the EBV for ‘Quietness’
(in all these points, a positive correlation is favourable, or helpful).
While this dataset is not large enough to make any definitive conclusions about genetic relationships
between the traits, there is a suggestion that in general the scored traits are to some extent related to
each other and to honey production. A simple test of this was to simply add the EBVs for the scored
traits to make a single overall EBV, and calculate the correlation between this and the EBV for
‘Weight of honey’ – the result was 0.21, a small positive correlation.
In simple terms, this suggests that hives (i.e. queens) with good genes for these scored traits will tend
to also have better genes for honey production – but more importantly, it is possible to identify queens
with superior genes for both honey production and the scored traits. This is illustrated by the chart
below:
Overall EBVs for scored traits v EBVs for Honey production
8.00
6.00
Overall EBV for scored traits
4.00
2.00
0.00
-2.00
-4.00
-6.00
-8.00
-10.00
-40 -30 -20 -10 0 10 20 30 40
EBV for 'Honey production' (kg)
Figure 4: Queens’ Overall EBVs for scored traits and ‘Honey production’
The dashed line is the average relationship between EBV for ‘Honey production’ and the overall EBV
for the scored traits. Its slope is positive, indicating a weak positive relationship.
Records for a ‘Hygiene’ trait and relationship to EBVs for ‘Honey production’
In 2018, a subset of 27 queens from one of the lines maintained by the Horners was scored for
removal of killed brood, and the trait ‘% complete removal’ at 24 hours determined.
The trait shows considerable variation, with a range of 38-100% removal. Because of the limited
number of queens assessed, EBVs have not been calculated for this subset, but we can plot the
relationship between ‘% complete removal’ and the EBVs for ‘Honey production’ for them.
10% complete removal at 24 hours v EBVs for Honey production
100.0%
90.0%
80.0%
% complete removal
70.0%
60.0%
50.0%
40.0%
30.0%
20.0%
10.0%
0.0%
-30.0 -20.0 -10.0 0.0 10.0 20.0 30.0
EBV for Honey production (kg)
Figure 5: % complete removal and EBVs for ‘Honey production’, subset of queens
While this dataset (of % complete removal data) is too small to support any strong conclusions, it is
heartening to observe that there is a weak positive relationship in this set of queens between their
performance for the hygiene trait and their EBV for ‘Honey production’.
A very cautious conclusion would be that selecting for increased honey production should not lead to
any marked change in this hygiene behaviour.
If the full set of queens in this line had been assessed for % complete removal, it would be
straightforward to produce EBVs for this trait, in the same way as for ‘Honey production’ and the
scored traits – again, taking account of the performance of relatives.
2. Trial genotype analysis of sample data
Samples of hives were collected from the Better Bees WA program, and from one line maintained by
the Horners. These samples were then submitted to the Australian Genome Research Facility for
processing.
Detail of the sample collection method is included as an appendix (the protocols for sample collection
were developed in consultation with researchers in NZ, and drawing on expertise from the lab of Prof.
Ben Oldroyd at University of Sydney). The focus here is on the results obtained.
The results obtained can be summarised:
– Total number genotyped was limited by budget.
– Before quality control (QC):
o 144 honey bees were genotyped using genotyping-by-sequencing (GBS).
11o There were 149,000 single-nucleotide polymorphisms (SNPs) for each individual
(149,000 DNA locations per individual).
– After quality control (QC):
o 124 individuals were genotyped using genotyping-by-sequencing (GBS).
o There were 11,000 single-nucleotide polymorphisms (SNPs) for each individual.
The quality control (QC) steps focus on how confidently we can interpret the data for each individual
DNA location. This is dependent on how well-mapped each location is, and how strong the signal is at
each location for each individual.
In the initial stages of applying this approach, there can be considerable wastage, i.e. exclusion of
SNPs and individual.
The data – genotypes of 11,000 SNP for 124 individuals – were then analysed to determine genetic
similarity among the individuals.
The number of individuals by source is shown here:
Figure 6: Number of individuals by source for DNA analysis
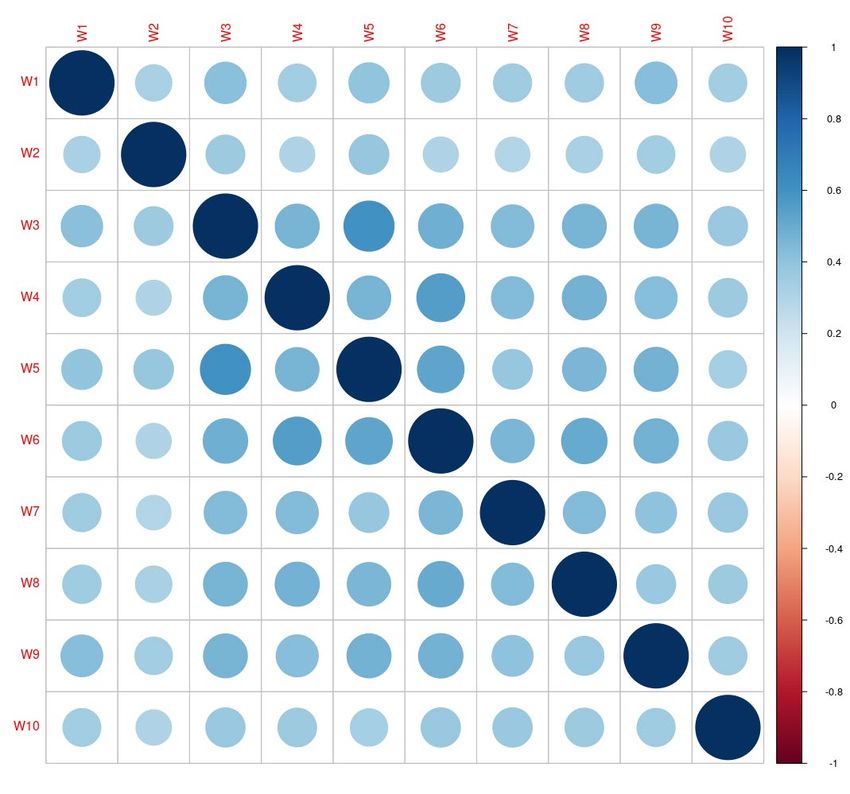
The strength of relationships between the different sources is shown over page:
12Figure 7: Level of relatedness of sources
The colour of each cell in the table indicates how closely related the sources are (the key is
alongside):
• The red circled cell is the relationship of the source ‘W1’ with itself – which is 1.
• The green circled cell is the relationship between the source ‘W3’ with the source ‘W7’, with
the relationship being moderate, at about 0.4. This indicates that there is some genetic
relationship between the hives sampled at ‘W3’ and those sampled at ‘W7’.
• The orange circled cell is the relationship between the source ‘W4’ and the source ‘Horner’,
and this is much weaker – a genetic relationship of about 5-10%.
It is very important to stress that these relationships say nothing about any characteristics of
any of the sources – they describe the strength of genetic similarity or relatedness.
We can focus in on the Western Australian sources:
13Figure 8: Degree of relatedness among Western Australian sources
This chart suggests that there are moderate genetic relationships among all the Western Australian
sources – in the range 0.2 to 0.5. A value of 0.5 is equivalent to that among full-sibs, i.e. same father
and mother. A value of 0.2 is just below that of half-sibs – individuals who share one parent in
common.
These results should be treated as indicative only – because only small numbers of samples per source
were processed. At the same time, these results seem sensible: there is gene flow among the different
breeder sources within Better Bees WA, and there has been limited gene flow (small numbers of
queens) between BBWA colonies and Horner family colonies historically.
The more important result of this trial is that it establishes a basis for wider-scale genotyping (reading
the DNA to this level of SNP coverage):
• Sampling is relatively straightforward, being based on either a small number of drones per
hive, but can also be done on wing tip samples from queens, or on samples of workers
14• The total cost per hive sampled is likely to be in the range $50-60, depending on volume. This
includes the extraction of the DNA from the material, and then the actual reading (this price
range is not significantly different from those observed in other species).
As the number of samples genotyped increases, it is almost certain that the number of DNA locations
per sample will increase dramatically, enabling greater precision of understanding genetic
relationships, and also providing scope for analysis of whether particular DNA regions are having
significant effects on particular traits.
The key message for the honey bee breeders and beekeepers is that the platform has been established
for reading the DNA of queens (and hives) – so that genotyping is a practical option for use in genetic
improvement.
How that might work is covered in the next section.
3. A model for implementation of genetic evaluation and genomic
selection in Australian honey bees
Implementing genetic evaluation and genomic selection in industry
This section outlines the basic elements of a genetic evaluation and genomic selection system for the
industry, focusing on the basic principles and foundations. Actual implementation will require
ongoing consultation across queen breeders and multipliers, honey producers, pollinators and R&D
personnel.
This section draws on experience with other species and the results presented above. In addition, a
small number of key references have been summarised – chosen for the key points they illustrate in
relation to an effective genetic evaluation and improvement system for honey bees, including in
relation to use of genomic tools.
Modelling implementation in the Australian honey bee industry
The basic assumptions or parameters are:
• In terms of genetic evaluation and improvement, the industry comprises the following main
groups:
o Queen breeders
o Queen multipliers
o Honey producers
o Pollinators
• Queen breeders are assumed to be individuals or enterprises who keep some level of
performance records, and who select queens for their own use, and for potential sale to others.
• Queen multipliers are assumed to be individuals or enterprises who obtain queens from queen
breeders, and then multiply them up either for their own use or for sale of queens to others.
• Honey producers are assumed to be individuals or enterprises who obtain queens from queen
breeders or multipliers, and then produce honey from hives containing those queens. In
practice, honey producers may retain some queens from their own hives themselves, with or
without having recorded or observed performance of those hives.
• Pollinators obtain queens (or hives) from queen breeders and/or queen multipliers, and use
them for pollination services.
15• For simplicity, queen breeders will be assumed to be the only individuals or enterprises taking
performance records (this assumption will be relaxed in discussion further on).
• Assume initial recorded population is 1,000 queens per year. To put this number into an
industry context, the annual intake of new queens across industry is likely to be about
250,000, assuming 500,000 hives and a queen life of two seasons. In turn, this estimate
implies somewhere between 1,000 and 10,000 queen mothers – assuming between 25 and 250
daughter queens per queen mother.
• The cost of collecting pedigree and performance records will be assumed to be $50 per queen,
and the cost of genotyping will be assumed to be $50 per sample.
• An ongoing R&D and adoption overhead should be included:
o Database and analysis: potential cost ~ $50,000 per year
o Coordination, communication, training and extension (assume 2.5 FTE) ~ $250,000
per year
The key elements of a genetic evaluation and improvement system will be common whether or not
genomics is included, but genomics adds cost and opportunity. The elements, with the genomics-
included option added, are:
a) Recording of pedigree and performance on (initially) 1,000 queens:
a. Genomic analysis of those 1,000 queens via hive drone samples.
b) Analysis of pedigree and performance data to generate EBVs and Selection Index values on
recorded queens:
a. EBVs calculated incorporating genomic information.
c) Queen breeders make selection decisions – to identify queens to be parents of the next
generation of queens, and of drones.
d) Queen multipliers and other purchasers choose queens, or alternatively daughters of queens,
and use them either directly, or as parents of queens.
What pedigree information is available affects what results can be generated – briefly explained in the
following table (in each case, some performance information is assumed to have been collected on the
same individuals, or on relatives)
16Table 3: Five scenarios for implementation of genetic or genomic selection
Scenario Pedigree information What EBVs can be produced
A Queen identity only, i.e. no EBVs for performance traits, within the contemporary group.
pedigree.
Daughters of each queen could get EBVs – simply as half
the EBV of their parent queen.
B Queen identity, plus identity EBVs for performance traits with more accuracy than without
of queen mother. pedigree. Depending on pedigree links between
contemporary groups, EBVs could be compared across
linked groups. Pedigree linkage here means that some
queens in different contemporary groups had the same
queen mothers.
Daughters of each queen could get EBVs – simply as half
the EBV of their parent queen.
C Queen identity, plus identity As for B, with some increase in accuracy of EBVs
of queen mother, and of
drone mothers.
This could be achieved by
keeping records of which
queens contributed drones,
or through use of AI.
D Queen identity, plus DNA As for C, with potential further increase in accuracy of EBVs.
sample of the hive.
Assuming this scenario is applied to multiple contemporary
This scenario also assumes groups, EBVs would be available for the queens of all
genotyping and phenotyping contemporary groups, and their ancestors.
of 500-1,000 hives per year
across industry. These to be Daughters of each queen could get EBVs:
in suitable contemporary - Simply as the average of the EBVs of their parents (i.e.
groups (i.e. larger than c. the queen, and the drone cloud to which she was mated
five hives in the one location – which gets its EBV as half the EBVs of the mothers of
over the same time period). the drones).
- If the daughters are themselves genotyped (i.e. via wing
tip samples), then they would get EBVs that would be
slightly more accurate than the average of their parents
E Hive DNA sample only Each such sample would generate EBVs for that hive,
(either as queen sample, drawing on the information collected in the reference
drone sample, or drones population (the 500-1,000 hives phenotyped and genotyped
and workers). each year).
This scenario also assumes This could be applied via:
genotyping and phenotyping - Multipliers or producers submitting samples for
of 500-1,000 hives per year genotyping and getting EBVs, enabling them to choose
across industry. These to be from among their own stocks.
in suitable contemporary - Queen breeders testing juvenile queens prior to offering
groups (i.e. larger than c. them for sale – enabling more informed choice for
five hives in the one location buyers.
over the same time period).
For each scenario, we can estimate costs and potential returns, using the assumptions outlined above.
These estimates are shown in Table 4. It is very difficult to generate industry-wide estimates of
benefit and cost for these scenarios, given that adoption rates have to be estimated, but a simple
overview is shown in Table 5.
17You can also read