Hypertension delays viral clearance and exacerbates airway hyperinflammation in patients with COVID-19
←
→
Page content transcription
If your browser does not render page correctly, please read the page content below
Articles
 https://doi.org/10.1038/s41587-020-00796-1

Hypertension delays viral clearance and
exacerbates airway hyperinflammation in
patients with COVID-19
Saskia Trump 1,17, Soeren Lukassen 2,17, Markus S. Anker3,4,5,6,17, Robert Lorenz Chua 2,17,
Johannes Liebig 2,17, Loreen Thürmann 1,17, Victor Max Corman 7,17, Marco Binder 8,17,
Jennifer Loske 1, Christina Klasa9, Teresa Krieger2, Bianca P. Hennig 2, Marey Messingschlager ,
 1

Fabian Pott 7,10, Julia Kazmierski 7,10, Sven Twardziok2, Jan Philipp Albrecht2, Jürgen Eils2,
Sara Hadzibegovic3,4,5,6, Alessia Lena3,4,5,6, Bettina Heidecker3, Thore Bürgel2, Jakob Steinfeldt 3,
Christine Goffinet 7,10, Florian Kurth 11,12, Martin Witzenrath11, Maria Theresa Völker 13,
Sarah Dorothea Müller13, Uwe Gerd Liebert 14, Naveed Ishaque 2, Lars Kaderali 9,
Leif-Erik Sander 11, Christian Drosten 7, Sven Laudi 13,18 ✉, Roland Eils 2,15,16,18 ✉,
Christian Conrad 2,18 ✉, Ulf Landmesser 3,18 ✉ and Irina Lehmann 1,15,18 ✉

In coronavirus disease 2019 (COVID-19), hypertension and cardiovascular diseases are major risk factors for critical disease
progression. However, the underlying causes and the effects of the main anti-hypertensive therapies—angiotensin-converting
enzyme inhibitors (ACEIs) and angiotensin receptor blockers (ARBs)—remain unclear. Combining clinical data (n = 144) and
single-cell sequencing data of airway samples (n = 48) with in vitro experiments, we observed a distinct inflammatory predis-
position of immune cells in patients with hypertension that correlated with critical COVID-19 progression. ACEI treatment was
associated with dampened COVID-19-related hyperinflammation and with increased cell intrinsic antiviral responses, whereas
ARB treatment related to enhanced epithelial–immune cell interactions. Macrophages and neutrophils of patients with hyper-
tension, in particular under ARB treatment, exhibited higher expression of the pro-inflammatory cytokines CCL3 and CCL4
and the chemokine receptor CCR1. Although the limited size of our cohort does not allow us to establish clinical efficacy, our
data suggest that the clinical benefits of ACEI treatment in patients with COVID-19 who have hypertension warrant further
investigation.

O
 f patients hospitalized for COVID-19, males and those patients without hypertension. In addition, these patients exhibit
 of older age have a higher risk for critical disease1,2. exacerbated inflammatory responses and have a higher risk of dying
 Hypertension, which is highly prevalent in adults world- from COVID-19 than patients without hypertension4,6.
wide3, has been identified as a major risk factor for increased Severe acute respiratory syndrome coronavirus 2 (SARS-CoV-2),
COVID-19 severity4,5. Hypertensive patients with COVID-19 are the virus that causes COVID-19, exploits the ACE2 receptor,
more likely to develop severe pneumonia or organ damage than expressed on epithelial cells in the respiratory system, for cellular

1
 Molecular Epidemiology Unit, Charité - Universitätsmedizin Berlin, corporate member of Freie Universität Berlin, Humboldt-Universität zu Berlin, and
Berlin Institute of Health (BIH), Berlin, Germany. 2Center for Digital Health, Berlin Institute of Health (BIH) and Charité - Universitätsmedizin Berlin,
corporate member of Freie Universität Berlin, Humboldt-Universität zu Berlin, Berlin, Germany. 3Department of Cardiology, Campus Benjamin Franklin,
Charité - Universitätsmedizin Berlin, corporate member of Freie Universität Berlin, Humboldt-Universität zu Berlin, and Berlin Institute of Health (BIH),
Berlin, Germany. 4Division of Cardiology and Metabolism, Department of Cardiology Campus Virchow, Charité - Universitätsmedizin Berlin, corporate
member of Freie Universität Berlin, Humboldt-Universität zu Berlin, and Berlin Institute of Health (BIH), Berlin, Germany. 5Centre for Cardiovascular
Research (DZHK), Berlin, Germany. 6Berlin Institute of Health Center for Regenerative Therapies (BCRT), Berlin, Germany. 7Institute of Virology, Charité
- Universitätsmedizin Berlin, corporate member of Freie Universität Berlin, Humboldt-Universität zu Berlin, and Berlin Institute of Health (BIH), Berlin,
Germany. 8Research group ‘Dynamics of early viral infection and the innate antiviral response’ (division F170), German Cancer Research Center (DKFZ),
Heidelberg, Germany. 9Institute for Bioinformatics, University Medicine Greifswald, Greifswald, Germany. 10Berlin Institute of Health (BIH), Berlin,
Germany. 11Department of Infectious Diseases and Respiratory Medicine, Charité - Universitätsmedizin Berlin, corporate member of Freie Universität
Berlin, Humboldt-Universität zu Berlin, and Berlin Institute of Health (BIH), Berlin, Germany. 12Department of Tropical Medicine, Bernhard Nocht Institute
for Tropical Medicine & I. Department of Medicine, University Medical Center Hamburg-Eppendorf, Hamburg, Germany. 13Department of Anesthesiology
and Intensive Care, University Hospital Leipzig, Leipzig, Germany. 14Institute of Virology, University Hospital Leipzig, Leipzig, Germany. 15German Center
for Lung Research (DZL), Berlin, Germany. 16Health Data Science Unit, Medical Faculty and BioQuant, University of Heidelberg, Heidelberg, Germany.
17
 These authors contributed equally: Saskia Trump, Soeren Lukassen, Markus S. Anker, Robert Lorenz Chua, Johannes Liebig, Loreen Thürmann, Victor Max
Corman, Marco Binder. 18These authors jointly supervised this work: Sven Laudi, Roland Eils, Christian Conrad, Ulf Landmesser, Irina Lehmann.
✉e-mail: sven.laudi@medizin.uni-leipzig.de; roland.eils@charite.de; christian.conrad@charite.de; ulf.landmesser@charite.de; irina.lehmann@charite.de

Nature Biotechnology | VOL 39 | June 2021 | 705–716 | www.nature.com/naturebiotechnology 705
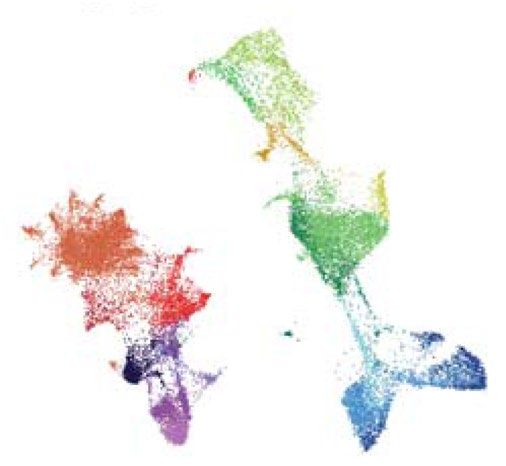
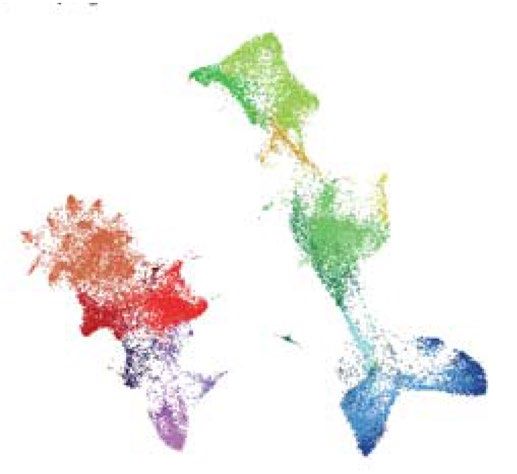
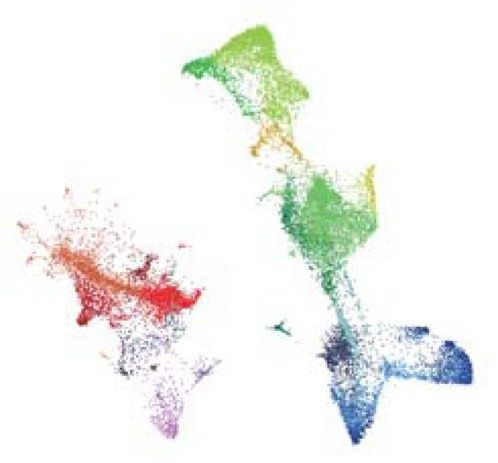
Articles Nature Biotechnology

attachment and entry7. ACE2 is a membrane-bound aminopepti- used cardiovascular therapeutics, such as statins and beta block-
dase and is part of the non-canonical arm of the renin–angioten- ers. This analysis confirmed a higher risk for developing critical
sin–aldosterone system (RAAS), which regulates blood pressure COVID-19 for hypertensive patients with/without a coexisting
homeostasis and vascular repair responses. It has been speculated cardiovascular disease (HT+/CVD+/−) over non-hypertensive
that anti-hypertensive treatment by ACEIs or ARBs might modulate patients (HT−/CVD−; adjusted odds ratio (adjOR) = 4.28, 95%
ACE2 expression and, thereby, alter susceptibility for SARS-CoV-2 confidence interval (CI): 1.60–11.46, P = 0.028; Fig. 1a, upper
infection. In the classical RAAS pathway, angiotensin II binds to the panel). The logistic regression analysis revealed no significant
angiotensin II receptor subtype 1 (AT1R), which promotes vasocon- increase for critical COVID-19 in hypertensive patients with
striction and pro-inflammation. ACE2, on the other hand, cleaves ACEI treatment compared to non-hypertensive patients (HT+/
angiotensin II into angiotensin 1–7 and angiotensin I into angio- CVD−/ACEI+ versus HT−/CVD−; Fig. 1a, middle panel). In con-
tensin 1–9, both mediating vasodilatatory and anti-inflammatory trast, patients treated with ARB still had an increased risk for
effects8,9. Several different compounds of ACEI (for example, critical COVID-19 compared to non-hypertensive patients (HT−/
ramipril and enalapril) and ARB (for example, candesartan and val- CVD− versus HT+/CVD−/ARB+) (adjOR = 4.14, 95% CI: 1.01–
sartan) are used in clinical practice, which have a similar mode of 17.04, P = 0.044; Fig. 1a, middle panel). However, this risk for
action within their class10. critical disease was lower than for hypertensive patients without
 Data from animal studies demonstrated that ACEIs and ARBs ACEI or ARB treatment (HT−/CVD− versus HT+/CVD−/ACEI−/
can upregulate ACE2 expression11, raising the question of whether ARB−: adjOR = 8.17, 95% CI:1.65–40.52, P = 0.009; Fig. 1a).
an increase in the availability of SARS-CoV-2 receptors in patients In trend, similar results were observed for HT+/CVD+ patients
treated with ACEIs or ARBs12,13 rendered them more susceptible to (Fig. 1a, lower panel) without reaching the significance level,
viral infection and spread. To date, there is no evidence from obser- likely owing to lower case numbers.
vational studies that ACEI or ARB treatment could increase the Our results showed that patients with hypertensive disease had
infectivity for SARS-CoV-2 (refs. 4,14). an increased risk for critical COVID-19. This risk was lower in
 Hypertension is associated with the activation of inflammatory ACEI/ARB-treated patients. ACEI treatment almost entirely abol-
processes15–19. As a hyperinflammatory phenotype in the respiratory ished the additional risk related to hypertension, whereas ARB
system has been described to enhance the severity of COVID-19 treatment was associated with only a reduced risk.
(refs. 20,21), we assessed whether a potential pro-inflammatory pre-
disposition of patients with hypertension before SARS-CoV-2 ARB but not ACEI treatment was associated with delayed
infection might contribute to an exacerbated disease severity. SARS-CoV-2 clearance. We investigated the dynamics of
 To this end, we evaluated the effect of coexisting cardiovascu- SARS-CoV-2 clearance in patients included in the Pa-COVID-19
lar illnesses, in particular of hypertension and anti-hypertensive cohort. During hospitalization, patients with COVID-19 were tested
treatment, on COVID-19 pathology and viral clearance based on longitudinally for SARS-CoV-2 by quantitative polymerse chain
two German prospective cohorts. By analyzing the single-cell tran- reaction (qPCR) of the viral genome. Using an adjusted repeated
scriptome landscape of the airways of patients with COVID-19 and measurement mixed model, we studied the changes of the viral load
SARS-CoV-2− controls, we provide insights into the differential over time, comparing ACEI+ (n = 21) or ARB+ (n = 26) patients
COVID-19 pathology in patients treated with ACEI/ARB com- with COVID-19 to HT−/CVD− patients with COVID-19 (n = 46).
pared to patients without cardiovascular diseases or with a different All three groups showed the same initial viral load. Although ACEI+
anti-hypertensive treatment. treatment did not change viral clearance up to 16 d after the first
 positive test compared to HT−/CVD−, ARB treatment was associ-
Results ated with a significantly slower viral clearance over time compared
ACEI/ARB treatment was associated with a lower hypertension- to HT−/CVD− (P = 0.031) or ACEI+ (P = 0.026) (Fig. 1b), respec-
related risk for critical COVID-19. We first assessed the effect tively. This finding was supported by the time-dependent slope
of hypertension (HT+) and other cardiovascular diseases (CVD+) of viral load between the different patient groups. ARB+ patients
with anti-hypertensive treatment on COVID-19 severity (Fig. 1a). tended to have a flatter slope compared to HT−/CVD− (P = 0.07;
Both medical conditions have been associated with an adverse out- Extended Data Fig. 1a). The same was observed for HT+/CVD+/−
come in COVID-19 (refs. 4,12–14,22–24). Accordingly, we compared patients who showed a tendency of slower viral clearance compared
the proportion of critical cases to all other severities of COVID-19 to HT−/CVD− patients (P = 0.08; Extended Data Fig. 1b).
in the different patient groups of the Pa-COVID-19 cohort25 (see Taken together, we showed that viral clearance in HT+/CVD+/−
Supplementary Table 1 for clinical characteristics). The proportion patients under ACEI treatment was similar to that in patients with
of patients with a critical outcome was significantly increased for COVID-19 without a coexisting cardiovascular disease, whereas
HT+/CVD+/− patients (n = 90) compared to HT−/CVD− patients viral clearance might have been delayed in patients undergoing
with COVID-19 (n = 54, P = 0.002). For HT+ patients, the pro- hypertensive ARB treatment.
portion for critical COVID-19 was highest without ACEI or ARB
treatment: almost 77% of HT+/CVD− patients without ACEI or Cardiovascular disease and SARS-CoV-2 infection affect cell
ARB and over 70% of HT+/CVD+ patients without ACEI or ARB type distribution. To investigate the cellular and molecular effect
showed critical COVID-19 (Supplementary Table 2 and Fig. 1a). of cardiovascular comorbidities and anti-hypertensive treatment
In contrast, ACEI and ARB treatments were associated with a on COVID-19 severity, we performed extensive single-cell tran-
decreased proportion of critical COVID-19 in both groups (HT+/ scriptome profiling of nasopharyngeal samples from patients with
CVD− and HT+/CVD+); however, ACEI treatment showed a more COVID-19 with or without hypertension and other cardiovascu-
profound decline in critical cases as compared to ARB treat- lar diseases (see Supplementary Table 3 for clinical characteristics).
ment. ACEI-treated HT+/CVD+/− patients showed almost the To disentangle the effect of HT and CVD on SARS-CoV-2 infec-
same proportion of critical COVID-19 as HT−/CVD− patients tion, we also included a mirror cohort of patients negative for
(Supplementary Table 2 and Fig. 1a). SARS-CoV-2 with and without HT/CVD under ARB/ACEI treat-
 To exclude the effect of other risk factors for an adverse ment (Fig. 2a). In total, we assessed the transcriptomes of 114,761
COVID-19 clinical course, we performed logistic regression anal- individual cells obtained from nasopharyngeal swabs of 32 patients
yses adjusted for known confounding factors, including age, sex, with COVID-19 (n = 25 with HT+/CVD+/−; n = 10 ACEI+ and
body mass index (BMI) and co-treatment with other commonly n = 15 ARB+; for treatment, see Supplementary Table 3) and 16

706 Nature Biotechnology | VOL 39 | June 2021 | 705–716 | www.nature.com/naturebiotechnology
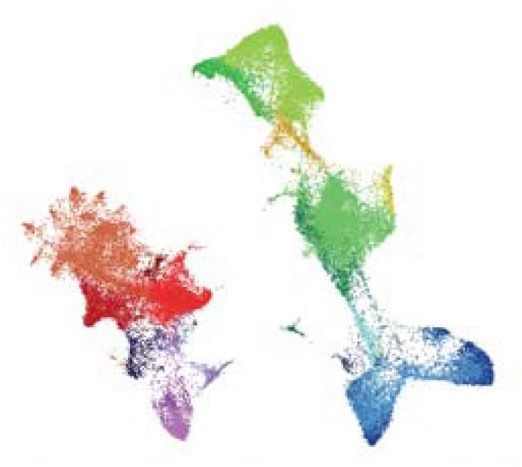
Nature Biotechnology Articles
 a b
 Pa-COVID-19 cohort
 8
 *
 Critical
 7
 Severe

 log10 viral genome copy
 6
 Moderate
 Mild 5

 HT –/CVD– HT+/CVD+/– 4
 n = 54 n = 90
 HT+/CVD– 3

 * * 2 HT–/CVD– (n = 46)
 1 ACEI+ (n = 21)
 ARB+ (n = 25)
 0
 1 4 7 10 13 16
 Days after first test
 ACEI+ ARB+ ACEI–/ARB–
 n = 16 n = 21 n = 26
 HT+/CVD+ Predicted mean P value
 ARB + 0.031
 HT–/CVD– 5.33 ACEI + 0.644
 HT –/CVD– 0.644
 ACEI+ 5.13
 ARB + 0.026
 HT –/CVD– 0.031
 ARB+ 6.18
 ACEI+ ARB+ ACEI–/ARB– ACEI – 0.026
 n=9 n = 11 n=7

Fig. 1 | Association of anti-hypertensive treatment with COVID-19 severity and viral clearance in the Pa-COVID-19 cohort. a, Comparison of COVID-19
severity based on WHO classification in patients without cardiovascular comorbidities (HT−/CVD−, n = 54) and those with arterial hypertension
or cardiovascular disease (HT+/CVD+/−, n = 90). Patients were separated into those with HT only (HT+/CVD−, n = 63) and those with additional
cardiovascular diseases (HT+/CVD+, n = 27) and are depicted dependent on their treatment with ARB (ARB+), ACEI (ACEI+) or other medications (ACEI−/
ARB−). P < 0.05 based on chi-square tests comparing the number of critical patients versus patients with COVID-19 of all other WHO categories. All
comparisons were made against the HT−/CVD− group; for exact P values, refer to Supplementary Table 2. b, Viral clearance over time shown for patients
positive for SARS-CoV-2 without a coexisting cardiovascular disease (CVD−/HT−, n = 46) in comparison to ARB+ (n = 25) or ACEI+ (n = 21) HT+/
CVD+/− patients with COVID-19. Depicted are mean ± s.d. of qPCR data binned in 3-d intervals; only the maximal value of each patient in this interval
was considered. Adjusted regression analysis (confounder: BMI, gender, smoking, insulin treatment and days after onset of symptoms; n = 92) showed
a significantly higher viral load for ARB+ HT+/CVD+/− compared to ACEI+ HT+/CVD+/− and HT−/CVD− patients. Predicted means were calculated using
maximum likelihood, and P values were derived from Fisher’s LSD.

SARS-CoV-2− controls (n = 10 with HT+/CVD+/−; n = 6 ACEI+ thereby, the infectivity for SARS-CoV-2. Because the expression of
and n = 4 ARB+; for treatment, see Supplementary Table 3). There ACE2 is generally low in human airways26, we quantified total ACE2
was no significant difference in systolic or diastolic blood pressure expression per sample. In line with previous studies29,30, we found
between the ACEI- and ARB-treated patients at the day of sampling an overall increased expression of both ACE2 (P = 0.0025; Extended
(systolic: 130.6 ± 16.3 mmHg versus 130.4 ± 14.2 mmHg, P = 0.97; Data Fig. 4a) and TMPRSS2 (P = 0.0002; Extended Data Fig. 4b)
diastolic: 74.7 ± 9.7 mmHg versus 69.7 ± 14.7 mmHg, P = 0.26). upon SARS-CoV-2 infection. However, anti-hypertensive treat-
There was also no difference when comparing HT−/CVD− patients ment did not alter ACE2 expression, in neither patients positive for
(systolic: 118.9 ± 17.0 mmHg; diastolic: 67.7 ± 10.3 mmHg) to those SARS-CoV-2 nor patients negative for SARS-CoV-2, in line with
treated with ACEIs or ARBs (systolic: P = 0.21; diastolic: P = 0.36). recent observations from Lee et al.31.
Only individuals diagnosed with severe to critical COVID-19 or We conclude that entry factor expression did not predispose
SARS-CoV-2− controls were eligible for inclusion in this part of the ACEI- or ARB-treated patients to SARS-CoV-2 infection. This find-
study (Supplementary Table 3). ing is in accordance with observational studies, which did not reveal
 We identified nine immune and 12 epithelial cell populations any effect of ACEI or ARB treatment on SARS-CoV-2 infection risk
(Fig. 2b,c and Extended Data Fig. 2). Overall, SARS-CoV-2 infec- in individuals with HT or other CVDs4.
tion led to pronounced changes in most epithelial and immune cells
and cell states (Fig. 2c and Extended Data Fig. 3). In HT+/CVD+/− ARB-treated patients with COVID-19 have a reduced
patients with COVID-19, secretory and ciliated cells, known to cell-intrinsic antiviral response. We next assessed potential
be primarily infected by the virus20,26–28, tended to be significantly molecular mechanisms that might be involved in the delayed viral
decreased compared to HT−/CVD− patients. This was accompa- clearance of ARB-treated patients within the Pa-COVID-19 cohort
nied by an expansion of non-resident macrophages (nrMa) and described above. Pathway enrichment analysis based on the top
monocyte-derived macrophages (moMa), independent of their 100 genes that were significantly differentially expressed (log fold
anti-hypertensive treatment (Fig. 2c and Extended Data Fig. 3). change > 0.25, false discovery rate (FDR) < 0.05, expression in
 >10% of cells in one group) in either of the anti-hypertensive treat-
Anti-hypertensive treatment is not associated with altered ment groups compared to the HT−/CVD− group showed an acti-
expression of the SARS-CoV-2 entry receptor ACE2. SARS-CoV-2 vation of genes involved in stress and inflammatory response and
enters the human cell via the receptor ACE2 and with the help of antigen processing in ciliated cells of ARB+ HT+/CVD+/− patients
the protease TMPRSS2. It has been speculated that ARB and ACEI, with COVID-19 (Fig. 3a, Extended Data Fig. 5a and Supplementary
as RAAS-modulating agents, might change ACE2 expression and, Table 4a). For ACEI+ HT+/CVD+/− patients with COVID-19, path-

Nature Biotechnology | VOL 39 | June 2021 | 705–716 | www.nature.com/naturebiotechnology 707
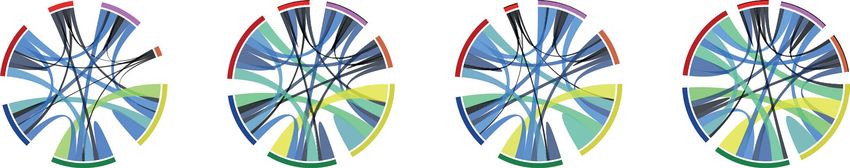
Articles Nature Biotechnology

 a b
 scRNA-seq cohort Squamous Squamous-diff

 – – + +/–
 HT /CVD HT /CVD
 –
 ACEI /ARB
 –
 ACEI
 +
 ARB
 +
 scRNA-seq
 nasopharayngal Squamous-ViralResp

 n=6 n=6 n=4 samples
 Basal
 –

 Neu
 SARS-CoV-2

 Secretory
 moMa

 Secretory-diff
 rMa
 Secretory-ciliated FOXN4
 n=7 n = 10 n = 15 nrMa
 MC/basophil
 SARS-CoV-2+

 Ionocyte
 B cell
 p-NKT Ciliated-
 NKT ViralResp
 Ciliated-diff

 UMAP2
 CTL
 Ciliated
 UMAP1

 c
 SARS-CoV-2– SARS-CoV-2+
 – – + + + +/– – – + + + +/–
 HT /CVD ACEI ARB HT /CVD HT /CVD ACEI ARB HT /CVD
 B cells 8.75 7.73 9.69 8.37 11.52 3.28* 3.57* 3.61*#
 MC/basophil 23.00 28.03 15.31 23.88 6.23# 4.33*# 2.82*# 3.08*#
 Neu 21.92 11.82* 13.12 12.24* 45.45# 39.69*# 40.90*# 39.56*#
Immune cells

 rMa 7.99 5.00 5.00 5.00 12.04 25.36*# 24.62* 25.49*#
 nrMa 6.26 9.09 12.81 10.31 3.50 14.17* 15.03* 14.59*
 moMa 0.43 0.00 0.00 0.00 0.38 3.56*# 1.22*# 1.88*#
 CTL 8.32 5.45 7.81 6.22 6.28 4.12* 5.06* 5.01*
 p-NKT 7.99 7.27 3.44 6.02 2.56# 2.64# 2.39 2.49#
 NKT 15.33 25.61* 32.81* 27.96* 12.02 2.85*# 4.39*# 4.29*#

 SARS-CoV-2– SARS-CoV-2+

 HT–/CVD– ACEI+ ARB+ HT+/CVD+/– HT–/CVD– ACEI+ ARB+ HT+/CVD+/–
 Squamous-ViralResp 2.15 2.74 0.91 2.23 4.19# 2.46* 2.9* 2.66*

 Squamous 3.06 2.47 1.94 2.32 3.94 4.95 7.39* 6.64*#
 Squamous-diff 12.25 14.39 16.29 14.92 10.63# 21.12* 19.77* 21.87*#
 Ionocytes 0.29 0.57 0.57 0.57 0.69 0.77 0.61 0.68
Epithelial cells

 Ciliated-ViralResp 3.76 1.94* 14.95* 15.41 1.42# 12.42* 2.54* 3.41*#
 Ciliated 17.85 19.78 16.06 18.74 12.58# 10.24* 15.20* 12.09#
 Ciliated-diff 9.11 8.57 19.13* 11.52 17.02# 8.14* 17.97 13.40*
 FOXN4 0.92 0.04* 0.00* 0.03* 1.61# 0.51* 0.58* 0.60*#
 Secretory ciliated 0.45 0.26 0.91 0.45 4.19# 2.05* 3.56 2.77*#
 Secretory 15.47 8.08* 7.97* 8.05* 14.32 7.87* 8.13* 8.50*
 Secretory-diff 30.54 25.17* 19.59* 23.61* 26.87# 27.75 20.08* 25.69
 Basal 4.15 15.98* 2.28 12.15* 2.53# 1.72* 1.29* 1.72#

Fig. 2 | Characteristics of the scRNA-seq cohorts and cell type distribution of nasopharyngeal samples. a, A subset of patients from the Pa-COVID-19
cohort and the SC2-Study were analyzed by scRNA-seq to study the effect of HT/CVD and its treatment by ARB or ACEI in patients negative for
SARS-CoV-2 (n = 16) or positive for SARS-CoV-2 (n = 32). b, Samples were collected from the nasopharynx of the patients and subjected to scRNA-seq,
resulting in the given UMAP displaying all identified cell types and states (color coded). c, Distribution of epithelial and immune cell types/states in patients
negative for SARS-CoV-2 and patients positive for SARS-CoV-2 separated by HT+/CVD+/− / HT−/CVD− or ACEI+/ARB+ treatment. Given are percentages
related to the total number of epithelial or immune cells, respectively. Benjamini–Hochberg adjusted P values < 0.05 from multinomial logistic regression
are given. *Significance compared to HT−/CVD−; #Significance compared to SARS-CoV-2−. CTL, cytotoxic T lymphocyte; diff, differentiating; MC, mast cell;
Neu, neutrophil; p-NKT, proliferating natural killer T cell; ViralResp, viral response.

ways related to defense response and regulation of viral genome tistically significantly upregulated type I and type III interferon
replication were enriched in ciliated cells. Of those genes involved (IFN)-induced genes (for example, IFI6, IFI27 and ISG15; Fig. 3a,b)
in regulation of viral genome replication, we found several sta- in both treatment groups.

708 Nature Biotechnology | VOL 39 | June 2021 | 705–716 | www.nature.com/naturebiotechnology
Nature Biotechnology Articles
 In secretory cells, ACEI treatment was associated with upregu- The gene set indicative of extrinsic IFN signaling was not
lation of genes negatively regulating immune system response to pre-activated in HT+/CVD+/− patients negative for SARS-CoV-2
virus. Interestingly, ARB treatment was associated with a strong treated by ACEIs or ARBs. Only upon SARS-CoV-2 infection, a
induction of genes involved in chemotaxis and inflammatory robust extrinsic antiviral response was induced in both ciliated and
response in secretory cells (Fig. 3a, Extended Data Fig. 5a and secretory cells of HT+/CVD+/− patients with COVID-19 treated by
Supplementary Table 4a), including CXCL1, CXCL6 and IL-8, ACEIs or ARBs (Fig. 3e,f). A transcription factor binding motif
which recruit and activate neutrophils (Neu), and CXCL17, which analysis for genes differentially regulated in secretory cells con-
is a chemoattractant for monocytes, macrophages and dendritic firmed the notion that the classical cell-intrinsic antiviral signal-
cells (Fig. 3a,c). ing through transcription factors such as IRF3, IRF1 and ISGF3
 Recently, evidence has been mounting that cell-intrinsic anti- (ISRE) was enriched in ACEI+-treated, but not ARB+-treated HT+/
viral signaling leading to an early type I/III IFN response plays a CVD+/− patients with COVID-19 (Extended Data Fig. 5b). Instead,
substantial role in controlling SARS-CoV-2 replication. Inactivating ARB+-treated patients showed a strong bias toward genes controlled
mutations (single-nucleotide polymorphisms) in key signaling mol- by NF-κB, which is a hallmark transcription factor for inflamma-
ecules of cell-intrinsic responses (for example, TRIF, TBK1, IRF3 tory conditions35–37.
and IRF7) associate strongly with delayed viral clearance and severe
clinical courses of COVID-19 (ref. 32). Lacking or delayed IFN Crosstalk between epithelial and immune cells is associated
production, however, can lead to excessive amounts of IFNs late with anti-hypertensive treatment in patients with COVID-19.
in infection, likely produced by immune cells. This ‘extrinsic’ IFN The differential gene expression by ACEI/ARB described above
signaling appears unable to clear infection and, rather, contributes revealed a distinct induction of inflammatory and chemoattractant
to inflammation and immune pathology33,34. We, therefore, sought genes. Hence, we determined all possible intercellular interactions
to disentangle cell-intrinsic responses triggered by viral infection of all cell types and states across the different conditions using
and cell-extrinsic responses induced by signaling through type CellPhoneDB38 (Fig. 4). Basal cells, secretory cells, ciliated cells,
I/III IFNs. In an in vitro setting using A549 cells, we studied the resident macrophages (rMa), nrMa, Neu and cytotoxic T lympho-
extrinsic and intrinsic transcriptional response supposedly induced cytes (CTL) had the highest number of interactions within the
by SARS-CoV-2 infection. Cells were stimulated either by a highly nasopharyngeal mucosa of patients with COVID-19 (Fig. 4a,b).
specific RIG-I ligand triggering prototypical antiviral signaling A coexisting CVD correlated with an increased number of cell–
through IRF3 or by a combination of IFNβ- and INFλ-inducing cell interactions with most of the previously mentioned cell types,
prototypical IFN signaling through ISGF3 (Fig. 3d). Although the gaining about 500 additional interactions upon SARS-CoV-2
major pattern recognition receptor for SARS-CoV-2 remains elu- infection (Fig. 4a).
sive, all potential antiviral pathways converge on the transcription In patients negative for SARS-CoV-2, interactions in ACEI+ and
factors IRF3/IRF7 and NF-κB34, eliciting a similar transcriptional ARB+ were very similar in number and type (Fig. 4a and Extended
response (Supplementary Table 4b). Data Fig. 6a). In contrast, for patients with COVID-19, ACEI treat-
 By overlapping the specific intrinsic and extrinsic antiviral ment was concomitant with a reduction of interactions, whereas
response gene sets identified in the in vitro experiment with the interactions in ARB treatment remained almost unchanged com-
differentially expressed genes in secretory and ciliated cells of pared to HT+/CVD+/− patients.
patients with COVID-19 (Supplementary Table 4b; for enrichment, The cell-specific interactions were then categorized as intra-
see Methods), we observed that overall ACEI but not ARB treat- versus inter-compartment interactions (immune:immune and
ment was associated with a strong cell-intrinsic antiviral response epithelial:epithelial versus immune:epithelial compartment inter-
in secretory cells of patients positive for SARS-CoV-2 (Fig. 3e–f actions, Extended Data Fig. 6b). In general, regardless of the
and Supplementary Table 4c). Of note, already in patients nega- SARS-CoV-2 infection status, epithelial cells exhibited more
tive for SARS-CoV-2, anti-hypertensive treatment by ACEI/ARB potential interactions with themselves, whereas immune cells had
was associated with the induction of genes involved in cell-intrinsic more inter-compartment interactions with epithelial cells. When
antiviral defense in secretory but not in ciliated cells (Fig. 3e–f and comparing interactions in patients negative for SARS-CoV-2 and
Supplementary Table 4c). In secretory cells, pre-activation of the patients positive for SARS-CoV-2, we generally observed a loss
intrinsic antiviral response was further enhanced in ACEI-treated of intra-compartment interactions for epithelial cells and a gain
HT+/CVD+/− patients with COVID-19 (Fig. 3e). The increase in in inter-compartment interactions with immune cells among all
cell-intrinsic antiviral response was absent in ARB-treated HT+/ conditions. Both inter- and intra-compartment interactions of
CVD+/− patients with COVID-19. In the light of recent literature34, immune cells tended to be increased in HT+/CVD+/− patients with
we speculate that this might contribute to an observed delay in COVID-19 compared to HT−/CVD− patients with COVID-19
SARS-CoV-2 clearance in those patients. (Extended Data Fig. 6b and Supplementary Table 5). Accordingly,

Fig. 3 | Differential regulation of antiviral response in patients with different anti-hypertensive treatments. a, Scaled heat maps showing the top 100
genes differentially expressed between SARS-CoV-2+ ACEI+ or ARB+ and HT−/CVD− patients in ciliated and secretory cells by scRNA-seq (scaling by
column). Enriched pathways (Extended Data Fig. 5a) and genes shown in b are selectively marked next to heat maps. b, c, Expression plots of genes
involved in regulation of viral genome replication in ciliated and secretory cells, respectively. Red circles indicate Benjamini–Hochberg adjusted two-tailed
negative binominal P < 0.05. Plotting labels on the right side. d, Schematic layout of comparative overlap analysis of in vitro experiments (A549 lung
cell culture) and scRNA-seq of nasal swaps, displaying the workflow for generation of gene sets used in e and f. For further details, see Methods. e, Bar
plots showing the linear fold change of enrichment of overlap between the gene sets generated as shown in d (intrinsic and extrinsic, left and right panel,
respectively). The differentially regulated gene sets were split into upregulated and downregulated genes, which are displayed separately as positive and
negative values on the x axis, respectively. Asterisks indicate adjusted P values derived from a two-sided hypergeometric test for overlap. For exact P
values, refer to Supplementary Table 4c. *P < 0.05, **P < 0.01, ***P < 0.001. f, Iconized table indicating the direction and strength of enrichment shown in
e. Upward-pointing arrows mark an enriched overlap in upregulated genes (ARB+ versus HT−/CVD− and ACEI+ versus HT−/CVD−); downward-pointing
arrows mark an enriched overlap in downregulated genes. Circles indicate that no significant enrichment of overlap is observed. The numbers of patients
cohorts are: SARS-CoV-2− HT−/CVD−: n = 6; SARS-CoV-2− ACEI+: n = 6; SARS-CoV-2– ARB+: n = 4; SARS-CoV-2+ HT−/CVD−: n = 7; SARS-CoV-2+ ACEI+:
n = 10; SARS-CoV-2+ ARB+: n = 15. DEG, differentially expressed gene.

Nature Biotechnology | VOL 39 | June 2021 | 705–716 | www.nature.com/naturebiotechnology 709
Articles Nature Biotechnology
 a Stress and Antigen Defense Regulation of viral
 inflammatory response processing response genome replication

 ARB+
 Ciliated ACEI+
 ACEI–/ARB–
 1
 SARS-CoV-2+

 1 I6 7
 IT 5 IF FI2
 IF G1 1 I 0.5
 Negative regulation of IS MX M3 Chemotaxis and
 IT 0
 immune system response to virus IF inflammatory response

 ARB+ −0.5
 Secretory

 ACEI+ −1
 ACEI–/ARB–

 L1 15 M
 2 L6
 XC IL8 IS
 G
 IF
 IT XC 17
 C C L
 XC
 C

 b Ciliated cells
 c Secretory cells Pct. exp.
 25
 – –
 HT /CVD HT–/CVD–
 SARS-CoV-2–

 –
 50

 SARS-CoV-2
 + + 75
 ACEI ACEI
 Ave. exp.
 ARB+ ARB+
 1
 HT–/CVD– HT–/CVD–
 SARS-CoV-2+

 SARS-CoV-2+ 0
 ACEI+ ACEI+
 −1
 ARB+ ARB+
 P < 0.05

 8

 15
 I6

 2
 L1

 L6
 X1

 X2
 7

 1

 7
 15
 3

 IL

 M
 I2

 IT

 L1
 M
 IF

 G
 XC

 XC
 M

 M
 G

 IT
 IF

 IF

 IT

 XC

 IS
 IS

 IF
 IF

 C

 C
 C

 d IFNβ IFNλ RIG-I - like receptor scRNA Seq
 treatment stimulation DEG SARS-CoV-2+
 A549 cells

 ACEI+ vs HT–/CVD–
 Overlap
 ARB+ vs HT–/CVD–
 ARB+ vs ACEI+

 Microarry
 DEG

 Extrinsic Intrinsic
 viral respone viral response

 e Intrinsic antiviral response Extrinsic antiviral response f SARS-CoV-2–
 6 +
 ACEI vs HT /CVD – – Ciliated Secretory
 30 ARB+ vs HT–/CVD–
 **

 ***
 ***
 **
 Upregulated genes

 **

 Intrinsic Intrinsic ACEI
 3
 Upregulated genes

 20
 Fold enrichment of overlap

 Fold enrichment of overlap

 Extrinsic Extrinsic

 Intrinsic Intrinsic ARB
 **

 0 10
 Extrinsic Extrinsic
 **

 SARS-CoV-2+
 Downregulated genes

 0
 Downregulated genes

 3 Ciliated Secretory
 **

 10
 **
 ***

 Intrinsic Intrinsic ACEI
 6 Ciliated Secretory Ciliated Secretory
 Extrinsic Extrinsic
 – + – + – –
 + +
 -2 -2 -2 -2 -2 -2 -2 -2
 oV oV oV oV oV oV oV oV Intrinsic Intrinsic ARB
 -C C -C C C C C
 R
 S S- R
 S S- S- S-
 C S- S-
 R R R R Extrinsic Extrinsic
 SA SA SA SA SA S AR SA S AR

710 Nature Biotechnology | VOL 39 | June 2021 | 705–716 | www.nature.com/naturebiotechnology
Nature Biotechnology Articles
a b SARS-CoV-2+
 SARS-CoV-2– SARS-CoV-2+ HT –/CVD – ACEI+
 CTL
 moMa rMa200 0 100 2
 CTL
 a 0 100 20
 0
 100 00
 30
 04
 rM 200300 0 300
 40
 0 0
 0 00 10
 nrMa 1,500 50 0

 00
 a

 0
 04

 0
 nrM
 rMa

 10

 Ne
 30

 10
 Ne00 300
 02

 0

 02
 00

 0 30

 u
 u

 nrMa
 2

 00
 NKT 1,000

 0 100

 100 20
 Immune
 CTL

 0 0
 100 0

 0

 00 10
 p-NKT 500

 500 4

 200

 al
 al

 02
 Bas
 Bas

 400
 00

 00
 B cell

 30
 Cil

 03
 30

 30

 0
 iat
 0

 40

 40
 0

 0
 Ci
 20
 Neu

 20
 ed
 10

 lia
 0
 10

 0
 0 0 0

 te
 0 0 0 0
 10 100

 d
 MC/basophil 600 500 200 500 400 300 200 130
 400 300
 ry
 Secretory Secreto
 Basal 65

 Secretory-diff ARB+ HT+/CVD+/–
 30
 rM
 a
 400
 500 0 100 2 CTL rMa300 400 500 0 100 CT
 Secretory 3 00
 00
 30
 04 2 00
 200
 30
 L
 2 00 00 1 00 04
 0 00
 Secretory-ciliated 10 0

 00
 0
 0

 06
 10

 0
 0
 FOXN4

 50
 02
 60

 10
 Neu

 nrMa

 Neu
 00
 00

 02
 500

 4
 Epithelial

 30

 00 30
 nrMa
 Ciliated-diff

 200 300
 300 400

 0 400

 0
 Ciliated

 0
 100 0
 200 10

 100 0

 0 100
 Ciliated-ViralResp

 200

 0 20
 0

 500
 00
 sal
 0

 30
 Ionocyte

 l
 03

 sa
 40
 Ba
 50

 0
 40

 Ba
 40
 0
 0

 30
 Ci
 0
 40

 0
 Ci

 50
 Squamous-diff 30 20

 50
 0
 0

 lia
 lia 0
 20 0
 0
 10

 te
 te 01
 100
 0
 00
 0
 d 00 0

 d
 Squamous 0 400 300 20
 0 500 400 300 200 1
 ry
 Secreto Secretory
 Squamous-ViralResp
 HT –/CVD –

 HT+/CVD+/–

 HT –/CVD –

 HT+/CVD+/–
 ACEI+

 ACEI+
 ARB+

 ARB+

c
 SARS-CoV-2+

 HT –/CVD – ACEI+ ARB+ HT+/CVD+/–
 CCR5-CCL7 –log10
 (P value)

 CCR1-CCL7 1
 2
CCR1-CCL18 3

 CCL4-CCR5 log2 mean
 5
 CCL3-CCR5
 0
 CCL3-CCR1
 –5
 CCL2-CCR2
 Basal

 CTL

 Ciliated

 Neu

 Secretory

 nrMa

 rMa

 Basal

 CTL

 Ciliated

 Neu

 Secretory

 nrMa

 rMa

 Basal

 CTL

 Ciliated

 Neu

 Secretory
 nrMa

 rMa

 Basal

 CTL

 Ciliated

 Neu

 Secretory

 nrMa

 rMa

 nrMa

Fig. 4 | Cell–cell interactions in COVID-19 under anti-hypertensive treatment. a, Heat map depicting the total number of interactions per cell type across
the different SARS-CoV-2+/− conditions. Scaled by number of identified interactions. All succeeding plots show only SARS-CoV-2+ cases. b, Circos plots
of the most highly interactive cells (basal, secretory, ciliated, CTL, Neu, nrMa and rMa, printed in bold) scaled by the number of identified interactions.
c, Dot plot showing immune modulatory interactions of nrMa across conditions with the highly interactive cells. Color coding reflects log2 mean expression,
whereas the P value derived from CellPhoneDB is shown by the dot size. The patient numbers for deriving the different sets were: SARS-CoV-2+ HT−/
CVD−: n = 7; SARS-CoV-2+ ACEI+: n = 10; SARS-CoV-2+ ARB+: n = 15; SARS-CoV-2+ HT+/CVD+/−: n = 25; SARS-CoV-2− HT−/CVD−: n = 6; SARS-CoV-2−
ACEI+: n = 6; SARS-CoV-2− ARB+: n = 4; SARS-CoV-2− HT+/CVD+/−: n = 10.

intra-compartment interactions upon SARS-CoV-2 infection were Notably, this finding was mostly affected by ARB treatment, as
exclusively statistically significantly increased in immune cell types ARB+/HT+/CVD+/− patients showed an overall increase in immune
but decreased in epithelial cells (Supplementary Table 5). cell interactions, whereas ACEI+/HT+/CVD+/− patients were similar

Nature Biotechnology | VOL 39 | June 2021 | 705–716 | www.nature.com/naturebiotechnology 711
Articles Nature Biotechnology

a Hypertension

 nrMA rMA Neu CTL NKT
 SARS-CoV-2– SARS-CoV-2+ SARS-CoV-2– SARS-CoV-2+ SARS-CoV-2– SARS-CoV-2+ SARS-CoV-2– SARS-CoV-2+ SARS-CoV-2– SARS-CoV-2+

 TLR1 MMP9 KLRD1
 TLR2 ITGB2
 GNLY
 ITGAM
 C1QB GZMA
 ICAM1
 C1QC
 TLR2 GZMB
 CCL2 CCR1 GZMK
 CCL3 CXCR1
 PRF1
 CCL4 CXCR2
 CXCR4 CCL3
 CXCL1
 IFNGR1 CCL4
 CXCL2
 TNFRSF1B
 CCL5
 CXCL3 CCL2
 CXCR4
CXCL10 CCL3
 CCL4 TNF
 IL1β
 CXCL2 IFNG
 IL6
 IL1β
 IL8 TGFB1
 IL8
 TNF VEGFA NFKB1
 –

 +

 –

 –

 +

 –

 –

 +

 –

 –

 +

 –

 –

 +

 –

 –

 +

 –

 –

 +

 –

 –

 +

 –

 –

 +

 –

 –

 +

 –
 H VD

 H VD

 H VD

 VD

 H VD

 H VD

 H VD

 VD
 H VD

 H VD

 H VD

 H VD

 T+ D

 T – D
 T+ D

 VD
 T+ D

 T+ D

 VD

 VD

 VD

 VD

 VD

 VD

 VD

 VD
 VD

 VD

 VD

 VD
 H /CV

 H CV
 H CV
 H CV

 H V
 /C

 /C

 /C

 /C

 /C

 /C

 /C

 /C
 /C

 /C

 /C

 /C

 /C
 /C

 /C

 /C

 /C

 /C

 /C

 /C

 /C

 /C
 /C

 /C

 /C

 /C
 T –

 T+

 T –

 T+

 T –

 T+

 T –

 T+
 T+

 T+

 T+

 T+

 T –

 –

 +

 –

 +

 –

 +

 –

 +
 +

 +

 +

 +
 /
 /
 /

 T

 T

 T

 T
 T

 T

 T

 T
 T

 T

 T

 T
 H

 H

 H

 H

 H

 H
 H

 H

 H

 H
 H

 H

 H

 H

 H
 P < 0.05 Pct. exp. Ave. exp.

 100 75 50 25 –2 –1 0 1 2

b Anti-hypertensive treatment

 nrMA rMA moMa Neu CTL NKT
 SARS-CoV-2– SARS-CoV-2+ SARS-CoV-2+ SARS-CoV-2+ SARS-CoV-2– SARS-CoV-2+ SARS-CoV-2– SARS-CoV-2+ SARS-CoV-2– SARS-CoV-2+

 TLR1 MMP9 KLRD1
 ITGB2
 TLR2 GNLY
 ITGAM
 C1QB GZMA
 ICAM1
 C1QC GZMB
 TLR2
 CCL2 CCR1 GZMK
 CCL3 CXCR1
 PRF1
 CCL4 CXCR2
 CXCR4 CCL3
 CXCL1
 IFNGR1 CCL4
 CXCL2
 TNFRSF1B
 CCL5
 CXCL3 CCL2
 CXCR4
 CXCL10 CCL3
 CCL4 TNF
 IL1β
 CXCL2 IFNG
 IL6
 IL1β
 IL8 TGFB1
 IL8
 TNF VEGFA NFKB1
 +

 +

 +

 +
 EI +

 EI +

 +

 EI +

 –

 –

 –

 –
 +

 +

 +

 +
 EI +

 EI +
 –

 –

 –

 –
 T – B+

 B+

 +

 B+

 –

 –
 T – B+

 B+

 EI

 EI

 EI

 EI
 EI

 H ARB

 B

 H ARB

 B
 VD

 VD

 VD

 VD
 B
 VD

 VD

 VD

 VD

 VD

 VD

 AR

 AR
 H AR

 AR

 AR

 AR

 AC

 AC

 AC

 AC
 H AR

 AR
 AC

 AC

 AC

 AC

 AC

 AC

 /C

 /C

 /C

 /C
 /C

 /C

 /C

 /C

 /C

 /C

 –

 T –

 –

 T –
 –

 T –

 –

 –

 T

 T
 T

 T

 T

 H

 H
 H

 H

 H

 H

 P < 0.05 Pct. exp. Ave. exp.

 100 75 50 25 –2 –1 0 1 2

Fig. 5 | Hypertension-related immune response of the upper airway in COVID-19. a, b, Dot plots depict gene expression of COVID-19-related
pro-inflammatory mediators and receptors in macrophages, neutrophils and T cells of the nasopharynx. a, Significant gene expression changes in
nrMa, rMa, Neu, NKT and CTL of hypertensive patients with (HT+/CVD+, n (SARS-CoV-2+/−) = 4/10) or without an additional CVD (HT+/CVD−, n
(SARS-CoV-2+/−) = 6/15) compared to HT−/CVD− patients (n (SARS-CoV-2+/−) = 6/6). b, Significantly altered gene expression in different immune cells
of hypertensive patients treated either with ARB+ (n (SARS-CoV-2+/−) = 4/15) or ACEI+ (n (SARS-CoV-2+/−) = 6/10) in comparison to HT−/CVD− patients
(n (SARS-CoV-2+/−) = 6/6). Significant differences in a and b are based on Benjamini–Hochberg adjusted P value calculated using MAST < 0.05 and
are indicated by red circles. Samples with no contributing cells per cell type were excluded from analysis. Ave. Exp., average gene expression; Pct. Exp.,
percentage of cells expressing the gene.

712 Nature Biotechnology | VOL 39 | June 2021 | 705–716 | www.nature.com/naturebiotechnology
Nature Biotechnology Articles
to HT−/CVD− patients with COVID-19 (Extended Data Fig. 6b In summary, we conclude that, in contrast to ACEI treatment,
and Supplementary Table 5). In particular, chemokine–chemokine ARB therapy was not as efficient in alleviating hypertension-related
receptor interactions mediated by nrMa (Fig. 4c) reflected the simi- hyperinflammation, especially in nrMa and Neu, possibly contrib-
larity between HT−/CVD− and ACEI-treated patients with COVID- uting to critical COVID-19 course (Fig. 6d).
19. HT+/CVD+/− and ARB-treated patients with COVID-19 were
similar in their interaction pattern, whereas, in ACEI+, there was Discussion
a reduced enrichment of interactions between CCL3/CCL4 and This study identified potential molecular mechanisms underly-
CCR5 and between CCR5 and CCL7, respectively (Fig. 4c). In line ing the findings from observational studies that patients with
with the pronounced chemokine–chemokine receptor interaction, COVID-19 who also had hypertension or cardiovascular disease
the expression of CCL2, CCL3, CCL4 and CCL7 was upregulated showed higher morbidity and mortality rates39–41. As first-line
in ARB+ concomitantly with the expression of their receptors—for anti-hypertensive medication includes modulators of RAAS inter-
example, CCR1, CCR2 and CCR5—suggesting a higher interactiv- fering with the pathway employed by SARS-CoV-2 for cellular
ity of nrMa under ARB compared to ACEI treatment (Extended entry, it has been debated whether ACEI or ARB treatment alters
Data Fig. 6c). SARS-CoV-2 infectivity and the severity of COVID-19. Our data
 suggest that the hypertension-associated additional risk for criti-
Hypertension-related inflammatory priming of immune cells is cal disease progression might be reduced by ARB treatment and
less pronounced in ACEI-treated patients. Hyperinflammation is even more prominently by ACEI treatment. This is corroborated by
a hallmark of adverse COVID-19 course20,21. Therefore, we evalu- previous reports observing higher mortality rates in hypertensive
ated already known key mediators of COVID-19 pathology, includ- patients with COVID-19 in the absence of ACEI/ARB treatment42.
ing immune cell-recruiting chemokines—for example, CCL2, CCL3 Several clinical studies are now available comparing
and CCL4—as well as inflammatory cytokines or cytotoxic media- SARS-CoV-2 infectivity rates of patients with and without ACEI/
tors secreted by T cells, such as IL1β, IL8, PRF1 and granzymes. ARB treatment14,43. Their findings support the notion that testing
Upon SARS-CoV-2 infection, immune cells of HT+/CVD+/− patients positive for SARS-CoV-2 is not associated with treatment by ACEI/
showed a significantly increased expression of these inflammatory ARB14,44. In line, we observed no difference in ACE2 expression and
mediators compared to HT−/CVD− patients (Fig. 5a). initial viral concentration among patient groups. Also, induction
 When comparing expression of all genes depicted in Fig. 5a of ACE2 expression after SARS-CoV-2-infection was not altered
between SARS-CoV-2+ HT+/CVD+/−/ACEI+ or HT+/CVD+/−/ by ACEI/ARB treatment. However, viral clearance was delayed
ARB+, expression of most genes was significantly enhanced in ARB+ by ARB therapy. Although reduced viral clearance can be a result
(Fig. 5b and Supplementary Table 6). of defects in immunity—for example, of an impaired T cell activ-
 For example, in all macrophage subtypes, CCL3 and CCL4 ity—as it has already been reported for cardiovascular diseases45,46,
expression, as well as the infiltrative potential of Neu (ITGAM and our data suggest that an altered balance, and potentially timing, of
ICAM1), was increased in HT+/CVD+/−/ARB+ compared to HT+/ antiviral responses of ciliated and secretory epithelial cells might
CVD+/−/ACEI+ (Fig. 5b and Supplementary Table 6). This hyper- contribute to delayed viral clearance. We found significantly weaker
inflammatory phenotype was not only present in the upper air- cell-intrinsic antiviral signaling via IRF3 in ARB-treated compared
ways but also in bronchial lavage (BL), as reflected by a stronger to ACEI-treated patients, well in line with a recent study report-
activation of BL-nrMa and BL-Neu of a hypertensive patient with ing a substantial association of genetic loss-of-function variants of
COVID-19 (BIH-SCV2-30) compared to an HT−/CVD− patient genes in that pathway, including IRF3 itself, with severe courses of
(BIH-SCV2-25; Extended Data Fig. 7b). COVID-19 progression. In contrast, patients under ACEI treatment
 In the absence of SARS-CoV-2 infection, HT+/CVD+/− patients showed elevated cell-intrinsic antiviral responses and exhibited
were characterized by inflammatory priming predominantly in viral clearance dynamics similar to normotensive patients.
nrMA, Neu and NKT, but not in rMa and CTL, independent of We identified hypertension-associated elevated immunologi-
anti-hypertensive treatment (Fig. 5a,b, Supplementary Table 6 and cal activity as the prominent factor contributing to the increased
Extended Data Fig. 7a). ACEI treatment, and to a much lesser extent risk of hypertensive patients for a more critical course of COVID-
ARB treatment, alleviated the hypertension-related inflammatory 19. Hypertensive patients showed an inflammatory predisposi-
response to SARS-CoV-2 infection (Supplementary Table 6). tion in different immune cell subtypes observed already before
 SARS-CoV-2 infection, irrespective of anti-hypertensive treatment.
Exacerbated expression of CCL3 and CCL4 observed in Upon SARS-CoV-2 infection, ARB-treated patients exhibited an
ARB-treated hypertensive patients correlates with disease sever- exaggerated hyperinflammatory response, which was alleviated
ity. We next evaluated whether the observed hypertension-related in ACEI-treated patients. This distinct inflammatory response of
inflammatory predisposition of immune cells might contribute patients with COVID-19 under different anti-hypertensive treat-
to an increased risk for critical COVID-19. All genes showing ments might also give rise to the less pronounced risk reduction
a hypertension-related inflammatory priming (Supplementary for disease severity under ARB compared to ACEI therapy that
Table 7a) were overlapped with the genes with a significantly we observed. We found ACEI treatment potentially rendering
increased expression in critical compared to non-critical COVID- neutrophils less invasive compared to ARB treatment in HT+/
19 (Supplementary Table 7b and Fig. 6a). The resulting intersec- CVD+/− patients. This parallels results from ischemia–reperfusion
tion included three genes, namely CCL3, CCL4 and CXCR4 (Fig. data, which showed leukocyte–endothelium interaction inhibited
6a). Using a logistic regression model considering age, gender, by ACEI treatment, but not ARB treatment, which might result in
days after onset of symptoms and study center as potential con- less neutrophil invasion into lung tissue and, therefore, ameliorat-
founding factors, we confirmed a significant positive relationship ing lung injury47,48. Furthermore, RAAS dysregulation resulting
between expression of CCL4 derived from nrMa (adjOR/95% CI = in decreased Ang(1–7) concentrations might be a central mecha-
1.04/1.00–1.07, P = 0.027) and CCL3 expressed by Neu (adjOR/95% nism of COVID-19 pathogenesis49. This hypothesis is supported by
CI = 1.13/1.01–1.27, P = 0.02) with an increased risk for critical data from a recent study by Kintscher et al.50, which showed that
COVID-19 (Fig. 6b). Notably, expression of CCR1, the receptor SARS-CoV-2 infection significantly decreased Ang(1–7) concentra-
bound by CCL3 and CCL4, increased in nrMa and Neu concomi- tions, which were restored by ACEI treatment, but not ARB treat-
tantly with severity of COVID-19, supporting the potential of CCR1 ment, supporting our notion of a higher anti-inflammatory capacity
as a therapeutic target20 (Fig. 6c). in ACEI-treated compared to ARB-treated COVID-19 (ref. 50).

Nature Biotechnology | VOL 39 | June 2021 | 705–716 | www.nature.com/naturebiotechnology 713
Articles Nature Biotechnology

a
 SARS-CoV-2– CCL3 CCL4 SARS-CoV-2+
 hypertension vs. no hypertension CXCR4 critical vs. non-critical COVID-19

 CCL3 CCL4 CXCR4

 *** *** *** *** *** ***
 *** *** *** *** *** ***
 *** * *** *** 4 4
 ***
 Expression in nrMa

 Expression in nrMa

 Expression in NKT
 Expression in CTL
 Expression in Neu

 Expression in Neu
 6 6 6
 4

 4 4 4
 2 2
 2
 2 2 2

 0 0 0 0 0 0

 SARS-CoV-2– Non-critical COVID-19 Critical COVID-19

b c nrMa Neu
 nrMa CCL3
 ** **
 nrMa CCL4 * ** * 10 ** *
 6
 *

 Norm. ave. exp.

 Norm. ave. exp.
 Neu CCL3 8
 4 6
 CCR1

 CCR1
 Neu CXCR4
 4
 CTL CXCR4 2
 2
 NKT CXCR4
 0 0
 0.8 1.0 1.2 1.4 1.6 1.8
 –
 SARS-CoV-2 Non-critical COVID-19 Critical COVID-19
 adjOR (95% CI)
 for critical COVID-19

d
 SARS-CoV-2– SARS-CoV-2+

 T cells rMa/nrMa Neu NKT CTL rMa moMa nrMa Neu

 GZMB CCL3 CCL3 CCL4
 GNLY CCL4 -CXCL2 CCL3 IL8
 IL8 GNLY CCL4 CCL3 CCL4 CCL3 CCL4 CCL3 CCL4
 Soluble factors

 IL1β GZMB -CXCL2 TNF - IL1 CCL3 IL8
 GZMK TNF IL1β TNF GZMK KLRD1 TNF CXCL2- TNF
 KLRD1 IFNγ GNLY IL1
 PRF1 IL1 IL8 CXCL2 IL1 IL8
 PRF1
 ACEI

 ARB
 Receptors

 CXCR1 ITGB2 CXCR1 ITGB2
 CXCR4 CXCR2 CXCR4 CXCR4 CXCR4 CXCR2 CXCR4
 TNFRSF1B TNFRSF1B

 CCL4 CCL3
 Pre-inflammation
 in hypertensive patients CCR1

 Critical COVID-19

Fig. 6 | Perturbed expression in the CCL3/CCL4–CCR1 axis correlates with disease severity. a, Schematic layout of the overlay between differentially
expressed genes (DEGs) in hypertensive/non-hypertensive patients and DEGs between critical/non-critical patients in all immune cell subtypes. For the
genes found in the overlap, violin plots depict expression in patients negative for SARS-CoV-2 and non-critical/critical patients positive for SARS-CoV-2.
Significant differences are based on Benjamini–Hochberg adjusted P values calculated using MAST. b, Adjusted logistic regression analyses of all
genes and cell populations found in this overlay in association to critical COVID-19 (confounder: age, gender, days after onset of symptoms and study
center). The forest plot shows adjusted odds ratios with whiskers representing the 95% CI. Significant relationships are depicted in bold. c, Not only
CCL3 and CCL4 were significantly associated with severity but also their receptor CCR1. Shown are mean expression levels per patient in nrMA and Neu,
respectively. Significances were derived from a two-sided Mann–Whitney U test. d, The left panel summarizes all genes related to immune mediators and
receptors depicted in Fig. 5 that we found to be elevated in HT+/CVD+/− patients negative for SARS-CoV-2 compared to HT−/CVD− patients independent
of ACEI/ARB treatment. The right panel shows those genes significantly upregulated in patients positive for SARS-CoV-2 when comparing ACEI+ (n = 10,
light blue colored genes) to ARB+ (n = 15, dark blue colored genes). Genes associated with critical COVID-19 are highlighted in red. *P < 0.05, **P <
0.005, ***P < 0.0005.

714 Nature Biotechnology | VOL 39 | June 2021 | 705–716 | www.nature.com/naturebiotechnology
Nature Biotechnology Articles
 The increased concentrations of Ang(1–7) might reduce the pro- 9. Romero, C. A., Orias, M. & Weir, M. R. Novel RAAS agonists and
pensity for lung failure and has been suggested as a new therapeu- antagonists: clinical applications and controversies. Nat. Rev. Endocrinol. 11,
 242–252 (2015).
tic principle in critical COVID-19 (refs. 51,52). Animal studies have 10. Williams, B. et al. 2018 ESC/ESH guidelines for the management of arterial
shown that Ang(1–7) is able to attenuate lipopolysaccharide-induced hypertension. Eur. Heart J. 39, 3021–3104 (2018).
activation of macrophages, arguing that ACEI might be more ben- 11. Soler, M. J., Barrios, C., Oliva, R. & Batlle, D. Pharmacologic modulation of
eficial than ARB in reducing the COVID-19-mediated hyperin- ACE2 expression. Curr. Hypertens. Rep. 10, 410–414 (2008).
 12. Jarcho, J. A., Ingelfinger, J. R., Hamel, M. B., D’Agostino, R. B. Sr. &
flammation in this cell population, which has been described as a
 Harrington, D. P. Inhibitors of the renin–angiotensin–aldosterone system and
central feature of adverse COVID-19 (refs. 20,53). Besides the ACE2/ Covid-19. N. Engl. J. Med. 382, 2462–2464 (2020).
Ang(1–7)/MasR-mediated effects of Ang(1–7)8,54 it might be also 13. Vaduganathan, M. et al. Renin–angiotensin–aldosterone system inhibitors in
possible that ACEI or ARB treatment increases the concentration patients with Covid-19. N. Engl. J. Med. 382, 1653–1659 (2020).
of the other anti-inflammatory mediator of the RAAS pathway 14. Reynolds, H. R. et al. Renin–angiotensin–aldosterone system inhibitors and
 risk of Covid-19. N. Engl. J. Med. 382, 2441–2448 (2020).
Ang(1–9). The effects of AT2R activation by Ang(1–9) have been 15. Dinh, Q. N., Drummond, G. R., Sobey, C. G. & Chrissobolis, S. Roles of
underappreciated in SARS-CoV-2 infection so far, although animal inflammation, oxidative stress, and vascular dysfunction in hypertension.
studies on pulmonary hypertension showed its potential to reduce Biomed. Res. Int. 2014, 406960 (2014).
pro-inflammatory mediators such as CCL2 or IL1β55. 16. Jayedi, A. et al. Inflammation markers and risk of developing hypertension: a
 This study demonstrated an immune activation in hypertensive meta-analysis of cohort studies. Heart 105, 686–692 (2019).
 17. McMaster, W. G., Kirabo, A., Madhur, M. S. & Harrison, D. G. Inflammation,
patients that was largely augmented under COVID-19 and might immunity, and hypertensive end-organ damage. Circ. Res. 116,
provide an explanation for the adverse course of the disease related 1022–1033 (2015).
to a hyperinflammatory response in these patients. Our data are in 18. Olofsson, P. S. et al. Blood pressure regulation by CD4+ lymphocytes
line with the general guideline recommendations discouraging dis- expressing choline acetyltransferase. Nat. Biotechnol. 34, 1066–1071 (2016).
continuation of ACEI or ARB treatment. In fact, our results might 19. Wenzel, U. et al. Immune mechanisms in arterial hypertension. J. Am. Soc.
 Nephrol. 27, 677–686 (2016).
suggest that ACEI could be the more beneficial anti-hypertensive 20. Chua, R.L. et al. COVID-19 severity correlates with airway
treatment during COVID-19. Although this study is one of the epithelium-immune cell interactions identified by single-cell analysis.
largest single-cell studies of the respiratory system of patients with Nat. Biotechnol. 38, 970–979 (2020).
COVID-19, we have to point out that single-cell RNA sequenc- 21. Liao, M. et al. Single-cell landscape of bronchoalveolar immune cells in
ing (scRNA-seq) studies are typically restricted to a limited num- patients with COVID-19. Nat. Med. 26, 842–844 (2020).
 22. Benelli, G. et al. SARS-COV-2 comorbidity network and outcome in
ber of patients. Thus, we cannot firmly establish efficacy or study hospitalized patients in Crema, Italy. Preprint at https://doi.
additional potentially interesting confounders, such as the geno- org/10.1101/2020.04.14.20053090 (2020).
type, and other factors, such as co-treatment of patients with the 23. Liu, S. et al. Clinical characteristics and risk factors of patients with severe
present patient number. As such, randomized controlled trials are COVID-19 in Jiangsu Province, China: a retrospective multicentre cohort
 study. BMC Infect. Dis. 20, 584 (2020).
required to assess the clinical effect of ACEI versus ARB treat-
 24. Richardson, S. et al. Presenting characteristics, comorbidities, and outcomes
ment in patients with COVID-19, and several trials are already among 5700 patients hospitalized with COVID-19 in the New York City area.
under way (for example, NCT04591210, NCT04493359 and JAMA 353, 2052–2059 (2020).
DRKS00021732). 25. Kurth, F. et al. Studying the pathophysiology of coronavirus disease 2019: a
 protocol for the Berlin prospective COVID-19 patient cohort
 (Pa-COVID-19). Infection 48, 619–626 (2020).
Online content 26. Lukassen, S. et al. SARS-CoV-2 receptor ACE2 and TMPRSS2 are primarily
Any methods, additional references, Nature Research report- expressed in bronchial transient secretory cells. EMBO J. 39, e105114 (2020).
ing summaries, source data, extended data, supplementary infor- 27. Ravindra, N.G. et al. Single-cell longitudinal analysis of SARS-CoV-2
mation, acknowledgements, peer review information; details of infection in human bronchial epithelial cells. Preprint at https://doi.
author contributions and competing interests; and statements of org/10.1101/2020.05.06.081695 (2020).
 28. Sungnak, W. et al. SARS-CoV-2 entry factors are highly expressed in nasal
data and code availability are available at https://doi.org/10.1038/ epithelial cells together with innate immune genes. Nat. Med. 26,
s41587-020-00796-1. 681–687 (2020).
 29. Hou, Y. J. et al. SARS-CoV-2 reverse genetics reveals a variable infection
Received: 16 September 2020; Accepted: 11 December 2020; gradient in the respiratory tract. Cell 182, 429–446 (2020).
Published online: 24 December 2020 30. Nawijn, M. C. & Timens, W. Can ACE2 expression explain SARS-CoV-2
 infection of the respiratory epithelia in COVID-19? Mol. Syst. Biol. 16,
 e9841 (2020).
References 31. Lee, I. T. et al. ACE2 localizes to the respiratory cilia and is not increased by
1. Grasselli, G. et al. Risk factors associated with mortality among patients with ACE inhibitors or ARBs. Nat. Commun. 11, 5453 (2020).
 COVID-19 in intensive care units in Lombardy, Italy. JAMA Intern. Med. 180, 32. Zhang, Q. et al. Inborn errors of type I IFN immunity in patients with
 1345–1355 (2020). life-threatening COVID-19. Science 370, eabd4570 (2020).
2. Gupta, S. et al. Factors associated with death in critically Ill patients with 33. Lee, J. S. & Shin, E. C. The type I interferon response in COVID-19:
 Coronavirus Disease 2019 in the US. JAMA Intern. Med. 180, 1–12 (2020). implications for treatment. Nat. Rev. Immunol. 20, 585–586 (2020).
3. Danaei, G. et al. National, regional, and global trends in systolic blood 34. Park, A. & Iwasaki, A. Type I and type III interferons - induction, signaling,
 pressure since 1980: systematic analysis of health examination surveys and evasion, and application to combat COVID-19. Cell Host Microbe 27,
 epidemiological studies with 786 country-years and 5.4 million participants. 870–878 (2020).
 Lancet 377, 568–577 (2011). 35. Liu, T., Zhang, L., Joo, D. & Sun, S.C. NF-κB signaling in inflammation.
4. Mancia, G., Rea, F., Ludergnani, M., Apolone, G. & Corrao, G. Renin– Signal Transduct. Target Ther. 2, 17023 (2017).
 angiotensin–aldosterone system blockers and the risk of Covid-19. N. Engl. J. 36. Neufeldt, C.J. et al. SARS-CoV-2 infection induces a pro-inflammatory
 Med. 382, 2431–2440 (2020). cytokine response through cGAS-STING and NF-κB. Preprint at https://doi.
5. Liang, X. et al. The association of hypertension with the severity and org/10.1101/2020.07.21.212639 (2020).
 mortality of COVID-19 patients: evidence based on adjusted effect estimates. 37. Taniguchi, K. & Karin, M. NF-κB, inflammation, immunity and cancer:
 J. Infect. 81, e44–e47 (2020). coming of age. Nat. Rev. Immunol. 18, 309–324 (2018).
6. Gao, C. et al. Association of hypertension and antihypertensive treatment 38. Efremova, M., Vento-Tormo, M., Teichmann, S. A. & Vento-Tormo, R.
 with COVID-19 mortality: a retrospective observational study. Eur. Heart J. CellPhoneDB: inferring cell-cell communication from combined expression of
 41, 2058–2066 (2020). multi-subunit ligand-receptor complexes. Nat. Protoc. 15, 1484–1506 (2020).
7. Hoffmann, M. et al. SARS-CoV-2 cell entry depends on ACE2 and TMPRSS2 39. Guan, W.J. et al. Comorbidity and its impact on 1590 patients with
 and is blocked by a clinically proven protease inhibitor. Cell 181, COVID-19 in China: a nationwide analysis. Eur. Respir. J. 55, 2000547 (2020).
 271–280 (2020). 40. Huang, S. et al. COVID-19 patients with hypertension have more severe
8. Paz Ocaranza, M. et al. Counter-regulatory renin–angiotensin system in disease: a multicenter retrospective observational study. Hypertens. Res. 43,
 cardiovascular disease. Nat. Rev. Cardiol. 17, 116–129 (2020). 824–831 (2020).

Nature Biotechnology | VOL 39 | June 2021 | 705–716 | www.nature.com/naturebiotechnology 715
You can also read