G-quadruplexes mark alternative lengthening of telomeres
←
→
Page content transcription
If your browser does not render page correctly, please read the page content below
Published online 21 July 2021                                                                                   NAR Cancer, 2021, Vol. 3, No. 3 1
                                                                                                             https://doi.org/10.1093/narcan/zcab031

G-quadruplexes mark alternative lengthening of
telomeres
Sunny Y. Yang1 , Emily Y.C. Chang2 , Joanne Lim1 , Harwood H. Kwan1 , David Monchaud                                                                      3
                                                                                                                                                              ,
Stephen Yip 4 , Peter C. Stirling2 and Judy M.Y. Wong 1,*
1
 Faculty of Pharmaceutical Sciences, University of British Columbia, Vancouver, V6T 1Z3, Canada, 2 Terry Fox
Laboratory, BC Cancer, Vancouver, V5Z 1L3, Canada , 3 Institut de Chimie Moléculaire, ICMUB CNRS UMR 6302,

                                                                                                                                                                  Downloaded from https://academic.oup.com/narcancer/article/3/3/zcab031/6325203 by guest on 29 September 2021
UBFC Dijon, 21078 Dijon, France and 4 Department of Pathology and Laboratory Medicine, University of British
Columbia, Vancouver, V6T 2B5 Canada

Received April 08, 2021; Revised June 29, 2021; Editorial Decision June 30, 2021; Accepted July 05, 2021

ABSTRACT                                                                          GRAPHICAL ABSTRACT
About 10–15% of all human cancer cells em-
ploy a telomerase-independent recombination-based
telomere maintenance method, known as alterna-
tive lengthening of telomere (ALT), of which the full
mechanism remains incompletely understood. While
implicated in previous studies as the initiating sig-
nals for ALT telomere repair, the prevalence of non-
canonical nucleic acid structures in ALT cancers
remains unclear. Extending earlier reports, we ob-
serve higher levels of DNA/RNA hybrids (R-loops) in
ALT-positive (ALT+) compared to telomerase-positive
(TERT+) cells. Strikingly, we observe even more pro-
nounced differences for an associated four-stranded
nucleic acid structure, G-quadruplex (G4). G4 sig-
nals are found at the telomere and are broadly as-
sociated with telomere length and accompanied by                                  INTRODUCTION
DNA damage markers. We establish an interdepen-
                                                                                  Telomeres are essential protective structures that cap the
dent relationship between ALT-associated G4s and                                  ends of chromosomes to maintain the termini’s integrity
R-loops and confirm that these two structures can                                 and stability. All cancers require a functional telomere
be spatially linked into unique structures, G-loops,                              maintenance mechanism to sustain replicative immortal-
at the telomere. Additionally, stabilization of G4s and                           ity (1). While the majority (∼85–90%) of cancers uti-
R-loops cooperatively enhances ALT-activity. How-                                 lize a telomerase-dependent (TERT+) method of telom-
ever, co-stabilization at higher doses resulted in cy-                            ere maintenance, a subset (∼10–15%) of cancers adopt
totoxicity in a synergistic manner. Nuclear G4 sig-                               telomerase-independent alternative-lengthening of telom-
nals are significantly and reproducibly different be-                             eres (ALT or ALT+) mechanisms. Some notable features
tween ALT+ and TERT+ low-grade glioma tumours.                                    of ALT+ cells include long mean telomere lengths, a higher
Together, we present G4 as a novel hallmark of ALT                                number of degenerate variant telomere repeats, elevated lev-
                                                                                  els of ALT-associated Promyelocytic Leukemia (PML) bod-
cancers with potential future applications as a con-
                                                                                  ies and extrachromosomal telomeric DNA (especially c-
venient biomarker for identifying ALT+ tumours and                                circles, single-stranded extrachromosomal C-rich telomeric
as therapeutic targets.                                                           circular DNA) (1,2). ALT is prevalent in certain cancers,
                                                                                  including osteosarcomas, soft tissue sarcoma and central
                                                                                  nervous system tumours (3,4). Clinically, the prevalence of
                                                                                  ALT in several types of cancers, including pancreatic neu-
                                                                                  roendocrine tumour (5,6) and soft tissue sarcoma (7), has

* To   whom correspondence should be addressed. Tel: +1 604 827 3314; Fax: +1 604 822 3035; Email: judy.wong@ubc.ca

C The Author(s) 2021. Published by Oxford University Press on behalf of NAR Cancer.
This is an Open Access article distributed under the terms of the Creative Commons Attribution-NonCommercial License
(http://creativecommons.org/licenses/by-nc/4.0/), which permits non-commercial re-use, distribution, and reproduction in any medium, provided the original work
is properly cited. For commercial re-use, please contact journals.permissions@oup.com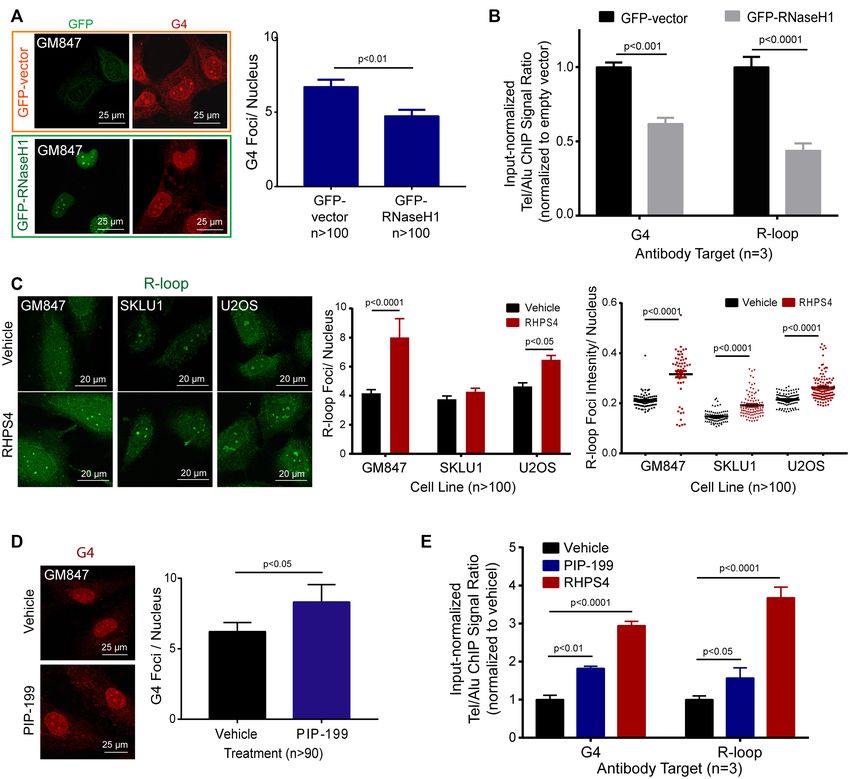
2 NAR Cancer, 2021, Vol. 3, No. 3
been associated with unfavourable prognosis and increased -stacking to form the overall columnar structure. While
mortality. Despite being discovered more than two decades potential G4 forming sequences (pG4s) are widespread in
ago, the mechanisms behind ALT are still not fully under- the genome (24) and transcriptome (25), telomeric regions
stood, necessitating the need to further study the biology of hold the largest pG4 reservoir due to their long consecutive
ALT in hopes of spurring therapeutic development. G-rich repeats. We speculate that this is especially true in
Specifically, the telomeric chromatin environments are ALT+ cells due to their longer telomere tracks and more
significantly different between ALT+ and TERT+ can- permissive telomeric chromatin environment. To expand
cer cells, and a permissive chromatin environment may be our understanding of the biology of ALT, we set out to ex-
necessary for proper engagement of the ALT mechanism. amine the relationship between ALT, R-loops and G4s.
Among the differences, a reduction in the compaction state We observed higher nuclear G4 and R-loop levels in
of ALT telomeres is thought to facilitate the use of recom- ALT+ compared to TERT+ cells. Quantification of telom-
Downloaded from https://academic.oup.com/narcancer/article/3/3/zcab031/6325203 by guest on 29 September 2021
bination, as well as enhanced transcriptional activity lead- eric G4 and R-loop signals revealed their associations with
ing to the increased levels of telomeric repeat-containing telomere length and DNA damage signals. Additionally,
RNA (TERRA) (8–11). While multiple factors may be in- our results revealed the increased formation of ALT-specific
volved in establishing the unique state of ALT telomeric G4/R-loop linked structures, G-loops, which may play a
chromatin, there are two well-characterized factors. First, role in stimulating ALT activity. We demonstrated that G4-
over 80% of all ALT cancers are observed to harbour ge- specific antibodies and chemical probes can differentiate be-
netic dysfunction of the Alpha Thalassemia/Mental Retar- tween low-grade glioma tumours that were typed as either
dation Syndrome X-linked Chromatin Remodeler (ATRX) ALT+ or TERT+ based on their ATRX status. Together, we
or its partner Death Domain Associated Protein (DAXX), present enrichment of nuclear G4s as hallmarks of ALT+
which function as a chromatin remodelling complex in hi- cancers and provide the proof-of-principle for exploiting
stone H3.3 deposition and heterochromatin maintenance these nucleic acid structures as future biomarkers and ther-
(12,13). Thus, ATRX has been suggested to suppress ALT, apeutics.
but the exact mechanisms are still unclear (14,15). An in-
triguing hypothesis proposed is that ATRX may be involved MATERIALS AND METHODS
in suppressing DNA secondary structures (15). Second,
ALT+ cancers carry higher numbers of degenerate vari- Cell line and culture
ant telomeric repeats that cannot associate properly with Cell lines (SKLU1, U2OS, SAOS-2, HELA, MCF7,
shelterin, the six-membered telomeric DNA-binding pro- HT1080) were obtained from American Type Culture Col-
tein complex. Instead, these variant repeats are recognized lection (ATCC). GM847 was obtained from the Coriell
by orphan nuclear receptors that promote chromatin de- Institute cell repository. SUSM1 and HELA1.3 were ob-
compaction (16–18). tained from Collins Lab (UC Berkeley, U.S.A.). Additional
Telomere elongation in ALT undergoes a type of information of cell lines can be found in Supplementary
homology-directed repair (HDR) process related to that Table S1. The cells were cultured in Dulbecco’s modi-
of the break-induced replication (BIR) pathway, specifi- fied Eagle’s medium (Gibco) supplemented with 5% syn-
cally called break-induced telomere synthesis (BITS) (2). thetic fetal bovine serum (FetalClone III; GE Life Sciences)
Two different BITS pathways have been identified, includ- and 1% penicillin-streptomycin mixture (Gibco). Incuba-
ing the slower RAD51-dependent HOP2-MND1-mediated tion was done at 37◦ C in a humidified, 5% CO2 atmosphere-
long-range homology search mechanism (19) and the faster controlled incubator (HERAcell). All cell culturing was
RFC-PCNA DNA damage sensor-mediated mechanism performed using standard procedures, including aspira-
(20). Additionally, replication defects at an ALT telomere tion and washing with phosphate-buffered saline (PBS,
can trigger the RAD52-dependent mitotic DNA synthesis Gibco), trypsinizing using Trypsin-EDTA (Gibco). Coul-
(MiDAS) mechanism (21). While all these ALT pathways ter Counter (Beckman Coulter) was used for cell counting.
share a common prerequisite in that initiation of the re- Transfection protocols can be found in the Extended Meth-
combination process requires some form of persistent DNA ods (Supplementary File).
damage, the full mechanism of the induction of this damage
signal remains unclear.
Immunocytochemistry (ICC) Staining
Given the ‘open’ and more permissive telomere environ-
ment in ALT, we and others speculate that there is a higher Cell lines were fixed with 100% ice-cold methanol. The fixed
chance of forming non-canonical structures at these loci cells on coverslips were then blocked in blocking solution
and that these structures may be the source of the persistent (4% BSA/TBS) for 1 h. For any other primary antibodies
DNA damage for ALT initiation. Recently, multiple reports used, 2 g/ml of antibody diluted in 250 l of block so-
have implicated a role of telomeric R-loops (TelR-loops), lution was used and incubated at 4◦ C overnight. For BG4
DNA/RNA hybrid structures resulting from the associa- (G4-specific antibody) staining, samples were stained with
tion of TERRA transcribed from ALT telomeres (10,22,23), 2 g/ml BG4 for 3 h at room temperature before staining
in the ALT mechanisms. Intriguingly, R-loop formation dis- with 2 g/ml anti-FLAG antibody overnight at 4◦ C. The
places the G-rich telomeric DNA strand, increasing the op- coverslips were then washed three times with PBS-T (0.02%
portunity to form another non-canonical nucleic acid struc- Tween) for 10 min each. Appropriate secondary antibodies
ture, the G-quadruplex (G4). G4s are formed by Hoogsteen were added at 1 g/ml and incubated at room temperature
bonding of adjacent guanine bases to form planar units, for 2 h. The coverslips were washed three times with PBS-
the G-quartets, which then stack on each other through T for 10 min each, counterstained in DAPI and mounted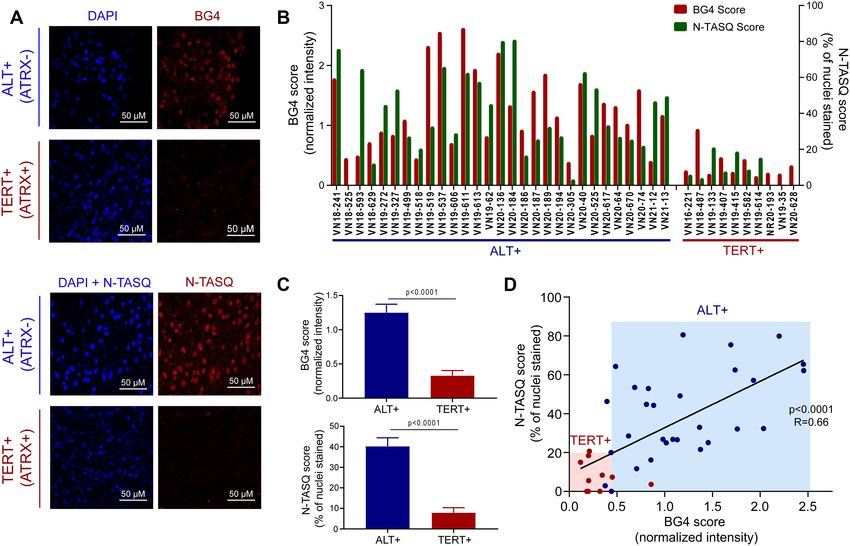
NAR Cancer, 2021, Vol. 3, No. 3 3
using Fluoromount G (Southern Biotech). A detailed list TTGGGTTTGGGTTTGGGTTTGGGTTTGGGTT-3 )
of antibodies used in this study are listed (Supplementary with final concentration of 100 nM and tel2b primer
Table S2). The slides were imaged on Zeiss LSM700 con- (5 -GGCTTGCCTTACCCTTACCCTTACCCTTAC
focal. The raw images were then processed and quantified CCTTACCCT-3 ) with final concentration of 500 nM.
using CellProfiler (26) using a custom pipeline for nuclear Alu repeat was used as genome background control.
foci. Large foci were detected by filtering signals within the Alu DNA was quantified using Alu forward primer (5 -
10–50 pixel range (One pixel is equivalent to 0.08 × 0.08 m GACCATCCCGGCTAAAACG-3 ) and reverse primer
(0.0064 m2 )). Small foci were detected by excluding signals (5 -CGGGTTCACGCCATTCTC-3 ) at a final concentra-
above 10 pixels and passing signals below 10 pixels. Nuclear tion of 100 nM. The master mix was made using SYBR mix
intensity was detected by the total signal within the nuclear (ABM), forward primer, reverse primer and PCR-grade
mask as defined by the DAPI signal. For the overlap analy- H2O. Each ChIP sample was then quantified by running
Downloaded from https://academic.oup.com/narcancer/article/3/3/zcab031/6325203 by guest on 29 September 2021
sis, EZColocalization (27), a plugin in ImageJ, was used to three technical repeats. Tel/Alu ChIP signal ratio was
generate a metric matrix for threshold overlap score (TOS) then computed, and the ratio of each cell line was then
using default settings. normalized to that of HELA. For comparisons between
conditions, the ChIP signal was first normalized to the
input then the Tel/Alu ratios were calculated from the
Chromatin-immunoprecipitation (ChIP) assay
normalized values. The input-normalized Tel/Alu ratios
Cells were seeded at a density of 250 000–750 000 (de- were then normalized against the appropriate controls
pending on the cell line) cells per 10-cm dish. The (either GFP-empty vector control or non-treated control).
cells were treated with ligands of interest the next day.
Cells were washed once with PBS and crosslinked in 1% Proximity ligation assay (PLA)
formaldehyde/fixation buffer (50 mM HEPES KOH, pH
Cells were seeded on coverslips in a 12-well plate at a den-
7.5, 100 mM NaCl, 1 mM EDTA pH 8, 0.5 mM EGTA,
sity of 10 000 cells per well. One day post-seeding, cells were
pH 8) for 5 min and quenched with 0.125 M glycine for 5
washed with PBS, fixed with ice-cold methanol for 10 min,
min. Cells were then resuspended in shearing buffer (0.1%
and permeabilized with ice-cold acetone for 1 min. After
SDS, 1 mM EDTA, 10 mM Tris, pH 8.1) sonicated using
blocking in 3% BSA, 0.1% Tween-20 in 4XSSC for 1 h at
Covaris m220 at 10% duty and chromatin shearing preset
room temperature, cells were then incubated with or with-
setting for 4 min. Sonicate was then spun down at 13 200
out 2 g/ml BG4 in blocking solution for 3 h at room tem-
rpm for 10 min at 4◦ C, and the supernatant is moved to
perature on a rocker. Following 3× PBST wash for 5 min,
a new tube. Sonicate was then precleared and diluted 1:1
cells were incubated with primary antibodies [1:250 rab-
with 2× IP buffer (0.1% SDS, 1 mM EDTA, 10 mM Tris
bit anti-S9.6 antibody (Ab01137-23.0, Absolute Antibody)
pH 8.1, 2% Triton-X, 300 mM NaCl), and 0.1% BSA was
and 1:500 mouse anti-Flag-M2 antibody (F1804, Sigma)]
added to each IP. An aliquot was saved for the input control.
at 4◦ C overnight. The next day, subsequent steps in prox-
About 4–5 g of antibody was added to each ChIP tube
imity ligation assay were carried out with Duolink In Situ
and no antibody was added to the control tube. The IP was
Kit (Sigma) following the manufacturer’s instructions. The
performed overnight at 4◦ C on the rotator. On the follow-
samples were imaged on LeicaDM18 microscope at 100×.
ing day, 25 l of 50% slurry of pre-blocked agarose beads
Negative controls were included in each experiment, treated
(M2 anti-FLAG [Sigma, A2220] for G4-ChIP or Protein
identically but either without BG4 antibody incubation for
G Sepharose beads [GE Life Sciences, 17061802] for other
3 h or without anti-S9.6 antibody overnight.
ChIPs) and were incubated at 4◦ C on a rotator for 2 h. Beads
were centrifuged at 5000 rpm and washed sequentially twice
for each buffer for 5 min each: ChIP Wash Buffer A (0.1% C-circle assay
SDS, 1% Triton X-100, 2 mM EDTA, 20 mM Tris-HCl, pH C-circle assay (CCA) coupled with qPCR quantification
8, 150 mM NaCl), Wash Buffer B (0.1% SDS, 1% Triton X- was performed using a modified version of a published pro-
100, 2 mM EDTA, 20 mM Tris-HCl, pH 8, 500 mM NaCl), tocol (28). Cells were then harvested by scraping and cen-
Wash Buffer C (0.25 M LiCl, 1% NP-40, 1% sodium deoxy- trifugation. The cell pellets were then incubated at 56◦ C in
cholate, 1 mM EDTA, 10 mM Tris-HCl, pH 8) and TE (10 50 l of Quick C-circle Preparation (QCP) Buffer (50 mM
mM Tris-HCl, pH 8, 1 mM EDTA). The sample was incu- KCl, 10 mM Tris-HCl, 2 mM MgCl2 , 0.5% IGEPAL CA-
bated in 1% SDS/TE buffer at 65◦ C overnight to reverse the 630 detergent, 0.5% Tween-20) supplemented with fresh
crosslink and and DNA-purified with a DNA purification 1 mg/ml Proteinase K (Sigma) and vortex intermittently
kit (BioBasics) using the manufacturer ’s recommended pro- for 1 h. DNA from the lysate was then purified using col-
tocol. The extended protocol for ChIP-ReChIP and ChIP umn purification (BioBasic). The purified DNA was then
in nuclease-treated samples can be found in the Extended diluted 10× in elution buffer. About 10 l of the diluted
Methods (Supplementary File). material is added to 9.25 l of 2.16× CCA Buffer (fi-
nal reaction concentration of 4 mM DTT, 4 g/ml BSA,
0.1% Tween-20, 1 mM dATP, 1 mM dGTP, 1 mM dTTP,
Quantitative PCR for ChIP
1 mM dCTP, 1× phi29 buffer) and 0.75 L phi29 poly-
Telomeric DNA was quantified using real-time quan- merase (NEB). Two reaction tubes per sample were made:
titative PCR (q-PCR) on the BioRad Opticon 2. PCR one with phi29 polymerase added (Phi+) and one with-
reaction was set up using tel1b primer (5 -CGGTTTGT out (Phi-). Samples were incubated at 30◦ C for 8 h then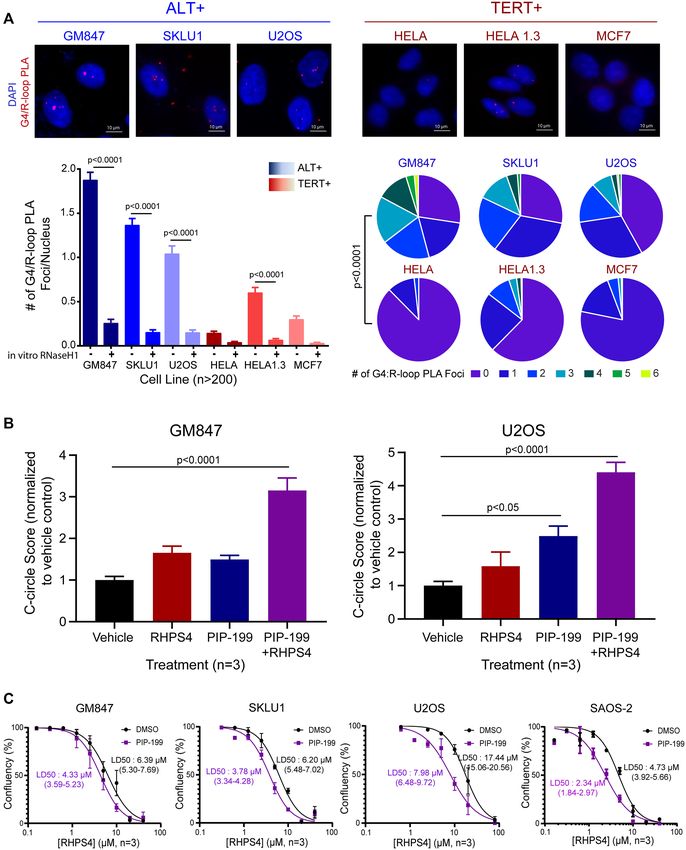
4 NAR Cancer, 2021, Vol. 3, No. 3
70◦ C for 20 min. Real-time qPCR was performed using for 5 min each. Fluoromount G was used to mount a clean
the Tel1b/Tel2b primer pair. The ratio of Phi+/Phi- signal coverslip to the slide.
was calculated for the raw CCA signal. Real-time qPCR
was performed on a single-copy gene, ACTB, with the
primer pair (forward: CTGGAACGGTGAAGGTGACA, Statistical analysis
reverse: AAGGGACTTCCTGTAACAACGCA) and used Statistical analysis of the comparison between ALT+ and
quantified for input differences. The raw CCA signals were TERT+ cell lines was performed using Student’s t-test on
normalized between samples using ACTB. aggregated datasets from multiple cell lines. One-way or
two-way ANOVA with multiple-test corrections was per-
Cytotoxicity profiling formed for comparison between conditions. All statistical
analyses were performed using GraphPad Prism. All error
Downloaded from https://academic.oup.com/narcancer/article/3/3/zcab031/6325203 by guest on 29 September 2021
Cytotoxicity screening of ligands was performed as previ- bars represent SEM unless otherwise specified.
ously described (29). Cells were seeded at 3000–6000 cells
per well in a 96-well plate and were grown for 24 h. Cells
were then treated with varying doses of ligands. The plate RESULTS
was then inserted in the Incucyte ZOOM Live-cell Imag-
G4s are elevated in the nucleus of ALT+ cells compared to
ing System (Essen Bioscience) and imaged at 3 h intervals
TERT+ cells
for 72 h. Phase confluency was measured for each well over
the period and exported into numerical values. The conflu- The ALT status of different cell lines was confirmed by
ency values were then normalized per experiment. Dose– measuring the absolute or relative telomere lengths with
response curves were then plotted using GraphPad Prism. telomere restriction fragment (TRF) analysis or quanti-
tative PCR, respectively, and examining PML levels by
immunocytochemistry (ICC) (Supplementary Figure S1).
Immunohistochemistry (IHC) staining using BG4
These analyses classified four ALT+ (i.e. exhibiting longer
FFPE slides were first deparaffinized by immersing in twice telomeres and more PML bodies) and four TERT+ cell lines
in Xylene (Sigma) for 10 min each. The slides were then im- for further experiments. We also added HELA1.3, a HELA
mersed in 100% ethanol twice for 10 min each, followed by variant that is also a TERT+ cell line with telomere length
95% ethanol for 5 min, 70% ethanol for 5 min and 50% for comparable to those observed in ALT+ cell lines. While R-
5 min. The slides were rinsed with dH2 O and rehydrated loop’s importance in ALT has previously been implicated
with PBS. A short antigen retrieval step was included by through studies into the roles of R-loop-modifying factors
immersing the slides in preheated citrate buffer at 95◦ C for such as RNaseH1 (22) and FANCM (23), quantitative im-
2 min. The slides were then cooled and rinsed with dH2O, munofluorescence imaging detection and direct comparison
followed by PBS. For brief permeabilization, the slides were in multiple cell lines are lacking. To study this, we performed
immersed in 0.2% Triton-X/PBS for 5 min. The staining ICC using the R-loop targeting antibody, S9.6 (30), in the
areas on the tissue slides were circled using a hydropho- panel of confirmed ALT+ and TERT+ cell lines. Antibody
bic marker. Blocking buffer (4% BSA/TBS) was dropped specificity was tested using RNaseH digestion (Supplemen-
to the areas of interest and incubated at room temperature tary Figure S2). We observed a higher number of large-sized
for 1 h. Then, the slides were drained, and BG4 antibody nuclear S9.6 foci in ALT+ cells than TERT+ cells (Supple-
(final concentration: 5 g/ml) in blocking buffer was added mentary Figure S3); however, the foci intensity remained
to each slide and incubated for 2.5 h. The slides were washed similar. We became interested in examining the levels of
three times in PBS-T for 5 min each. Anti-FLAG antibody G4s, which are structurally compatible structures with R-
(Sigma) (final concentration: 3 g/ml) was added to slides loops, to determine whether their levels are similarly higher
and incubated overnight at 4C in a humidified chamber. The in ALT+ than TERT+ cell lines.
slides were washed three times in PBS-T for 10 min each. We next performed ICC staining of an expanded panel
The secondary antibody, AF-594 (Thermos) (final concen- of ALT+ and TERT+ cell lines using the G4-specific anti-
tration: 2 g/ml), was added to the slides and incubated for body, BG4 (31). The BG4 antibody was validated through
1.5 h. The slides were washed three times in PBS-T for 10 testing G4 ligand-induced increases in foci (Supplementary
min each. The slides were counterstained with DAPI for 5 Figure S2). We observed qualitative and quantitative differ-
min and washed twice in PBS for 5 min each. Flouromount ences between the nuclei of ALT+ and TERT+ cells (Figure
G was used to mount a clean coverslip to the slide. 1A). Notably, similar to that of R-loops, we determined that
a higher number of large G4 foci and an increase in these
foci’s intensity were associated with ALT+ cells compared
IHC using Naptho-Template assembled synthetic G-quartet
to TERT+ cells (Figure 1B). Quantification of the signals
(N-TASQ) probe
outside the large foci (i.e. signals from small foci) and the
The deparaffinization steps were performed the same as broad nuclear signals (i.e. sum of all nuclear signals) were
described above. The slides were blocked with a blocking also revealed to be higher in ALT+ cells (Figure 1C and D).
buffer for 30 min. The slides were drained, and N-TASQ While the identities of these large foci (or nuclear bodies)
in blocking buffer (final concentration: 40 M) was added were unclear, we hypothesized that telomeres could be a sig-
to each slide and incubated for 1 h. The slides were washed nificant contributor to these signals due to the longer ALT+
three times in PBS-T for 10 min each. The slides were coun- telomere track being reservoirs of abundant G4-forming se-
terstained with DAPI for 5 min and washed twice in PBS quences.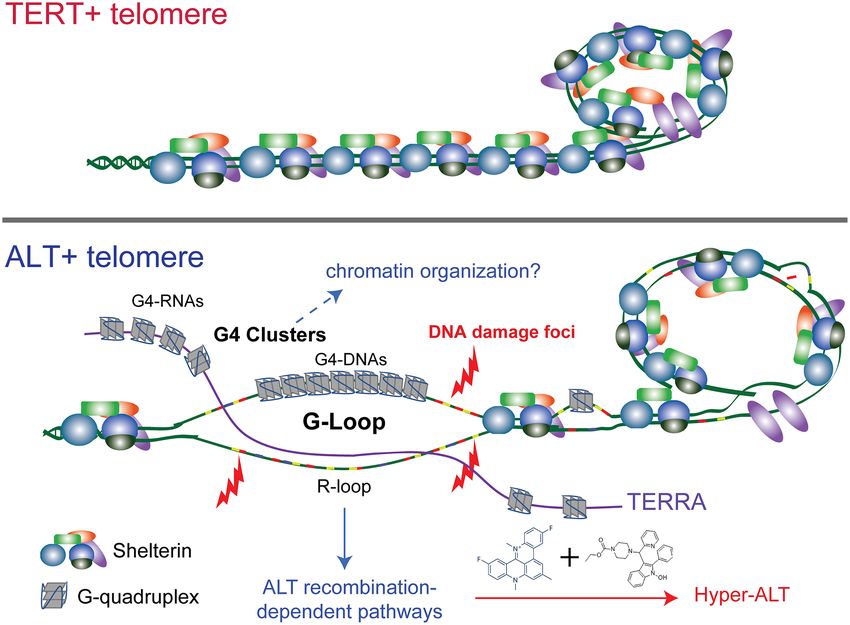
NAR Cancer, 2021, Vol. 3, No. 3 5

                                                                                                                                                               Downloaded from https://academic.oup.com/narcancer/article/3/3/zcab031/6325203 by guest on 29 September 2021
Figure 1. ALT+ cells harbour higher level of G4s than TERT+ cells. (A) Immunocytochemistry (ICC) straining experiments for G4 in ALT+ cells lines
(within blue frame) versus TERT+ (within red frame) (B) Mean large G4 foci count (top) and foci intensity (bottom) of G4 foci per nucleus. (C) Mean
small G4 foci count per nucleus as quantified. (D) Mean G4 total nuclear intensity per nucleus as quantified. Automated quantification of 100 cells per cell
line was performed in parallel. Two-tailed t-tests were performed for comparing ALT+ versus TERT+ groups. Error bars represent the SEM.

Telomeric G4 and R-loop levels are correlated with telomere                      cell lines and calculated Tel/Alu ratios to measure the level
length in ALT+ cells and associated with DNA damage sig-                         of telomeric localization. Both G4-ChIP and R-loop-ChIP
nals                                                                             showed higher Tel/Alu ChIP ratios in ALT+ compared to
                                                                                 TERT+ cell lines. Additionally, we separately plotted the
Some G4 and R-loop foci from our analyses appeared to
                                                                                 Tel/Alu ratios derived from G4-ChIP or R-loop-ChIP ex-
resemble the large telomere foci widely seen in ALT+ cells
                                                                                 periments against each cell line’s corresponding telomere
in multiple previous studies (3,4,32). While a limited num-
                                                                                 length. Linear regression plot of G4-ChIP signals against
ber of reports on R-loop formation in ALT telomere ex-
                                                                                 telomere length showed a strong positive correlation be-
ists, G4 formation in ALT telomere has been unexplored.
                                                                                 tween the two variables (R2 = 0.96) (Figure 2A and B). Like-
We reasoned that the observed increases in G4 foci num-
                                                                                 wise, R-loop-ChIP displayed a similar pattern (R2 = 0.97).
ber and intensity could represent long clusters of telomeric
                                                                                 We repeated the linear regression analyses with the addition
G4s. To probe whether telomere accounts for some of the
                                                                                 of data from HELA1.3, a long-telomere TERT+ cell line.
nuclear signals, we performed co-staining ICC experiments
                                                                                 Notably, HELA1.3 was a clear outliner in the linear regres-
for G4 with an antibody against Telomeric Repeat Bind-
                                                                                 sion plots (Figure 2A and B, red line). Accordingly, after
ing Factor 2 (TRF2), a member of the shelterin telomere-
                                                                                 the addition of HELA1.3 to the analyses, the coefficients
binding protein complex. It is also noteworthy that canon-
                                                                                 of determination (R2 ) were significantly decreased for both
ical repeats are interspersed within the ALT telomere and
                                                                                 TelG4 (R2 = 0.42) and TelR-loop (R2 = 0.11). Thus, we con-
that shelterin proteins still associate with the degenerate re-
                                                                                 cluded that while TelG4 and TelR-loop levels are highly cor-
peats at ALT telomere but to a lesser extent. Thus, TRF2
                                                                                 relative with telomere length, a longer telomere length does
clusters are expected within ALT cells. We found a high de-
                                                                                 not fully explain the magnitude of TelG4 and TelR-loop sig-
gree of nuclear colocalization, as evidenced by the increase
                                                                                 nals in ALT+ cells.
in threshold overlap score (TOS) when shifting the thresh-
                                                                                    ALT+ telomere harbours elevated levels of endogenous
old towards the top 10 percentile of pixels by intensity (Sup-
                                                                                 DNA damage signals (12), and these damage signals may
plementary Figure S4).
                                                                                 present initiation signals for recombination-based repair.
   For robust quantification of telomeric G4s and R-
                                                                                 To probe whether TelG4s could be involved in the in-
loops, we performed chromatin-immunoprecipitation cou-
                                                                                 creased DNA damage signals, we first performed ChIP
pled with real-time quantitative polymerase chain reaction
                                                                                 for the DNA damage response (DDR) marker, ␥ H2AX,
(ChIP-qPCR) assay. We chose to focus on five cell lines
                                                                                 and confirmed higher telomere-enriched signals of DNA
within the panel with varying telomere lengths. We used Alu
                                                                                 damage in ALT+ cells compared to TERT+ cells, as well
repeats as a genome background control between different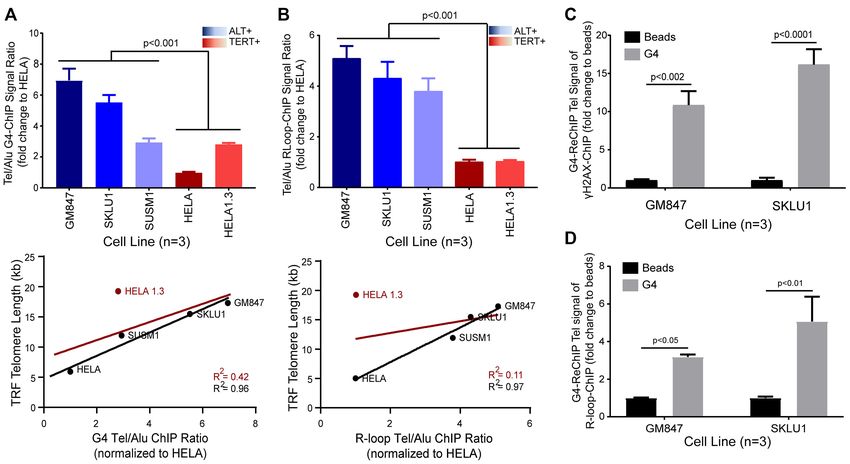
6 NAR Cancer, 2021, Vol. 3, No. 3

                                                                                                                                                          Downloaded from https://academic.oup.com/narcancer/article/3/3/zcab031/6325203 by guest on 29 September 2021
Figure 2. Levels of telomeric G4s and R-loops are higher in ALT+ cells and are broadly associated with telomere length and coupled with DNA damage
signals. (A and B) Top; (A) G4-ChIP assay or (B) R-loop-ChIP assay in ALT+ cell lines (blue shades) versus TERT+ cell lines (red shades). Data shown
are the means from three biological repeat experiments. T-test (two-tailed) was performed for the combined ALT+ versus TERT+ datasets. Bottom; linear
regression plot of Tel/Alu ChIP signal ratio against telomere length (as measured by telomere restriction fragment (TRF) analysis). Line of best fit is
plotted along with R2 values with HELA1.3 (red) or without HELA1.3 (black). (C) ChIP-Re-ChIP (␥ H2AX-G4) and quantified for telomeric DNA (Tel
DNA) in ALT+ cells, GM847 and SKLU1. The ReChIP signal for each sample was then normalized to its respective beads only control. Two-way ANOVA
with Sidak multiple correction was performed. Data shown are the means from three biological repeat experiments. Error bars represent the SEM. (D)
ChIP-ReChIP (first ChIP for R-loop followed by second ChIP for G4) and quantified for Tel DNA in ALT+ cells, GM847 and SKLU1. ReChIP signal
for each sample was then normalized to its respective beads only control. Two-way ANOVA with Sidak multiple correction was performed. Data shown
are the means from three biological repeat experiments. Error bars represent the SEM.

as a strong positive correlation with telomere length (R2                     Telomeric G4s and R-loops are interdependent in ALT+ cells
= 0.91) (Supplementary Figure S5). To demonstrate that                        Given the elevated levels of both TelG4s and TelR-loops in
the increases in telomeric DNA damage signals are closely                     ALT+ cells, as well as the mechanistic plausibility of their
associated with G4 formation, we performed the ChIP-                          co-formation, we examined whether these two structures
ReChIP assay, a sequential ChIP using ␥ H2AX antibody                         can affect each other’s formation or stability. To study the
in the first ChIP followed by Re-ChIP of the eluate with                      effect of R-loop changes on G4 abundance, we targeted bio-
the BG4 antibody in the second ChIP reaction and sub-                         logical pathways responsible for R-loop resolutions. Telom-
sequent quantification using qPCR (Figure 2C). The an-                        eric R-loops are resolved mainly in cells by RNaseH1 (22)
tibody order was chosen based on ReChIP compatibility                         and FANCM (23). We first overexpressed recombinant
screening of the antibodies in which BG4 was found to be                      GFP-tagged RNaseH1 in GM847 ALT+ cells to reduce the
more tolerant of the rigorous ReChIP procedure and thus                       cellular levels of R-loops. ICC staining for G4s in GM847
applied for the second ChIP. ReChIP enrichment of telom-                      overexpressing RNaseH1 showed decreased G4 levels com-
eric DNA signals over beads-only control in both ALT+                         pared to those seen in control GFP-overexpressing cells
cell lines, GM847 and SKLU1, indicated close proximity                        (Figure 3A). Using ChIP, we observed parallel reductions of
(within approximately 500 bp, the median ChIP sonicated                       TelG4 and TelR-loops upon overexpression with RNaseH1
chromatin length) between telomeric G4s and DNA dam-                          (Figure 3B).
age signals. The similar telomere-length associated ChIP                         We also tested whether changes in G4s can affect R-loop
signal pattern for G4 and R-loop suggested that these struc-                  accumulation. Treatment with G4 ligands, small molecules
tures may also be situated closely. To confirm this assertion,                that can bind and increase the stability of G4s, is a well-
we performed ICC co-staining for G4 and R-loop, which                         established method to study G4-related biological changes.
showed strong colocalization between these structures in                      We used sub-lethal doses of RHPS4, a pentacyclic acri-
multiple ALT+ cell lines (Supplementary Figure S6). Im-                       dine G4 ligand, which can target a multitude of G4s, in-
portantly, ChIP-ReChIP experiments showed that G4 and                         cluding those within the telomeres (33). ICC staining ex-
R-loop structures are also co-enriched at the ALT telomere                    periments revealed significantly increased R-loops in ALT+
(Figure 2D).                                                                  cells treated with RHPS4 (Figure 3C). In addition, we tested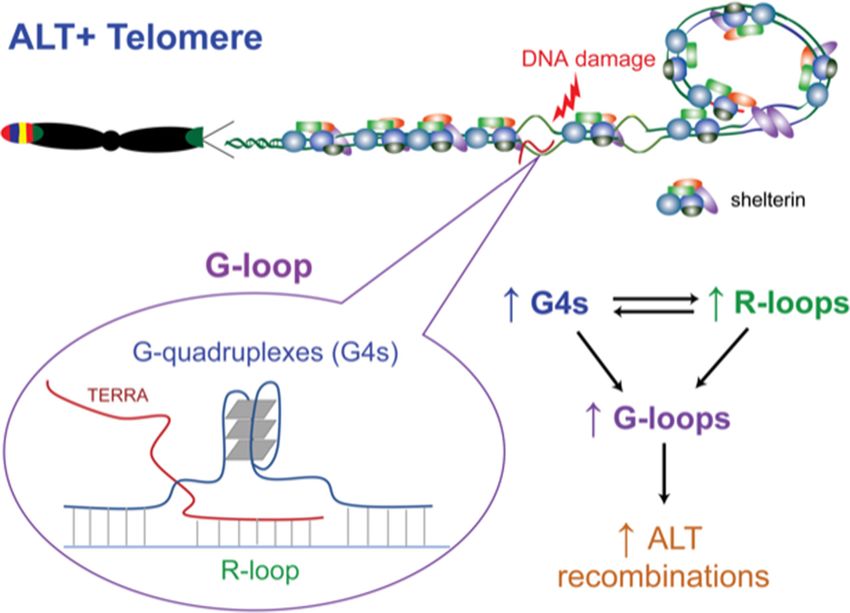
NAR Cancer, 2021, Vol. 3, No. 3 7
Downloaded from https://academic.oup.com/narcancer/article/3/3/zcab031/6325203 by guest on 29 September 2021
Figure 3. G4s and R-loops are interdependent. (A) ICC staining for GFP (green) and G4 (red) in GM847 transfected with GFP-vector control (within
orange frame) or GFP-RNaseH1 (within green frame). Right, Quantification of GFP+ cells for mean BG4 foci count per nucleus. T-test (two-tailed)
was performed. (B) G4-ChIP or R-loop-ChIP results from GM847 transfected with either GFP-vector or GFP-RNaseH1. Tel/Alu ChIP signals were
then normalized against GFP-vector control. Data shown are the mean from three biological repeat experiments. Two-way ANOVA with Sidak multiple
comparisons was performed. Error bars represent the SEM. (C) Left, R-loop ICC staining (green) in ALT+ cell lines (GM847, SKLU1, U2OS) treated with
vehicle or G4 ligand, RHPS4 (1, 1.5 and 5 M, respectively). Mean R-loop foci count (center) and intensity (right) per nucleus were quantified. About 100
cells per treatment were quantified. Two-way ANOVA with Sidak-corrected multiple comparisons was performed against the untreated controls. (D) G4
ICC staining (red) in GM847 with vehicle or R-loop inducer, PIP-199 0.75 M. A total of 50 cells per treatment were quantified. T-test (two-tailed) was
performed. (E) G4-ChIP or R-loop-ChIP of GM847 treated with vehicle, 0.75 M PIP-199 or 1 M RHPS4. ChIP signal was first normalized to input then
the Tel/Alu ratio calculated for each condition was then normalized against that of the vehicle control. Data shown are the mean from three biological
repeat experiments. Two-way ANOVA with Sidak-corrected multiple comparisons was performed against the vehicle control. Error bars represent the
SEM.
the effects of a newly identified small-molecule telomeric ity. ICC staining experiments revealed PIP-199-induced in-
R-loop inducer, PIP-199, which indirectly increases R-loop creases in G4 levels in ALT+ cells (Figure 3D). We per-
accumulation through the inhibition of MM2-RMI1/2 in- formed parallel ChIP experiments to quantify the levels of
teractions that disrupts the formation of the FANCM- TelG4 and TelR-loop in the vehicle-, PIP-199- and RHPS4-
BTR (BLM-TOP3-RMI1) complex (34). PIP-199 is not treated GM847 ALT+ cells. Treatments with both chem-
known to directly affect BLM helicase activity or G4 sta- icals showed significant and parallel increases in G4 and
bility but instead breaks the cooperation of the FANCM R-loop levels, with PIP-199 (R-loop inducer) displaying a
and BTR complexes which have R-loop dissolution activ- parallel 1.5–2 fold increases in TelR-loop and correspond-8 NAR Cancer, 2021, Vol. 3, No. 3
ing TelG4, and RHPS4 (G4 ligand) displaying a parallel 3–4 ments, and the co-treatment with both agents resulted in
fold increases in TelG4 and corresponding TelR-loop (Fig- the highest increase in CCA scores. These data suggest that
ure 3E). Thus, we showed that both positive (using PIP-199) an increase in TelG4 and TelR-loop levels positively cor-
and negative changes (using RNaseH1) in TelR-loop lev- relates with ALT activity and that stabilization of the two
els induced corresponding changes in TelG4 stability in the linked structures induces ALT beyond a simple additive ef-
same direction. Together, our ICC and ChIP experiments fect (GM847: +70% versus +220%; U2OS: +200% versus
quantitatively showed that the two telomeric structures are 350%). Conversely, HELA 1.3 did not display any signifi-
interdependent. cant changes to CCA scores after any combination of treat-
ments, confirming that the ALT status rather than telomere
length was driving the effects (Supplementary Figure S9).
Telomeric G4s and R-loops form G-loops to stimulate ALT
While we observed a synergistic increase in ALT activ-
activity cooperatively
Downloaded from https://academic.oup.com/narcancer/article/3/3/zcab031/6325203 by guest on 29 September 2021
ity from increased Tel-G4 and Tel-R-loop levels, we antici-
Our observation of G4-R-loop interdependency suggested pated that over-accumulations of TelG4 and TelR-loop can
that they may form a linked structure, a G-loop, in which be cytotoxic and that targeting both structures at the same
G4 and R-loop form on opposing strands (35). To con- time could create synergism of cytotoxicity. We performed
firm colocalization, we performed ICC co-staining exper- a curve-shift analysis (36) on the dose–response curve for
iments for G4 and R-loop and observed highly colocalized cytotoxicity of RHPS4 in four ALT+ cell lines, with or
nuclear staining, as illustrated by the TOS increase when without co-treatment with a previously determined sub-
examining the top 10 percentile of pixels by intensity (Sup- lethal dose (lethal dose [LD] of 5–15%) of PIP-199. Dose–
plementary Figure S6). We employed the proximity ligation response curves showed a leftward shift of the normalized
assay (PLA) with BG4 and S9.6 antibodies to probe for RHPS4 cytotoxicity dose–response curve after the addition
high-resolution colocalization of G4s and R-loops within of a sub-lethal dose of PIP-199 in all four ALT+ cell lines:
the nanometer range. We observed a significantly higher GM847 (LD50: 4.33 versus 6.39 M), SKLU1 (LD50: 3.78
number of G4:R-loop PLA signals, representing poten- versus 6.20 M), U2OS (LD50: 7.98 versus 17.44 M) and
tial G-loop formation sites, in ALT+ cells compared with SAOS-2 (LD50: 2.34 versus 4.73 M) (Figure 4C). These
TERT+ cells (Figure 4A). As controls, these PLA sig- results suggest that the drug-drug interaction is of syner-
nals were efficiently removed by in vitro RNaseH1 treat- gistic nature (leftward shift) rather than additive (expected
ment. Additionally, we evaluated G4:R-loop PLA signals minimal or no shift) or antagonistic (rightward shift) na-
in GM847 and U2OS ALT+ cells overexpressing RNaseH1 ture. Together, the observations support the view that com-
and showed significant reductions in PLA foci compared bination treatments of G4 and R-loop stabilizing chemicals
to those of the vector control (Supplementary Figure S7). may have therapeutic potential in the clinical management
Reciprocally, we used the siRNA-mediated knockdown of of ALT+ cancers.
FANCM to increase the cellular accumulation of R-loops.
We demonstrated significant increases in G4:R-loop PLA
Global nuclear G4 levels are higher in ALT+ (ATRX nega-
foci in GM847 and U2OS cells treated with FANCM-
tive) low-grade gliomas
siRNA compared to control-siRNA knockdown cells (Sup-
plementary Figure S7). Our observation of the significant difference between nu-
Since our combined results indicated higher endogenous clear G4 signals in ALT+ versus TERT+ cells suggested that
G-loop levels in ALT+ cells, we surmised that these unique G4 may be a feasible biomarker for differentiating between
combined structures could play a role in the ALT telom- cancers with different telomere maintenance methods. Un-
ere maintenance mechanism. To test this, we either single- like R-loops that requires both DNA and RNA in a hybrid
treated or co-treated GM847 and U2OS cells with a previ- structure, we speculated that the nuclear G4 signals could
ously determined sub-lethal dose of RHPS4 and PIP-199 be contributed by any combinations of G4-DNAs and G4-
(Supplementary Figure S8) to increase TelG4 and TelR- RNAs, given the higher level of both TERRA and telomeric
loop levels, respectively. After 24 h treatment, we measured DNA in ALT+ cells. To test this, we performed ChIP on
changes in c-circle levels, the most widely used and sensi- nuclease-digested samples. As expected, R-loop-ChIP sig-
tive ALT activity measure, using the rolling circle ampli- nals were RNaseH-sensitive, confirming that the majority
fication and qPCR method (28). The sensitivity of the C- of the signal represented DNA/RNA hybrids (Supplemen-
circle Assay (CCA)-qPCR method was demonstrated by tary Figure S10). Interestingly, for G4-ChIP, while the sig-
the significant increase of Tel DNA signals with the addi- nal appeared to be more DNAse-sensitive, RNase A treat-
tion of phi29 () polymerase (+Phi) to that of a mock reac- ment also resulted in decreases in the signal but to a lesser
tion control (-Phi) in ALT+ cells (∼10-fold in GM847 and extent (Supplementary Figure S10). We reasoned that due
∼6.5-fold in U2OS) compared to TERT+ cells (∼1.4-fold in to the amplified G4 signals contributed by both G4-DNAs
HELA 1.3) (Supplementary Figure S9). Single-agent treat- and G4-RNAs, detection of G4s could offer a more conve-
ments with G4 ligand or R-loop inducer induced a slight nient and sensitive approach to identifying ALT tumours
but reproducible increase in CCA score for GM847 ALT+ in clinical settings. To explore the feasibility of this idea,
cells, while the co-treatment significantly increased the CCA we performed immunohistochemistry (IHC) staining with
score to ∼3.2-fold (Figure 4B). U2OS ALT+ cells showed BG4 in low-grade glioma samples that are either ATRX-
a similar CCA score pattern, with a reproducible increase positive (ATRX+) or ATRX-negative (ATRX-) (Figure
in telomeric c-circles following RHPS4 single-agent treat- 5). Due to the high association between ATRX muta-
ments, a higher increase after PIP-199 single-agent treat- tion status and ALT status (12), we designated ATRX+ asNAR Cancer, 2021, Vol. 3, No. 3 9
Downloaded from https://academic.oup.com/narcancer/article/3/3/zcab031/6325203 by guest on 29 September 2021
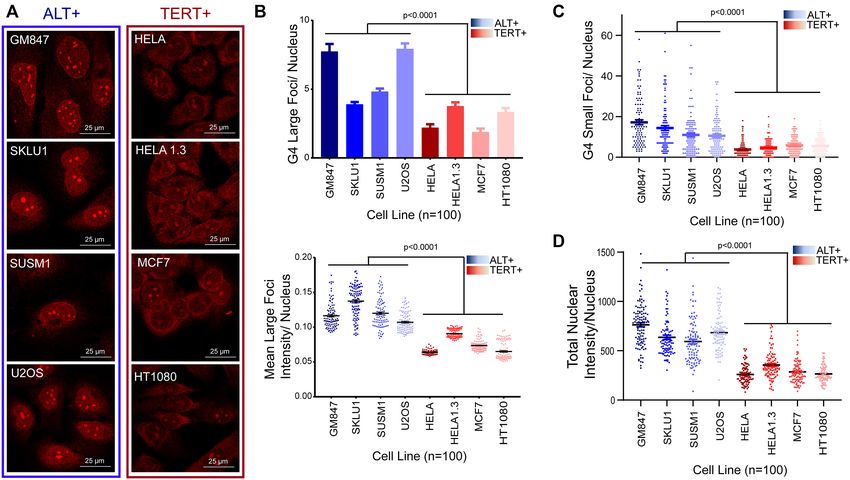
Figure 4. G4s and R-loops are spatially linked into G-loops at higher levels in ALT+ cells and cooperate to stimulate ALT activity. (A) Top, Proximity
ligation assay for G4/R-loop colocalization in a panel of ALT+ and TERT+ cell lines. Left, Quantification of the mean PLA foci per nucleus. 200 cells per
condition were quantified. In vitro RNAseH1 digestion was used as a control for each cell line. One-way ANOVA with Dunnett’s multiple test correction
was performed comparing non-treated samples and RNaseH1-treated samples. Right, Pie charts depicting the distribution of PLA foci per nucleus. T-test
(two-tailed) was performed for the combined set of ALT+ versus TERT+ cell lines. (B) C-circle assay (CCA) followed by qPCR in (Left) GM847 treated
with either vehicle (black), RHPS4 1.25 M (red), PIP-199 0.37 M (blue) or cotreated with both RHPS4 and PIP-199 (purple) (Right) U2OS treated with
either vehicle (black), RHPS4 5 M (red), PIP-199 0.37 M (blue) or cotreated with both RHPS4 and PIP-199 (purple). C-circle score from quantifying Tel
DNA ratio between the presence and absence of phi polymerase was first normalized to single copy gene then normalized to the vehicle control. One-way
ANOVA with Dunnett’s multiple test correction was performed. Data were collected from three biological repeat experiments. (C) Curve-shift analysis in
ALT+ cells, GM847, SKLU1, U2OS and SAOS-2. RHPS4 cytotoxicity dose response curve was generated with treatment of either DMSO vehicle control
or a nontoxic dose of PIP199 (0.75, 3, 0.75 and 1.5 M, respectively) for each cell line. The LD50, dose kills half of the cell population, was calculated with
95% confidence intervals for each condition per cell line, from data collected in three biological repeat experiments. Error bars represent the SEM.10 NAR Cancer, 2021, Vol. 3, No. 3
Downloaded from https://academic.oup.com/narcancer/article/3/3/zcab031/6325203 by guest on 29 September 2021
Figure 5. Nuclear G4s mark highly probable ALT+ low-grade glioma tumours. (A) IHC staining using BG4 (top) or N-TASQ (bottom) in ALT+ or
TERT+ low-grade glioma patient tumour samples as typed by ATRX status. (B) Quantification of staining scores (BG4 score or N-TASQ score) for each
matched probable ALT+ or TERT+ samples. (C) Average staining scores for the ALT+ (n = 29) versus TERT+ (n = 10) groups. T-test (two-tailed) was
performed. (D) Linear regression plot for BG4 score against N-TASQ score. Each point represents a tumour sample. The black line represents the line of
the best fit (R = 0.66).
probable TERT+ and ATRX- as probable ALT+. As an al- tibody and the N-TASQ probe (Figure 5B and C). Linear
ternative approach to BG4 staining, we used a G4-specific regression analysis between BG4 and N-TASQ of matched
probe, Naptho-Template Assembled Synthetic G-quartet samples revealed a moderate correlation (R = 0.66) between
(N-TASQ) for a more robust analysis (37). The red-edge the two G4-specific tools, demonstrating the reproducibility
nature of N-TASQ also allows for a quicker staining pro- with different labelling approaches (Figure 5D).
tocol that uses one-step staining rather than the multi-
step labelling protocol used for the BG4 antibody (37).
DISCUSSION
We first confirmed that the ICC staining using N-TASQ
in ALT+ cell lines showed similar patterns as those ob- The requirement of persistent DNA damage for ALT telom-
tained with BG4 (Supplementary Figure S11). Primary low- ere maintenance initiation implicates the presence of special
grade glioma tumour samples (n = 39, 10 ATRX+ samples structural conditions at the telomeric chromatin. We pro-
and 29 ATRX- samples) stored as formalin-fixed paraffin- pose that the formation of non-canonical nucleic acid struc-
embedded (FFPE) slides were first deparaffinized before tures could establish an environment conducive to ALT re-
staining. We performed IHC staining in parallel with ei- combination. While recent reports have demonstrated R-
ther BG4 or N-TASQ (Figure 5 and Supplementary Fig- loops’ involvement, the roles of G4s in ALT are less cer-
ure S12). DAPI signal was used to generate masks for cellu- tain. Our imaging data reveal significant differences in the
lar nuclei. Due to the variable autofluorescence background nuclear G4 levels between ALT+ and TERT+ cell lines
between samples, we normalized the BG4 signal (in the red (Figure 1). We quantitatively show that the telomere ac-
channel) against the background (in the green channel). On counts for a large portion of the elevated G4 signal in ALT+
the other hand, such normalization would not be possible cells, which are broadly associated with telomere length and
for N-TASQ due to its red-edge nature (38), where the N- DNA double-strand break (DSB) markers (Figure 2). We
TASQ signals could be detected in all channels. Thus, we also demonstrate that G4s and R-loops positively influence
used the channel with the lowest background (red) for the each other’s stability and suggest that they are likely to be
quantification of N-TASQ. In agreement with our hypoth- linked as unique structures in the form of G-loops (Fig-
esis, we observed a significant difference in global G4 levels ures 3 and 4). Additionally, we show that G-loop levels
between the two groups of samples using both the BG4 an- are higher in ALT+ cells and that small molecule-mediatedNAR Cancer, 2021, Vol. 3, No. 3 11
stabilization of both G4 and R-loop can cooperatively en- types, manifested in excessive increases in ALT features and
hance ALT activity at sub-lethal doses and synergistically accumulation of toxic recombination intermediates (Figure
cause cytotoxicity at higher doses (Figure 4). Finally, due to 6). A consideration for future ALT-targeted therapies may
the amplified G4 signals in ALT+ cells, we further provide include targeting multiple components within the G-loops.
the proof-of-principle of using G4s as sensitive markers for Our findings add credence to the newly proposed connec-
differentiating between ALT+ and TERT+ glioma tumour tions between G4s and R-loops (44–46). We have shown
samples (Figure 5). We suggest that G4s are both actionable using proximity-ligation and genetic/pharmacological ma-
ALT biomarkers and exploitable therapeutic targets. nipulations that G4s and R-loops are likely to be interacting
An often-unexplained phenomenon is the source of in- with each other as G-loops. While our cytotoxicity screen-
creased endogenous DNA damage levels present in ALT+ ing and ALT activity output are complementary, they are
cancers. While DNA damage is detrimental to growth and not directly proportional. Thus, we expect that other tar-
Downloaded from https://academic.oup.com/narcancer/article/3/3/zcab031/6325203 by guest on 29 September 2021
proliferation in most cases, ALT+ cancer may present an gets may also be affected. We anticipate this G4/R-loop re-
exception in which an elevated baseline level of DNA dam- lationship can be extended beyond the telomere to G-rich
age is required to facilitate telomere maintenance by recom- regions in the rest of the genome and impact other im-
bination. We contend that the formation of unique nucleic portant homeostatic processes in human biology. Biologi-
acid structures could be critical in sustaining this higher cal processes, including transcription, replication and chro-
level of DNA damage in ALT+ cancers. Additionally, re- matin structure remodelling, are potentially conducive to
cent studies suggest that ATRX may be involved in regu- transient G-loops formation. Thus, our findings provide in-
lating the stability of non-canonical nucleic acid structures, centives to study G-loops at other genomic loci to under-
including R-loops (39) and G4s (40). Given that ATRX dys- stand the coordinated stabilization of R-loops and G4 and
function is widely observed in ALT+ cancers, mutations dis- their roles in other biological pathways.
rupting ATRX may be the most common and efficient way In addition to the mechanistic connection between G4s,
in which ALT+ cells enhance the formation or stability of R-loop and ALT telomere, we also emphasize a G4-centric
these non-canonical nucleic acid structures. Based on our marker for ALT status. We suggest that the detection of
observations, we have built a model supporting the exis- G4s is a better method for imaging-based ALT status dif-
tence of increased G4s and R-loops in ALT+ cancers. Prox- ferentiation (ALT-calling) due to the abundance of G4
imal formation of G4s and R-loops can lead to the assem- signals. As a result of ALT-promoting genetic/epigenetics
bly of G-loops, which are more effective than either one modifying events, we suggest that there may be a global
of the two structures on their own to promote the contex- change in the steady-state levels of G4s. Developing ALT-
tual environment required for ALT maintenance by keep- calling methods using the abundant G4 signals may be
ing a larger and more stable opened chromatin conforma- more convenient and reliable than currently implemented
tion (Figure 6). We reason that both structures’ coexis- methods. Current molecular diagnostics for testing for
tence may reduce the energy threshold required to keep a ALT status include telomere length measurement (TRF,
more favourable chromatin state for the formation of spon- Q-FISH, TelPCR, sequencing), absence of telomerase ac-
taneous DSB DNA damage (Figure 6). However, the re- tivity (TRAP), c-circle quantification, TERRA measure-
sulting potential overabundance of DNA damage, which ments (northern blot) and ATRX/DAXX expression (IHC,
could cause negative consequences on cells, would require Western, sequencing) (47). All of these methods are labour-
tight regulation through specific helicase activities. Recent intensive and/or require large amounts of tumour mate-
studies have emphasized the FANCM-BTR complex (34) rials. Likewise, the multi-step protocol for BG4-based G4
as a key regulator of ALT homeostasis, which may have detection takes a longer time (1–2 days) to implement. In
evolved to process both G4s (by BLM in the BTR complex) contrast, the one-step N-TASQ-based G4 detection dras-
(41) and R-loops (by FANCM) (23) within G-loops. In ad- tically cuts the processing time to under 2 h. Despite the
dition to promoting spontaneous DNA damage for ALT- spectral limitations of N-TASQ, it has proven to be a viable
BIR mechanisms, there is also an intriguing possibility that tool for labelling clinical samples, with comparable results
large G-loops can promote enhanced accessibility, facilitat- as BG4 and a strong correlation to ATRX mutation sta-
ing telomere clustering in the intertelomeric recombination tus (Figure 5). To our knowledge, our findings represent the
ALT pathway (19). only comparison to date between different imaging-based
Based on our cytotoxicity screens using a combination G4 detection methods (antibody versus chemical probes) in
of G4 ligand and R-loop inducer, we propose that TelG- a set of clinical samples. The relatively high concordance
loops may also be valuable therapeutic targets for ALT+ between the two methods validates G4s as the likely targets
cancers (Figure 4C). The use of G4 ligands in the treatment in these imaging results. In anticipation of screening a more
of ALT+ cancers has been proposed earlier (15,42,43). Our extensive clinical cohort, we expect that it is also possible
results suggest that G4 ligand-induced cytotoxicity is, at to scale these G4-specific tools for tissue microarrays to in-
least partially, due to the targeting of telomeric G4s. In addi- crease throughput.
tion to confirming the cytotoxic potential of targeting G4s, A closer examination of our imaging results reveals accu-
our data demonstrate the feasibility of inducing R-loop for- mulations of both larger and smaller G4 foci in the ALT+
mation simultaneously with G4 stabilization for synergis- cell nuclei. Based on our ICC colocalization and ChIP re-
tic purposes in future clinical applications for ALT+ can- sults, we reason that a significant portion of these large foci
cers. The enhanced ALT activity we have observed after co- may be clusters of telomeric G4s. While G4-DNAs form on
stabilization of G4 and R-loop (Figure 4B) suggests that ob- the displaced telomeric DNA strand within the G-loop, the
served cytotoxicity is likely due in part to hyper-ALT pheno- free single-stranded ends of TERRAs may also be folded12 NAR Cancer, 2021, Vol. 3, No. 3
Downloaded from https://academic.oup.com/narcancer/article/3/3/zcab031/6325203 by guest on 29 September 2021
Figure 6. Proposed model of G-quadruplex formation in ALT. At the TERT+ telomere, there are proper shelterin binding and proper telomere structure.
Telomere capping function is intact. At the ALT+ telomere, ALT-promoting events, including chromatin remodeler dysfunction (i.e. ATRX), long telomere
tract with degenerate repeats, and reduced shelterin binding, contribute to a less compacted chromatin and dysfunctional telomere structure. This provides
the opportunity for the formation of G4s and/or R-loops. TERRA (purple) associate with the C-rich telomere strand to form R-loop. The other displaced
strand harbours long G-rich regions which associate with each other to form a stretch of G4s. The cooperative actions of G4 and R-loop leads to further
opening with increased stability of the R-loops and G4s leading to the formation of the G-loop. The actions of endonuclease at the opening of G-loop
leads to double-strand break which facilities the initiation of ALT-associated recombination-based repair mechanisms. Stabilization of G-loops through
treatments with G4-ligands and R-loop inducers drive the cancer cell to a hyper-ALT state, manifested in excessive increases in ALT features and accu-
mulation of toxic recombination intermediates. Other potential G4 structures at the ALT telomere include the G4 clusters, contributed by both G4-DNAs
formed in telomeric DNAs and G4-RNAs formed in associated TERRAs. The roles of these G4 clusters are unclear but may participate in ALT-specific
chromatin organization.
into G4-RNAs. This occurrence would conceivably result tion to the factors mentioned above, another potential G4-
in clusters of G4 signals, termed G4 clusters, contributed promoting event may result from changes in the genome se-
by a combination of both G4-DNAs and G4-RNAs. We quences. Strikingly, a recent study examining whole genome
reason that this may explain the amplified signals seen for sequencing data from tumour samples reported a signifi-
G4s in ALT+ cells. While staining in other structures such cantly higher number of insertions of telomeric repeats in
as nucleoli or ALT-associated PML bodies cannot be ruled extra-telomeric regions in ALT+ cells (51). It has also been
out as partially responsible for some of these signals, we proposed previously that aberrant recruitment of NR2C/F
emphasize that the telomere is likely a significant contrib- orphan nuclear transcription factors in ALT facilitates the
utor, which our ChIP-qPCR data confirms. Only recently telomere tethering with other genomic sites and the sub-
have studies began to shed light on the natures of some of sequent formation of telomere insertions (TTIs) (52). The
these ALT-associated nuclear bodies. Notably, reports have existence of these TTIs has heavy implications on the for-
revealed that these large foci may be nuclear condensates mation of de novo G4s since every unit of a telomeric re-
resulting from the telomere clustering, a phenomenon that peat contains a G-tract (triple G repeat). Depending on the
is thought to promote the ALT recombination mechanisms surrounding sequences, insertions of one or more G-tracts
(42,48). Thus, we have opted to focus our analyses on telom- could potentially allow the formation of a G4 that other-
eric regions for our study. wise would not have been able to due to the sequence re-
While we suggest a role of G4s in stimulating ALT-based quirement. Thus, ALT+ cells, in addition to having the ex-
mechanisms, it remains unclear why we also observed global pansion of pG4s at the telomere, may also harbour pG4 ex-
upregulation of G4 levels. As alluded to earlier, some addi- pansions throughout the genome. This phenomenon raises
tional signals may be attributed to G4-RNAs and the ALT- an intriguing possibility of using G4s to track the evolution
specific chromatin environment. Given the widespread dis- of ALT over time, where a long duration of ALT could in-
tribution of potential G4-forming sequences in the human duce more ALT-mediated ‘G4 genomic scars’. The existence
genome (49), it is conceivable that ALT-promoting mech- of extra-telomeric G4s may also explain some ALT+ cancer
anisms would lead to elevated steady-state levels of G4s at cells’ vulnerability to G4 ligands treatments. Future studies
other genomic regions as well. Notably, recent studies have in understanding the full spectrum of these targets would be
revealed that ATRX-mutated cancers harbour ribosomal informative in expanding potential ALT-targeted therapies.
DNA (rDNA) instability (50), suggesting a role for ATRX While the variations in the IHC staining for gliomas
in suppressing genomic instability at the nucleoli. In addi- may be attributed to tissue sample preparations and theYou can also read