Platinum dissolution and tissue response following long-term electrical stimulation at high charge densities
←
→
Page content transcription
If your browser does not render page correctly, please read the page content below
Journal of Neural Engineering

PAPER • OPEN ACCESS

Platinum dissolution and tissue response following long-term electrical
stimulation at high charge densities
To cite this article: Robert K Shepherd et al 2021 J. Neural Eng. 18 036021

View the article online for updates and enhancements.

                               This content was downloaded from IP address 46.4.80.155 on 22/09/2021 at 22:43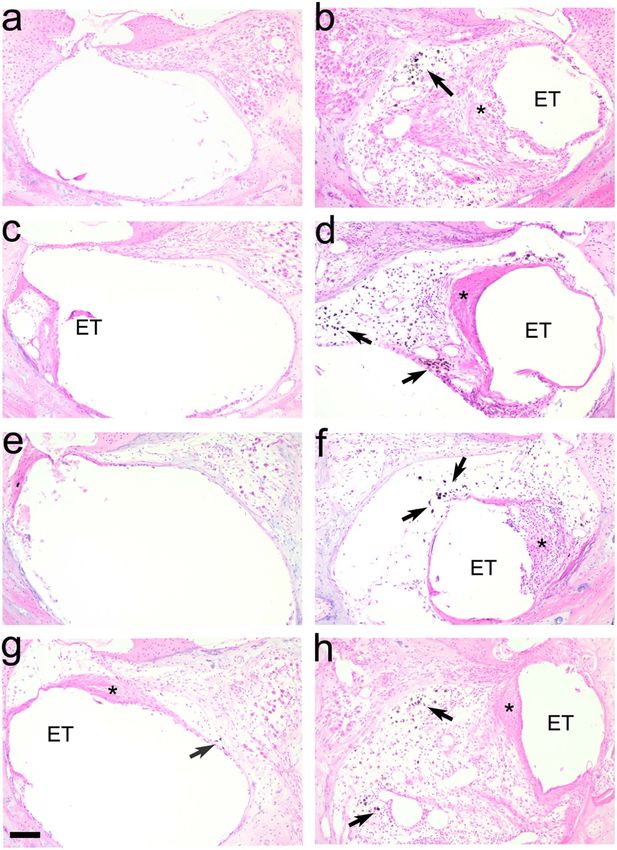
J. Neural Eng. 18 (2021) 036021 https://doi.org/10.1088/1741-2552/abe5ba
Journal of Neural Engineering
PAPER
Platinum dissolution and tissue response following long-term
OPEN ACCESS
electrical stimulation at high charge densities
RECEIVED
30 September 2020 Robert K Shepherd1,2,∗, Paul M Carter3, Ashley N Dalrymple1,4, Ya Lang Enke3, Andrew K Wise1,2,
REVISED Trung Nguyen1, James Firth1, Alex Thompson1 and James B Fallon1,2
11 January 2021
1
ACCEPTED FOR PUBLICATION
Bionics Institute, St Vincent’s Hospital, Melbourne, Australia
2
12 February 2021 Medical Bionics Department, University of Melbourne, Melbourne, Australia
3
Cochlear Ltd, Sydney, Australia
PUBLISHED 4
17 March 2021 Department of Mechanical Engineering, Carnegie Mellon University, Pittsburgh, PA, United States of America
∗
Author to whom any correspondence should be addressed.
Original content from E-mail: rshepherd@bionicsinstitute.org
this work may be used
under the terms of the Keywords: electrical stimulation, neural prosthesis, platinum, electrode, stimulation safety, corrosion, cochlear implant, neurotechnology
Creative Commons
Attribution 4.0 licence. Supplementary material for this article is available online
Any further distribution
of this work must
maintain attribution to
the author(s) and the title Abstract
of the work, journal
citation and DOI.
Objective. Established guidelines for safe levels of electrical stimulation for neural prostheses are
based on a limited range of the stimulus parameters used clinically. Recent studies have reported
particulate platinum (Pt) associated with long-term clinical use of these devices, highlighting the
need for more carefully defined safety limits. We previously reported no adverse effects of Pt
corrosion products in the cochleae of guinea pigs following 4 weeks of electrical stimulation using
charge densities far greater than the published safe limits for cochlear implants. The present study
examines the histopathological effects of Pt within the cochlea following continuous stimulation at
a charge density well above the defined safe limits for periods up to 6 months. Approach. Six cats
were bilaterally implanted with Pt electrode arrays and unilaterally stimulated using charge
balanced current pulses at a charge density of 267 µC cm−2 phase−1 using a tripolar electrode
configuration. Electrochemical measurements were made throughout the implant duration and
evoked potentials recorded at the outset and on completion of the stimulation program. Cochleae
were examined histologically for particulate Pt, tissue response, and auditory nerve survival;
electrodes were examined for surface corrosion; and cochlea, brain, kidney, and liver tissue
analysed for trace levels of Pt. Main results. Chronic stimulation resulted in both a significant
increase in tissue response and particulate Pt within the tissue capsule surrounding the electrode
array compared with implanted, unstimulated control cochleae. Importantly, there was no
stimulus-induced loss of auditory neurons (ANs) or increase in evoked potential thresholds.
Stimulated electrodes were significantly more corroded compared with unstimulated electrodes.
Trace analysis revealed Pt in both stimulated and control cochleae although significantly greater
levels were detected within stimulated cochleae. There was no evidence of Pt in brain or liver;
however, trace levels of Pt were recorded in the kidneys of two animals. Finally, increased charge
storage capacity and charge injection limit reflected the more extensive electrode corrosion
associated with stimulated electrodes. Significance. Long-term electrical stimulation of Pt
electrodes at a charge density well above existing safety limits and nearly an order of magnitude
higher than levels used clinically, does not adversely affect the AN population or reduce neural
function, despite a stimulus-induced tissue response and the accumulation of Pt corrosion
product. The mechanism resulting in Pt within the unstimulated cochlea is unclear, while the level
of Pt observed systemically following stimulation at these very high charge densities does not
appear to be of clinical significance.
© 2021 The Author(s). Published by IOP Publishing Ltd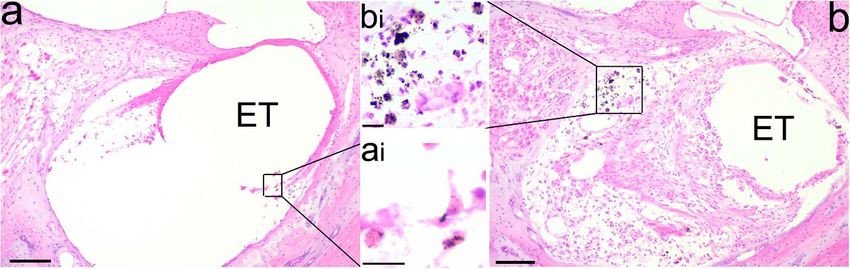
J. Neural Eng. 18 (2021) 036021                                                                    R K Shepherd et al

1. Introduction                                             Pt within the tissue capsule surrounding the electrode
                                                            array [16, 17]. Although the extent of the foreign body
Platinum (Pt) is regarded as a safe electrode material      response was also associated with stimulation at high
when used in combination with carefully controlled          charge densities, these studies concluded that there
charge-balanced current pulses operating within             were no adverse histopathological effects of Pt corro-
stimulus levels that allow charge injection via revers-     sion product on tissue within deafened cochleae.
ible Faradaic reactions [1, 2]. However, high charge            These previous studies were undertaken using
intensities can generate irreversible electrochemical       continuous stimulation for 4 weeks. The present
reactions including the hydrolysis of water, Pt dissolu-    study extends this work by using a deaf feline
tion and O2 reduction, altering the electrolyte envir-      model where both cochleae were implanted, and
onment adjacent to the electrode that may result in         the animals unilaterally stimulated using a tri-
both electrode corrosion and tissue damage [2–6].           polar electrode configuration at a charge density of
    There are useful guidelines defining the bound-         267 µC cm−2 phase−1 (k = 1.73) for periods of up
ary between damaging and non-damaging electrical            to 6 months. These stimulus parameters were selec-
stimulation for neural prostheses using Pt electrodes.      ted as they are above the maximum AAMI stand-
The ‘Shannon limit’ [7] was generated from acute            ard for cochlear implants [11], and are known to
stimulation studies using large surface area Pt elec-       result in significant corrosion of Pt electrodes [16]
trodes in direct contact with cortical neurons and          while being well tolerated in an awake, chronically
typically stimulated at 50 pulses per second (pps)          stimulated animal. We show that long-term stimula-
for ∼8 h [8]. This limit defines the maximum safe           tion of Pt electrodes at a charge density well above
relationship between charge density and charge per          the accepted safety limits induces a vigorous tissue
phase for neural prostheses given by the equation:          response and Pt corrosion within the cochlea, and
log(Q/A) = k − log(Q); where Q is the charge per            extensive corrosion of the surface of stimulated elec-
phase (µC per phase), A is the geometric surface            trodes. Increased charge storage capacity (CSC) and
area of the stimulating electrode (cm2 ), Q/A is the        charge injection limit (CIL) was associated with stim-
charge density per phase (µC cm−2 phase−1 ), and the        ulated electrodes. Despite these changes, there was
variable k within the range 1.5–1.85 [1, 2, 7]. How-        no evidence of a reduction in AN density or evoked-
ever, the stimulus parameters used to derive this rela-     potential threshold associated with the stimulation.
tionship represent a subset of the parameters used          Finally, we report trace levels of Pt in implanted,
by neural stimulators operating in a clinical setting       unstimulated control cochleae and in the kidney of
[9]. Important parameters, including stimulus rate,         chronically stimulated animals. The clinical implica-
near- versus far-field electrodes, duty cycle, electrode    tions of these findings are discussed.
material and the target neural population, will influ-
ence the boundary between safe and damaging elec-
                                                            2. Methods
trical stimulation [1, 9, 10]. In addition to the general
guidelines provided by the Shannon limit, the Asso-
                                                            2.1. Experimental subjects
ciation for the Advancement of Medical Instrument-
                                                            This study was performed using a total of six male
ation (AAMI) developed a standard for commercial
                                                            cats. All procedures were conducted with approval
cochlear implants that limits stimulation to a Shan-
                                                            from the Bionics Institute Animal Research and Ethics
non limit of k = 1.75, with a maximum charge density
                                                            Committee, and were performed in accordance with
of 216 µC cm−2 phase−1 [11].
                                                            the Australian Code of Practice for the Care and Use
    The need for more carefully defined safe stimula-
                                                            of Animals for Scientific Purposes (8th Edition, 2013)
tion limits specifically for cochlear implants was high-
                                                            and followed the principles of the US National Insti-
lighted by a series of clinical studies showing evidence
                                                            tutes of Health guidelines regarding the care and use
of particulate Pt within the tissue capsule surround-
                                                            of animals for experimental procedures.
ing the electrode array in the cochleae of patients that
were long-term cochlear implant users [12–15]. Some
of these reports also described an increased foreign        2.2. Deafening protocol
body response within the cochlea associated with the        Animals were deafened as neonates using daily sub-
particulate Pt [14, 15]. Little is known about the tox-     cutaneous injection of neomycin (neomycin tri-
icity to cochlear tissue, or the systemic distribution of   sulphate; 60 mg kg−1 ; subcutaneously [s.c.]) [18, 19].
these corrosion products in vivo.                           After 3 weeks of deafening each animal was anaes-
    Using a deafened guinea pig model of cochlear           thetised with 3%–4% isoflurane and 500 ml min−1
implantation, we recently demonstrated that chronic         oxygen, and maintained at 1%–2% isoflurane. Hear-
stimulation using stimulus parameters as high as            ing status was examined by recording the auditory
k = 2.0—well above the published guidelines—did             brainstem response (ABR). ABRs were recorded dif-
not result in loss of primary auditory neurons (ANs)        ferentially using subcutaneous electrodes (vertex pos-
[16, 17]. However, stimulation at these high charge         itive; neck negative and thorax ground) and responses
densities did produce significant levels of particulate     amplified, filtered, averaged, and displayed. If there

                                               2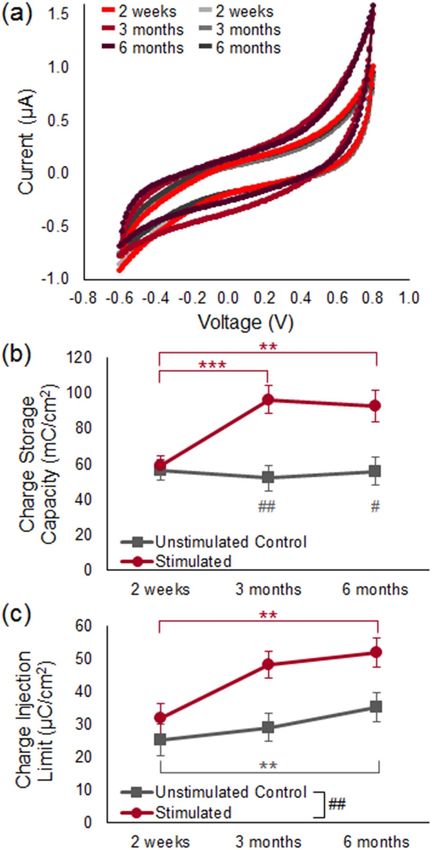
J. Neural Eng. 18 (2021) 036021                                                                   R K Shepherd et al

was evidence of hearing in response to a 100 µs dura-     of common ground impedances included electrodes
tion acoustic click at 100 dB peak-equivalent sound       with an impedance greater than 20 kΩ but less than
pressure level (p.e. SPL), the neomycin injections        50 kΩ.
were continued until no ABR response at this intens-
ity was evident.                                          2.6. In vivo electrochemical measurements
                                                          Electrochemical measurements were conducted on
2.3. Scala tympani electrode array                        both the stimulated and the unstimulated control
HL14 electrode arrays (Cochlear Ltd, Australia) were      electrode arrays. Electrochemical impedance spectro-
used in the present study [20]. Each array contained      scopy (EIS), cyclic voltammetry (CV), and CIL were
14 half-band Pt electrodes on a polydimethylsiloxane      recorded using the tripolar or bipolar configuration
(PDMS) silicone carrier. Each electrode had a sur-        based on electrode availability (see below), as a stand-
face area of 0.075 mm2 . Electrode 1 (E1) was the most    ard three-electrode cell recording configuration was
basal and electrode 14 (E14) the most apical electrode    not feasible in vivo. The centre-electrode of the tri-
on the array [21]. Each Pt electrode was connected        pole or dipole was used as the working electrode;
via a leadwire to a battery powered stimulator (details   for tripolar recordings, the flanking-electrodes were
below) located in a backpack.                             used as the counter electrode, and the reference elec-
                                                          trode was an unstimulated electrode on the array; for
2.4. Cochlear implant surgery                             bipolar recordings, the flanker-electrode was used as
Animals were bilaterally implanted at 8 weeks of age      the counter and reference electrodes combined.
using aseptic surgical techniques. Each animal was            The electrochemical measurements were made
pre-medicated with an intramuscular injection of          under general anaesthesia at three time points post-
Ketamine (10 mg kg−1 ) and Xylazine (1 mg kg−1 ),         implant: 2 weeks (i.e. before commencement of
and anaesthesia was maintained at a surgical level        the chronic stimulation program), 3 months, and
using a closed circuit anaesthetic machine (1%–2%         6 months. The impedance measurements were made
isoflurane and 500 ml min−1 oxygen). The bulla cav-       immediately following disconnection from the stim-
ity was opened, the round window incised and the          ulator, and the sequence and duration of the elec-
electrode array was inserted into the scala tympani       trochemical recordings were kept constant at each
to the lower middle turn [20]. The round window           time point to minimize variability due to the effects
was sealed with crushed muscle to prevent perilymph       of stimulation history as noted above ((a) com-
leakage. The leadwire was fixed at the bulla and          mon ground impedances (∼5 min, immediately after
on the skull, and then passed subcutaneously to           turning the stimulation off); (b) electrophysiological
exit the body through an incision over the scap-          recordings (∼50 min); (c) EIS then CV for each con-
ula. During surgery, the animal’s respiratory rate,       figuration (∼45 min); and (d) CIL (∼10 min)).
expired CO2 , and body temperature were monitored             EIS was measured using a potentiostat (Inter-
and maintained within normal levels (respiration          face 1000E, Gamry Instruments, USA). The fre-
rate 15–30; expired CO2 3%–5%; body temperature           quency values ranged from 100 to 100 000 Hz at 10
37 ± 1 ◦ C). An electrolyte solution (Hartmann’s solu-    points/decade and an AC voltage of 50 mV RMS. The
tion, 5–10 ml kg−1 h−1 , i.v.) and analgesic (Temgesic,   low frequency value was chosen to be 100 Hz to avoid
0.01 mg kg−1 , s.c.) were administered and a single       the possibility of DC-induced tissue damage that may
carprofen injection (4 mg kg−1 s.c) administered          occur at lower frequencies [23]. However, at 6 months
immediately post-operatively to provide 24 h of mild      post-implant, the low frequency value was extended
analgesia. Antibiotics (Clavulox 7 mg kg−1 , s.c.)        to 1 Hz since this recording was immediately preced-
were administered on the day of surgery then orally       ing termination.
(25 mg kg−1 ) for up to 21 d following surgery.               EIS data were fitted to an equivalent circuit
                                                          model to quantify the factors influencing the elec-
2.5. Electrode impedance                                  trode impedance throughout the chronic stimula-
Common ground electrode impedances measured               tion program [24, 25]. A common phase element
between the electrode of interest and the remaining       (CPE) was used to represent the capacitive behavior
electrodes on the cochlear array were recorded at least   of the impedance at the electrode–electrolyte inter-
weekly in awake animals using Custom Sound EP 5.1         face according to the following equation:
(Cochlear, Ltd, Australia). Because recent stimula-
                                                                                         K
tion history can influence electrode impedance [22],                          ZCPE =   (jω)α                    (1)
these measurements were made immediately follow-
ing disconnection from the stimulator. If any elec-       where K is the magnitude scaling factor, ω is the fre-
trode had an impedance value greater than 20 kΩ,          quency, and 0 < α < 1; where α = 0 indicates more
the electrode was considered open circuit and was no      resistive behavior and α = 1 indicates more capa-
longer used for stimulation. This prompted a change       citive behavior (figure 1) [25–27]. The impedance
in the stimulation electrode configuration from a tri-    of the tissue layer is represented by a modified Lap-
polar to a bipolar configuration. However, analysis       icque equivalent circuit model, which includes the

                                             3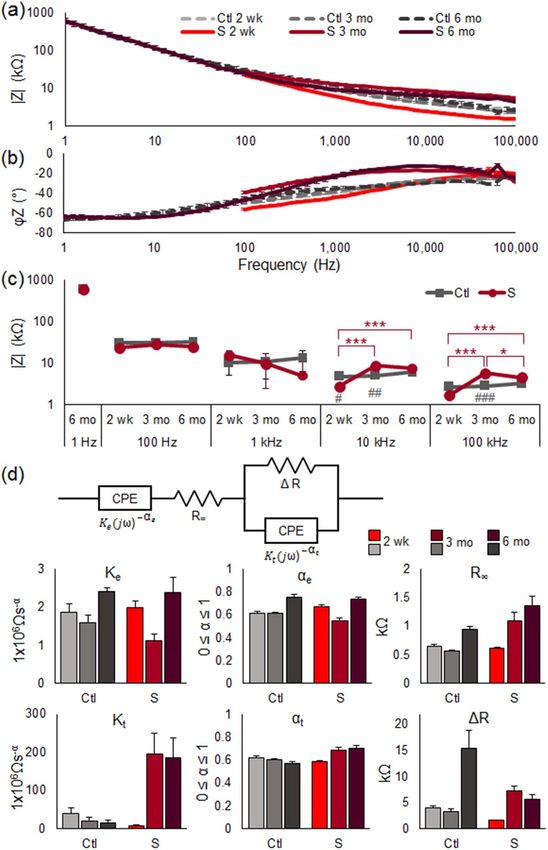
J. Neural Eng. 18 (2021) 036021                                                                          R K Shepherd et al

                                                                 statistically with responses recorded from the con-
                                                                 tralateral implanted/deafened control cochlea.

                                                                 2.8. Chronic stimulation program
                                                                 One cochlea in each animal was randomly selec-
                                                                 ted to be chronically stimulated while the contralat-
   Figure 1. Equivalent circuit model used to fit EIS data and   eral cochlea was unstimulated and therefore served
   model parameters.                                             as a control. Animals were stimulated continuously
                                                                 (24 h d−1 , 7 d per week) over an implantation period
                                                                 of up to 6 months (table 1).
resistance of the tissue layer at an infinite stimulation            The chronic stimulation program commenced
frequency (R∞ ) in series with a parallel combination            2 weeks following implant surgery immediately after
of a second CPE representing the tissue capacitance              recording the initial electrochemical measures under
and ∆R, where ∆R = (R0 − R∞ ) and R0 is the resist-              anaesthesia. Each animal was stimulated via a cus-
ance of the tissue layer at DC.                                  tom built back-pack stimulator [29] that delivered
    CV measurements were performed using the                     2 mA, 100 µs phase−1 charge balanced biphasic cur-
same potentiostat that was used for EIS. The elec-               rent pulses at 200 pps, developing 0.2 µC phase−1 .
trode potential cycled between the limits of −0.6 and            A tripolar electrode configuration was used as it
0.8 V with respect to the counter electrode at a sweep           allowed high charge levels to be used while main-
rate of 150 mV s−1 for five cycles. The CSC was com-             taining the percept within the animals’ comfortable
puted from the CV curves by first finding the average            loudness range [16]. A cathodic first phase current
of cycles 2 through 5, then integrating the total area           was delivered on the centre-electrode of the tripole
of the current over time and dividing by the electrode           while the two flanker-electrodes provided the return
geometric surface area.                                          path. All currents were then reversed in the second
    Finally, voltage transient waveforms were meas-              phase of the pulse. Charge-balance was achieved by
ured and used to compute the CIL of each electrode               shorting all electrodes between current pulses [30];
(USB-6353, National Instruments, USA). The CIL                   a technique we used previously in a shorter dura-
was calculated by analysing the voltage response to a            tion study [16]. Multiple (typically four) tripolar sites
series of biphasic, cathodic first current pulses, with a        were stimulated across the 14 electrodes on the array
pulse width of 100 µs and current amplitudes ranging             (table 1). Centre tripole electrodes generated charge
from 50 µA to 2 mA in steps of 50 µA. The maximum                densities of 267 µC cm−2 phase−1 while the flanker-
cathodal voltage (Emc) was determined by subtract-               electrodes developed approximately half this charge
ing the access voltage (Va) from the maximum negat-              density. This stimulus regime was used as we had
ive potential using a custom algorithm in Igor Version           previously demonstrated significant levels of Pt cor-
8.04 (WaveMetrics, Portland, OR, USA). The CIL was               rosion at this level [16]. In cases where stimulation
calculated using the current value just below the amp-           using a tripolar configuration was not possible, the
litude level that caused the Emc to surpass the cath-            stimulating electrodes were reconfigured to bipolar
odal limit of the water window (−0.6 V), up to a max-            electrodes and maintained the same charge density
imum of 2 mA [6, 28].                                            as in the tripolar configuration. Although the major-
                                                                 ity of the electrodes on a stimulated array under-
                                                                 went chronic stimulation there were always a num-
2.7 Electrically-evoked responses
                                                                 ber of electrodes that were not subject to stimulation
Electrically-evoked auditory nerve compound action
                                                                 (typically E1 & E2).
potentials (ECAPs) were used to monitor AN func-
tion. ECAPs were recorded in awake animals at both
the onset of stimulation and at termination using                2.9. Histology
neural response telemetry and Custom Sound EP                    On completion of the stimulation program all
2.0 software (Cochlear Ltd, Australia) [21]. ECAP                animals were euthanized with sodium pentobarbit-
recordings were obtained from electrodes on both the             one (300 mg kg−1 ; intraperitoneal) and systemically
chronically stimulated and control electrode arrays              perfused with heparinised normal saline at 37 ◦ C fol-
using 25 µs/phase biphasic pulses at 80 pulses s−1               lowed by 10% neutral buffered formalin at 4 ◦ C. Each
in a monopolar electrode configuration. Recordings               electrode array was removed for examination under a
were made from below threshold to a maximum                      scanning electron microscope (SEM; see below) and
of 1600 µA or the highest level that did not pro-                both the stimulated and contralateral control coch-
duce an aversive response using small intensity steps            leae postfixed, decalcified, frozen and sectioned at
(25–50 µA). ECAP threshold was defined as the low-               12 µm to the mid-point using a CM 1900 UV cryostat
est current amplitude required to evoke a clear ECAP             (Leica, Germany) at −22 ◦ C. The section plane used is
with an amplitude of at least 20 µV. Thresholds from             illustrated in figure 2. The remaining half of the coch-
each chronically stimulated cochlea were compared                lea was kept for trace analysis of Pt using inductively

                                                       4
J. Neural Eng. 18 (2021) 036021                                                                                      R K Shepherd et al

                                           Table 1. Summary of the cohorts used in this study.

                      Duration of               Centre-electrodea charge                                 Centre-electrodes for each
Animal ID         stimulation (weeks)          density (µC cm−2 phase−1 )        Stimulated side         tripoleb

HCD_1c                       7                                  267              Right                   TP4; TP7; TP10; TP13
HCD_2                       24                                  267              Right                   TP3; TP6, TP9; TP12
HCD_3                       24                                  267              Left                    TP4; TP7; TP10; TP13
HCD_4                       24                                  267              Right                   TP4; TP7; TP10; TP13
HCD_5                       24                                  267              Left                    TP3; TP6; TP9; TP12
HCD_6                       26                                  267              Right                   TP4; TP7; TP10; TP13
Notes:
a
  Throughout this publication charge density refers to that on the centre-electrode of the tripole unless otherwise stated.
b
  In cases where stimulation using a tripolar configuration was not possible, the stimulating electrodes were reconfigured to bipolar
electrodes. TP = tripole electrode.
c
  Stimulation program terminated early due to leadwire damage. No terminal impedance, electrochemical recordings or ECAPs were
made with this animal.

                                                                      observer blinded to the experimental cohorts. ANs
                                                                      were identified within Rosenthal’s canal and counted
                                                                      within the lower basal (LB), upper basal (UB), lower
                                                                      middle (LM), upper middle (UM) and the apical (A)
                                                                      cochlear regions [16, 31]. Only ANs exhibiting a clear
                                                                      nucleus were counted. The area of Rosenthal’s canal
                                                                      was measured using Image J software (version 1.52p)
                                                                      and the density of the ANs was determined. The AN
                                                                      density for each cochlear region was averaged from
                                                                      five sections that were spaced at least 72 µm apart,
                                                                      ensuring that no AN was counted more than once.
                                                                          In order to quantify the tissue response, the extent
                                                                      of fibrosis in the cochlea was measured in H&E
                                                                      stained sections at five locations along the electrode
                                                                      array (locations i–v; figure 2). An image of the scala
                                                                      tympani was captured and its area measured. The
                                                                      ‘Triangle’ algorithm in Image J was used to auto-
                                                                      matically threshold the image to quantify the tissue
                                                                      response [31]. The area of scala tympani excluding the
   Figure 2. (a) Schematic view looking down on the axis              area of the electrode array was measured and the pro-
   of the cochlea spiral illustrating the section plane and           portion of the scala tympani occupied by the tissue
   the approximate location of the electrode array within             response calculated.
   the cochlea. Electrode E1 [1] is the most basal electrode
   and E14 [14] the most apical electrode on the array                    In addition to quantifying the extent of the for-
   (location 1). Half the cochlea was sectioned in the plane          eign body response, the extent of any focal macro-
   depicted by the dotted red line. The purple dashed lines
   indicate the cochlear locations used for tissue analysis.
                                                                      phage response associated with the electrode-tissue
   This section plane provided histological examination of            capsule was assessed by measuring its thickness in the
   the tissue adjacent to the six most apical electrodes              section of each cochlea displaying the most extens-
   (E9–E14; cochlear locations ii, iii & iv). The second half
   of each cochlea (semi-shaded), included the tissue                 ive response [17]. Histological images were digitized
   adjacent to the most basal 8 electrodes (E1–E8), was               using a Zeiss AxioLab microscope and the zone thick-
   used for Pt analysis using ICP-MS. LB, lower basal; UB
   upper basal, LM, lower middle turns.
                                                                      ness measured using Image J software [16].
                                                                          All cochleae were examined for evidence of elec-
                                                                      trode insertion trauma. Histological sections were
                                                                      examined under a microscope by a researcher exper-
coupled plasma mass spectrometry (ICP-MS [16]; see                    ienced in cochlear histopathology. Insertion trauma
below).                                                               was identified by fracture of the osseous spiral lam-
     A representative series of cochlear sections were                ina and/or tears to the basilar membrane or the outer
stained with haematoxylin and eosin (H&E) for qual-                   cochlear wall. This form of trauma evokes a clear
itative examination [31]. AN density, and the tis-                    histopathological signature localized to the site of
sue response within the scala tympani, were quan-                     trauma, including a vigorous tissue response, neo-
tified and compared statistically with data from the                  osseogenesis, loss of ANs, and an increased acute
contralateral implanted unstimulated control coch-                    inflammatory response.
lea. ANs were quantified in mid-modiolar sections                         Each cochlea was also examined histologically for
using a Zeiss Axioplan microscope by a single                         the presence of particulate material [16]. The extent

                                                         5
J. Neural Eng. 18 (2021) 036021                                                                   R K Shepherd et al

of this material was qualitatively graded from 0 to 4      samples were micro filtered and analysed using an
(0, no evidence of particulate material in any section;    Agilent 7700X ICP-MS system. There was sufficient
1 possible particulate material present; 2, clear local-   brain, liver, and kidney tissue to perform two sets
ised particulate material present; 3, particulate mater-   of measurements per tissue sample and to perform
ial present in a number of sections; 4, widespread par-    an analysis on combined tissue samples across all six
ticulate material present).                                animals. Analysis of cochlear tissue was restricted to
                                                           a single measurement due to the limited size of the
2.10. SEM                                                  cochlear samples. Pt trace analysis was reported as the
Following removal from the cochlea, each electrode         mass of Pt per half cochlea or the mean mg/kg for
array was rinsed, ultrasonically cleaned in distilled      brain, liver, and kidney tissue.
water then stored in 70% ethanol. A small number
of electrode arrays required additional cleaning in        2.12. Statistical analysis
Enzol (diluted 1:40 for 1 h at room temperature; WPI       All statistical analysis was performed using SigmaPlot
Inc., USA) to remove coatings that had formed over         version 13.0 (Systat Software, Inc.). For all compar-
the electrode surface. All electrodes from both stim-      isons, the Shapiro–Wilk tested normality and the
ulated and control electrode arrays were examined          Brown–Forsythe tested the homogeneity of variance.
using a FEI QUANTA 200 SEM, photographed at                A p ⩽ 0.05 indicated significance for all statistical
low (×600) and medium (×2000) magnification. A             tests. The common ground impedances of control
region of each electrode surface was then randomly         electrodes (from the unstimulated control coch-
selected and photographed at higher magnifications         lear array), and unstimulated, flanker, and centre-
(×4000 and ×10 000). The surface condition of each         electrodes (from the chronically stimulated electrode
electrode was evaluated by an experienced investig-        array) were compared between the day that stim-
ator blinded to the experimental groups. The severity      ulation was turned on (2 weeks after surgery) and
of Pt corrosion was graded from 0 to 5 (0, no cor-         the final recorded impedances (prior to termina-
rosion; 1, no evidence of corrosion but electrode at       tion) using a two-way repeated measures (RM) ana-
least partially coated with organic material; 2, local-    lysis of variance (ANOVA). Two-way RM ANOVA
ized minor corrosion; 3, localized moderate corro-         was also used to compare the CSC, CIL, and EIS
sion; 4, widespread corrosion; 5, severe and extensive     at 100 Hz, 1 kHz, 10 kHz, and 100 kHz of elec-
corrosion) [16, 21, 32].                                   trodes from the stimulated arrays versus unstimu-
     Representative unstained cochlear sections from       lated arrays at 2 weeks, 3 months, and 6 months
both chronically stimulated and implanted, unstim-         post-surgery, as well as to compare the EIS equi-
ulated control cochleae were examined under the            valent circuit model parameters over time, and the
SEM to identify particulate matter observed within         tissue response in unstimulated and stimulated coch-
the fibrous tissue capsule of some cochleae. Specific      leae at various locations of the cochlea. If signific-
sites associated with the tissue capsule were selec-       ant, all pairwise comparisons were performed using
ted for elemental analysis using an INCA X-Act             the Holm–Sidak method. EIS at 1 Hz were recor-
SDD EDS system with an Oxford Aztec Microana-              ded only at 6 months and was compared between
lysis System (3.1). Regions of the fibrous tissue          electrodes from stimulated and unstimulated arrays
capsule containing the particulate material were           using the Welch’s t-test. A two-way RM ANOVA
compared with regions only containing fibrous              was used to compare ECAP thresholds from stimu-
tissue [16].                                               lated and control cochleae recorded at the onset and
                                                           on completion of the chronic stimulation program.
2.11. Trace analysis of Pt                                 Corrosion scores were correlated with stimulation
The un-sectioned half of each cochlea covering the         charge density using least squares regression. Tissue
region occupied by electrodes E1–E8 (figure 1) was         response, corrosion score, and final impedance were
measured for Pt using ICP-MS by the National Meas-         correlated using Pearson’s Product-Moment correl-
urement Institute of the Australian Government [16].       ation. Analysis of AN density were made by com-
Both the chronically stimulated and the contralat-         paring each region of the stimulated cochlea with
eral (control) cochleae were examined for trace Pt         its unstimulated control cochlea using a paired t-
using this technique. In addition to the cochleae, tis-    test. Finally, trace levels of Pt within cochlea were
sue samples from the brain, liver, and kidney of each      compared between stimulated and unstimulated con-
animal also underwent analysis for Pt.                     trols using Mann–Whitney Rank Sum Test. Data are
    Each tissue sample was washed and stored in de-        presented as mean and standard error of the mean
ionised water. The tissue was homogenized and diges-       (sem). All histological measurement (including AN
ted in re-distilled nitric acid and hydrochloric acid      survival, tissue response, thickness of the macrophage
(3:1) for 60 min in a DigiPrep block set (SCP Science)     zones and Particulate Pt), and SEM analysis of the Pt
at 95 ◦ C and transferred to a Milestone microwave         electrodes were performed using appropriate blinded
for 30 min to complete the digestion process. Liquid       techniques.

                                              6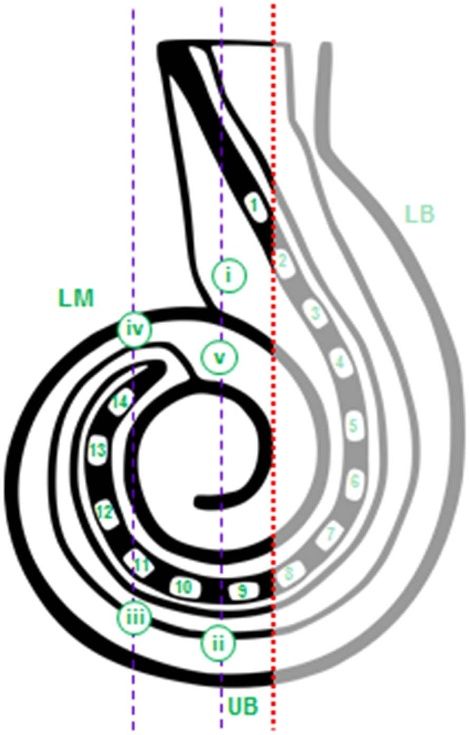
J. Neural Eng. 18 (2021) 036021                                                                                   R K Shepherd et al

   Figure 3. Common ground impedances measured throughout the stimulation program. Mean (±sem) impedances of control
   (from unstimulated array; double line), unstimulated (from stimulated array; short dashed), flanker (long dashed), and
   centre-electrodes (solid line). The impedances were smoothed by binning the values into 7 d increments and taking the mean of
   the impedances from each animal, then taking the group mean of the impedance from all animals. The shaded region indicates
   the sem in each bin.

3. Results                                                          have recordings from the 3 and 6 month time points.
                                                                    At 2 weeks, 3 months, and 6 months post-surgery,
3.1. Stimulation program                                            there were 18, 17, and 15 electrode configurations
Five out of the six animals were stimulated for                     recorded the from unstimulated control cochleae and
24–26 weeks. In one animal (HCD_1), the stimu-                      20, 15, and 12 electrode configurations recorded the
lation program was terminated at 7 weeks due to                     stimulated electrodes, respectively.
leadwire damage. During the stimulation program,                        The mean (±sem) magnitude and phase of the
electrode configurations required updating due to                   impedance from EIS are illustrated in figures 4(a) and
several electrodes exceeding 20 kΩ or below 1.2 kΩ.                 (b). Comparisons of the impedance magnitude over
At the 6 months post-surgery time point, 12 out of the              time at select frequency values are show in figure 4(c).
20 centre-electrodes (5 out of 6 cats) were no longer               The low-frequency spectra (1–100 Hz) were only
viable for stimulation or electrochemical recordings.               measured at the 6 month termination. The imped-
In instances where the centre-electrode was unavail-                ance magnitude at 1 Hz was not different between
able, a bipolar configuration was used for electro-                 stimulated (EIS1Hz_S = 605 ± 12 kΩ) and unstimu-
chemical recordings.                                                lated controls (EIS1Hz_Ctl = 600 ± 38 kΩ) electrodes
                                                                    (p = 0.97). At 100 Hz, the impedance magnitude of
3.2. Electrode impedance                                            stimulated electrodes (EIS100Hz_S = 25.1 ± 2.4 kΩ)
Common ground impedances for all control elec-                      was significantly lower than unstimulated control
trodes from the unstimulated array, and unstimu-                    electrodes (EIS100Hz_Ctl = 31.1 ± 2.2 kΩ) according
lated, flanker, and centre-electrodes from the stim-                to two-way RM ANOVA (p = 0.049) but not post-
ulated array were recorded immediately prior to the                 hoc tests (p = 0.071). The impedance magnitude
commencement of stimulation (2 weeks after sur-                     at 10 kHz increased and was significantly different
gery; n = 131), and were compared to the final                      over time for stimulated electrodes only (p < 0.001
impedances recorded on completion of each animal’s                  for 2 weeks [EIS10kHz_S2W = 2.7 ± 0.5 kΩ] com-
stimulation program for cats HCD_2 to HCD_6                         pared to 3 months [EIS10kHz_S3M = 8.7 ± 0.7 kΩ]
(n = 118; figure 3). There were no significant inter-               and 6 months [EIS10kHz_S6M = 7.2 ± 0.8 kΩ]).
action effects of time versus the stimulation charge                Furthermore, the impedance magnitude of stim-
density for each electrode (p = 0.311), nor was                     ulated electrodes was significantly different from
there an effect of time on the electrode impedances                 unstimulated control electrodes at 2 weeks and
(p = 0.06). However, control electrodes had a small                 3 months (p < 0.03; EIS10kHz_Ctl2W = 4.7 ± 0.5 kΩ;
but significant increase in impedance compared with                 EIS10kHz_Ctl3M = 5.0 ± 0.7 kΩ). The impedance mag-
flanker-electrodes (p < 0.001; Ctl = 12.6 ± 0.4 kΩ;                 nitude of stimulated electrodes at 100 kHz increased
F = 9.5 ± 0.5 kΩ). A moving average of the imped-                   with time, where significant differences were found
ances for control, unstimulated, flanker, and centre-               between 2 weeks (EIS100kHz_S2W = 1.7 ± 0.2 kΩ)
electrodes over the implant duration is shown in                    and 3 (EIS100kHz_S3M = 5.6 ± 0.3 kΩ) and 6
figure 3.                                                           (EIS10kHz_S6M = 4.5 ± 0.4 kΩ) months (p < 0.001).
                                                                    There was also a significant difference between 3
3.3. In vivo electrochemical measurement                            and 6 months (p = 0.032). Finally, stimulated elec-
Statistical comparisons for all electrochemical meas-               trodes were significantly different from unstimulated
ures excluded HCD_1 because this animal did not                     control electrodes at 3 months only (p < 0.001;

                                                     7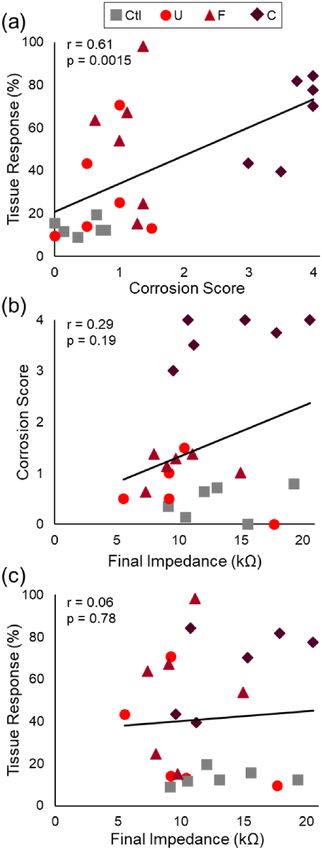
J. Neural Eng. 18 (2021) 036021                                                                                        R K Shepherd et al

   Figure 4. Mean (±sem) impedance (Z) magnitude (a) and phase (b) from EIS for unstimulated control (grey dashed) and
   stimulated (red solid) electrodes at 2 weeks, 3 months, and 6 months post-implantation plotted over the frequency range of
   1 Hz–100 kHz. (c) Comparison of impedance magnitude for unstimulated control (grey square) and stimulated (red circle)
   electrodes across various frequencies at 2 weeks, 3 months, and 6 months post-implantation. (d) Equivalent circuit model used to
   fit EIS data and model parameters at 2 weeks, 3 months, and 6 months post-implantation. ∗ significant difference for stimulated
   electrodes across different time points; #significant difference between stimulated and unstimulated values at that time point. ∗ or
   #p ⩽ 0.05, ∗∗ or ##p ⩽ 0.01, and ∗∗∗ or ###p ⩽ 0.001. S = stimulated; Ctl = unstimulated control. Note: statistical differences in
   (d) are not displayed for clarity.

EIS100kHz_Ctl3M = 2.8 ± 0.3 kΩ). All other comparis-                  was significantly different and higher than at
ons were not significant (p > 0.05).                                  3 months (K e3mo = 1.2 ± 0.2 1 × 10⁶ Ωs−α ;
    Equivalent circuit modelling of the EIS data                      p = 0.016) and the value at 3 months was sig-
was performed to help provide a physical basis                        nificantly different and lower than at 6 months
for the impedance behavior at each time point                         (K e6mo = 2.3 ± 0.2 1 × 10⁶ Ωs−α ; p = 0.007). αe
(figure 4(d)). The model chosen was the one determ-                   also only displayed a time effect where the value
ined by Lempka et al as the best fit from a range                     at 2 weeks (αe2wk = 0.64 ± 0.02) was significantly
of models investigated in their work [25]. K e and                    different from 3 (αe3mo = 0.57 ± 0.02; p = 0.009)
αe are components of the CPE for the electrode–                       and 6 months (αe3mo = 0.73 ± 0.02; p = 0.011),
electrolyte interface, and K t and αt are compon-                     and the value at 3 months was also different from
ents of the CPE for the tissue layer according to                     6 months (p < 0.001). R∞ did not have any inter-
equation (1) [26, 27]. R∞ and ∆R are the resist-                      action effects. Overall, the unstimulated control
ive components of the tissue layer at different fre-                  electrodes (R∞Ctl = 0.70 ± 0.08 kΩ) had a sig-
quencies. K e displayed a time effect only, where the                 nificantly lower R∞ than stimulated electrodes
value at 2 weeks (K e2wk = 2.0 ± 0.2 1 × 10⁶ Ωs−α )                   (R∞S = 1.01 ± 0.08 kΩ; p = 0.011). Additionally,

                                                        8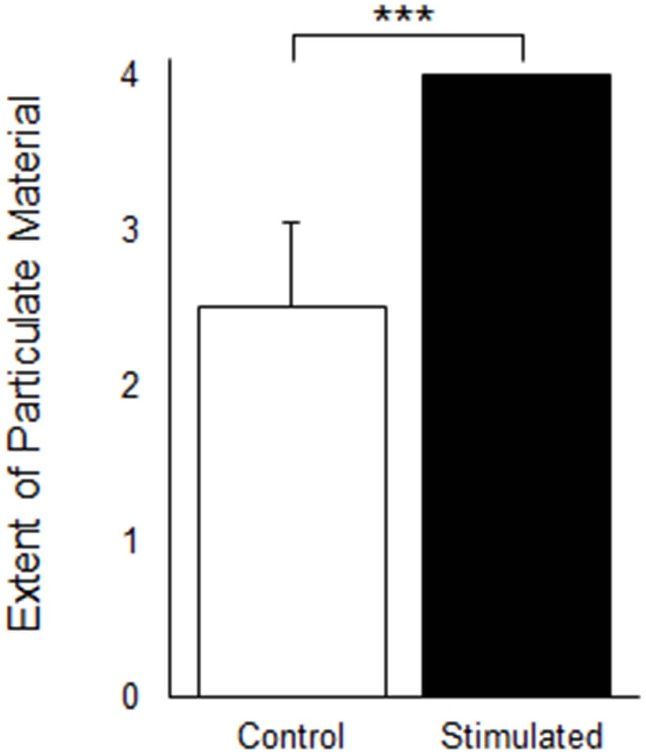
J. Neural Eng. 18 (2021) 036021                                                                                   R K Shepherd et al

   Figure 5. CSC and CIL. (a) Mean CV curves for stimulated (red) and unstimulated control (grey) electrodes at 2 weeks, 3 months,
   and 6 months post implantation. (b) Mean (±sem) CSC for unstimulated (grey square) and stimulated (red circle) electrodes at
   2 weeks, 3 months, and 6 months post implantation. (c) Mean (±sem) CIL for unstimulated (grey square) and stimulated (red
   circle) electrodes at 2 weeks, 3 months, and 6 months post implantation. ∗ Comparisons between indicated time points;
   #comparisons between unstimulated control and stimulated electrodes. ∗ or #p ⩽ 0.05, ∗∗ or ##p ⩽ 0.01, ∗∗∗ or ###p ⩽ 0.001.

R∞ at 2 weeks (R∞2wk = 0.63 ± 0.09 kΩ) at 3 months                  stimulated electrodes had a significantly higher K t
(R∞3mo = 0.78 ± 0.11 kΩ) were significantly lower                   than unstimulated controls at 3 (p = 0.026) and
than at 6 months (R∞6mo = 1.16 ± 0.12 kΩ;                           6 months (p = 0.061). At 6 months post-implantation
p = 0.003, 0.049, respectively). For stimulated elec-               (αtS6mo = 0.72 ± 0.04), αt was significantly higher
trodes, K t was significantly higher at 3 months                    than at 2 weeks (αtS2wk = 0.57 ± 0.03; p = 0.005)
(K tS3mo = 189.4 ± 50.1 1 × 10⁶ Ωs−α ) and 6 months                 and 3 months (αtS3mo = 0.70 ± 0.03; p = 0.003)
(K tS6mo = 186.5 ± 57.0 1 × 10⁶ Ωs−α ) compared                     for stimulated electrodes. Additionally, there was a
to 2 weeks (K tS2wk = 9.0 ± 1.9 1 × 10⁶ Ωs−α ;                      significant difference between unstimulated control
p = 0.009, 0.014, respectively). Furthermore,                       and stimulated electrodes at 3 (p = 0.036) and

                                                      9
J. Neural Eng. 18 (2021) 036021 R K Shepherd et al
(a) (b)
Figure 6. Mean (±sem) ECAP thresholds recorded at (a) onset of stimulation and (b) on completion of the stimulation program
for each of the 14 electrodes on the unstimulated control and chronically stimulated electrode arrays in this study. There was no
statistically significant difference in ECAP threshold between chronically stimulated and control cochleae at either the onset or on
completion of the stimulation program (onset: p = 0.82, n = 157; completion: p = 0.2, n = 78).
6 months (p = 0.009). Finally, ∆R for unstimulated CILS6M = 51.8 ± 4.5 µC cm−2 ; CILCtl2W = 25.2 ±
control electrodes had a large increase at 6 months 4.8 µC cm−2 ; CILCtl6M = 35.1 ± 4.4 µC cm−2 ;
(∆RU6mo = 15.2 ± 1.9 kΩ) that was significantly p = 0.005; figure 5(c)). Stimulated electrodes
higher than at 2 weeks (∆RU2wk = 4.2 ± 1.4 kΩ; had a larger CIL that was significantly dif-
p < 0.001) and 3 months (∆RU3mo = 4.7 ± 1.8 kΩ; ferent from the CIL of unstimulated con-
p < 0.001), as well as significantly higher than ∆R trol electrodes (CILS = 43.9 ± 3.4 µC cm−2 ;
for stimulated electrodes at 6 months (p = 0.015). CILCtl = 29.8 ± 3.4 µC cm−2 ; p = 0.006). There were
For stimulated electrodes, ∆R increased signific- no interaction effects of stimulation states (stimu-
antly at 3 (∆RS3mo = 7.7 ± 2.0 kΩ) and 6 months lated or unstimulated control) with time (p = 0.341);
(∆RS6mo = 7.9 ± 2.3 kΩ) compared to 2 weeks post- therefore, further pairwise comparisons were not
implantation (∆RU3mo = 1.5 ± 1.5 kΩ; p = 0.05, made.
0.045, respectively).
The mean CV curve for unstimulated control
3.4. Electrically-evoked responses
electrodes and stimulated electrodes at 2 weeks,
There was no statistically significant difference in
3 months, and 6 months is shown in figure 5(a).
ECAP threshold between chronically stimulated and
The CSC of unstimulated control electrodes
control cochleae at either the onset or on comple-
(CSCCtl = 54.7 ± 7.7 mC cm−2 ) did not signific-
tion of the stimulation program (figure 6). Further-
antly change over time (p > 0.95) and were similar
more, there was no significant interaction between
to the CSC of stimulated electrodes at 2 weeks—
electrode and side (p > 0.1), indicating the chronic-
prior to the stimulation program commencing
ally stimulated electrodes did not exhibit an increase
(CSCS2W = 58.6 ± 5.4 mC cm−2 ; p = 0.841;
in threshold. Finally, there was a significant effect of
figure 5(b)). The CSC of stimulated electrodes
electrode at first recording (p < 0.001), that just failed
increased significantly between 2 weeks and 3 months
significance at the last recording (p = 0.053); reflect-
(p < 0.001; CSCS3M = 96.2 ± 7.9 mC cm−2 ) and
ing the lower thresholds associated with more apic-
remained high at 6 months (CSCS6M = 92.7 ± 8.9
ally located electrodes due to the tapered nature of the
mC cm−2 ; p = 0.774 for comparison between
scala tympani [19].
3 and 6 months; p = 0.004 for comparison
between 2 weeks and 6 months). Additionally, the
CSC of stimulated electrodes significantly differed 3.5. Cochlear pathology
from unstimulated control electrodes at 3 months 3.5.1. General cochlear pathology
(CSCCtl3M = 52.0 ± 7.2 mC cm−2 ; p = 0.005) There was evidence of minor electrode insertion
and 6 months (CSCCtl6M = 55.8 ± 7.7 mC cm−2 ; trauma in the UB turn of three of the stimulated coch-
p = 0.031). leae in the present study (HCD_3, left; HCD_5, left;
For both stimulated and unstimulated control HCD_6, right); therefore, while the great majority of
electrodes, the CIL increased significantly between the tissue response reported here was associated with
2 weeks and 6 months (CILS2W = 31.7 ± 4.7 µC cm−2 ; the chronically implanted electrode array and/or the
10J. Neural Eng. 18 (2021) 036021 R K Shepherd et al
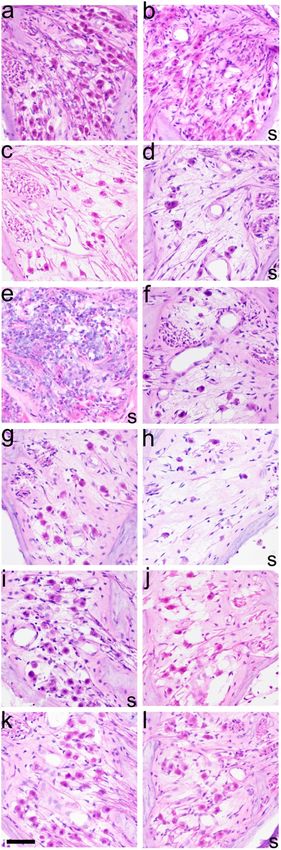
Figure 7. Representative micrographs illustrating the typical tissue response within the UB turn scala tympani of implanted
unstimulated control (left), and chronically stimulated cochleae (right). The control cochleae exhibited a relatively minimal tissue
response with some cochleae showing small amounts of particulate material within the scala tympani (arrow). In contrast, all
stimulated cochleae exhibited an extensive tissue response, including a zone of macrophages (∗ ) and clear evidence of particulate
material in the tissue response (arrows). (a) HCD_1 control; (b) HCD_1 stimulated; (c) HCD_2 control; (d) HCD_2 stimulated;
(e) HCD_4 control; (f) HCD_4 stimulated; (g) HCD_6 control; (h) HCD_6 stimulated. ET = electrode tract. Arrows show
examples of particulate material within the tissue capsule. Scale bar = 100 µm.
effects of electrical stimulation, in these cochleae loc- extensive tissue response was always evident in chron-
alized trauma also contributed to the response. ically stimulated cochleae. This typically took the
form of a thick, mature tissue capsule surrounding
3.5.2. Tissue response the electrode array forming an electrode tract (ET;
Figure 7 illustrates the typical tissue response e.g. figure 7(b)), with loose vascularized fibrous tis-
observed in the UB turn adjacent to the electrode sue occupying much of the remainder of the scala
array in both chronically implanted unstimulated tympani.
control, and chronically stimulated cochleae. Con- We quantified the tissue response in each chron-
trol cochleae exhibited a relatively minimal tissue ically implanted cochlea by measuring the area of the
response that usually included a fine tissue cap- tissue occupying the scala tympani in each of the five
sule surrounding the electrode array together with cochlear locations illustrated in figure 2 (n = 12 for
some loose areolar tissue (e.g. figure 7(g)). A more locations i, ii, and v; n = 6 for locations iii and iv; for
11J. Neural Eng. 18 (2021) 036021 R K Shepherd et al
Figure 8. Quantifying the tissue response to high charge density stimulation. Tissue response in specific cochlear locations,
illustrated in figure 2, for both stimulated and unstimulated control cochleae. Rounded bar indicates statistical comparison
between locations ii and iii versus i, iv, and v for stimulated cochleae. ∗ comparisons between unstimulated control and stimulated
cochlea at each location; #comparisons between the tissue response at locations ii and iii (inside rounded bar) and the other
locations for stimulated cochleae. ∗ or #p ⩽ 0.05, ∗∗ or ##p ⩽ 0.01, ∗∗∗ or ###p ⩽ 0.001.
both unstimulated control and stimulated cochleae). showed a trend towards an increased tissue response
The data demonstrated a significant difference in the in the stimulated cochlea compared to the unstimu-
level of tissue response associated with the chronic- lated cochlea.
ally stimulated cochlea compared to the implanted There was no evidence of necrosis associated with
unstimulated control (p < 0.05; figure 8). Although the Pt–tissue interface in either stimulated or control
there is variation due to orientation of the section cochleae. However, there was often a region of mac-
plane, electrode insertion distance, and cochlear ana- rophages located between the electrode array and the
tomy, cochlear locations can be generally related to mature fibrous tissue response (e.g. figure 7(h)). The
electrode position; location i is at the base of the coch- mean thickness of this zone was significantly greater
lea near the unstimulated electrodes E1 and E2; loca- in stimulated (86.7 ± 31.9 µm) than implanted con-
tion ii is near electrodes 9–10 and would be receiving trol cochleae (22.4 ± 36.2 µm; p = 0.03, n = 6).
stimulation; location iii is also near stimulating elec-
trodes (∼E11, E12); location iv is close to the most 3.5.3. AN survival
apical electrode (E14) and subject to reduced levels of Figure 9 illustrates the typical AN survival in the
stimulation; finally, location v is typically apical to the UB turn (i.e. in zones ii–iii adjacent to stimulating
electrode array. electrodes E9–E11) in the present study. The relat-
Implanted, unstimulated control cochleae did not ively low packing density of ANs, particularly animals
exhibit a significantly different tissue response across HCD_2-HCD_6 (figures 9(c)–(l)), reflects the long
the cochlear regions examined (p > 0.2; figure 8). duration between deafening and termination associ-
In stimulated cochleae, the most extensive tissue ated with the present study (>6 months). In contrast,
response was in location ii (66 ± 5.5% of area of animal HCD_1 (figures 9(a) and (b)) was deafened
the scala tympani; figure 8), and was significantly for a considerably shorter period (∼12 weeks) and
higher than locations i (p < 0.001), iv (p < 0.001), displayed greater AN survival in both cochleae.
and v (p < 0.001). The second largest tissue response There is close symmetry in AN survival between the
was associated with location iii (54 ± 12.9% of area of stimulated (figures 9(b), (d), (e), (h), (i) and (l))
the scala tympani; figure 8); this location also exhib- and the implanted, unstimulated control cochleae
ited significantly greater tissue response than loca- (figures 9(a), (c), (f), (g), (j) and (k)).
tions i (p = 0.012), iv (p = 0.003), and v (p < 0.001). Quantitative analysis of AN density showed close
Locations ii and iii are proximal to both flanker and bilateral symmetry of AN survival in all cochlear sec-
centre-electrodes, and would be the two sites sub- tors except for the apical region (figure 10; LB, n = 24
ject to the most extensive stimulation in this ana- & 29; UB, n = 29 & 30; LM, n = 29 & 30; UM,
lysis. The tissue response in locations i (p = 0.044), n = 25 & 27; A, n = 21 & 22, for implanted, unstim-
ii (p = 0.001), and iii (p = 0.006) were significantly ulated control and chronically stimulated cochlea
larger in the stimulated compared to the unstimulated respectively). Importantly, there was no statistic-
control cochleae; although, locations iv and v also ally significant difference in AN density between
12J. Neural Eng. 18 (2021) 036021 R K Shepherd et al
stimulated and control cochleae in the region of the
cochlea subject to electrical stimulation (i.e. LB, UB
& LM; figure 10). There was a significant difference in
AN density between stimulated and implanted con-
trol cochleae in the apical region (A turn; p < 0.001;
figure 10).
3.6. Electrode corrosion
Representative SEM micrographs from four chronic-
ally implanted unstimulated control and four chron-
ically stimulated electrodes illustrate the range of Pt
corrosion observed in the present study (figure 11).
Electrodes from implanted unstimulated control
arrays exhibited surface features associated with
their manufacture, including lines generated by the
laser during removal of the overlying PDMS (e.g.
figure 11(a)). Control electrodes from unstimulated
control arrays showed no evidence of corrosion
(grade 0; e.g. figures 11(a), (c), (e) and (g)); although,
some contained an assumed organic material on
their surface (grade 1; not illustrated). Unstimu-
lated electrodes on chronically stimulated electrode
arrays (e.g. E1 and E2) also showed no evidence of
Pt corrosion; however, a greater proportion of these
electrodes contained an organic coating (grade 1).
The majority of stimulated electrodes showed evid-
ence of Pt corrosion; the extent of the corrosion
was dependent on the electrode’s stimulation his-
tory. The majority of tripole centre-electrodes exhib-
ited widespread corrosion (grade 4; e.g. figures 11(d),
(f) and (h)); however, more localised corrosion was
sometimes observed (grade 3; e.g. figure 11(b)).
Flanker-electrodes, stimulated at approximately half
the charge density of centre-electrodes, showed less
Pt corrosion than centre-electrodes (typically grades
1–2; not illustrated). Finally, in a small number
of cases the Pt surface was covered with corrosion
products and/or tissue that required removal prior to
examination of the Pt surface (e.g. figure 11(d)). In
these examples the underlying Pt surface was typic-
ally corroded.
The SEM surface grading of the electrodes was
compared with their stimulation histories (figure 12).
There was a significant difference in the level of sur-
face corrosion across electrode groups (p < 0.001;
n = 84 control electrodes; n = 12 unstimulated elec-
trodes; n = 46 flanker electrodes; n = 21 centre
electrodes). There was a statistically significant
difference in corrosion grading between tripole
centre-electrodes (corrosion grade 3–4) versus elec-
Figure 9. Representative micrographs of Rosenthal’s canal
from the UB turn illustrating the extent of AN survival in trodes from unstimulated control arrays (grade 0–1;
the left ((a), (c), (e), (g), (i), (k)) and right ((b), (d), (f), p < 0.001), non-stimulated electrodes on chronically
(h), (j), (k), (l)) cochlea in the six animals in this study. stimulated arrays (grade 0–1; p < 0.001), and flanker-
HCD_1 (a), (b); HCD_2 (c), (d); HCD_3 (e), (f); HCD_4
(g), (h); HCD_5 (i), (j); HCD_6 (k), (l). The stimulated electrodes on chronically stimulated arrays (grade
cochlea in each animal is illustrated (s). Note the 1–2; p < 0.001). Flanker-electrodes showed a signi-
inflammatory response in cochlea HCD_3 left (5e) was
associated with electrode insertion trauma at that location.
ficant difference to control electrodes (p < 0.001);
Scale bar = 100 µm. although were not significantly different to unstimu-
lated electrodes (p = 0.24).
13J. Neural Eng. 18 (2021) 036021 R K Shepherd et al
Figure 10. Mean AN (+sem) density for both the stimulated and the unstimulated control cochleae across the six animals in this
study. There was no significant difference in AN density between stimulated and unstimulated control cochleae in the cochlear
regions proximal to the electrode array (i.e. LB, UB & LM turns), although there was a significant difference in the apical region
(A turn; ∗∗∗ p < 0.001).
Corrosion scores correlated with stimulation chronically implanted unstimulated and chronically
charge density; more corrosion was observed on elec- stimulated cochleae identified the particulate as Pt
trodes with a higher charge density (R2 = 0.91). (data not illustrated).
Finally, there was no significant effect of implant There was clear evidence of Pt deposits in all
duration (p = 0.54), implying that corrosion of chronically stimulated cochleae. Pt deposits were
the Pt surface occurs rapidly following onset of the also evident in chronically implanted unstimulated
stimulation. control cochleae, although significantly less than
Figure 13 illustrates the relationship between tis- observed in stimulated cochleae (p = 0.001; n = 6,
sue response, final impedance and the extent of figure 15).
electrode corrosion for the four electrode categor-
ies (unstimulated control, unstimulated, flanker, and 3.8. Trace analysis of Pt
centre) in the present study for each cat. The tis- Trace levels of Pt were identified in all cochleae
sue response moderately correlated with the electrode (table 2). Stimulated cochleae contained significantly
corrosions score (r = 0.61; p = 0.0015); however, greater levels of Pt than implanted unstimulated con-
the final impedance recording had a weak correla- trol cochleae (p < 0.002). ICP-MS was also used to
tion with corrosion scores (r = 0.29; p = 0.19) and determine whether Pt was present in the brain, liver
poor correlation with the tissue response (r = 0.06; and kidney of all animals in this study. While two of
p = 0.78). the six animals showed trace levels of Pt in the kidney,
there was no detectible Pt in the brain or liver of any
3.7. Analysis of particulate deposits animal (table 2).
Representative photomicrographs illustrating partic-
ulate matter in both control and stimulated cochleae 4. Discussion
are illustrated in figure 14. Histological examination
of these particulate deposits revealed they occurred The present study examined the effects of long-
in two forms: the majority of the material appeared term intracochlear stimulation using Pt electrodes
to be of sub-micron dimensions and readily phago- at a charge density well above currently accepted
cytosed by macrophages (e.g. figures 14(ai) and (bi)), safe guidelines for cochlear implants [7, 11]. Coch-
while there were occasional larger deposits (∼20 µm leae stimulated continuously for periods of up to
in length) that had not undergone phagocytosis 6 months showed extensive Pt corrosion product
(e.g. figure 14(bi)). The particulate material we have within the scala tympani. Notably, small amounts
described in previous studies were localized close of particulate Pt were also observed in the tis-
to the electrode tract [16]; however, in the present sue capsule of chronically implanted unstimulated
study the deposits associated with the chronically control cochleae. ICP-MS analysis confirmed the
stimulated cochleae were located more distal to presence of Pt in all cochleae, although stimulated
the electrode tract within the scala tympani (e.g. cochleae had significantly greater levels than the
figure 14(b)). There was no evidence of particulate implanted unstimulated controls. Examination of the
material proximal to ANs within Rosenthal’s canal. electrode surface showed significant levels of corro-
Examination of this material using SEM-EDS in both sion for electrodes stimulated at a charge density
14You can also read