Adenosine-generating ovarian cancer cells attract myeloid cells which differentiate into adenosine-generating tumor associated macrophages - a ...
←
→
Page content transcription
If your browser does not render page correctly, please read the page content below
Montalbán del Barrio et al. Journal for ImmunoTherapy of Cancer (2016) 4:49
DOI 10.1186/s40425-016-0154-9

                                                                                                                                                                          J Immunother Cancer: first published as 10.1186/s40425-016-0154-9 on 16 August 2016. Downloaded from http://jitc.bmj.com/ on May 1, 2021 by guest. Protected by copyright.
 RESEARCH ARTICLE                                                                                                                               Open Access

Adenosine-generating ovarian cancer cells
attract myeloid cells which differentiate
into adenosine-generating tumor
associated macrophages – a self-
amplifying, CD39- and CD73-dependent
mechanism for tumor immune escape
Itsaso Montalbán del Barrio1,2, Cornelia Penski3,4, Laura Schlahsa1, Roland G. Stein1, Joachim Diessner1,
Achim Wöckel1, Johannes Dietl1, Manfred B. Lutz5, Michel Mittelbronn3,4, Jörg Wischhusen1*†
and Sebastian F. M. Häusler1*†

  Abstract
  Background: Ovarian cancer (OvCA) tissues show abundant expression of the ectonucleotidases CD39 and CD73
  which generate immunomodulatory adenosine, thereby inhibiting cytotoxic lymphocytes. Little, however, is known
  about the effect of adenosine on myeloid cells. Considering that tumor associated macrophages (TAM) and myeloid-
  derived suppressor cells (MDSC) constitute up to 20 % of OvCA tissue, we investigated the effect of adenosine on
  myeloid cells and explored a possible contribution of myeloid cells to adenosine generation in vitro and ex vivo.
  Methods: Monocytes were used as human blood-derived myeloid cells. After co-incubation with SK-OV-3 or
  OAW-42 OvCA cells, monocyte migration was determined in transwell assays. For conversion into M2-polarized “TAM-
  like” macrophages, monocytes were co-incubated with OAW-42 cells. Ex vivo TAMs were obtained from OvCA ascites.
  Macrophage phenotypes were investigated by intracellular staining for IL-10 and IL-12. CD39 and CD73 expression
  were assessed by FACS analysis both on in vitro-induced TAM-like macrophages and on ascites-derived ex situ-TAMs.
  Myeloid cells in solid tumor tissue were analyzed by immunohistochemistry. Generation of biologically active
  adenosine by TAM-like macrophages was measured in luciferase-based reporter assays. Functional effects of adenosine
  were investigated in proliferation-experiments with CD4+ T cells and specific inhibitors.
  Results: When CD39 or CD73 activity on OvCA cells were blocked, the migration of monocytes towards OvCA cells
  was significantly decreased. In vivo, myeloid cells in solid ovarian cancer tissue were found to express CD39 whereas
  CD73 was mainly detected on stromal fibroblasts. Ex situ-TAMs and in vitro differentiated TAM-like cells, however,
  upregulated the expression of CD39 and CD73 compared to monocytes or M1 macrophages. Expression of
  ectonucleotidases also translated into increased levels of biologically active adenosine. Accordingly, co-incubation
  with these TAMs suppressed CD4+ T cell proliferation which could be rescued via blockade of CD39 or CD73.
  (Continued on next page)

* Correspondence: Wischhusen_J@ukw.de; Haeusler_S@ukw.de
†
 Equal contributors
1
 Department of Obstetrics and Gynaecology, University of Würzburg, School
of Medicine, Josef-Schneider-Strasse 4, 97080 Würzburg, Germany
Full list of author information is available at the end of the article

                                       © 2016 The Author(s). Open Access This article is distributed under the terms of the Creative Commons Attribution 4.0
                                       International License (http://creativecommons.org/licenses/by/4.0/), which permits unrestricted use, distribution, and
                                       reproduction in any medium, provided you give appropriate credit to the original author(s) and the source, provide a link to
                                       the Creative Commons license, and indicate if changes were made. The Creative Commons Public Domain Dedication waiver
                                       (http://creativecommons.org/publicdomain/zero/1.0/) applies to the data made available in this article, unless otherwise stated.
Montalbán del Barrio et al. Journal for ImmunoTherapy of Cancer (2016) 4:49 Page 2 of 16
J Immunother Cancer: first published as 10.1186/s40425-016-0154-9 on 16 August 2016. Downloaded from http://jitc.bmj.com/ on May 1, 2021 by guest. Protected by copyright.
(Continued from previous page)
Conclusion: Adenosine generated by OvCA cells likely contributes to the recruitment of TAMs which further amplify
adenosine-dependent immunosuppression via additional ectonucleotidase activity. In solid ovarian cancer tissue, TAMs
express CD39 while CD73 is found on stromal fibroblasts. Accordingly, small molecule inhibitors of CD39 or CD73
could improve immune responses in ovarian cancer.
Keywords: Ovarian cancer, Adenosine, CD39, CD73, Tumor associated macrophages, Immune escape
Background [25, 30]. By producing reactive oxygen species (ROS), ni-
Immune function in the tumor microenvironment is tric oxide (NO), indoleamine-2,3-dioxygenase (IDO) and
shaped by tissue-specific and tumor-derived signals [1] by secreting high levels of immunosuppressive cytokines
which often decrease the effectiveness of anti-tumor im- like IL-10 and TGF-β [27], MDSC and TAM significantly
mune responses. This is particularly relevant for malig- shape the immune contexture of ovarian and other solid
nancies like ovarian cancer (OvCA) where immunological tumors. Clinically, abundance of MDSC and TAM has
processes like infiltration with cytotoxic [2] or regulatory been linked to poor outcome in various malignancies
T cells (Treg) [3] heavily affect the prognosis [1, 4, 5]. In [31, 32] including ovarian cancers of the serous and
this context, we and others have identified tumor-derived mucinous subtype [33, 34]. Interestingly, myeloid cells
adenosine as important immunomodulatory factor [6–10]. seem to accumulate in hypoxic tissue areas [27, 31]
Adenosine which signals via four specific receptors [11, 12] where low oxygen pressure leads to necrotic cell death
can activate several cellular responses which mainly serve with concomitant ATP release. CD39 and CD73 can, how-
to protect the tissue from excessive inflammatory ever, convert this pro-inflammatory signal [35–38] into
responses [12–16]. Sustained high levels of adenosine can, immunosuppressive adenosine.
however, turn harmful by triggering immune suppression While the suppressive effect of adenosine on several
or by activating unremitting wound-healing [17, 18]. immune cells such as CD4+ and CD8+ T cells and Nat-
Adenosine levels are thus kept low under physiological ural Killer (NK) cells is well documented, little is known
conditions, but increased by stimuli such as inflammation, about the effect of tumor-derived adenosine on myeloid
trauma, hypoxia or ischemia [12]. In ovarian cancer, high cells. Moreover, the available data are all based on mur-
levels of adenosine are due to tumor-specific expression of ine cells [39–41].
the ectonucleotidases CD39/ENTPD1 and CD73/ecto-5′- These findings prompted us to investigate the effect of
nucleotidase [7] which synergistically catalyze the de- OvCA-derived adenosine on human monocytes which
gradation of extracellular immune-stimulatory ATP to are the circulating precursors of both monocytic MDSC
immune-inhibitory adenosine. First, ATP or ADP are and TAM and can be obtained from peripheral blood. In
hydrolysed by CD39 to AMP which in turn is dephos- addition, we explored a possible regulation of CD39 and
phorylated to adenosine by CD73 [19–22]. Adenosine can CD73 expression on macrophages in response to the re-
then suppress anti-tumoral functions of CD4+ or CD8+ T spective mode of differentiation. Finally, we also performed
cells and Natural Killer (NK) cells [7, 9]. This mech- proliferation assays in vitro in order to functionally confirm
anism of immunosuppression was also proposed for an immunomodulatory role of CD39 and CD73 on M2-
CD4+CD25+FoxP3+ Treg cells [20]. OvCA cells, however, macrophages (or TAM). Within the limits of an ex vivo
seem to greatly outperform Treg regarding adenosine gen- study confined to the use of PBMC-derived monocytes to
eration [7]. approximate MDC and TAM, we have thereby obtained
Myeloid-derived suppressor cells (M-MDSC) and data that suggest a role for adenosine in the accumulation
tumor associated macrophages (TAM) are infiltrating and function of tumor-associated macrophages.
myeloid cells which, similar to Treg, significantly impact
survival as they enhance progression and metastasis Methods
[23–26]. In ovarian cancer they build up to 20 % of the Bioinformatic analysis
tumor volume [27]. Monocytic and polymorphonuclear Gene expression data were obtained from from 285
MDSC are recruited by tumors where they can remain ovarian cancer samples, from the AOCS (Australian
in their relatively immature state. The tumor micro- Ovarian Cancer Study) (GEO ID: GSE9891). Gene ex-
environment, however, promotes further differentiation pression was profiled on the affymetrix U133_plus2 plat-
of monocytic MDSC into TAM [28, 29]. TAM are form. Expression data are publicly available from the R2
alternatively activated M2-macrophages which (as bioinformatics program (http://R2.amc.nl). Bioinformatic
opposed to inflammatory M1-macrophages) orchestrate analysis of microarray data was conducted with the R2
anti-inflammatory, mostly immunosuppressive reactions tool by first searching for genes correlated with CD39 inMontalbán del Barrio et al. Journal for ImmunoTherapy of Cancer (2016) 4:49 Page 3 of 16
J Immunother Cancer: first published as 10.1186/s40425-016-0154-9 on 16 August 2016. Downloaded from http://jitc.bmj.com/ on May 1, 2021 by guest. Protected by copyright.
ovarian cancer. Subsequently, pairwise correlation ana- (anti-CD39: dilution 1:10 and anti-CD73: dilution 1:500)
lyses were performed as indicated. To correlate expression and subsequently labelled with secondary antibodies for
of CD39 and CD73 with overall survival inovarian cancer 1 h each (for CD39: Alexa Fluor488, dilution 1:250, don-
patients, we have used the the free online tool Kaplan- key anti-mouse IgG, Invitrogen, Darmstadt, Germany;
Meier plotter (http://kmplot.com/analysis/index.php?p= for anti-CD73: Alexa Fluor488, dilution 1:250, goat
service&cancer=ovar) [42]. 347 patients with stage 3 and 4 anti-rabbit IgG, Invitrogen). Next, the primary anti-
(high-grade) serous ovarian cancer were included, regard- bodies for the double staining were added for 1 h at room
less of p53 status, CA125 levels, optimal/suboptimal temperature (for anti-CD39: rabbit-anti-human-Iba-1 (di-
debulking or chemotherapy. A combined classifier com- lution 1:1000; Wako, Richmond, VA, USA; for anti-CD73:
prising gene expression data for both CD39/ ENTPD1 mouse-anti-human-CD68 (dilution 1:500; Dako, Hamburg,
(Affymetrix ID 228585) and CD73/NT5E (Affymetrix ID Germany), followed by an additional secondary antibody
203939) was bioinformatically computed and survival for 1 h (for anti-Iba1: Alexa Fluor568, dilution 1:250,
probabilities were calculated according to Kaplan-Meier donkey anti-rabbit IgG, Invitrogen; for anti-CD68: Alexa
statistics including 95 % confidence intervals (CIs). For Fluor568, dilution 1:250, goat anti-mouse IgG, Invitrogen).
comparison, two-sided log-rank tests were used. Nuclear counterstaining was performed using Topro-3
(dilution: 1:1000; Invitrogen) followed by sudan black for 5
Immunohistochemistry and immunofluorescence min to block autofluorescence. Fluorescence images were
All tissue specimens (10 ovarian cancer, one healthy ovary) analyzed and recorded on a Nikon C1si (Nikon, Japan)
were provided by the University Hospital Würzburg confocal microscope, using the EZ-C1 software. After re-
(Würzburg, Germany). Samples had been evaluated by at cording, digital images were further processed and adjusted
least two pathologists in routine diagnostics as serous- for brightness, contrast and color balance.
papillary OvCA or benign ovary. All human tissue speci-
mens were cut with a microtome (3 μm thickness) and Cell culture
placed on SuperFrost-Plus slides (Microm International, The human ovarian cancer cell lines SK-OV-3 or OAW-
Walldorf, Germany). IgG2a-mouse-anti-human CD39 42 were cultured in RPMI 1640 medium with 10 % FCS,
antibody (dilution 1:10; Biozol, Eching, Germany) and 0.02 % sodium pyruvate, penicillin (100 IU/ml) and
IgG-rabbit-anti-human CD73 antibody (dilution 1:500; streptomycin (100 μg/ml) (all from Gibco, Karlsruhe,
Sigma-Aldrich, St. Louis, MO, USA) were used for Germany). Cell line identity was confirmed via single
immunohistochemistry. Tissue labelling was performed tandem repeat fingerprinting by the Deutsche Sammlung
using the DiscoveryXT immunohistochemistry system für Mikroorganismen und Zellkulturen (Braunschweig,
(Ventana/Roche, Strasbourg, France). After a cell condi- Germany). Tumor associated macrophages were isolated
tioning pre-treatment a 4 min blocking step was per- from ascites from OvCA patients (n = 9) using anti-
formed. The primary antibodies were applied for 32 min, CD14 coated magnetic beads (Miltenyi Biotec, Bergisch
followed by a secondary OmniMap anti-mouse HRP Gladbach, Germany) according to the manufacturer’s
(horseradish peroxidase) (Ventana) for 16 min incubation recommendations. For control purposes peritoneal mac-
for anti-CD39 staining and a universal secondary HRP rophages were isolated from patients with benign ascites
antibody (Ventana) for 32 min for anti-CD73 staining. For (n = 8). All ascitic fluid punctures were performed for
diaminobenzidine (DAB) visualization, the sections were medical needs.
incubated with one drop of DAB CM and one drop of
H2O2 CM (Ventana) for 8 min, followed by incubation Migration assay
with a copper enhancer (Ventana) for 4 min. Human ton- Peripheral blood mononuclear cells (PBMC) were iso-
sil (for anti-CD39) and human placenta (for anti-CD73) lated from the blood of healthy volunteers. To enrich for
were used as positive controls. Negative controls were monocytes, a two-step gradient centrifugation protocol
performed by omission of the first antibody. Finally, all was used, starting with a standard Ficoll-based separation
sections were then washed, counterstained with hema- medium (Biocoll, Biochrom, Berlin, Germany) followed by
toxylin and mounted. a Percoll gradient (Easycoll separation medium, Biochrom,
For immunofluorescent stainings, 3 μm thick slides Berlin, Germany). 500.000 monocytes per well were then
were deparaffinized with xylene and rehydrated in a placed in the upper inserts of 24-well Transwell plates
descending alcohol sequence. Heat pre-treatment for (pore diameter 8 μm, membrane thickness 10 μm, cell
antigen retrieval was performed with citrate buffer (pH growth area 0.33 cm2, Corning, Tewksbury, USA) while
6.0) for 40 min, followed by a blocking step for 30 min 200.000 OAW-42 or SK-OV-3 cells were placed in the
(Roti-Immuno Block, dilution 1:10; Roth, Karlsruhe, corresponding compartments at the bottom of the plate.
Germany) at room temperature. Sections were incubated All assays were conducted in RPMI 1640 medium
with primary antibodies for 1 h at room temperature with 5 % human AB serum (PAA) (500 μl per well).Montalbán del Barrio et al. Journal for ImmunoTherapy of Cancer (2016) 4:49 Page 4 of 16
J Immunother Cancer: first published as 10.1186/s40425-016-0154-9 on 16 August 2016. Downloaded from http://jitc.bmj.com/ on May 1, 2021 by guest. Protected by copyright.
After an incubation period of 6 h, all cells from the bot- size 1 μm) for 48h at 37 °C in RPMI 1640 with 5 % human
tom plates were analyzed by flow cytometry. Monocytes AB serum [43]. M1- and M2-polarization were confirmed
were identified with anti CD11c-FITC (Immunotools, by flow cytometric analysis of intracellular IL-10- and IL-
Friesoythe, Germany) whereas OvCA cells were stained 12-levels [44]; to this aim the cells were stained with anti-
with EpCam-APC (BioLegend, San Diego, USA) (both IL10-FITC (Miltenyi) and anti-IL12-APC (Biolegend) at
antibodies used at 1:100 dilution). Dead cells were 1:100 dilution. Based on the expression of CD68, macro-
excluded via co-staining with 7-aminoactinomycin D. To phage purity was found to be >90 %. In addition, arginase
quantify the relative migration rate, a standard curve was activity was determined in a colorimetric assay based on
generated from several samples containing 2x10⁵ cancer urea production. Polarized macrophages were washed
cells together with different numbers of monocytes (0 -106 twice with ice-cold PBS, scraped and centrifuged at 1,200
cells). To block CD39 or, respectively, CD73 activity rpm for 5 min. Cell pellets were resuspended into 200 μl
during the transwell co-culture, ARL 67156 (250 μM, lysis buffer (50 mM Tris–HCl (pH 7.5), 0.1 mM EDTA,
Tocris, Bristol, UK), α,β-methyleneadenosine-5′-diphos- 0.1 mM ethylene glycol-bis(β-aminoethyl ether)-N, N, N′,
phate (“APCP”, 100 μM, Sigma, Deisenhofen, Germany) N′-tetraacetic acid, 1 mM dithiothreitol, 1 μg/ml leupep-
or appropriate solvent controls were used (Crack et al., tin, 1 μg/ml aprotinin, and 0.1 mM phenylmethylsulfonyl
1995; Krug et al., 1973). As positive control, the meta- fluoride). Cell lysates (50 μl) were added into 50 μl of
bolically stable adenosine receptor agonist adenosine-5′- 50 mM Tris–HCl (pH 7.5) containing 10 mM MnCl2.
N-ethylcarboxamide (NECA, Tocris) was employed at 100 Arginase was then activated by heating the mixture at
nM. To control for effects of adenosine on chemokinesis, 55–60 °C for 10 min. To allow for catalytic conver-
a control without tumor cells but with equal amounts of sion of L-arginine by arginase, lysates were incubated
NECA in both compartments was performed. with 50 μl of L-arginine (0.5 M; pH 9.7) at 37 °C for 1 h,
before the reaction was stopped by addition of 400 μl acid
RT2 Profiler PCR array for adenosine-dependent solution mixture (1 H2SO4:3 H3PO4:7 H2O). For vi-
modulation of chemokines and chemokine receptors on sualization, 25 μl of 9 % α-Isonitrosopropiophenone (in
monocytes 100 % ethanol) were added to the mixture and heated at
To investigate if NECA has an effect on the expression 100 °C for 45 min. Once the samples had been incubated
of chemokines or chemokine receptors in monocytes, in the dark for 10 min at RT, the urea concentration was
mRNA expression on CD14+ bead-purified monocytes determined by measuring the absorbance at 550 nm in a
was assessed 3h after NECA treatment in comparison to spectrophotometer. The rate of urea production was used
an untreated control. 280ng total RNA per sample were as an index for arginase activity.
used for cDNA synthesis (RT2 First Strand Kit, Qiagen, Ectonucleotidase expression on M1/M2-macrophages
Hilden, Germany). The RT2 Profiler PCR array for hu- and on patient-derived TAMs was assessed with anti-
man chemokines & receptors and the RT2 SYBR Green CD73-PE (BioLegend) or anti-CD39-PECy7 (Miltenyi) at
ROX qPCR mastermix (both from Qiagen) were used 1:100. Specific Fluorescence Indices (SFI) were calculated
according to the manufacturer’s instructions. Assays for each surface marker by dividing the signal intensity ob-
were run on a StepOnePlus RealTime-PCR cycler (ther- tained with the specific by the signal intensity measured
mofisher, Darmstadt, Germany). For data analysis, the with an irrelevant isotype-matched control antibody. All
same threshold was applied for each plate and data were flow cytometry analyses were performed using a FACSCa-
analyzed in the Qiagen Analysis Webportal. Candidate libur flow cytometer (BD Biosciences, San Jose, USA).
molecules appearing to be regulated by NECA in the ar- CD39 and CD73 mRNA transcript levels were quanti-
rays where then validated by qRT-PCR (Additional file 1). fied from cDNA by semi-quantitative real time PCR
(qRT-PCR) using the ABsolute Blue QPCR SYBR Green
Determination of M1 and M2 macrophage polarization low Rox mix kit and the following primer pairs:
and of CD39 and CD73 expression CGGCTACCACATCCAAGGAA (frw) and GCTGGAA
Monocytes were isolated from healthy volunteers as de- TTACCGCGGCT (rev) for 18S; GTAAGTGACCTTTA
scribed above and matured in Lumox dishes (Greiner CAAGACCC (frw) and TGCTGGAATGGAAGAGTC
bio-one, Frickenhausen, Germany) during 7 days in RPMI ATC (rev) for CD39; GGCTCCTCTCAATCATGCCG
1640 with 5 % human AB serum at 37 °C. Polarization (frw) and CAGAACATTTCATCCGTGTGT (rev) for
towards M1-phenotype was induced with human recom- CD73. Purity of the PCR products was assessed based
binant IFN-γ [1 μg/ml] and LPS [10 μg/ml] (both from on the dissociation curve. All samples were measured
Peprotech, Hamburg, Germany) for 48h at 37 °C in RPMI in duplicate and Ct (cycle threshold)-values were
1640 medium with 5 % human AB serum. M2-phenotype within ≤0.5 cycles. mRNA expression was quantified
macrophages were generated by co-culture of matured relative to the expression 18S RNA which was used
monocytes with OAW-42 cells in transwell plates (pore as control.Montalbán del Barrio et al. Journal for ImmunoTherapy of Cancer (2016) 4:49 Page 5 of 16
J Immunother Cancer: first published as 10.1186/s40425-016-0154-9 on 16 August 2016. Downloaded from http://jitc.bmj.com/ on May 1, 2021 by guest. Protected by copyright.
Adenosine production via CD39 and CD73 significant. In R2 analysis, p-values were corrected for
Measurement of biologically active adenosine was per- multiple testing. In flow cytometric assays at least 50,000
formed as described before [7, 45]. Briefly, ADORA2A- events were counted; two samples were considered to be
overexpressing HEK-293 cells were transiently trans- significantly different (*) when they were separated by at
fected with the luciferase-encoding RIP1-CRE.luc+ least twice the sum of the standard deviations for the
cAMP-reporter plasmid [46]. Transfection efficiency respective regions. A difference exceeding four times the
was normalized via co-transfection of pRL-CMV (Pro- sum of the respective standard deviations was consid-
mega, Madison, WI, USA). As adenosine binding to ered as highly significant (**).
ADORA2A activates the adenylate cyclase, a correspond-
ing firefly luciferase signal is obtained. Accordingly, a Results
standard curve can be generated with a dynamic range Expression of CD39 and CD73 in ovarian cancer tissue is
from 20 nM to 40 μM adenosine. Specificity of the signal associated with poor survival and correlates with
is controlled by use of HEK-293 cells without ADORA2A transcripts expressed in myeloid cells
overexpression and by addition of the ADORA2A-specific To check for a possible correlation between CD39 and
inhibitor SCH58261 (Tocris, Bristol UK). M1- or M2- CD73 expression and survival in ovarian cancer patients,
macrophages generated as described above were co- a web-based (http://kmplot.com/analysis/index.php?p=
incubated at a 1:1 ratio with of RIP1-CRE.luc- and pRL- service&cancer=ovar) [42] Kaplan-Meier analysis includ-
CMV-transfected HEK-293 ADORA2A+ cells for 4 h. Cells ing 347 patients with stage 3 and 4 (high-grade) serous
were lysed with passive lysis buffer (Promega) and biopho- ovarian cancer was performed. Using a combined classi-
tonic signals were measured using a non-commercial dual fier for both ectonucleotidases, CD39/CD73high tumors
luciferase assay (Dyer et al., 2000). Adenosine concentra- showed a hazard ratio of 1.32 (95 % CI: 0.99 – 1.76; p =
tions were calculated based on the co-determined standard 0.062), thus indicating a trend towards worse survival
curve. All measurements were performed in triplicates for patients with tumors expressing CD39 and CD73 at
using an Orion II Microplate Luminometer (Berthold De- significant levels (Fig. 1). Using the R2 database, gene ex-
tection Systems, Pforzheim, Germany). The specific inhib- pression data from 285 ovarian cancer tissues from the
itors ARL67156 for CD39 (100 μM) and APCP for CD73 AOCS (Australian Ovarian Cancer Study) were screened
(100 μM) were added to confirm that the effects depend for genes correlating with the presence of CD39
specifically on the respective ectonucleotidases. (ENTPD1(209473_at)) or, respectively, CD73 (Additional
file 2: Table S1). Considering the strong correlation be-
Proliferation of CD4+ T cells in co-culture with adenosine- tween both ectonucleotidases (r = 0.317, p = 4.3x10⁻⁸), a
generating cells considerable overlap could also be expected for genes
CD4 T cell proliferation was measured as before [7]. CD4+ which tend to be co-expressed with either CD39 or
cells were isolated from PBMC using the CD4+ T cell isola- CD73. In this context, KEGG pathway analysis using the
tion kit II (Miltenyi). Cells were then stained with 2.5 μM R2 pathway finder revealed for both CD39 (p = 1.5x10⁻⁵)
5-(and-6)-carboxyfluorescein diacetate succinimidyl ester and CD73 (p = 1.6x10⁻³) a highly significant correlation
(CFSE, Invitrogen, Karlsruhe, Germany). An agonistic anti- with antigen processing and presentation. 42 out of 57
human CD3 antibody (clone UCHT-1, ImmunoTools) was genes linked to this pathway show correlation with CD39
immobilized on 96 well Maxisorp-plates (Nunc, Roskilde, (p = 1.5x10⁵). Likewise, 41 out of 57 pathway-associated
Denmark) by overnight-incubation in PBS (antibody con- genes also correlated with CD73 (p = 1.6x10⁻³) (see
centration: 1 μg/ml). In coated wells, T cell stimulation Additional file 3: Table S2). Pairwise correlation analyses
could be induced by addition of soluble anti-human CD28 subsequently indicated particularly strong positive cor-
(clone 15E8, 1 μg/ml, Immunotools). In each well, 2x10⁶ T relations with MS4A7 (membrane-spanning 4-domains
cells were co-incubated with 5x10⁵ M2 macrophages, subfamily A member 7) (p = 2.5x10⁻²⁹), myeloid differenti-
in the absence or presence of the specific inhibitors ation protein-2, LY96 (p = 2.4x10⁻³⁴), myeloid cell nuclear
ARL67156 for CD39 (100 μM), APCP (100 μM) for CD73 differentiation antigen MNDA (p = 1.1x10⁻²⁹) and col-
or solvent controls. As positive control, the metabolically ony stimulating factor 2 receptor beta, CSF2RB (p =
stable adenosine receptor agonist adenosine-5′-N-ethyl- 2.4x10⁻³³). Correlation between CD39 and CD68 was
carboxamide (NECA, Tocris) was used at 10 μM. T cell also highly significant (p = 2.4x10⁻¹⁰). Further pathways
proliferation was determined on a FACSCalibur flow linked to CD39 expression include (among others),
cytometer (BD Biosciences) on day 7 (all [7]). cytokine–cytokine receptor interaction (p = 7.9x10−03), cell
adhesion (p = 4.4x10−05) and leukocyte_transendothelial_
Statistics migration (p = 8.3x10−03). For CD73 (NT5E), KEGG path-
For all experiments, significance was determined by way analysis showed the strongest association with focal
Student’s t-test. p-values < 0.05 were considered to be adhesion (p = 1.2x10−05), followed by cytokine_cytokine_Montalbán del Barrio et al. Journal for ImmunoTherapy of Cancer (2016) 4:49 Page 6 of 16
J Immunother Cancer: first published as 10.1186/s40425-016-0154-9 on 16 August 2016. Downloaded from http://jitc.bmj.com/ on May 1, 2021 by guest. Protected by copyright.
mismatch repair are not listed here. Pairwise correla-
tions with MS4A7 (p = 3.6x10⁻¹⁴), LY96 (p = 9.1x10⁻¹⁹),
MNDA (p = 5.6x10⁻¹⁸), CSF2RB (p = 6.9x10⁻¹²), and
CD68 (p = 3,1x10⁻⁶) also showed correlation with CD73
expression. Moreover, phenotypical markers for myeloid
cells (TAM or MDSC) [47] show a significant correlation
with both CD39 and CD73 (see Additional file 4:
Table S3). Possible explanations for these findings are
either expression of ectonucleotidases on myeloid cells in
the tumor tissue, or enhanced recruitment of myeloid cells
when adenosine is generated.
Expression of CD39 and CD73 by macrophages from
ovarian cancer ascites and in ovarian cancer tissue
CD14+ cells were isolated via magnetic cell separation
from fresh ascites samples of OvCA patients. These
monocyte-derived cells which are likely to represent ex
situ-TAMs were found to express both ectonucleotidases
Fig. 1 Prognostic value of CD39 and CD73 expression in patients
with high-grade serous OvCA. Using the ovarian cancer dataset
(CD39: 3/3 and CD73: 2/3; Fig. 2). In contrast, macro-
available via the free online tool Kaplan-Meier plotter (http://kmplot. phages and monocytes from healthy donors as well as
com/analysis/index.php?p=service&cancer=ovar), expression of CD39 peritoneal macrophages from patients with benign dis-
and CD73 was correlated with overall survival. All 347 patients with ease showed negligible expression of both CD39 and
stage 3 and 4 serous OvCA were included, regardless of p53 status, CD73 (Fig. 2). With regard to solid ovarian cancer tissue,
CA125 levels, optimal /suboptimal debulking or chemotherapy.
Based on a bioinformatically computed combined classifier comprising
expression of CD39 and CD73 in ovarian cancer stroma
gene expression data for both CD39/ ENTPD1 (Affymetrix ID 228585) was already shown in our previous study (Häusler et al.,
and CD73/NT5E (Affymetrix ID 203939), 134 patients (38.6 %) were 2011). Aiming at a more precise cellular attribution of
classified as CD39/CD73high. Survival probabilities according to ectonucleotidase expression on tumor-associated mye-
Kaplan-Meier were calculated together with 95 % confidence intervals loid cells, 10 OvCA cases, 1 healthy ovary and 1 placenta
(CIs) and compared using two-sided log-rank tests
were investigated. Besides strong endothelial CD39 and
CD73 stainings in both normal and neoplastic tissue re-
receptor_interaction (p = 4.3x10−05), ECM_receptor_inter- gions on all OvCA samples, CD39 was clearly detectable
action (p = 4.7x10−04), antigen processing and presentation on tumor-infiltrating immune cells in 7/10 samples with
(p = 1.6x10−03) and leukocyte transendothelial migration particularly strong stainings in two cases. Tumor cells,
(p = 1.9x10−03) (see Additional file 2: Table S1). Patterns however, were only focally positive for CD39 with strong
resembling specific diseases like tuberculosis, malaria signals in 1/10 and weak stainings in 9/10 OvCA sam-
or amoebiasis or processes like DNA replication or ples (Fig. 3a; human tonsil serving as positive control as
Fig. 2 Ectonucleotidases CD39 and CD73 are expressed on CD14+ cells from OvCA ascites. Primary CD14+ cells (TAM) were isolated from OvCA
ascites via magnetic cell sorting (n = 9). For control purposes, macrophages and monocytes from healthy donors (n = 8) and peritoneal macrophages
from patients with benign disease (n = 8) were obtained and analyzed. For statistical comparison, unpaired two-sided Student’s t test was usedMontalbán del Barrio et al. Journal for ImmunoTherapy of Cancer (2016) 4:49 Page 7 of 16
J Immunother Cancer: first published as 10.1186/s40425-016-0154-9 on 16 August 2016. Downloaded from http://jitc.bmj.com/ on May 1, 2021 by guest. Protected by copyright.
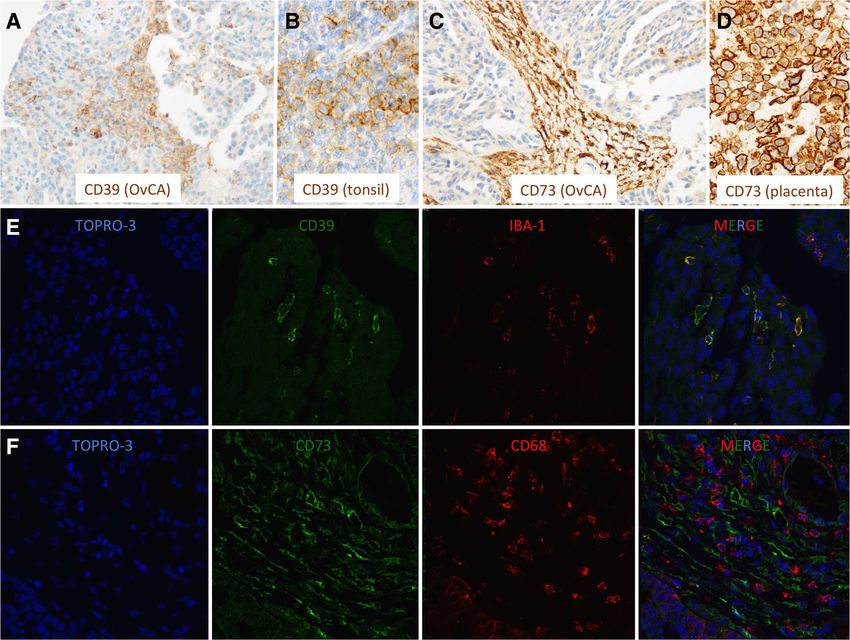
Fig. 3 CD39 is expressed on TAM while CD73 is strongly related to tumor stroma in OvCA. Representative immunohistochemical stainings for
(a-b) CD39 and (c-d) CD73 showing that (a) CD39 is heterogeneously expressed on cells within the tumor parenchyma (b: tonsil serving as
positive control) while (c) CD73 expression is largely restricted to the tumor stroma (d: placenta serving as positive control). (e-f) Immunfluorescent
double stainings for (e) CD39 and IBA-1 as well as (f) CD73 and CD68 revealed a considerable co-expression of the macrophages markers with (e)
CD39 but not with (f) CD73
shown in Fig. 3b). In the tumor stroma, CD39 showed a whereas myeloid cells in solid tumor tissue express no
clear signal in 1/10, but no more than weak focal stain- CD73 but moderate levels of CD39, ectonucleotidase
ings in 9/10 OvCA samples whereas CD73 was promin- levels on TAM or MDSC seems to be context-dependent
ently expressed in all cases (Fig. 3c; human placenta and, likely, inducible. This, however, appears insufficient
serving as positive control as shown in Fig. 3d). On to explain the strong correlation between CD39, CD73
tumor cells, CD73 was highly expressed in 1/10 cases, and myeloid markers found by gene expression analysis.
still prominently in 4/10 tissue samples, weak on 3/10 Consequently, we wondered whether adenosine generated
sections and absent in 2/10 cases. Further CD73 expres- via ectonucleotidases on stromal or on tumor cells could
sion was detected on tumor-infiltrating immune cells in attract myeloid cells towards the tumor tissue.
6/10 cases. To further determine a potential expression
of CD39 and CD73 on myeloid cells, immunofluorescent OvCA cells increase the migration of myeloid precursor
double staining with myeloid markers were performed cells by CD39- and CD73-dependent generation of
revealing a co-localization of CD39 with the macrophage adenosine
marker IBA-1 (Fig. 3e). CD73, in contrast, was most To analyze the migration behavior of human blood-
prominently expressed on fibroblast-like tumor stromal borne myeloid cells, CD14+ monocytes were isolated
cells without showing a co-localization with cells expres- from healthy volunteers and placed in the upper inserts
sion the myeloid marker CD68 (Fig. 3f ). Having found of transwell plates. After 4 h of co-incubation with SK-
that TAMs from ascites express CD39 and CD73 OV-3 or OAW-42 cells in the corresponding bottomMontalbán del Barrio et al. Journal for ImmunoTherapy of Cancer (2016) 4:49 Page 8 of 16
J Immunother Cancer: first published as 10.1186/s40425-016-0154-9 on 16 August 2016. Downloaded from http://jitc.bmj.com/ on May 1, 2021 by guest. Protected by copyright.
compartments, migration of monocytes through the monocytes, we performed an RT2 Profiler PCR array for
transwell-pores towards the OvCA cells was determined human chemokines & receptors followed by qRT-PCR for
by flow cytometry. Unfortunately, the difficulties in validation of individual candidate molecules (Additional
measuring the easily degraded nucleoside adenosine did file 1). This, however, showed only CCL28 and CXCL3/
not allow concomitant determination of adenosine levels GRO-γ to be induced by NECA after 3 h. As CCR10
during the assay. However, based on our reporter gene which is the receptor for CCL28 could not be detected,
assay conditions adenosine levels would typically be in CCL28 is most unlikely to mediate the observed migratory
the range from 1.1-1.7 μM for SK-OV-3 and 1.7-4.3 μM effect. CXCL3/GRO-γ has, however, been described to
for OAW-42 cells. Under these conditions, pre-treatment affect monocyte differentiation and proliferation without
of the tumor cells with the selective CD39- or CD73- altering their migration behavior [48, 49]. Thus, while an
inhibitors ARL67156 or APCP did not affect their viabil- indirect or secondary effect on migration cannot be ex-
ity, but reduced monocyte migration by more than half, as cluded, there is currently no evidence for this. Moreover,
compared to the solvent control. A similar effect was the experimental data show that irrespective of the under-
obtained by adding the A2A receptor inhibitor SCH58261 lying mechanism adenosine can attract monocytes to-
to the monocytes in the upper compartment. Conversely, wards tumor cells.
when the metabolically stable adenosine receptor agonist
NECA was applied, monocyte migration was increased by M2-macrophages polarized by coculture with OvCA cells
approximately two third (Fig. 4). Importantly, addition of upregulate CD39 and CD73 to levels also observed in
NECA overruled the inhibition of CD39 and CD73 which CD14+ cells from ovarian cancer ascites
indicates that the impaired migration was not due to dir- Immunosuppressive myeloid cells with a phenotype
ect effects of the inhibitors on the monocytes but rather resembling tumor-associated macrophages (TAMs) can
to the reduced availability of adenosine (Fig. 4). While no be induced by co-incubation of monocytes with OvCA
evidence was obtained for enhanced chemokinesis in the cells [43]. Having found that OvCA cell-derived adeno-
presence of NECA, the co-culture setting does not allow sine attracts monocytes towards the tumor cells, we
to distinguish between direct chemotaxis towards adeno- wanted to confirm that these monocytes polarize to an
sine or a more indirect effect by which adenosine might M2-like phenotype which is characteristic for immuno-
enhance cell migration towards another tumor-derived suppressive TAM. Therefore, mature macrophages from
chemokine. Still, to screen whether adenosine might healthy donors were co-incubated with OAW-42 cells in
induce chemokine or chemokine receptor expression on a transwell setting where macrophage migration to the
Fig. 4 CD39 and CD73 activity on OvCA cells promote monocyte migration in transwell chambers. Primary human monocytes were placed in the
upper inserts of transwell plates while SK-OV-3 (a) or OAW-42 (b) OvCA cells were seeded in the respective bottom compartments. To explore a
potential influence of ectonucleotidases, CD39 activity in tumor cells was inhibited by 100 μM ARL67156 whereas CD73 was inhibited with
100 μM α,β-methyleneadenosine-5′-diphosphate (APCP). Equal amounts of solvent (DMSO) were added to the otherwise untreated controls. To
exclude unwanted effects of the inhibitors on migrating monocytes, ovarian cancer cells were pre-incubated with the inhibitors for 30 min before
being washed with PBS. To assess the effect of adenosine on monocyte migration directly, positive controls with the metabolically stable adenosine
receptor agonist adenosine-5′-N-ethylcarboxamide (NECA) (used at 100 nM) were also included, both in the absence and in the presence of APCP and
ARL67156 (n = 3, * indicates p < 0.05, ** denotes p < 0.01, as assessed by unpaired Student’s t-test). As additional control, A2A receptor signalling was
blocked during the assay by SCH58261 (in a). Under all conditions, migration of monocytes through the 8 μm wide and 10 μm thick pores was
analyzed after 4 h by staining transmigrated cells for CD11c followed by flow cytometric analysis. Tumor cells from the bottom compartment were
identified by co-staining for EpCAM expressionMontalbán del Barrio et al. Journal for ImmunoTherapy of Cancer (2016) 4:49 Page 9 of 16
J Immunother Cancer: first published as 10.1186/s40425-016-0154-9 on 16 August 2016. Downloaded from http://jitc.bmj.com/ on May 1, 2021 by guest. Protected by copyright.
lower chamber was precluded by the narrow pore- cell proliferation was investigated in coculture experi-
diameter of the transwell membrane. After 48h of co- ments with CD4+ T cells which had been stimulated
culture, macrophages were analysed by intracellular flow with agonistic antibodies to CD3 and CD28. In this
cytometry for expression of IL-10 and IL-12. As opposed setting, TAM-like M2 macrophages decreased CD4+ T
to M1-polarized macrophages that had been generated cell proliferation by >50 % (52 % on average, range: 47–
from monocytes in the presence of IFN-γ and LPS, co- 56 %) when compared to M1 macrophages (a represen-
cultured macrophages displayed high levels IL-10 and tative example is shown in Fig. 7a, pooled data from 3
low levels of IL-12 confirming their M2-polarization independent experiments are displayed in Fig. 7b). To
(Fig. 5a). specifically block ectonucleotidase activity on M2 mac-
High arginase activity is also related to a macrophage rophages, ARL67156, APCP, or both were added. Com-
phenotype promoting tumor growth [50]. Consequently, pared to solvent controls, CD4+ T cell proliferation was
co-cultured macrophages were further characterized increased about 3.5-fold [range: 3.1 - 3.8-fold] by block-
using a colorimetric assay for arginase activity. This con- ade of CD39 with ARL67156. Inhibition of CD73 by
firmed a higher enzymatic activity in the M2 polarized APCP enhanced T cell proliferation by a factor of 2.7
macrophages as well as in TAMs isolated from fresh [range: 2.4 – 3.0] (Fig. 7). Considering that both APCP
ascites of OvCA patients (Fig. 5b). and ARL67156 already abrogated adenosine production
Similar to recent reports on murine TAMs [39–41], when used on their own (compare Fig. 6), no further
human macrophages which had been co-cultured in improvement could be expected by their combination.
vitro with ovarian cancer cells (OAW-42) also showed Instead, a somewhat diminished effect was observed
high expression of CD39 and CD73, both on mRNA which may be due to slight toxic effects caused by the
(Fig. 5c) and on protein level (Fig. 5d). Acquisition of simultaneous use of both inhibitors (Fig. 7).
this phenotype was found to be independent of signaling
via the A2A adenosine receptor since induction of Discussion
CD39, CD73 and IL-10 also occurred when SCH58261 In hypoxic tissues or after chemotherapeutic treatments,
was present in the co-culture (Fig. 5e). In M1 macro- dying tumor cells are abundant. ATP released by these
phages, however, CD39 and CD73 surface levels were cells [7, 51–53] constitutes an immunological danger sig-
much lower (compare Fig. 5a). As this resembled the in nal which can activate dendritic cells [35]. ATP can, how-
vivo situation observed on TAMs from OvCA ascites ever, be rapidly converted to adenosine which is known to
shown in Fig. 2, we decided to further explore the func- suppress CD4+ T, CD8+ T and NK cells [7, 14, 54]. In fact,
tional consequences of ectonucleotidase expression on we and others have already shown that ovarian cancer
TAM-like M2 macrophages (“in vitro TAMs”). cells and tissues can express high levels of the ectonucleo-
tidases CD39 and CD73 which enzymatically convert free
Increased CD39 and CD73 expression on in vitro extracellular ATP to adenosine. CD39 (which catalyzes
generated TAM-like M2 macrophages translates into the degradation of pro-inflammatory ATP to AMP) even
higher levels of biologically active adenosine showed a highly tumor-specific expression pattern in the
To investigate whether the high ectonucleotidase expres- female reproductive tract. CD73 (which generates adeno-
sion on M2 macrophages results in increased levels of sine from AMP) was likewise significantly overexpressed
biologically active adenosine, a luciferase-based adenosine in tumor tissues [7]. Moreover, strategies directed at the
reporter assay was performed as previously described inhibition of CD73 (and thus at the prevention of adeno-
[45]. In line with the observed expression of adenosine- sine generation), have shown impressive results in animal
generating enzymes, pro-inflammatory M1-polarized models of breast and ovarian cancer [8, 10, 55]. Neverthe-
macrophages produced only low amounts of adenosine less, both positive and negative correlations between
(0.27 μM ± 0.18 μM) whereas the TAM-like or M2- CD39 and CD73 expression and outcome have been
polarized macrophages generated significantly higher described [56–59]. The desirable analysis whether local
levels of the immunosuppressive nucleoside (on average adenosine levels affect prognosis is unfortunately pre-
3.8 μM, range: 1.6-5.4 μM) (Fig. 3). In the presence of cluded by the short half-life of adenosine. Gene expression
specific inhibitors for CD39 (ARL 67156) and CD73 analysis, however, suggests that combined overexpression
(APCP), adenosine production was almost abrogated of CD39 and CD73 is associated with a trend towards
(Fig. 6). poor survival (Fig. 1, p = 0.062, n = 347 patients).
A clear correlation has, in contrast, been found for
In vitro polarized M2 macrophages suppress CD4+ T cell infiltration of ovarian tumors with myeloid cells and
proliferation via adenosine production rapid tumor progression, metastasis and poor progno-
To test the functional relevance of increased adenosine sis [24–26]. As human studies are confined to readily
generation by M2 macrophages, their effect on CD4+ T available biological materials, we used monocytes asMontalbán del Barrio et al. Journal for ImmunoTherapy of Cancer (2016) 4:49 Page 10 of 16
J Immunother Cancer: first published as 10.1186/s40425-016-0154-9 on 16 August 2016. Downloaded from http://jitc.bmj.com/ on May 1, 2021 by guest. Protected by copyright.
Fig. 5 In vitro induced TAM-like macrophages show M2-polarization, arginase activity and ectonucleotidase expression. Peripheral blood
monocytes were obtained from healthy volunteers by gradient centrifugation and subsequent adherence enrichment. Monocytes were then
matured in Lumox dishes for 9 days to obtain mature macrophages (MФ). Macrophage polarization was achieved either with IFN-γ [1 μg/ml] and
LPS [10 μg/ml] (MФ (IFN-γ + LPS)) or by coincubation with OAW-42 OvCA cells (MФ (Co-culture)). a The obtained MФ (IFN-γ + LPS) (light grey)
and MФ (Co-culture) (dark grey) were analyzed by FACS for intracellular IL-10 and IL-12 levels. To obtain specific fluorescence intensity (SFI) values,
the median fluorescence values obtained with fluorochrome-conjugated specific antibodies were divided by the median fluorescence values
obtained with identically labeled irrelevant isotype-matched control antibodies (n = 3, * for p < 0.05, ** for p < 0.01). b CD14+ cells (TAM) were
isolated from malignant tumor tissue. In addition, mature macrophages from a healthy donor were polarized as in a. To determine arginase
activity by MФ (IFN-γ + LPS) and MФ (Co-culture) as well as by TAM, arginine conversion was assessed by measuring the resulting urea in a
colorimetric assay. Significance levels were determined by two-sided, unpaired Student’s t-test. p-values < 0.01 were considered as highly significant
(**). c Macrophages were prepared and polarized as in a. 8 h, 24 h and 48 h after the polarizing conditions had been applied, RNA was isolated,
reverse-transcribed to cDNA and analyzed for CD39 and CD73 transcript levels using SybrGreen-based RT-PCR. 18S rRNA content was determined for
normalization and relative CD39 and CD73 mRNA levels were calculated by the ΔΔCt method using non-polarized macrophages as reference. d Using
MФ (IFN-γ + LPS) and MФ (Co-culture) as in c, CD39 and CD73 surface expression was assessed by flow cytometry. e Macrophages were polarized with
OAW-42 cells for 24 h in the presence or absence of the A2A adenosine receptor inhibitor SCH58261 before IL-10, CD39 and CD73 expression were
analysed by flow cytometry. Comparable data for primary TAMs isolated from OvCA ascites are shown in Fig. 2Montalbán del Barrio et al. Journal for ImmunoTherapy of Cancer (2016) 4:49 Page 11 of 16
J Immunother Cancer: first published as 10.1186/s40425-016-0154-9 on 16 August 2016. Downloaded from http://jitc.bmj.com/ on May 1, 2021 by guest. Protected by copyright.
is not required for M2 polarization, M2 macrophages ex-
press significant levels of the adenosine-generating ecto-
nucleotidases CD39 and CD73, both on mRNA and
protein level (Fig. 6). This is in line with recent reports on
CD73 expression by murine MDSC which were also
shown to suppress immune responses in an adenosine-
dependent way [19, 39, 40]. Moreover, CD14+ cells iso-
lated from OvCA ascites also showed much higher levels
of CD39 and, in particular, CD73 than macrophages from
non-malignant control ascites (Fig. 2). Interestingly, similar
findings were also reported in a most recent publication
describing an IL-27 dependent induction of CD39 on mac-
rophages in ovarian cancer patients [60]. Using a reporter
gene assay developed in our laboratory [45], we could then
confirm that the amount of biologically active adenosine
generated by M2 macrophages was similar to the levels
produced by OvCA cells [7], i.e., in the low micromolar
range (Fig. 4) and thus 30-60-fold higher than the already
immunosuppressive levels from Treg [45]. Consequently,
co-culture experiments also confirmed that M2 macro-
phages exert strong anti-proliferative effects on activated
CD4+ T cells. Importantly, T cell proliferation was largely
restored when CD39 or CD73 were blocked by ARL67156
or APCP, respectively, thereby confirming the pivotal role
of adenosine in the observed T cell inhibition (Fig. 7).
Fig. 6 Macrophages from in vitro co-culture with OvCA cells While these data show that ectonucleotidase expres-
generate adenosine via CD39 and CD73. Human macrophages were sion by myeloid cells may be functionally relevant, an
generated and polarized in transwell coculture with OAW-42 OvCA
cells. For control purposes, M1 macrophages were induced with
attribution to either MDSC or TAM was not attempted
LPS (10 μg/ml) and IFN-γ (1 μg/ml). After coculture with ADORA2A- in our study. As monocytic MDSC which are predomin-
overexpressing, RIP1-CRE transfected sensor cells, a luciferase-based ant in tumor tissues [28, 29] tend to rapidly differentiate
reporter assay was performed to determine production of biologically into TAM [61], discrimination between these cell types
active adenosine [45]. To confirm that adenosine generation depends is difficult and gradual. Polymorphonuclear MDSC, in
on ectonucleotidase activity, CD39 was blocked with ARL67156 (MФ
(Co-culture) + ARL) during coculture. Likewise, CD73 was inhibited by
contrast, do not develop into TAM and should thus be
APCP (MФ (Co-culture) + APCP) and to inactivate both ectonucleotidases, seen as different cell population [62]. Using common
ARL67156 and APCP were also combined (MФ (Co-culture) + ARL + myeloid markers, immunohistochemical analysis of solid
APCP). To the control groups (MФ (Co-culture) and MФ (IFN-γ + LPS)), ovarian tumor tissue failed to show a co-localization of
only the solvent DMSO was added (n = 3). Significance levels were CD73 with CD68 (Fig. 3f ). CD39, in contrast, could be
determined by Student’s t-test. p-values < 0.01 were considered as
highly significant (**)
co-stained with the macrophage marker IBA-1 (Fig. 3e).
While the limited sensitivity of immunohistochemical
analysis may also contribute to the apparent lack of
easily available human myeloid cells and co-cultured CD73 on TAM or MDSC in solid ovarian cancer tissue,
them with ovarian cancer cells, thereby mimicking the expression of ectonucleotidases on myeloid cells may
maturation and M2 differentiation of myeloid cells in the also be context-dependent and could require e.g., in-
tumor microenvironment [43]. CD14+ cells derived from flammatory stimuli as found in ascites or under in vitro
ascites (Fig. 2) were used ex vivo to corroborate the in conditions. Still, both CD39 and CD73 were detected on
vitro findings. Based on these cellular model systems, we both tumor and stromal cells in ovarian cancer tissue
could show that OvCA-derived adenosine exerts direct or and prominent expression was found on endothelial cells
indirect chemotactic effects on human monocytes (Fig. 4) from the tumor vasculature. Infiltrating immune cells
and is thus likely to attract myeloid precursor cells to- may thus be already exposed to adenosine during transmi-
wards the tumor tissue. Moreover, in a microenvironment gration into the tissue. Further, recruitment of macrophage
that is shaped by OvCA cells, human monocytes differen- precursor cells via adenosine-dependent chemotaxis may
tiate into M2-polarized macrophages or TAM (Fig. 5) be particularly efficient when adenosine is generated at the
which express IL-10 rather than IL-12 and show arginase tumor-vessel interface. The partial co-expression between
activity. While signalling via the A2A adenosine receptor CD39 and IBA-1+ cells is certainly insufficient to fullyMontalbán del Barrio et al. Journal for ImmunoTherapy of Cancer (2016) 4:49 Page 12 of 16
J Immunother Cancer: first published as 10.1186/s40425-016-0154-9 on 16 August 2016. Downloaded from http://jitc.bmj.com/ on May 1, 2021 by guest. Protected by copyright.
Fig. 7 “TAM-like” macrophages suppress CD4+ T cell proliferation via a CD39 and CD73-dependent mechanism. Polarized macrophages were
generated in co-culture with OAW-42 OvCA cells whereas M1 macrophages were induced by treatment with LPS and IFN-γ. CD4+ T cells were
isolated from healthy volunteers and stained with CFSE before activation with plate-bound anti-CD3 and soluble anti-CD28 antibodies. Activated
CFSE+ CD4+ T cells were then co-incubated with M2 macrophages in the absence (T + MФ (Co-culture)) or presence of CD39 or CD73-inhibitors
ARL67156 (T + MФ (Co-culture) + ARL) or, respectively, APCP (T + MФ (Co-culture) + APCP), or a combination of both (T + MФ (Co-culture) + ARL +
APCP). T cell proliferation was determined by flow cytometry via CFSE dilution, as described previously [7] (n = 3, ** indicates p < 0.01 as assessed
by unpaired, two-sided Student’s t-test). While a representative histogram is shown in a, mean values from three independent experiments are
depicted in (b)
account for the strong correlation between macrophage- As this study aimed at establishing a link between
specific genes and ectonucleotidase expression (Additional adenosine and myeloid cells in the tumor microenviron-
file 2: Table S1 and Additional file 3: Table S2) or for the ment, the mechanism responsible for the adenosine-
highly significant association between CD39, CD73 and the dependent recruitment of monocytes towards tumor
KEGG data set for antigen processing and presentation cells was not investigated in detail. In the literature, di-
(Additional file 4: Table S3). An additional adenosine- verse effects of adenosine on cell migration have already
dependent recruitment of myeloid cells to the tumor been reported: While ATP enhances the non-directional
microenvironment may therefore also have contributed to motility of monocytes [63], degradation of ATP to adeno-
the strong correlations found by unbiased transcriptome sine by CD39 was found to promote the chemotactic mi-
analyses from 285 ovarian cancer tissues. gration of myeloid cells in a modified Boyden chamberMontalbán del Barrio et al. Journal for ImmunoTherapy of Cancer (2016) 4:49 Page 13 of 16
J Immunother Cancer: first published as 10.1186/s40425-016-0154-9 on 16 August 2016. Downloaded from http://jitc.bmj.com/ on May 1, 2021 by guest. Protected by copyright.
assay. Consequently, chemotaxis of CD39-deficient mono- for other diseases: APCP was found to be highly beneficial
cytes/macrophages was impaired [64]. As this effect could in a mouse melanoma model [72] whereas the CD39-
also be rescued by addition of NECA, it is fully consistent inhibitor ARL67156 has shown promise for the treatment
with our observations made with ARL67156 and NECA. of hepatic insulin resistance [73]. Thus, such inhibitors
Similar findings on adenosine and cell migration were might also become available for the clinical treatment of
reported for neutrophils and initially attributed to the in- malignant diseases. Based on previous findings and on the
volvement of the A2 adenosine receptor [65]. Later, an data outlined in this manuscript, there certainly is a strong
addtitional and possibly stronger contribution from the rationale for a potential use of ectonucleotidase inhibitors
A1 adenosine receptor was described [66]. In a more com- in the immunotherapeutic treatment of ovarian cancer.
plex system involving a pericellular matrix and smooth
muscle cells, adenosine also promoted the migration of Additional files
monocytes/macrophages and their trapping in the intersti-
tial matrix. This, however, was ascribed to an indirect ef- Additional file 1: RT² Profiler PCR array for human chemokines &
receptors. (DOCX 184 kb)
fect caused by hyaluronic acid synthase being induced via
Additional file 2: Table S1. KEGG pathway analysis using the R2
the A2B, A2A and A3 adenosine receptors, with different pathway finder. List of pathways significantly correlated with the
kinetics for each receptor [67]. Without agreeing on a sin- expression of CD39 or CD73 and their respective p values. (DOCX 15 kb)
gle mode-of-action, various reports have thus already de- Additional file 3: Table S2. Analysis of the antigen processing and
scribed direct and indirect pro-migratory effects of presentation pathway and gene-wise correlation with the expression of
CD39 (ENTPD1) and CD73 (NT5E). Out of 57 genes linked to this pathway
adenosine on monocyte. Consistent with its overall anti- 42 genes show correlation with CD39 and 41 genes correlate with CD73.
inflammatory effect, adenosine may, in contrast, also re- (DOCX 15 kb)
duce the migration of pro-inflammatory cell types [68]. Additional file 4: Table S3. Gene expression correlation analysis.
This may also apply to activated monocytes and microglia Correlation between CD39 (ENTPD-1) or CD73 (NT5E) and phenotypic
markers on human myeloid cells. Gene expression data from 285 ovarian
which were reported to migrate less in response to activa- cancer tissues from the AOCS (Australian Ovarian Cancer Study) were
tion of the A3 adenosine receptor [69]. Adenosine was screened for genes correlating with the presence of CD39 (ENTPD-1) or
further found to slow the migration of dendritic cells [70] CD73 (NT5E). Pairwise correlation analyses indicated positive correlations
between almost all phenotypical markers described for MDSC (Talmadge
and to inhibit transendothelial migration of conventional and Gabrilovich, 2013) and the ectoenzymes CD73 and CD39. (DOCX 14 kb)
T cells via an indirect monocyte-dependent mechanism
[71]. While these divergent effects may be due to cell type Abbreviations
and activation state-dependent expression patterns of (R-)PE, R-phycoerithrin; ADORA2A, adenosine receptor 2A; APCP, α,β-methyle-
adenosine receptors A1, A2A, A2B and A3, the analysis of neadenosine-5′-diphosphate; ARL67156, 6-N,N-Diethyl-D-β,γ-dibromomethy-
leneATP trisodium salt; CCL, CC-chemokine ligand; CFSE, carboxyfluorescein
receptor distribution is hampered by the lack of suitable diacetate succinimidyl ester; CI, confidence interval; CRE, cAMP responsive
antibodies against the individual receptor subtypes. Still, it element; CXCL, CXC-chemokine ligand; DAB, diaminobenzidine; DMSO,
appears clear that adenosine can affect cell migration via dimethyl sulfoxide; ENTPD1, ectonucleoside triphosphate diphosphohydrolase
1; FITC, Fluorescein isothiocyanate; GRO-γ, growth regulated oncogene gamma;
direct and indirect mechanisms involving different adeno- hrp, horseradish peroxidase; IBA1, ionized calcium-binding adapter molecule 1
sine receptors depending on cell type, assay and kinetics. (also known as Allograft inflammatory factor 1 (AIF-1)); IDO, indoleamine-2,3-
dioxygenase; KEGG, Kyoto encyclopedia of genes and genomes; LPS,
lipopolysaccharide; Luc, firefly (photinus pyralis) luciferase; MDSC, myeloid-
Conclusion derived suppressor cells; NECA, adenosine-5′-N-ethylcarboxamide; NK, natural
Our findings that human monocytes are attracted by ad- killer (cells); OvCA, ovarian cancer; PBMC, peripheral blood mononuclear cells;
enosine while M2 macrophages can contribute to local RIP1, rat insulin 1 gene promoter; RL, renilla reniformis luciferase; ROS, reactive
oxygen species; SCH58261, 5-Amino-7-(2-phenylethyl)-2-(2-furyl)-pyrazolo(4,3-e)-
immunosuppression via adenosine generation suggest a 1,2,4-triazolo(1,5-c)pyrimidine; TAM, tumor associated macrophages; Treg,
self-amplifying mechanism: Similar to what has already regulatory T cells
been described in mice [40] and what needs to be fur-
Acknowledgement
ther explored in vivo, tumor-derived adenosine might We thank Evi Horn and Birgitt Fischer for excellent technical assistance.
promote recruitment of further adenosine-generating
cells towards the microenvironment in human cancer Funding
This work was supported by a grant (Z3_10) awarded by the Interdisciplinary
patients. Infiltration with MDSC or TAM would then be
Center for Clinical Research (IZKF) Würzburg, Josef-Schneider-Stasse 4, 97080
both a consequence and a further source of tumor-derived Würzburg to Sebastian Häusler.
adenosine. This might further explain the very potent
effects observed with anti-CD73 and anti-ADORA2A di- Availability of data and material
The datasets analysed during the current study are available from the
rected strategies in animal tumor models [8, 10, 55] – and corresponding author upon reasonable request.
it could show a new strategy to interfere with MDSC,
TAM and their tumor-promoting role in ovarian cancer. Authors’ contributions
The study was designed and guided by JW and SFMH, with support from JD
Importantly, the substances we used to specifically block (Dietl). Experiments were performed by IMdB, CP, LS, SFMH and RS, MBL and
CD39 and CD73 activity are already being tested in vivo MM planned and supervised individual experiments. IMdB, CP, LS, RS, JDYou can also read