SAETTA: high-resolution 3-D mapping of the total lightning activity in the Mediterranean Basin over Corsica, with a focus on a mesoscale ...
←
→
Page content transcription
If your browser does not render page correctly, please read the page content below
Atmos. Meas. Tech., 12, 5765–5790, 2019
https://doi.org/10.5194/amt-12-5765-2019
© Author(s) 2019. This work is distributed under
the Creative Commons Attribution 4.0 License.

SAETTA: high-resolution 3-D mapping of the total lightning activity
in the Mediterranean Basin over Corsica, with a focus
on a mesoscale convective system event
Sylvain Coquillat1 , Eric Defer1 , Pierre de Guibert1 , Dominique Lambert1 , Jean-Pierre Pinty1 , Véronique Pont1 ,
Serge Prieur1 , Ronald J. Thomas2 , Paul R. Krehbiel2 , and William Rison2
1 Laboratoire d’Aérologie, Université Toulouse 3 Paul Sabatier, CNRS, Toulouse, France
2 Langmuir   Laboratory for Atmospheric Research, New Mexico Tech, Socorro, New Mexico, USA

Correspondence: Sylvain Coquillat (sylvain.coquillat@aero.obs-mip.fr)

Received: 9 May 2019 – Discussion started: 17 May 2019
Revised: 16 September 2019 – Accepted: 23 September 2019 – Published: 4 November 2019

Abstract. Deployed on the mountainous island of Corsica          to some high-precipitation events. Finally we report lightning
for thunderstorm monitoring purposes in the Mediterranean        observations of unusual high-altitude discharges associated
Basin, SAETTA is a network of 12 LMA (Lightning Map-             with the mesoscale convective system of 8 June 2015. Most
ping Array, designed by New Mexico Tech, USA) stations           of them are small discharges on top of an intense convec-
that allows the 3-D mapping of very high-frequency (VHF)         tive core during convective surges. They are considered in
radiation emitted by cloud discharges in the 60–66 MHz           the flash classification of Thomas et al. (2003) to be small–
band. It works at high temporal ( ∼ 40 ns in each 80 µs time     isolated and short–isolated flashes. The other high-altitude
window) and spatial (tens of meters at best) resolution within   discharges, much less numerous, are long-range flashes that
a range of about 350 km. Originally deployed in May 2014,        develop through the stratiform region and suddenly undergo
SAETTA was commissioned during the summer and autumn             upward propagations towards an uppermost thin layer of
seasons and has now been permanently operational since           charge. This latter observation is apparently consistent with
April 2016 until at least the end of 2020. We first evaluate     the recent conceptual model of Dye and Bansemer (2019)
the performances of SAETTA through the radial, azimuthal,        that explains such an upper-level layer of charge in the strat-
and altitude errors of VHF source localization with the the-     iform region by the development of a non-riming ice colli-
oretical model of Thomas et al. (2004). We also compute on       sional charging in a mesoscale updraft.
a 240 km × 240 km domain the minimum altitude at which a
VHF source can be detected by at least six stations by tak-
ing into account the masking effect of the relief. We then
report the 3-year observations on the same domain in terms       1   Introduction
of number of lightning days per square kilometer (i.e., to-
tal number of days during which lightning has been detected      Lightning is a multiscale phenomenon that occurs at the end
in a given 1 km square pixel) and in terms of lightning days     of a chain of dynamical and microphysical processes that act
integrated across the domain. The lightning activity is first    throughout the formation and the lifetime of a thunderstorm
maximum in June because of daytime convection driven by          cloud. The key processes are low-level convergence of moist
solar energy input, but concentrates on a specific hot spot      air, convection, liquid and solid condensation of water va-
in July just above the intersection of the three main val-       por, latent heat release, interactions between cloud particles,
leys. This hot spot is probably due to the low-level conver-     and precipitation, all resulting in cloud electrification. Light-
gence of moist air fluxes from sea breezes channeled by the      ning acts as a relaxation and a limiter of the electric field
three valleys. Lightning activity increases again in Septem-     resulting from the cloud electrification due to microphysical
ber due to numerous small thunderstorms above the sea and        interactions, especially by the noninductive charging process

Published by Copernicus Publications on behalf of the European Geosciences Union.
5766                                                                            S. Coquillat et al.: SAETTA lightning imager

during graupel–ice crystal collisions (see Saunders, 2008). It     can spread over time, generating torrential floods, especially
can therefore be considered a bulk tracer of the intense con-      in autumn (Lambert and Argence, 2008; Scheffknecht et al.,
vection or a proxy of each of the cloud processes mentioned        2016, 2017). The deployment of the LMA in this area will
above provided it is observed at high spatial and time resolu-     allow us to address scientific issues related to stormy con-
tions.                                                             vection in a complex maritime and mountain environment,
   Various lightning detection systems have been used so           where fine-scale processes make its forecast trickier. Sea,
far in operational mode or for scientific research purposes.       valley, and slope breezes are expected to play a key part in
Most of them are designed to detect the electromagnetic            the triggering of convection (Barthlott and Kirshbaum, 2013;
field radiated by lightning in the low-frequency (LF; 30–          Tidiga et al., 2018). The influence of mid- and upper-level
300 kHz) and very low-frequency (VLF; 3–30 kHz) ranges.            synoptic fluxes on these local dynamical features can even
Those ones (e.g., Euclid-Météorage, ATDnet, and ZEUS in            complicate the process (Ducrocq et al., 2008); meanwhile
Europe; NLDN in the USA; or WWLLN worldwide) can lo-               low-level fluxes are continuously carrying humid air from the
calize at rather long range the ground impact of the return        surrounding sea (Adler et al., 2016).
stroke that is the most powerful phase of a cloud-to-ground           The initial deployment of SAETTA in Corsica took place
(CG) lightning flash, or it can localize intracloud discharges     in May 2014. SAETTA functioned operationally from July
in 2-D. The networks do not yet provide comprehensive in-          to October in 2014 and from April to December in 2015, and
formation on the thunderstorm cell by which the lightning          has been in permanent operation since April 2016 until at
flashes are produced. Some detection systems such as the           least the end of 2020. It is planned to operate well into the
LMA (Lightning Mapping Array of the New Mexico Tech;               future in order to obtain long-term observations for issues
see Thomas et al., 2004) are designed to observe lightning in      related to climatic trends. So far, SAETTA has documented
the very high-frequency (VHF; 30–300 MHz) range, which             lightning activity from the regional scale to the flash scale,
allows detection of the lightning leader phases and mapping        providing a monthly climatology showing different trends
of the lightning branches inside the cloud. This provides in-      from one month to the next, but also specific observations
formation on lightning closely linked with the microphysical       of lightning of all types – including unusual flashes showing
structure of the cloud in which the discharges propagate.          a jump towards the top of the cloud in its trailing stratiform
   In the frame of the HyMeX program (Ducrocq et al.,              region – and even inverted dipolar structures.
2014), which aims at documenting the water cycle in the               In the following, we first present the SAETTA network and
Mediterranean Basin that is considered a climatic hot spot         its performances in Sect. 2, then describe the overall obser-
(Giorgi, 2006), we plan to monitor the convection to ad-           vations performed from 2014 to 2016 in Sect. 3, describe in-
dress the question about the evolution of high-precipitation       sight into specific and unusual events detected so far at storm
events and deep convection in response to climate change.          and lightning scales in Sect. 4, and discuss the perspective
For this purpose, the Collectivité Territoriale de Corse – via     of such an instrument with respect to the scientific questions
the PCOA (CORSiCA Atmospheric Observations Platform,               addressed and to the operational needs for ground-based and
https://corsica.obs-mip.fr/, last access: 23 October 2019) –       spaceborne lightning observations. Several results presented
gave us the opportunity to equip Corsica with a LMA net-           benefited from the use of the XLMA software developed by
work that is considered a reference for the accurate detection     Ron Thomas (Thomas et al., 2003), which was used as an
of total lightning activity. The instrument is called SAETTA,      analysis and display tool.
which is the abbreviation of “Suivi de l’Activité Electrique
Tridimensionnelle Totale de l’Atmosphère” (monitoring of
the total tridimensional electrical activity of the atmosphere)    2   The SAETTA network
that means “lightning” in the Corsican language. In combina-
tion with the CG observation of Météorage (the French part         The SAETTA network consists of 12 LMA stations (Light-
of the Euclid network), this setup provides a comprehensive        ning Mapping Array, developed by New Mexico Tech, USA),
description of the total lightning activity.                       which allow the mapping of lightning flashes in three dimen-
   As a matter of fact, Corsica has a complex and tortuous re-     sions in real time, at high temporal and spatial resolutions,
lief, with mountainous massifs made up of more than a hun-         within a range of about 350 km centered on Corsica. Actu-
dred summits, culminating at more than 2000 m altitude, lo-        ally, each station independently detects – in the 60–66 MHz
cated only a few kilometers from the coasts. Thus it is often      bandwidth – the impulsive radio frequency radiations pro-
described as “a mountain in the sea”. Another important as-        duced by the leader phase of lightning flashes and accurately
pect is the upwind sea surface evaporation forced by synoptic      measures the time of arrival of the signals thanks to an accu-
flows (Adler et al., 2016; Scheffknecht et al., 2016). These       rate time base provided by a GPS receiver. Hence, a leader
characteristic features of the mountainous island explain the      segment – so-called VHF source hereafter – that emits an im-
torrential nature of the rivers of Corsica. The climatic partic-   pulsive radiation from the position (x, y, z) and at the time t
ularities related to its geographical position combined with       detected by at least four stations of the network can be fairly
its specific relief generate very violent precipitation which      accurately located and dated using the time of arrival (TOA)

Atmos. Meas. Tech., 12, 5765–5790, 2019                                              www.atmos-meas-tech.net/12/5765/2019/
S. Coquillat et al.: SAETTA lightning imager 5767
technique (see Appendix A in Thomas et al., 2004). As a 2.1 Location of the SAETTA stations
matter of fact, a minimum of six stations are required in the
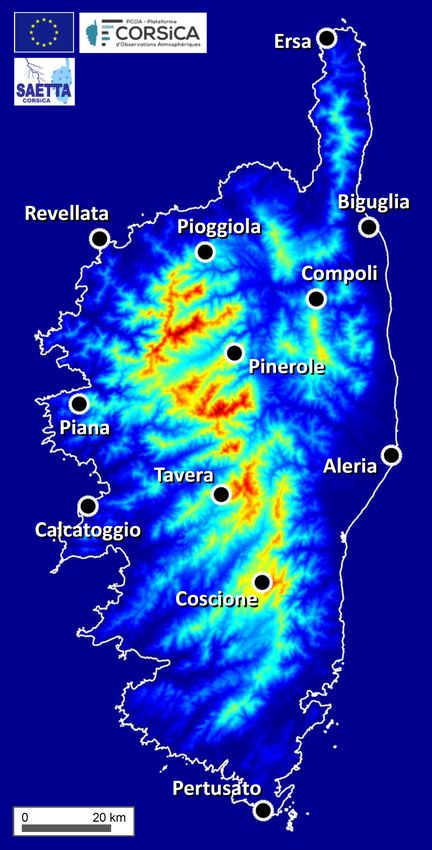
data processing although only four unknowns (x, y, z, t) are The 12 SAETTA stations are spread over an area about 70 km
to be determined for each VHF source. This consideration of in the west–east direction and about 180 km in the south–
redundant measurements is useful for checking the solution’s north direction (see Fig. 1). The distances between two sta-
validity. tions vary from 20.7 to 180.8 km, with an average value
Several advantages arise from a 12-station network: for of 67.3 km. This geographic configuration is unique to the
instance, the redundancy/reliability in the case of short- SAETTA network compared to the other LMA networks; i.e.,
term and long-term failures, the effect of localized high-rate SAETTA is a relatively large network for almost the same
storms on a sensor’s contribution to more-distant activity, and number of stations. By comparison, the New Mexico Tech
the improved geometry for geo-location of distant lightning LMA network (see Thomas et al., 2004) is constituted of
while maintaining height accuracy for nearby low-altitude 13 stations with a minimum distance between them of about
lightning channels. Another advantage would be that more 12 km, a maximum of about 76 km, and an average of 36 km,
VHF sources can be located during a given discharge be- which is approximately half of SAETTA characteristics.
cause two different sets of six stations can detect sources in This configuration dates back to 2016. In the previous two
the same time window. Nevertheless, during a high-flash-rate years 2014 and 2015, the stations now located in Ersa and
period or during spread and very active events, each lightning in Pertusato (the northern and southern ends of the network,
flash is logically less well sampled since sources emitted by respectively), were located in Foce di Bilia on a hill 35 km
numerous different lightning flashes compete to be detected northwest of Pertusato station and in Pinarellu on the roof
by the two sets of six stations in the same time windows. of the Genoese tower of Pinarellu Island, 27 km southeast
A comprehensive description of the operation of LMA sta- of Coscione station. This change was made because the for-
tions is available in Appendix A of Thomas et al. (2004). As mer sites had not been entirely satisfactory in terms of noise
in all LMA systems, each SAETTA station is configured to level and functionality. In this previous configuration, the dis-
record on an internal disk the amplitude and the arrival time tances between two stations varied from 20.7 to 118.0 km,
of the strongest radiation event – above an adjusted detection with an average value of 59.8 km. Thus, the new configura-
threshold – which it detects and digitizes in each time win- tion has led to an extension of the network in the south–north
dow of 80 µs. The accurate time of arrival is obtained thanks direction.
to a GPS receiver (timing error of about 12 ns) that controls The stations are located on sites as remote as possible from
the frequency of a 25 MHz oscillator allowing the data ac- any electromagnetic pollution, with the widest possible field
quisition with a theoretical 40 ns time resolution within each of view of the sky (LMA is line of sight, so it only detects
80 µs time window (see Thomas et al., 2004, for explana- sources above the horizon), and with proper access to the
tion about the actual time resolution). The data are collected GSM mobile phone network. The choice of sites faced two
on site at each station by changing the internal disks, which challenges: (i) put as many stations aloft to maximize the
are brought back to the Laboratoire d’Aérologie in Toulouse power of detection by avoiding any masking effect by the
(France) to implement the calculation of the 3-D position of relief and (ii) find accessible sites, these two objectives be-
the VHF sources. In addition, each station is connected by ing most often antithetical. Basically, five stations are located
wireless communication links via a modem and a GSM an- on the summit of relatively high mountains along the main
tenna in order (i) to monitor and control the station operation south–north dorsal ridge; the rest are installed on the out-
by displaying a large amount of information (e.g., the detec- skirts of Corsica, more or less close to the sea in relatively
tion threshold, the filling rate of the internal disk, the battery high and unobstructed places. This configuration makes it
voltage, the load current from the solar panel) and (ii) to send possible to detect VHF sources at low altitude by at least six
decimated data in real time (temporal resolution degraded to stations on either side of the central mountain range of the is-
400 µs and with higher detection threshold) to a central cal- land. It nevertheless has a disadvantage in winter conditions
culator for real-time processing and display, with about 1 min since the high-altitude stations can be covered with snow and
of delay (http://lma.aero.obs-mip.fr/temps_reel.html, last ac- automatically put into hibernation during this period.
cess: 23 October 2019). During specific periods such as a Consequently, the SAETTA network has another unique
measurement campaign, the time window of the recorded configuration: the altitude range of the SAETTA stations (see
data can be reduced to 10 µs and the detection threshold of Table 1) is much wider than that of most other networks,
the decimated data sent by telephony can be reduced too, particularly in the USA. The gap between the maximum
both remotely. The main advantage of reducing the time win- and the minimum altitudes reaches 1946.4 m. By compari-
dow is to allow detection of more VHF sources during fast son, the equivalent gap is less than about 520 m for the Ok-
lightning processes like, for example, dart leaders that typi- lahoma LMA, less than about 460 m for the New Mexico
cally last only a few hundred microseconds and therefore are Tech LMA used during the STEPS campaign in Colorado
not well sampled with an 80 µs time window. and Arkansas, and equal to 335.4 m for the north Alabama
LMA (see Koshak et al., 2004). The SAETTA configuration
www.atmos-meas-tech.net/12/5765/2019/ Atmos. Meas. Tech., 12, 5765–5790, 2019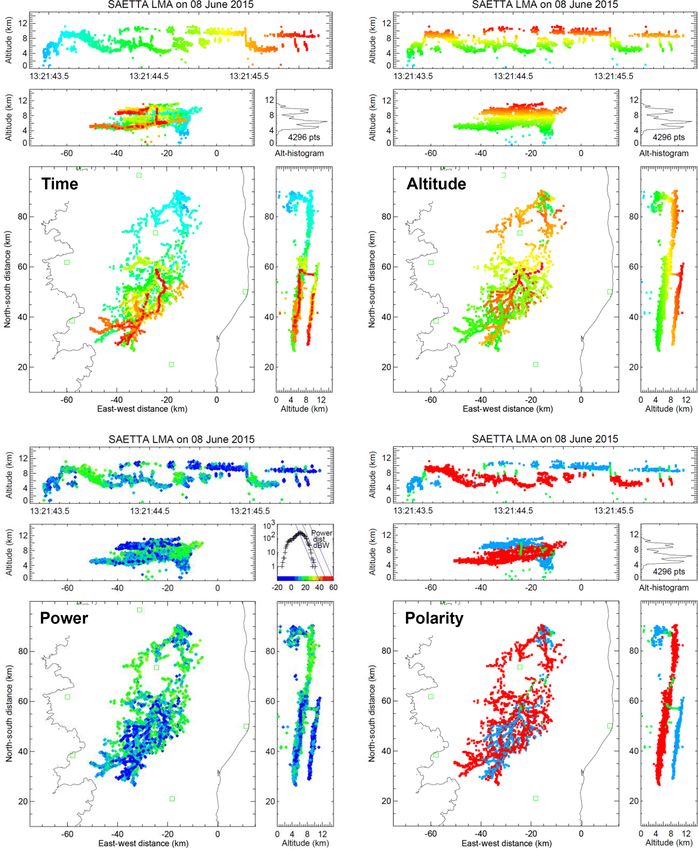
5768                                                                              S. Coquillat et al.: SAETTA lightning imager

                                                                   Table 1. Altitude above mean sea level (m) of the 12 SAETTA sta-
                                                                   tions during the first period from 2014 to 2015 (third column) and
                                                                   since 2016 when three stations were moved (fourth column). The
                                                                   vertical difference is the difference in altitude between the highest
                                                                   and the lowest stations.

                                                                                                            Altitude (m a.m.s.l.)
                                                                         Site   Site name                 2014–2015     2016–today
                                                                         A      Biguglia                        3.8             3.8
                                                                         B      Aléria                         36.4            36.4
                                                                         C      Pioggiola                    1281.4          1281.4
                                                                         D      Revellata                     162.0
                                                                         E      Calcatoggio                   346.2           346.2
                                                                         F      Foce di Bilia                 551.4
                                                                         G      Piana                         823.2           823.2
                                                                         H      Tavera                       1648.2          1648.2
                                                                         I      Compoli                      1237.9          1237.9
                                                                         J      Pinerole                     1950.2          1950.2
                                                                         K      Coscione                     1746.8          1746.8
                                                                         L      Pinarellu                      65.3
                                                                         M      Pertusato                                     104.1
                                                                         N      Ersa                                          357.5
                                                                         O      Revellata                                     167.2
                                                                                Vertical difference (m)      1946.4          1946.4

                                                                   horizontal (5 km) and vertical (500 m) resolutions are rather
                                                                   weak because the calculations are very time-consuming, but
                                                                   the maps give a good idea of the SAETTA detection capa-
Figure 1. Map of Corsica with the location of the 12 SAETTA sta-   bility. Most of the VHF sources can be detected above about
tions since 2016.                                                  1 km or less on the west and east sides of the island, above 2
                                                                   to 3 km over and north of Corsica, and only above 4 to 5 km
                                                                   beyond 100 km from the center of the island in seven sectors
thus possesses a significant vertical baseline. According to       in the south and southeast of Corsica. In winter conditions,
Thomas et al. (2004) and Koshak et al. (2004), this char-          the detection capability deteriorates significantly, especially
acteristic is expected to allow for a better determination of      in the southwest where it is impossible to detect sources be-
the VHF source altitude for distant sources. This point is ad-     low 7–8 km. Anywhere else, 5 km seems to be the average
dressed hereafter in Sect. 2.3.                                    minimum altitude in winter, except in the NW and NE cor-
                                                                   ners of the sea domain where low levels can still be scruti-
2.2    Geometric capability of VHF source detection by             nized. For longer-range observation up to about 350 km from
       SAETTA                                                      the center of the network, see Sect. 3.1. One must keep in
                                                                   mind that atmospheric refraction is not taken into account in
In order to give an idea of the capability of VHF source de-       the calculations; consequently the altitudes calculated here
tection by SAETTA, the minimum altitude at which a VHF             overestimate the real minimum altitudes of VHF source de-
source can be directly seen by at least six SAETTA stations        tection. Actually, electromagnetic waves propagating in the
was computed, with the complete network on the one hand            clear sky are deflected downwards because of the refrac-
and with the three highest-altitude stations turned off (be-       tive index gradient, which is most often directed downward.
cause of snow cover in winter conditions) on the other hand.       Therefore, VHF sources can be detected even below the lim-
The details of the calculation, which takes into account the       its indicated in Fig. 2.
roundness of the Earth but not the atmospheric refraction, are
presented in Appendix A. The results are displayed as maps         2.3       Location accuracy of the SAETTA network
in Fig. 2. The considered domain is 240 km × 240 km cen-
tered on the Pinerole station, which is the highest of the net-    With regard to the uncertainty of localization of VHF sources
work (1950 m). This domain corresponds to the field of better      by the SAETTA network, reference can be made to the arti-
detection accuracy by SAETTA (see Sect. 2.3). The chosen           cle by Thomas et al. (2004), who evaluated both theoretically

Atmos. Meas. Tech., 12, 5765–5790, 2019                                                 www.atmos-meas-tech.net/12/5765/2019/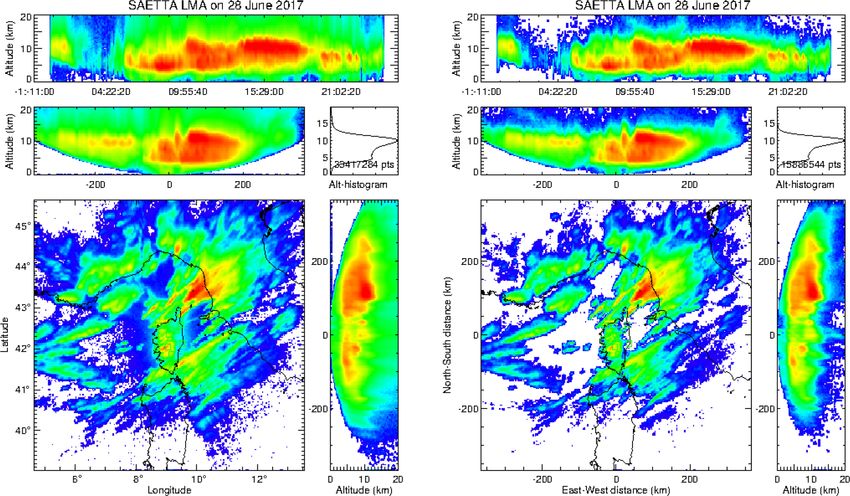
S. Coquillat et al.: SAETTA lightning imager                                                                                            5769

Figure 2. Capability of VHF source detection by the SAETTA network in the 240 km × 240 km domain of better detection accuracy centered
on Corsica: minimum altitude of direct vision by at least six stations of the network. (a) Full network with 12 stations (red squares).
(b) Network with the three highest stations off (e.g., because of snow cover in winter). Isocontours at 1000 m altitude are indicated by black
lines. Horizontal resolution: 5 km; vertical resolution: 500 m.

and experimentally the location accuracy of the LMA used                 stations, and displayed in Fig. 3. The azimuthal errors, which
during the STEPS 2000 experiment (Lang et al., 2004). They               correspond to the central graphs, exhibit lower values in the
found that short-duration pulses emitted by a VHF trans-                 west–east direction. Furthermore, the comparison between
mitter carried by a sounding balloon between 6 and 12 km                 the 2014–2015 network and the 2016 network configurations
altitude over the central part of the network were located               confirms that the larger the south-to-north extension of the
with an accuracy of about 6–12 m in the horizontal position              network, the lower the errors are in the west–east direction.
and about 20–30 m in height, in the optimal situation. They              The same behavior can be pointed out from Fig. 3 for the
also developed a geometrical model the results of which                  range error since it also depends on the transverse extent ac-
were in good agreement with experimentally observed errors               cording to Thomas et al. (2004). One can turn his attention
from a sounding balloon and from aircraft tracks. Koshak                 to the fact that the theoretical errors are calculated here for
et al. (2004) also addressed the problem of location accu-               sources located at 10 km altitude and detected by 12 stations.
racy of the LMA by developing a source retrieval algorithm               This is the best case for comparing networks. But if we con-
for theoretically studying the location errors. More recently,           sider lower sources, the errors will increase, especially at a
Chmielewski and Bruning (2016) have explored location er-                low level where sources cannot be detected by numerous sta-
rors and detection efficiency of various LMA networks in                 tions because of the masking effect of the relief.
the United States by means of model simulations based on                    The geometrical model also predicts that the slant range r
methods previously developed by Koshak et al. (2004) and                 and altitude z uncertainties increase versus r 2 while the az-
Thomas et al. (2004).                                                    imuth uncertainty more slowly increases versus r (see Fig. 12
   The geometric model of Thomas et al. (2004) is therefore              in Thomas et al., 2004). This behavior is illustrated in Fig. 3:
a suitable tool for evaluating the SAETTA network perfor-                far from the network, the geographical error gradient is much
mances. It provides analytical formulations of the increase in           higher for range and altitude determination (left and right
the source location uncertainties with distance, based on the            graphs, respectively) compared to the relatively small ge-
spherical coordinates (r, θ , φ) of a VHF source relative to             ographical error gradient of azimuth determination (central
the center of the network. For example, the azimuth angle φ              graphs). The azimuth is best determined and the correspond-
is determined primarily by stations having the greatest sepa-            ing errors are the smallest. Looking into detail at Fig. 3 for
ration transverse to the propagation line of the signal emitted          the 2016 network, the theoretical errors can be evaluated,
by the sources. Therefore, the more extended the network is              for example, about 50 km from the center of the network
in any direction, the better the determination of the azimuth            and compared with that of the STEPS network according to
angle φ. Given the larger extension of the SAETTA network                Fig. 12 of Thomas et al. (2004). According to Fig. 3, the ra-
in the south–north direction, azimuth angles are therefore ex-           dial, azimuthal, and 10 km altitude errors at 50 km from the
pected to be better determined in the west–east direction.               center of the SAETTA network are about 15, 8, and 40 m,
This is confirmed by the errors calculated with the geomet-              respectively. According to Fig. 12 of Thomas et al. (2004),
rical model, for VHF sources at 10 km altitude seen from 12              the radial, azimuthal, and altitude errors at 50 km from the

www.atmos-meas-tech.net/12/5765/2019/                                                        Atmos. Meas. Tech., 12, 5765–5790, 2019
5770                                                                                S. Coquillat et al.: SAETTA lightning imager

Figure 3. Radial, azimuthal, and altitude errors computed with the geometrical model of Thomas et al. (2004) for VHF sources located at
10 km altitude seen from 12 stations. (a, b, c) Initial SAETTA network in 2014 and 2015; (d, e, f) new SAETTA network since 2016. Station
locations are indicated by white squares.

center of the STEPS network are about 100, 16, and 80 m,               ences arise in regions beyond this radius, where the altitude
respectively (these values are the average values of the er-           error strongly increases for a flat network. Therefore, the ver-
rors in both the east–west and north–south directions, i.e.,           tical baseline due to having some stations at higher altitudes
black and red solid lines at the abscissa at 50 km). The com-          improves the accuracy for lightning detection over the main-
parison shows that theoretical errors seem less important for          land of Italy and France.
the SAETTA network, especially for the slant range r. The
greater horizontal extension D of the SAETTA network is
undoubtedly at the origin of this behavior since the theo-             3     Overall observation from 2014 to 2016
retical errors are inversely proportional to D according to
Thomas et al. (2004), and even inversely proportional to the           3.1    Typical lightning observation
square of D for the radial error.
   The SAETTA network possesses a significant vertical                 SAETTA is able to detect flash activity up to approximately
baseline that allows us to overcome the insufficient verti-            350 km from the center of the network (Pinerole station). An
cal separation among the stations that can be a source of              example of this large-scale detection is displayed in Fig. 5
error in the determination of the VHF sources’ altitude via            as VHF source density for the 28 June 2017 event. The left
the elevation angle θ, especially for distant sources (Thomas          graph corresponds to minimally filtered data (minimum of
et al., 2004; Koshak et al., 2004). In order to evaluate the           six stations and reduced chi-square χ 2 ≤ 5; see Thomas et
contribution of this vertical baseline to the localization ac-         al., 2004). It is composed of various panels according to the
curacy of VHF sources, the calculation of the altitude error           conventional XLMA format: altitude vs. time (top panel);
was first carried out for the SAETTA 2016 network over a               altitude vs. longitude or view from the south (center left
wide domain (300 km × 300 km), and a second time for the               panel); VHF sources altitude histogram (center right panel);
same network but considered flat with all the stations located         latitude vs. longitude or geographical projection (bottom left
at the same average altitude of 863 m. Displayed in Fig. 4,            panel); altitude vs. latitude or view from the west (bottom
the results confirm the above expectation for distant sources.         right panel). One can see in the vertical projections (cen-
Within a radius of about 150 km from the center of the net-            ter left and bottom right panels) that lower layers are poorly
work, the altitude errors are quite similar for both network           and even undocumented far from the network because of the
configurations (actual and flat networks). The main differ-            Earth roundness, as it is with meteorological radars. Unfortu-
                                                                       nately, locally generated noise events can lie close in time to

Atmos. Meas. Tech., 12, 5765–5790, 2019                                                   www.atmos-meas-tech.net/12/5765/2019/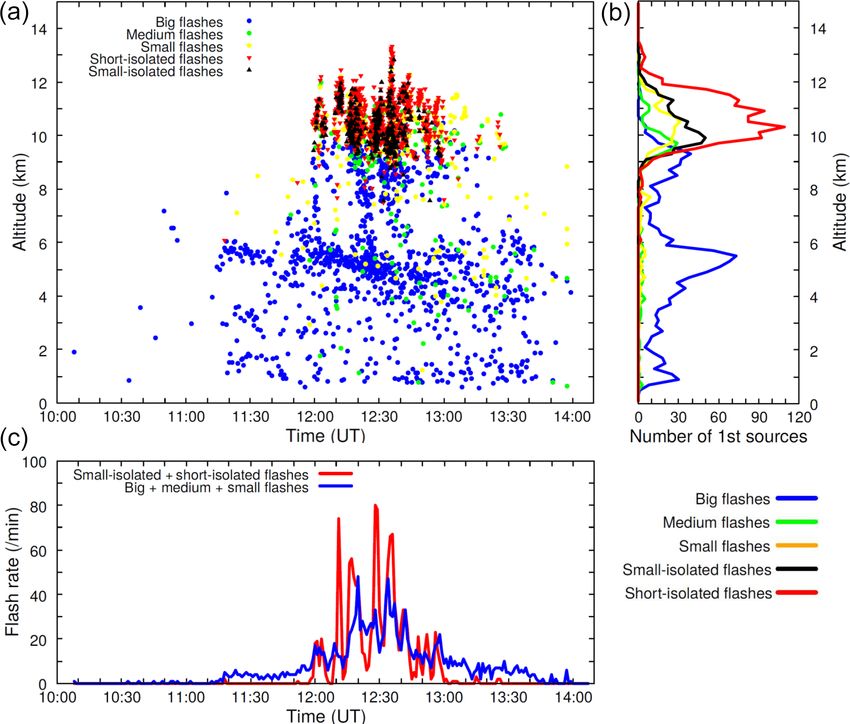
S. Coquillat et al.: SAETTA lightning imager                                                                                                 5771

Figure 4. Altitude error computed with the geometrical model of Thomas et al. (2004) for VHF sources at 10 km of altitude seen from 12
stations in a large domain: analysis for the 2016 network (a) and for the same network considered flat with an average altitude of about
863 m (b).

Figure 5. VHF sources detected by SAETTA during the storm event of 28 June 2017. Left: source density of unfiltered data with angular
projection (minimum of six stations, χ 2 ≤ 5). Right: source density of filtered data with Cartesian coordinate projection on the same domain
(minimum of seven stations, χ 2 ≤ 0.5). Composition of each graph: altitude vs. time (top); altitude vs. longitude or view from the south
(center left); VHF source altitude histogram (center right); latitude vs. longitude or geographical projection (bottom left); altitude vs. latitude
or view from the west (bottom right).

lightning events and therefore may be considered in the cal-                with a minimum of seven stations and with χ 2 ≤ 0.5. Those
culation of VHF source positions, producing slightly fuzzy                  values were determined empirically for SAETTA based on
lightning contours. The best way to minimize their impact                   several observations at different time and space scales. By
on observations is to restrict the sources to those located by              comparing the geographical projections (bottom left panels)
more than six stations with a better goodness of fit (i.e., lower           of the left and right graphs in Fig. 5, one can see that the
reduced chi-square). The right graph in Fig. 5 corresponds to               highest densities remain almost not affected by the filtering.
such filtered data: the VHF sources have been determined                    The same behavior is visible at lightning scale (not shown

www.atmos-meas-tech.net/12/5765/2019/                                                           Atmos. Meas. Tech., 12, 5765–5790, 2019
5772                                                                           S. Coquillat et al.: SAETTA lightning imager

here) where discharge channels remain very well described         3.2   Short lightning climatology over Corsica
and noisy sources are eliminated after filtering. From here on,
all the results presented below will relate to VHF sources de-    In order to assess the behavior of convection over Corsica,
termined with this filtering (minimum of seven stations and       overall data for all years of observation are accumulated. The
χ 2 ≤ 0.5).                                                       data analysis focuses on the 240 km × 240 km domain of bet-
   Another example of SAETTA detection is displayed in            ter detection accuracy centered on Corsica with filtered data
Fig. 6. Here the observation is made at the lightning scale       (VHF sources determined with a minimum of seven stations
for about 1 s. The left graph represents cloud-to-ground (CG)     and with a reduced-chi square χ 2 ≤ 0.5). At the present time
lightning. Looking to the top frame (altitude of VHF sources      the data processing and analysis of 3 years of observation
versus time), one can easily see that the initial phase of the    have been completed (2014; 2015; 2016). The sample size is
discharge (beginning of the time sequence in blue) consists       not yet large enough to call this climatology but it gives the
of a descending negative leader that starts at about 6 km         first details of the stormy behavior in this region.
high just before 14:47:43.2 and descends to about 3.6 km             The overall cumulative number of filtered VHF sources
after which it is no longer reported by LMA. Its propaga-         is displayed in Fig. 7a. The VHF sources are counted on
tion speed is roughly evaluated at 3 × 10⁵ m s−1 . It is fol-     1 km × 1 km pixels. Not clearly visible in this top left fig-
lowed by four other leaders propagating towards the ground        ure with a log scale in base 10, the highest values (dark red)
between 14:47:43.2 and 14:47:43.4. The polarity of the lead-      are located above the main relief of the island of Corsica,
ers is deduced from the power with which the VHF sources          and more specifically in the center of the northern part at the
are detected since intermittent negative leaders radiate much     crossroads of three large valleys, roughly between the Pine-
more than continuous positive leaders. Afterward a positive       role and Compoli stations (see Fig. 1). Other high values are
leader propagates almost horizontally over about 15 km in         located above the sea near the east coast, and also west of
the trailing stratiform region of the cloud according to the      Cape Corse (long relief oriented south–north, forming the
plan view in the bottom left panel until 17:47:44.2 when a        northern tip of Corsica).
negative leader suddenly propagates upward to the upper part         We built a “storm days” map by counting the total number
of the cloud and spreads over about 40 km. In the meantime,       of days during which at least five VHF sources have been de-
a positive leader subsequently appears to develop in the lower    tected, in each 1 km × 1 km pixel. This value of five sources
layer at about 4.5 km in altitude. It looks like an IC flash      has been tested and chosen so as not to take into account iso-
started at 17:47:44.2, finally producing a hybrid flash. This     lated sources corresponding to residual noise or poorly lo-
flash is very similar to the event M reported by van der Velde    cated sources, while keeping the events with low lightning
and Montanya (2013) in their Fig. 6. A time–distance plot         activity. It is a compromise that respects the storm activity
could provide a good estimation of the speed of ascent of         actually observed. The overall frequency of storm days for
the upper negative leader, so that one can refer to the time–     2014 to 2016 is displayed in Fig. 7b. The high-value patterns
distance plot of the M event in Fig. 7 of van der Velde and       are somewhat different from those of the cumulative num-
Montanya (2013) to have an idea about the scale of speed          ber of VHF sources. A big maximum (dark red, 10 km south
values.                                                           of Compoli station) appears in the northern part of the is-
   The right graph in Fig. 6 represents an intra-cloud (IC)       land a few kilometers to the east of the maximum of VHF
lightning flash. The corresponding top panel shows that the       sources displayed in Fig. 7a. Secondary maxima (orange and
initial phase of the discharge corresponds to an ascending        yellow) are located over the central main relief, over a small
negative leader triggered at about 7 km in altitude and prop-     area close to the Biguglia station (see Fig. 1), and over the
agating up to about 11 km. Then it propagates over approxi-       sea in the northeast quarter of the domain. The high values
mately 55 km following a slow descent, which is most prob-        of VHF source number (Fig. 7a) corresponding to low fre-
ably due to the sedimentation of the charged ice particles that   quencies (Fig. 7b) are obviously the signature of very intense
have been transported in the stratiform region and to which       events, e.g., almost everywhere over the sea where red is dis-
the discharge connects (Carey et al., 2005; Ely et al., 2008).    played in Fig. 7a.
About 30 ms after the triggering of the negative leader, the         By comparing Fig. 7a and b, one realizes that the north
positive leader also propagates horizontally in the lower part    center perimeter encompassing the crossroads of the three
of the discharge. In the end of the time sequence (red, at        main valleys and the relief south of the Compoli station
about 12:04:20.63) a fast ascending discharge (recoil leader)     seems to be a place where thunderstorms are together very
follows the main vertical branching of the flash and then         active and often present. The question that comes naturally
propagates almost horizontally in the upper part of the ini-      to mind is when it happens and why it happens in this loca-
tial negative leader path (spaced red dots in the center left     tion. To answer to the first point, the study of the frequency of
panel).                                                           the events was differentiated on the one hand between night
                                                                  and day and on the other hand according to the month of the
                                                                  year. The frequency of lightning during the night between
                                                                  18:00 and 06:00 UT is displayed in Fig. 7c and that during

Atmos. Meas. Tech., 12, 5765–5790, 2019                                             www.atmos-meas-tech.net/12/5765/2019/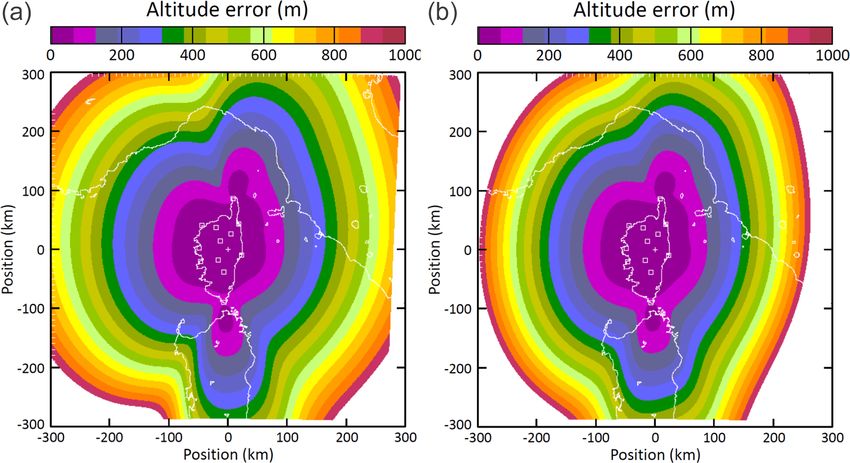
S. Coquillat et al.: SAETTA lightning imager 5773
Figure 6. Examples of CG (left) and IC (right) lightning detected by SAETTA on 25 July 2014. Each dot corresponds to a VHF source
detected by SAETTA. The colors indicate the time during the sequence: from blue (beginning of the time window) to red (end of the time
window). Station locations are indicated by green squares. Composition of each graph is the same as in Fig. 5.
the day between 06:00 and 18:00 UT in Fig. 7d, both with frequency observed in Fig. 7 is thus mainly due to July and
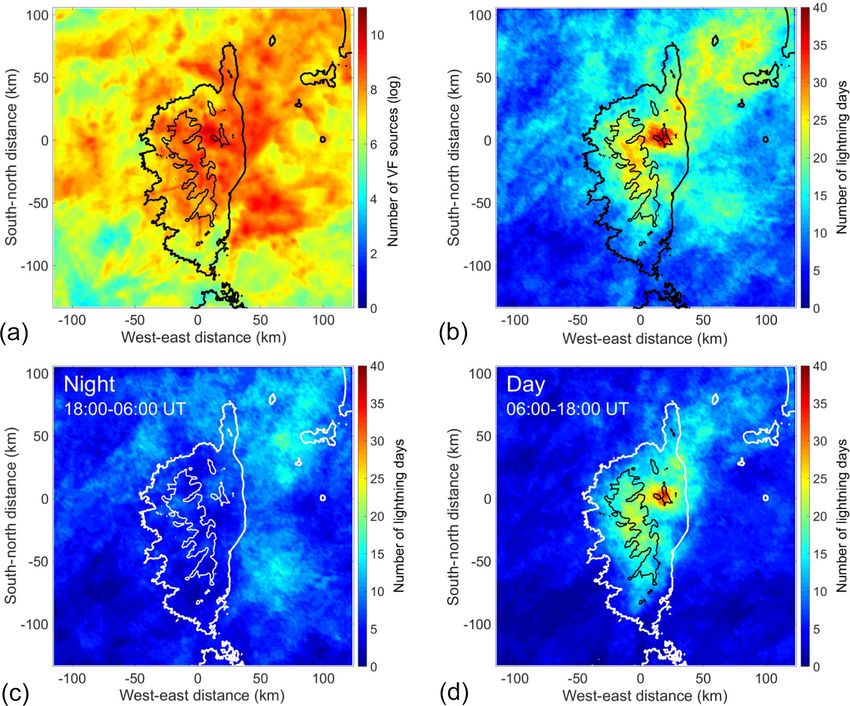
the same color scale as the overall frequency (Fig. 7b). It is to some extent June lightning activity.
clear that night is much less affected by convection and when To complete these geographical observations, one can also
it is, it occurs over the sea. Meanwhile daytime lightning ac- look at the overall observations reported as a histogram in
tivity provides the main contribution to the overall frequency Fig. 9. This figure shows the total number of lightning days
pattern. A more precise study of the diurnal evolution of the on the domain of better detection accuracy for each month
lightning activity was carried out for the observation of July and each year, together with the monthly average number
only. The results not presented here show that the maximum of lightning days. The available data set is enriched here
activity is due to storm events occurring between 11:00 and with the dates of the thunderstorms of 2017, which are sim-
14:00 UT. As expected, the maximum of lightning frequency ply issued from quicklooks (http://saetta-lma.aero.obs-mip.
over the relief of Corsica is thus mainly due to diurnal con- fr/, last access: 23 October 2019; all 2017 data not yet
vection. processed). The graph exhibits two maxima in June and
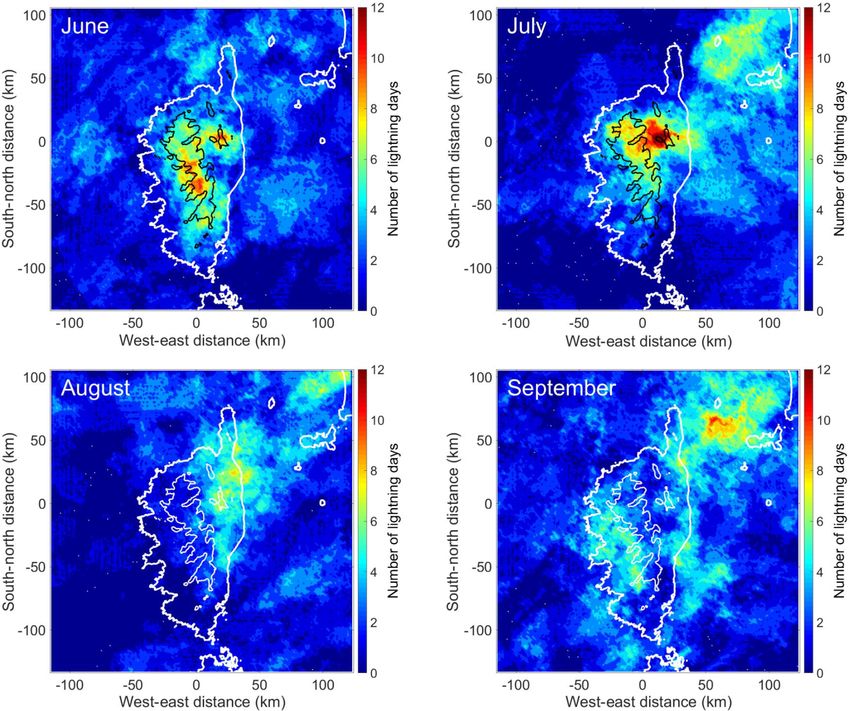
The differentiation of the storm frequency according to in September, and a minimum in August (winter is disre-
the month of the year is displayed in Fig. 8 from June to garded). From May to August the number of lightning days
September (most active months). June is characterized by a seems to follow the elevation of the Sun in the sky; i.e., con-
maximum of lightning activity over the whole relief, and es- vection is controlled by the flow of solar energy. While from
pecially in the center of the island and just south of Compoli September, the number of lightning days increases signifi-
station. In July the most frequent lightning activity concen- cantly in the domain. The corresponding events can be ei-
trates over the northern half of the island, with a main maxi- ther numerous small storms over the sea or over the relief
mum close to the crossroads of the three main valleys and a (Barthlott et al., 2016) or high-precipitation events such as
secondary maximum in the northeast quarter of the domain those occurring in southern France or in Corsica (Ducrocq
in the Gulf of Genoa. In August, the lightning activity be- et al., 2008; Lambert and Argence, 2008; Nuissier et al.,
comes scarce with a maximum located close to the east coast 2011; Ducrocq et al., 2013; Scheffknecht et al., 2016), which
in the vicinity of the Biguglia station (see Fig. 1) and again are formed under the influence of synoptic flows that inter-
with a secondary maximum in the Gulf of Genoa. At last in act with the relief of Corsica through low-level water va-
September the maximum lightning activity is located over por fluxes (Adler et al., 2016). The key ingredients that con-
the sea 20–40 km east of Cap Corse, while secondary max- trol their development are orographic forcing, low-level con-
ima are present on the west flank of southeast main relief and vergence, strong moisture fluxes, and conditionally unstable
close to the southeast coast. The maximum of lightning day flow. Furthermore, during the autumn season the sea surface
www.atmos-meas-tech.net/12/5765/2019/ Atmos. Meas. Tech., 12, 5765–5790, 2019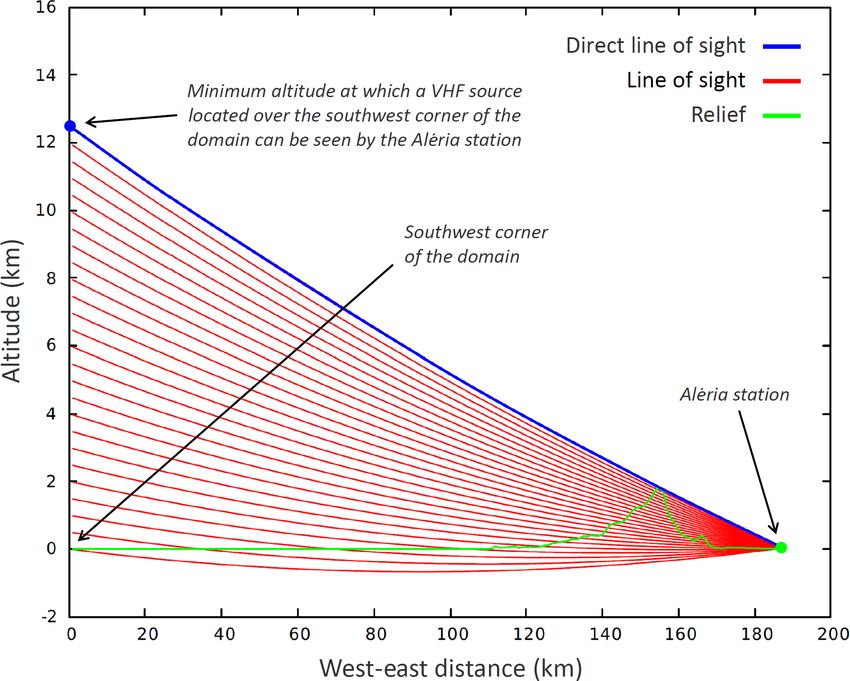
5774                                                                                     S. Coquillat et al.: SAETTA lightning imager

Figure 7. Overall cumulative number of filtered VHF sources in the 240 km × 240 km domain of better detection accuracy centered on
Corsica for 2014 to 2016 (a); frequency of lightning days for the overall set of filtered data on the same domain and during the same
period (b); frequency of lightning days at night (c) and day (d). A lightning day in a given pixel is defined as a day during which at least five
VHF sources are detected in that pixel. Isocontours at 1000 m altitude are indicated by black or white lines inside Corsica.

is still warm and constitutes a pool of water vapor and energy.            sica. This work is currently being carried out by means of
Meanwhile upper-level cold air begins to progress from the                 high-resolution numerical simulations and will be the sub-
north, associated with low geopotential height in the region.              ject of a forthcoming paper. The first results (Tidiga et al.,
   In July the number of lightning days is not the highest                 2018) show that the convection follows the setting up of sea
(Fig. 9), but since thunderstorms often occur in the same                  breezes, which are then channeled through the three main
micro-region, the frequency of thunderstorms per pixel in                  valleys, which leads to a strong convergence of low-level
this zone is the highest (Fig. 8). If we add the fact that the             moisture flows in the convection trigger zone. This result is
number of lightning days in July is particularly homogeneous               to be compared with the influence of valley and slope breezes
from year to year (between 7 and 11 over 4 years in Fig. 9),               as suggested by Barthlott and Kirshbaum (2013).
it seems that this area is the seat of very specific and repro-
ducible processes that lead to this maximum frequency of
thunderstorm days in this location in July between 11:00 and               4   Specific event report: high-altitude discharges
14:00 UT.
                                                                           Hereafter we report specific events that were detected by
   So to answer the second point of the question asked be-
                                                                           SAETTA in 2015. They concern high-altitude discharges
fore (i.e., why thunderstorms are together very active and
                                                                           in the convective core and in the trailing stratiform region
often present in the north center of Corsica), one has to an-
                                                                           of several thunderstorms. Such events raise open questions
alyze the processes involved in convection in July between
                                                                           about the conditions for the triggering of cloud discharges
11:00 and 14:00 UT in the center of the northern part of Cor-
                                                                           and for thunderstorm electrification.

Atmos. Meas. Tech., 12, 5765–5790, 2019                                                        www.atmos-meas-tech.net/12/5765/2019/
S. Coquillat et al.: SAETTA lightning imager 5775
Figure 8. Maps of monthly number of lightning days in the 240 km × 240 km domain of better detection accuracy centered on Corsica from
June to September for 2014 to 2016. Isocontours at 1000 m altitude are indicated by black or white lines inside Corsica.
From 7 to 10 June 2015, Corsica underwent 4 consecutive
days of intense, stationary, and long-lasting diurnal convec-
tion over most part of the relief with lightning activity char-
acterized by the highest VHF sources between 12 and 13 km
altitude. The 7 June event lasted 05 h 50 min (from 09:40
to 15:30 UT) and exhibited high-altitude discharges on top
of a convective core and one high-altitude discharge in the
trailing stratiform region (15:26:15 UT). The 8 June event
lasted 03 h 50 min from 10:10 to 14:00 UT and exhibited
high-altitude discharges on top of a convective core and six
high-altitude discharges in the stratiform region (12:38:39;
12:43:02; 12:54:05; 12:59:20; 13:21:43; 13:57:18 UT). The
9 June event lasted 06 h 30 min from 09:10 to 15:40 UT
and exhibited high-altitude discharges on top of a convec-
tive core and one high-altitude discharge in the stratiform re-
gion (11:58:38 UT). The 10 June event lasted 04 h 20 min
Figure 9. Monthly number of lightning days in the from 10:00 to 14:20 UT but did not exhibit any specific high-
240 km × 240 km domain of better detection accuracy centered on altitude discharges.
Corsica for 2014 to 2017.
www.atmos-meas-tech.net/12/5765/2019/ Atmos. Meas. Tech., 12, 5765–5790, 20195776 S. Coquillat et al.: SAETTA lightning imager
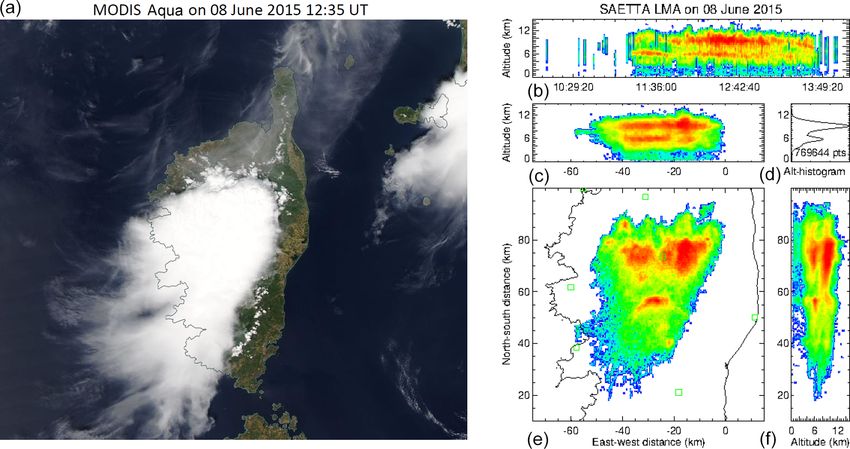
Figure 10. Cloud cover observed around 12:35 UT during the 8 June 2015 storm event by the MODIS Aqua satellite in the visible wavelength
range (NASA WorldView application https://worldview.earthdata.nasa.gov, last access: 23 October 2019, a), and VHF source density of the
event observed by SAETTA (b–f). Station locations are indicated by green squares.
4.1 Event of 8 June 2015: convective surges smaller zonally oriented cells. According to Stolzenburg and
Marshall (2008), a mesoscale convective system is “charac-
terized by a leading region of deep convective clouds forming
Let us focus on the 8 June event, which presents more
a line or arc, followed by a broad area of deep nimbostratus
specific discharges at high altitude than the other similar
clouds”. The present thunderstorm event matches this con-
events. The environmental wind pattern is constituted of sea
ceptual model with deep convective clouds no. 2 and no. 3,
and slope breezes on the ground, with a slight wind ori-
but exhibits a specific feature due to the presence of a decay-
ented toward the south appearing around the 700 hPa level
ing convective cell no. 1 embedded in the mesoscale convec-
and strengthening as it turns toward the southwest direction
tive system (MCS) leading region. This feature is often en-
at higher levels. The cloud cover and the cumulative VHF
countered in typical MCS stratiform cloud of Houze (1993)
source density are displayed in Fig. 10. The mesoscale con-
though.
vective system is composed of three main convective cores
The event is characterized by six convective surges iden-
embedded in a southward trailing stratiform region. The first
tified from SAETTA observations (see Table 2). They corre-
convective core no. 1 appears further south at the begin-
spond to high-level updraft intensifications on top of a con-
ning of the event and lasts about 50 min from about 11:12
vective core for a few minutes, accompanied by upward de-
to 12:03 UT. It is centered on the point of coordinates x = 27
veloping discharges at altitudes that are higher than the whole
and y = 57 km and exhibits two main layers of strong VHF
storm electrical activity (see Krehbiel et al., 2002). All these
source densities located at altitudes of about 6 and 10 km.
surges are associated with the northeast main convective core
The analysis of the power with which the VHF sources are
no. 2 that is located the most windward and that undoubtedly
detected shows that this core and the event as a whole are
benefits from richer low-level moist fluxes making it more
of regular polarity, i.e., with upper positive charge and lower
vigorous. These surges have about the same characteristics as
negative charge associated with those two layers of strong
the most intense of them (no. 5), the VHF sources which are
VHF source densities. The two other main convective cores
displayed in Fig. 11 versus altitude (left) and power of detec-
centered on points of coordinates x = −16 and y = 75 km
tion (right). These sources are located in a small perimeter
for the most easterly one no. 2 and x = −16 and y = 75 km
of approximately 5 km by 5 km (red dots in the left panels
for the most westerly one no. 3 start at 11:44 and 11:52 UT,
of Fig. 11 dedicated to vertical projections) and are present
respectively, and last until about 13:00 UT by interacting. At
up to 14 km altitude, while the surrounding VHF sources do
the end of the period they are fed on the north side by a line of
Atmos. Meas. Tech., 12, 5765–5790, 2019 www.atmos-meas-tech.net/12/5765/2019/S. Coquillat et al.: SAETTA lightning imager 5777
Table 2. Serial number, time period, position, and maximum altitude of the VHF sources during the six convective surges.
Convective surges Time period (UT) Position Maximum altitude (km)
x (km) y (km)
No. 1 12:00–12:03 −18 73 13.0
No. 2 12:09–12:13 −15 72 12.6
No. 3 12:16–12:20 −16 74 12.8
No. 4 12:26–12:28 −15 77 12.6
No. 5 12:33–12:37 −17 78 14.0
No. 6 12:40–12:43 −23 78 12.4
not exceed 11.5 km altitude. The analysis of the power with is probably due to the small spatial extent of charge regions
which they are detected (Fig. 11 right) shows that the dis- in the overshooting top.
charges are weakly radiating. Therefore they likely corre- In order to characterize the flashes produced during such
spond to positive discharges; i.e., they propagate in a neg- convective surges in terms of flash type, triggering altitude,
ative charge layer. This observation is in agreement with the and flash rate, a source-to-flash clustering of lightning was
conceptual model of Stolzenburg et al. (1998) and supports carried out via the XLMA flash algorithm (Thomas et al.,
their idea that the upper negative charge layer is the typical 2003). Several algorithms of flash classification have been
uppermost charge region in MCS convection. Furthermore, developed so far (MacGorman et al., 2008; McCaul et al.,
the top left and top right panels in Fig. 11 (i.e., the altitude 2009; Fuchs et al., 2015) but none of them are ideal, espe-
versus time windows) show that many small discharges ap- cially when the lightning rate is high and the flashes are very
pear quasi-continuously between 10 and 13 km altitude dur- close to each other or overlap. The present flash classifica-
ing this sequence. Their characteristics are markedly differ- tion does not represent the truth, especially since the classifi-
ent from typical IC flashes because they are located in a rel- cation of small lightning can be affected by the filtering used
atively small cloud volume, seem to trigger at very high alti- (minimum number of stations or maximum χ 2 ). But consid-
tude, and therefore have a very limited vertical and horizontal ered in a qualitative way, it makes it possible to characterize
extension. the types of lightning thus defined according to the evolution
Similar small high-altitude discharges were observed by of the storm event. The classification criteria are as follows:
Ushio et al. (2003), MacGorman et al. (2008), Emersic (i) big flashes (75 or more points), (ii) medium flashes (11–
et al. (2011), Calhoun et al. (2013), or MacGorman et 74 points), (iii) small flashes (10 points or fewer and not iso-
al. (2017). These discharges have unusual characteristics; lated), (iv) small–isolated flashes (two to nine points in an
i.e., the corresponding VHF source production is rather con- active region and duration longer than 1 ms), and (v) short–
tinuous, at low rates, with no clear structure, and independent isolated flashes (two to nine points in an active region and
of the flashes at lower altitudes (MacGorman et al., 2017). duration shorter than 1 ms). The flash algorithm options (spa-
This behavior is well illustrated by the quasi-continuous tial and temporal parameters) are mentioned in Appendix B.
small discharges that appear above 10 km altitude in both top The location of the first sources is supposed to indicate the
panels of Fig. 11 (altitude versus time). Associated with so- location of initialization of the lightning.
called rising lightning bubbles (Ushio et al., 2003) or with The lightning flash rate per minute, calculated for big,
overshooting tops (e.g., Calhoun et al., 2013; MacGorman medium, and small flashes together, is displayed in Fig. 12c
et al., 2017), the high VHF source production localized on as a blue line. It remains rather weak with values lower than
the top of the convective core is most often associated with 10 min−1 until the end of the first main convective core no. 1
a rapid vertical growth of the storm, i.e., with a convective at about 12:00 UT. Then, it exhibits several peaks between
surge. Calhoun et al. (2013) suggested that the decreasing 12:00 and 13:00 UT with maxima of 48 min−1 at 12:20 UT,
electric threshold for discharge triggering with increasing al- 33 min−1 at 12:28 UT, 47 min−1 at 12:34 UT, and 33 min−1
titude because of decreasing pressure on the one hand (see at 12:42 UT. Each of them corresponds to one of the convec-
MacGorman and Rust, 1998) and the charge carried by hy- tive surges reported in Table 2. The flash rate correspond-
drometeors transported aloft by the updraft and subsequently ing to small–isolated and short–isolated flashes is also dis-
interacting with the screening layer of charge on the other played in Fig. 12c as a red line for comparison. Its maxima,
hand contributed to this VHF emission production associ- greater than those of big, medium, and small flashes consid-
ated with overshooting regions. A comprehensive discussion ered together are also in phase with convective surges (see
about the hypotheses concerning charge regions producing Table 2). The flash rate of small–isolated and short–isolated
such overshooting top discharges is proposed by MacGor- flashes seems to be a good proxy for the convective surges.
man et al. (2017). Anyway, the small size of these discharges
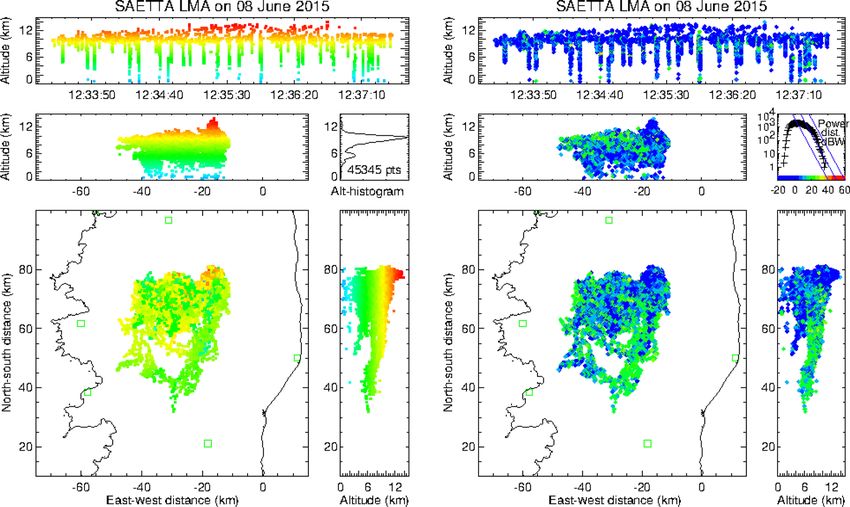
www.atmos-meas-tech.net/12/5765/2019/ Atmos. Meas. Tech., 12, 5765–5790, 20195778 S. Coquillat et al.: SAETTA lightning imager Figure 11. High-altitude discharges in the convective zone during the MCS event of 8 June 2015 corresponding to the convective surge no. 5. VHF sources displayed by dots with the color scale corresponding to the altitude of the sources (left) and to the power with which they have been detected (right). The first sources of flashes have also been extracted via the tensive period, numerous small–isolated and short–isolated XLMA flash algorithm in order to identify the preferential al- flashes were triggered between 9 and 13 km altitude. The titudes where lightning flashes were triggered. The altitude of altitude histograms in Fig. 12b show that initiation of big those first sources are displayed versus time in Fig. 12a for flashes dominates at altitudes lower than 9 km with a maxi- each kind of lightning flash. Additional information about mum around 5500 m altitude. At higher levels corresponding the number of first sources by flash type is given in Fig. 12b to convective surge activity, big, medium, and small flashes that provides their altitude histogram with a 200 m vertical exhibit maxima at about 9300, 9700, and 10 500 m altitude, resolution. The big flashes are triggered from the very be- respectively (the smaller the flash the higher the altitude at ginning of the event until the end (blue dots in Fig. 12a). which it is triggered), while small–isolated flashes and espe- During the first convective core no. 1 between about 11:10 cially short–isolated flashes exhibit higher maxima at 9900 and 12:00 UT the altitude of their first sources is distributed and 10 300 m altitude, respectively. These results confirm the over three altitude levels (1.5, 3, and 5.5 km). The two lowest small-scale electrical activity on top of a convective core over levels correspond mainly to cloud-to-ground flashes and the small areas centered on convective surge positions indicated highest level to intra-cloud flashes. At 12:00 UT big flashes in Table 2. Furthermore, it seems that only small–isolated were suddenly triggered at a fourth altitude level between and short–isolated flashes are able to correctly account for 8 and 10 km altitude until the end of the more intense con- this specific high-level electrical activity associated with the vective phase, i.e., 13:40 UT. Note that during the same pe- uppermost part of convective surges. riod from 12:00 to 12:40 UT the lowest first sources of big flashes (blue dots) were much less numerous, which corre- 4.2 Event of 8 June 2015: upper-level discharges in the sponds well to the intensification of convection and to a re- trailing stratiform region duction in cloud-to-ground flash activity. After 13:40 UT big flashes were again only triggered at three altitude levels (1, 4, During the same event of 8 June 2015, six uncommon flashes and 6 km). As far as medium and small flashes are concerned, were detected by SAETTA in the trailing stratiform region they were triggered at about all altitudes from 12:00 UT until of the mesoscale convective system (see Table 3 for detailed the end of the event but much less frequently than big flashes, temporal and spatial characteristics); four of them were trig- with however maxima at about 9.5 and 10.7 km, respectively gered during the second half of the phase of intense convec- (not clearly visible in Fig. 12a), during the phase of intense tion (between 12:00 and 13:10 UT; see Sect. 4.1), and the two convection between 12:00 and 13:10 UT. During the same in- others were triggered later during the decay phase. Those six Atmos. Meas. Tech., 12, 5765–5790, 2019 www.atmos-meas-tech.net/12/5765/2019/
S. Coquillat et al.: SAETTA lightning imager                                                                                              5779

Figure 12. Altitude versus time of the first VHF sources of each flash on 8 June 2015 MCS event (a), altitude histogram of these first
VHF sources with a vertical resolution of 200 m (b), and 1 min flash rate versus time (c) for small–isolated and short–isolated flashes (red)
and for big, medium, and small flashes (blue). Flash classification: big flashes (75 or more points), medium flashes (11–74 points), small
flashes (10 points or less and not isolated), small–isolated flashes (two to nine points in an active region and duration longer than 1 ms), and
short–isolated flashes (two to nine points in an active region and duration shorter than 1 ms).

flashes started like typical IC (or CG for one of them) via               to that of the positive charge layer below, at altitudes rang-
a bidirectional leader process (Kasemir, 1950; Israel, 1973;              ing from a maximum of about 12 km to a minimum of about
Mazur, 2002; Montanyà et al., 2015), the negative leader of               8 km, and at horizontal distances varying from 10 km (flash
which propagates upward until it reaches the upper positive               no. 3) to 33 km (flash no. 5), in several directions but mainly
charge of the regular dipole structure, and then propagates               downwind.
away from convective core no. 2 into the stratiform region                   Those uncommon flashes can be illustrated by flash no. 5
with a low descent associated with the sedimentation of the               that appeared just before 13:21:43.5 UT. The correspond-
charged ice particles as described by Ely et al. (2008). How-             ing VHF sources are displayed in Fig. 13 versus time (top
ever, during the propagation phase through the stratiform re-             left), altitude (top right), power (bottom left), and inferred
gion, an upward positive leader – probably issued from a                  cloud charge polarity (bottom right). The polarity of the VHF
bidirectional leader triggered just above the positive charge             sources (selected by hand with the XLMA software) is de-
layer of the stratiform region – suddenly appears at a distance           duced from the intensity of the power with which they are
varying from 14 km (flash no. 3) to 33 km (flash no. 2) from              detected. Basically most powerful sources correspond to neg-
convective core no. 2 and propagates upward over a vertical               ative leaders that move through positively charged regions
distance varying from 3 km (flashes no. 2 and no. 3) up to                while less powerful sources correspond to positive leaders
5 km (flash no. 5). Then the positive leader spreads in a neg-            that move through negatively charged regions. More pre-
ative charge layer almost horizontal but with a tilt parallel             cisely, positive leaders could in fact be the signature of retro-

www.atmos-meas-tech.net/12/5765/2019/                                                         Atmos. Meas. Tech., 12, 5765–5790, 2019
You can also read