Unraveling the physical and physiological basis for the solar-induced chlorophyll fluorescence and photosynthesis relationship using continuous ...
←
→
Page content transcription
If your browser does not render page correctly, please read the page content below
Biogeosciences, 18, 441–465, 2021
https://doi.org/10.5194/bg-18-441-2021
© Author(s) 2021. This work is distributed under
the Creative Commons Attribution 4.0 License.

Unraveling the physical and physiological basis for the solar-
induced chlorophyll fluorescence and photosynthesis
relationship using continuous leaf and canopy
measurements of a corn crop
Peiqi Yang1 , Christiaan van der Tol1 , Petya K. E. Campbell2,3 , and Elizabeth M. Middletona
1 Faculty of Geo-Information Science and Earth Observation (ITC),
University of Twente, 7500 AE Enschede, the Netherlands
2 Joint Center for Earth Systems Technology (JCET), University of Maryland,

Baltimore County, Baltimore, MD 21228, USA
3 Biospheric Sciences Laboratory, NASA Goddard Space and Flight Center, Greenbelt, MD 20771, USA
a formerly at: Biospheric Sciences Laboratory, NASA Goddard Space and Flight Center, Greenbelt, MD 20771, USA

Correspondence: Peiqi Yang (p.yang@utwente.nl)

Received: 28 August 2020 – Discussion started: 8 September 2020
Revised: 9 December 2020 – Accepted: 12 December 2020 – Published: 20 January 2021

Abstract. Estimates of the gross terrestrial carbon uptake      (LUE) models for SIF and GPP facilitates a better under-
exhibit large uncertainties. Sun-induced chlorophyll fluores-   standing of the SIF–GPP relationship at different environ-
cence (SIF) has an apparent near-linear relationship with       mental and canopy conditions. Leaf level fluorescence mea-
gross primary production (GPP). This relationship will po-      surements also demonstrated that the sustained thermal dissi-
tentially facilitate the monitoring of photosynthesis from      pation efficiency dominated the seasonal energy partitioning,
space. However, the exact mechanistic connection between        while the reversible heat dissipation dominated the diurnal
SIF and GPP is still not clear. To explore the physical and     leaf energy partitioning. These diurnal and seasonal varia-
physiological basis for their relationship, we used a unique    tions in heat dissipation underlie, and are thus responsible
data set comprising continuous field measurements of leaf       for, the observed remote-sensing-based link between far-red
and canopy fluorescence and photosynthesis of corn over a       SIF and GPP.
growing season. We found that, at canopy scale, the posi-
tive relationship between SIF and GPP was dominated by
absorbed photosynthetically active radiation (APAR), which      1   Introduction
was equally affected by variations in incoming radiation and
changes in canopy structure. After statistically controlling    For our understanding of the Earth’s climate, estimates of
these underlying physical effects, the remaining correlation    the gross carbon uptake by terrestrial ecosystems are crucial
between far-red SIF and GPP due solely to the functional link   (Falkowski et al., 2000; Friedlingstein, 2015; Solomon et al.,
between fluorescence and photosynthesis at the photochemi-      2009). Despite considerable progress in measurement sys-
cal level was much weaker (ρ = 0.30). Active leaf level flu-    tems and models, contemporary estimates of the gross terres-
orescence measurements revealed a moderate positive corre-      trial carbon uptake still exhibit large uncertainties (Ryu et al.,
lation between the efficiencies of fluorescence emission and    2019). On the one hand, eddy covariance flux towers provide
photochemistry for sunlit leaves in well-illuminated condi-     point measurements of carbon uptake at selected locations on
tions but a weak negative correlation in the low-light con-     all continents, which can be used to estimate gross primary
dition, which was negligible for shaded leaves. Differenti-     production (GPP), but such in situ measurements are sparse.
ating sunlit and shaded leaves in the light use efficiency      On the other hand, optical remote sensing provides spatially

Published by Copernicus Publications on behalf of the European Geosciences Union.
442                P. Yang et al.: Unraveling the solar-induced chlorophyll fluorescence and photosynthesis relationship

continuous and dense data, but these observations are only        et al. (2014) implicitly assumed that a positive relationship
indirectly related to GPP. In this respect, the development       between 8Fcanopy and 8Pcanopy exists and that fesc in the near-
of Sun-induced chlorophyll fluorescence (SIF) measurement         infrared region is isotropic and close to unity when explain-
techniques from satellites has raised expectations. This is       ing the SIF–GPP relationship at the satellite level. However,
because chlorophyll fluorescence (ChlF) as a by-product of        these assumptions need to be verified, and we still lack a clear
photosynthesis has long been used as a probe of photochem-        conclusion on the physical and physiological basis for the re-
istry in laboratory and field studies (Mohammed et al., 2019).    lationship between far-red SIF and GPP.
Ever since satellite SIF data products related to the far-red        Dechant et al. (2020) explored the relationship between
fluorescence peak became available during the past decade,        SIF and GPP for three in situ crop data sets. They found
numerous studies have reported a strong correlation between       that correcting SIF for canopy scattering (fesc ) improved
far-red SIF and GPP at the local, regional and global scales      the correlation between SIF and APAR but not GPP. Fur-
(e.g., Campbell et al., 2019; Damm et al., 2015; Guanter et       thermore, they reported that their estimates of physiological
al., 2014; He et al., 2017; Wieneke et al., 2016). This SIF–      SIF yield (8Fcanopy = SIF/APAR/fesc ) showed no clear sea-
GPP link has been employed to estimate photosynthetic ca-         sonal patterns and were unlikely to contribute to the positive
pacity (e.g., Zhang et al., 2014) and crop yield (e.g., Guan et   correlation between GPP and far-red SIF. In contrast, Qiu
al., 2016).                                                       et al. (2019) reported that the similar correction of SIF for
   The rising expectations of far-red SIF rely on a contestable   canopy scattering resulted in a better correlation to GPP, and
closer relationship with GPP than other optical remote sens-      Yang et al. (2020) showed that the estimates of canopy-scale
ing signals, such as well-chosen reflectance indices (Damm        light use efficiency of fluorescence (8Fcanopy ) were clearly
et al., 2015; Mohammed et al., 2019; Wieneke et al., 2016).       higher in young and mature stages than for the senescent
In order to make use of SIF quantitatively, it is necessary       stages, and were correlated with 8Pcanopy . The inconsistent
to understand the physical and physiological meaning of SIF       findings could partly be caused by considerable uncertain-
and to establish a mechanistic understanding of its relation to   ties in the estimates of fesc and 8Fcanopy , especially since the
GPP (Gu et al., 2019; Magney et al., 2019; Miao et al., 2018;     physiological indicators (8Fcanopy and 8Pcanopy ) are still con-
Yang et al., 2015). In recent studies, the light use efficiency   taminated by canopy structural effects (Yang et al., 2020).
(LUE) model of Monteith (1977) has been the common start-            More fundamental understanding can be obtained by re-
ing point for describing GPP and SIF as a function of the ab-     turning to the established physiological methods of in vivo
sorbed photosynthetically active solar radiation (APAR) as        active fluorescence measurements to discern the relative en-
follows:                                                          ergy distribution among the four pathways in plants via pho-
                                                                  tosynthesis, fluorescence and heat losses (both sustained and
GPP = iPAR · fAPAR · 8Pcanopy ,                           (1a)    reversible). At the photochemical level in leaves, it is clear
                                                                  that a change in fluorescence emission efficiency can be at-
                                                                  tributed to a change in the combined efficiencies of pho-
SIF = iPAR · fAPAR · 8Fcanopy · fesc ,                    (1b)    tochemistry and heat dissipation, expressed as the photo-
                                                                  chemical quenching (PQ) and non-photochemical quench-
where iPAR denotes the available incoming photosyntheti-          ing (NPQ) of fluorescence (Baker, 2008; Maxwell and John-
cally active radiation for a vegetation canopy, fAPAR is the      son, 2000). The relationship between the photochemical-
fraction of APAR absorbed by green vegetation, and 8Pcanopy       level photosynthetic light use efficiency (8P ) and fluores-
and 8Fcanopy describe the canopy-scale light use efficiencies     cence reduction (i.e., quenching) was described with the
for photochemistry and fluorescence, respectively, which are      Genty equation as (Fm − Fs )/Fm (Genty et al., 1989), which
related to the plant physiological status. fesc is the fraction   compares the relative fluorescence change from a steady state
of the emitted far-red fluorescence that escapes the canopy       (Fs ) to its maximal level (Fm ) when the photochemical path-
in the viewing direction (per solid angle), which depends on      way is completely inhibited (e.g., by using a saturating light).
the viewing and illumination geometries and canopy struc-         Semi-empirical generalized relationships have further been
ture (Porcar-Castell et al., 2014; Yang et al., 2020; Yang and    developed to model these maximal and steady-state fluores-
van der Tol, 2018).                                               cence levels as a function of photosynthetic light use effi-
   From the LUE model, it is evident that the common terms        ciency and temperature (Rosema et al., 1991; van der Tol et
iPAR and fAPAR are primarily responsible for the often-           al., 2014). However, the universal applicability of the latter
reported linear relationship between SIF and GPP (Camp-           models has not been validated, and continuously collected
bell et al., 2019; Dechant et al., 2020; Miao et al., 2018;       field measurements of active fluorescence at the leaf level
Rossini et al., 2010; Yang et al., 2018). The combined con-       along with canopy photosynthesis and SIF measurements are
tribution of 8Fcanopy and fesc to the SIF–GPP relationship is     rare, which limits our understanding of their relationship in
much less clear. It has been argued that 8Fcanopy may also        natural conditions.
contribute to the positive correlation between GPP and far-          The present study aims to assess the drivers of the appar-
red SIF, while fesc is viewed as an interfering factor. Guanter   ent SIF–GPP relationship using independent measurements

Biogeosciences, 18, 441–465, 2021                                                     https://doi.org/10.5194/bg-18-441-2021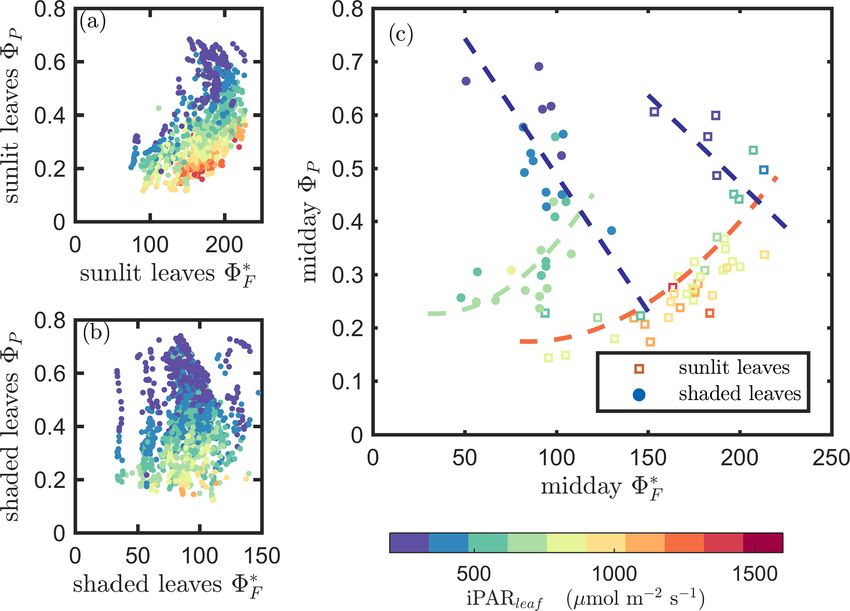
P. Yang et al.: Unraveling the solar-induced chlorophyll fluorescence and photosynthesis relationship                        443

of all terms in the light use efficiency model (Eq. 1), col-       SIF retrievals. These were supplemented by carbon fluxes
lected under different illumination conditions and at differ-      and meteorological data from the site’s instrumented tower.
ent growth stages, at the leaf and canopy levels. We chose a       These measurements cover the 2017 growing season from
corn crop (Zea mays L.), also referred to as maize, because        DOY 192 to 264, except for the period from DOY 210 to 219.
it provides a relatively simple canopy and is typically a row      The main field measurements used in this study are listed in
crop with plants normally having a spherical shape. As a C4        Table 1. In what follows, we briefly introduce the measure-
species, corn does not lose carbon through photorespiration,       ments used in the present study (the field campaign was de-
which makes GPP observations from flux towers more rep-            scribed in detail in Campbell et al., 2019).
resentative to the actual photosynthesis of the canopy. Maize         The site’s eddy covariance tower-based system provided
is also a globally important crop that comprises the bread         30 min GPP fluxes continuously collected throughout the
basket that feeds the world. Some have claimed (e.g., Guan-        growing season. An infrared gas analyzer (model LI-7200;
ter et al., 2014) that the observed far-red SIF obtained from      LI-COR Inc., Lincoln, NE, USA) measured the net ecosys-
space reveals that the US corn belt achieves the highest car-      tem exchange (NEE), which was further partitioned into GPP
bon sink of any of Earth’s ecosystems. On that basis alone,        and ecosystem respiration (Re ) using a standard approach
and because of the importance of agricultural surveys from         (Reichstein et al., 2005), which extrapolated nighttime val-
space for food security reasons, we are justified in conduct-      ues of Re into daytime values using air temperature measure-
ing a more comprehensive examination of the photosynthetic         ments.
function and associated fluorescence activity of this crop, and       Canopy spectral measurements were collected by using a
we encourage more such studies of important crops affecting        field spectroscopy system, the FLoX (JB Hyperspectral De-
food security.                                                     vices UG, Germany), between 07:00 and 20:00 (local time –
   We drew upon a unique data set comprising growing-              LT) with a time sampling interval from 1–3 min. The sys-
season-long, continuous measurements of a corn crop for leaf       tem consists of two spectrometers, namely a QEpro spec-
active fluorescence, canopy SIF, hyperspectral reflectance         trometer (Ocean Optics, Inc., Dunedin, FL, USA) and a
and GPP. With partial correlation analysis, we evaluated the       FLAME-S spectrometer (Ocean Optics, Inc., Dunedin, FL,
contributions of iPAR, fAPAR and APAR to the SIF–GPP re-           USA). The QEpro measured down-welling irradiance and
lationship at the canopy scale. In parallel, we used active flu-   up-welling radiance, with a 0.3 nm spectral resolution at full
orescence measurements to investigate the energy partition-        width at half maximum (FWHM) between 650 and 800 nm,
ing in leaves to reveal the relationship between fluorescence      which were used to retrieve SIF. The FLAME-S measured
and photosynthesis at the photochemical level.                     the same up-welling and down-welling fluxes but between
                                                                   400 and 1000 nm, with a lower spectral resolution (FWHM
                                                                   of 1.5 nm), which were used to compute canopy values for
2     Materials and methods                                        reflectance (R) and to estimate incident photosynthetically
                                                                   active radiation (iPARcanopy ) and fAPARcanopy . These top-of-
2.1    Study site
                                                                   canopy (TOC) measurements were collected from approxi-
Field measurements were collected in 2017 at the Opti-             mately 1.5 m above the canopy at nadir, covering a 25◦ field
mizing Production inputs for Economic and Environmen-              of view (0.66 m in diameter at ground level) as reported in
tal Enhancement (OPE3 ) field site (De Lannoy et al.,              Yang et al. (2020).
2006) at the US Department of Agriculture’s Agricultural              Leaf fAPAR (fAPARleaf ) was measured on 6 d spaced
Research Service (USDA-ARS) in Beltsville, MD, USA                 across the growing season (n = 18 samples per day). The
(39.0306◦ N 76.8454◦ W; coordinated universal time – UTC-          leaf absorptance spectra between 350 and 2500 nm for nine
05:00). The site is instrumented with a 10 m eddy covari-          leaves were measured in the laboratory with an ASD Field-
ance tower and a height-adjustable tower (i.e., 1.5–4 m tall)      Spec 4 spectrometer (Malvern Panalytical, Longmont, CO,
supporting the optical spectral measurements and surrounded        USA) and an ASD halogen light source coupled with an in-
by corn (Zea mays L.) fields. The two towers were located          tegrating sphere. The mean fAPARleaf values per date were
within the same field that provided the optimal (100 %) nitro-     computed as follows: 0.92 ± 0.007 (i.e., mean ± SD) on
gen application for this climate zone, separated by approxi-       DOY 192, 0.92 ± 0.01 on DOY 199; 0.91 ± 0.01 on DOY
mately 120 m. The following three distinct growth phases of        221, 0.90 ± 0.03 on DOY 222, 0.82 ± 0.03 on DOY 240
the corn canopy were discerned: young stage (Y ) from day          and 0.75 ± 0.05 on DOY 263. Finally, fAPARleaf on the
of year (DOY) 192 to 209, mature stage (M) from DOY 220            rest of the days was linearly interpolated/extrapolated from
to 235 and senescent stage (S) from DOY 236 to 264.                those measurements. Therefore, fAPARleaf values ranged
                                                                   from 0.93 to 0.70 across the growing season.
2.2    Field measurements                                             Leaf level active fluorescence measurements were col-
                                                                   lected by using an automated MoniPAM fluorometer system
The field measurements included active fluorescence obser-         (Walz Heinz GmbH, Germany) and five MoniPAM emitter–
vations made on individual leaves and canopy reflectance and       detector probes, which were operated using a MoniPAM data

https://doi.org/10.5194/bg-18-441-2021                                                      Biogeosciences, 18, 441–465, 2021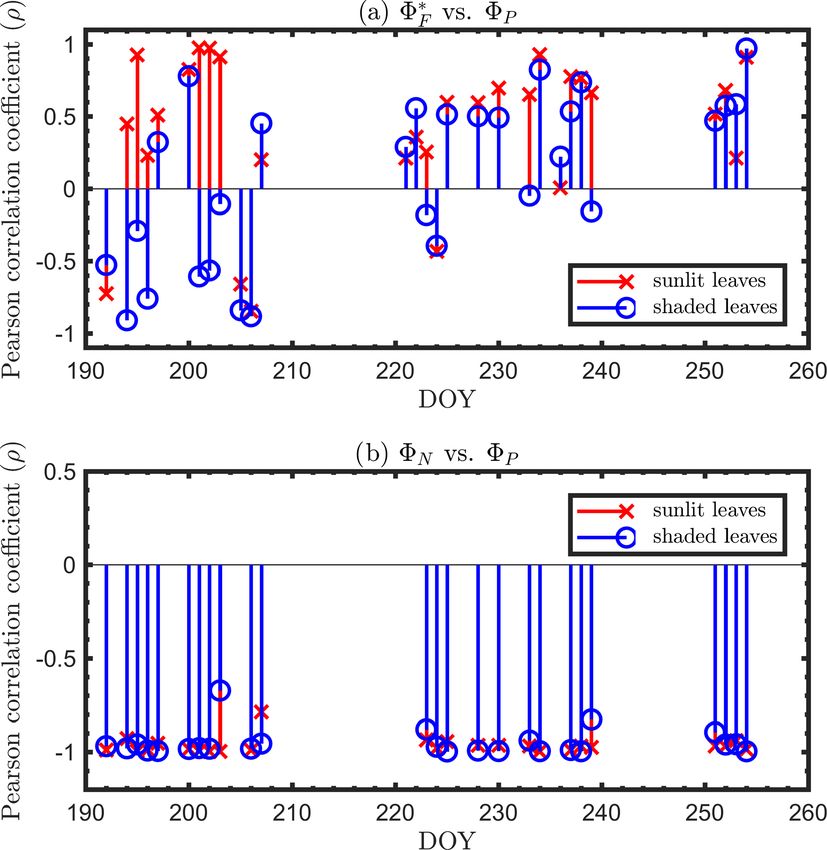
444                 P. Yang et al.: Unraveling the solar-induced chlorophyll fluorescence and photosynthesis relationship

Table 1. Summary of the main canopy and leaf field measurements used in the analyses.

               Variable        Description                         Measuring system           Unit           Temporal resolution
               GPP             Gross primary production            Eddy covariance system     mg m−2 s−1     30 min
               F760            Canopy SIF at 760 nm                QEpro (in FLOX)            mW m−2 s−1     1–3 min
      Canopy
               iPARcanopy      TOC incoming PAR                    FLAME-S (in FLOX)          µmol m−2 s−1   1–3 min
               fAPARcanopy     Canopy fraction of absorbed PAR     FLAME-S (in FLOX)          −              1–3 min
               iPARleaf        Leaf-incoming PAR                   MoniPAM system             µmol m−2 s−1   10 min
               fAPARleaf       Leaf fAPAR                          ASD spectrometer           −              −
      Leaf
               Fm              Maximal fluorescence levels         MoniPAM system             −              10 min
               Fs              Steady-state fluorescence levels    MoniPAM system             −              10 min

acquisition system (Porcar-Castell et al., 2008). Three probes       at around 760 nm (F760 ). SIF was retrieved using the spec-
were positioned to measure sunlit leaves in the upper canopy,        tral fitting method (SFM) described in Cogliati et al. (2015).
and the remaining two probes collected measurements on               Canopy iPAR (iPARcanopy ) was computed from the irradi-
shaded leaves within the lower canopy. The fluorometer col-          ance spectra collected with the FLAME-S spectrometer as
lected continuous steady-state fluorescence (Fs ) and maxi-          the integral of irradiance over the spectral region from 400 to
mal fluorescence (Fm ) every 10 min during the day and night.        700 nm. Canopy fAPAR was approximated by using the red-
The MoniPAM measured chlorophyll fluorescence induced                edge NDVI (normalized difference vegetation index; Miao et
by an internal, artificial light source, which produces mod-         al., 2018; Viña and Gitelson, 2005) as follows:
ulated light with constant intensity (Baker, 2008; Schreiber
et al., 1986). In addition to leaf fluorescence measurements,        fAPAR = 1.37 · Rededge NDVI − 0.17,                           (2a)
the MoniPAM also measured leaf temperature by an internal
temperature sensor and incident PAR (iPARleaf ) by a PAR             where, in the following:
quantum sensor. Leaf APAR (APARleaf ) was computed as                                       R750 − R705
the product of iPARleaf and fAPARleaf .                              Rededge NDVI =                     ,                          (2b)
                                                                                            R750 + R705
2.3    Data quality control and sampling                             where reflectance at specific wavelengths is utilized (Rλ : 705
                                                                     and 750 nm). Red-edge NDVI is a widely used index for es-
Data quality control of canopy reflectance, SIF and GPP
                                                                     timating fAPAR, and Viña and Gitelson (2005) suggest it as
measurements was conducted prior to the analysis. First,
                                                                     an optimal index for fAPAR among various other vegetation
measurements collected on 29 rainy or densely clouded days
                                                                     indices in corn canopies. We, however, have tested several
were excluded because SIF retrieval is generally reliable
                                                                     other indices for estimating fAPAR, including the enhanced
under clear-sky conditions for which changes are gradual,
                                                                     vegetation index (EVI; Huete et al., 2002; Xiao et al., 2004)
in concert with illumination, but not under cloud cover or
                                                                     and the green NDVI (Viña and Gitelson, 2005), and found
mostly cloudy conditions when large, unpredictable fluctu-
                                                                     that the choice among the three indices had little impact on
ations of illumination occur (Chang et al., 2020). Second,
                                                                     the results in Sect. 3.1. We also computed the photochemical
a window-based outlier detection was applied to incident                                        R531 −R570
                                                                     reflectance index PRI = R   531 +R570
                                                                                                           (Gamon et al., 1992), as
PAR data collected by the FLoX to identify unrealistic short-
                                                                     an indicator of diurnally reversible canopy heat dissipation
term fluctuations in atmospheric conditions leading to unre-
                                                                     efficiency 8Ncanopy .
liable SIF retrievals. The fluctuations were detected by find-
ing the iPARcanopy measurements that were not within ± 3             2.5   Quantifying energy partitioning from leaf
times the standard deviation for the mean of seven consec-                 fluorescence measurements
utive measurements. Once all cases with fluctuating atmo-
spheric conditions were identified, the reflectance, GPP and         The continuous MoniPAM measurements offered a way to
SIF measurements acquired within ± 30 min of their occur-            assess the dynamics of energy partitioning in photosystem
rence were excluded from the analysis. Finally, the remaining        II (PSII). The pathways include photochemistry (P), fluo-
FLoX measurements were resampled into the 30 min tempo-              rescence emission (F) and heat dissipation (H). H is fur-
ral resolution of the eddy covariance measurements.                  ther categorized as a sustained thermal dissipation (D) and
                                                                     a reversible energy-dependent heat dissipation (N). N is con-
2.4    Calculation of canopy SIF, fAPAR and APAR                     trolled by mechanisms that regulate the electron transport of
                                                                     the photosystems and is related to photo-protection mecha-
The QEpro spectral measurements were used to compute
                                                                     nisms and NPQ (Baker, 2008).
top-of-canopy (TOC) SIF in the O2 -A absorption feature

Biogeosciences, 18, 441–465, 2021                                                           https://doi.org/10.5194/bg-18-441-2021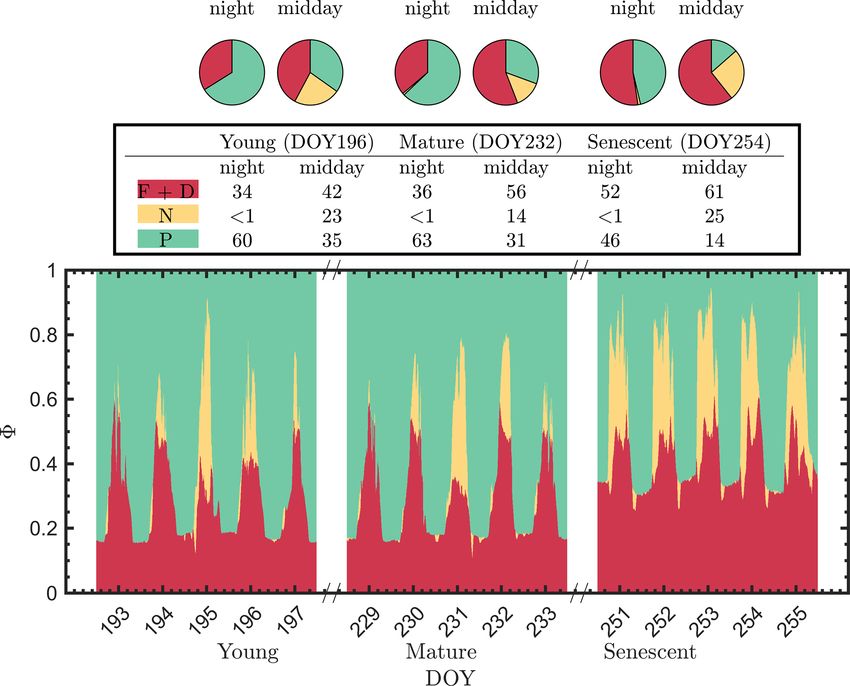
P. Yang et al.: Unraveling the solar-induced chlorophyll fluorescence and photosynthesis relationship                           445

   Relative fluorescence emission efficiency (8∗F ) was de-         the sustained heat dissipation (8∗D ) across the growing sea-
rived from the MoniPAM steady-state fluorescence measure-           son can be inferred from the predawn values of Fm (i.e., Fmo ).
ments Fs with a correction for time-varying leaf absorption         Because Fmo was measured during the night in the absence of
in the growing season. The correction is needed because Fs          both reversible heat dissipation and photochemistry, a change
responds to the absorbed measurement light rather than the          in Fmo must be caused by a change in the sustained heat
incident measurement light as follows:                              dissipation. Therefore, we can take the maximal predawn
                                                                               Fmo
                                                                    8∗Fm = fAPAR        , (when 8∗D is minimal) as a reference and
           Fs                                                                 ∗    leaf
8∗F =              .                                         (3)    express 8D across the growing season as follows:
        fAPA Rleaf
                                                                                      Fmo /fAPARleaf
MoniPAM maximal fluorescence measurements (Fm ), to-                8∗D = 1 −                                 .                 (7)
gether with the steady-state fluorescence (Fs ), allow the as-                      max     [Fmo /fAPARleaf ]
                                                                                192≤DOY≤264
sessment of the absolute efficiencies of absorbed light energy
for photochemistry (8P ) and the reversible energy-dependent        Photosynthetic light use efficiency can be predicted as a func-
heat dissipation (8N ) of PSII. The usual approach for obtain-      tion of leaf temperature, ambient radiation levels, intercellu-
ing 8P is to switch off photochemistry, by applying a satu-         lar CO2 concentrations Ci and other leaf physiological pa-
rating light to leaves, so that the fluorescence measurements       rameters (e.g., photosynthetic pathways and the maximum
in the presence and absence of photochemistry (Fs and Fm )          carboxylation rate at optimum temperature Vcmo ) by using
can be estimated (Maxwell and Johnson, 2000). A generic             a conventional photosynthesis model of Collatz et al. (1991,
expression of 8P proposed by Genty et al. (1989) was used           1992). Van der Tol et al. (2014) established empirical rela-
as follows:                                                         tionships between fluorescence emission efficiency and pho-
                                                                    tosynthetic light use efficiency under various environmental
            Fs
8P = 1 −       .                                             (4)    conditions by using active fluorescence measurements. With
            Fm                                                      these relationships, the fraction of the absorbed radiation by
Unlike photochemistry, it is difficult to fully inhibit heat dis-   a leaf emitted as fluorescence and dissipated as heat can be
sipation. Nevertheless, long-duration dark adaptation can re-       simulated. The MoniPAM system measured leaf temperature
duce reversible heat dissipation to zero. Then, fluorescence        and incoming radiation intensity. We reproduced the efficien-
measurements acquired in the presence and absence of re-            cies of photochemistry, fluorescence and reversible and sus-
versible heat dissipation can be estimated. We took the ex-         tained heat dissipation by using the biochemical model of
pression proposed by Hendrickson et al. (2004) for 8N as            van der Tol et al. (2014). The two most influential model
follows:                                                            input variables, leaf temperature and incoming radiation,
                                                                    were measured by using the MoniPAM. Vcmo was set to
        Fs   Fs                                                     30 µmol m−2 s−1 at 25 ◦ C, a recommended value for the corn
8N =       −    ,                                            (5)
        Fm Fmo                                                      crop (Houborg et al., 2013; Wullschleger, 1993; Zhang et al.,
                                                                    2014). The rest of the model variables (e.g., Ci ) were set to
where Fmo is the highest (or maximal) value obtained for            their default values. In this way, we simulated the efficiencies
dark-adapted leaf fluorescence measurements in the absence          for the temporal resolution of the MoniPAM measurements
of reversible heat dissipation; the predawn value of Fm is          (i.e., 10 min) and examined the relationship among the effi-
typically used as an estimate of true maximal dark-adapted          ciencies as predicted by the biochemical model.
fluorescence (Maxwell and Johnson, 2000). Alternative ex-
pressions of 8N can be found in the literature, but they are        2.6   Statistical analysis
equivalent and convertible to each other. For example, Eq. (5)
can be rewritten as 8N = (1 − 8P )(1 − FFmo ). Furthermore, it      Pearson correlation coefficients (ρ) were computed to eval-
                                           m
can be expressed as a function of a commonly used fluores-          uate the relationships between pairs of observations, such
                                               Fo                   as 8P and 8∗F , or GPP and SIF. In addition to the correla-
cence parameter, NPQ, which is defined as Fmm − 1 (Baker,
                                            NPQ                     tion coefficients, partial correlation coefficients were com-
2008). In that formulation, 8N = (1 − 8P ) NPQ+1  .
                                                                    puted to measure the degree of association between GPP and
   The expression of the sum of 8F and 8D (symbolized as
                                                                    SIF, where the effect of a set of controlling variables was re-
8F+D ) is straightforward because the sum of the efficiencies
                                                                    moved, including fAPAR, iPAR and APAR. Partial correla-
of the four pathways (8F , 8P , 8D and 8N ) is always unity
                                                                    tion is a commonly used measure for assessing the bivariate
and 8F+D = 1 − 8N − 8P and, in the following:
                                                                    correlation of two quantitative variables after eliminating the
          Fs                                                        influence of one or more other variables (Baba et al., 2004).
8F+D =        .                                              (6)    The partial correlation between x and y, given a controlling
          Fmo
                                                                    single variable z, was computed as follows:
Further separation of 8F and 8D from 8F+D is difficult be-
cause neither can be inhibited. However, relative efficiency of

https://doi.org/10.5194/bg-18-441-2021                                                        Biogeosciences, 18, 441–465, 2021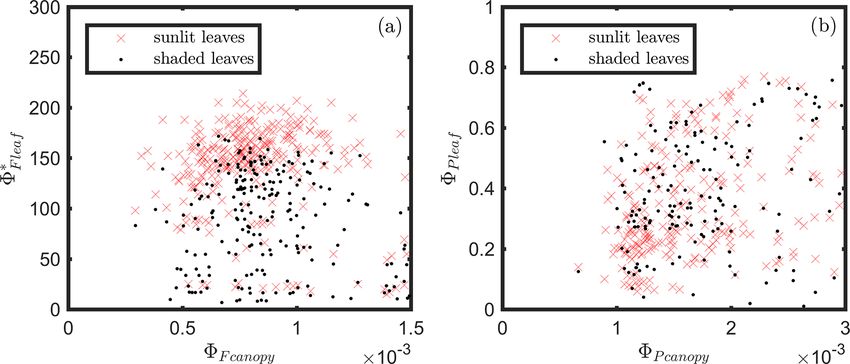
446 P. Yang et al.: Unraveling the solar-induced chlorophyll fluorescence and photosynthesis relationship
structure and leaf biochemistry. As a result, there were
ρx,y− ρx,z ρy,z cases of low SIF, GPP and/or APARcanopy values at high
ρx,y(z) = q q , (8)
2
1 − ρx,z 2
1 − ρy,z iPARcanopy (Fig. 1; red and orange dots), and, vice versa,
high SIF, GPP and/or APARcanopy values at low iPARcanopy
where ρx,y is the Pearson correlation coefficient between (Fig. 1; blue and violet dots). This is shown in the corre-
x and y. Note that the relationships reported in this study lation diagram as well (Fig. 2), which indicates that SIF,
are statistically significant (p value < 0.01) unless otherwise GPP and APARcanopy were all moderately dependent on
stated. leaf biochemistry and on canopy structure according to
Partial correlation can be calculated to any arbitrary or- their correlations with fAPARcanopy , i.e., ρSIF,fAPAR = 0.60,
der. ρx,y(z) is a first-order partial correlation coefficient be- ρGPP,fAPAR = 0.58 and ρAPAR,fAPAR = 0.70 (i.e., numbers in
cause it is conditioned solely on one variable (z). We used a bold blue text; Fig. 2). Compared with either iPARcanopy or
similar equation to calculate the second-order partial coeffi- fAPARcanopy , APARcanopy as their product (located in the
cient that accounts for the correlation between the variables center; Fig. 2) can better explain the variations in SIF and
x and y after eliminating the effects of two variables z and q GPP observations with Pearson correlations of ρ = 0.92 and
(de la Fuente et al., 2004). 0.80, respectively.
After removing the effects of this important control-
ρx,y(z)− ρx,q(z) ρy,q(z) ling variable that affects both SIF and GPP, namely
ρx,y(zq) = q q . (9)
2
1 − ρx,q(z) 2
1 − ρy,q(z) APARcanopy , the correlation between GPP and SIF was
weak (ρSIF,GPP(APAR) = 0.27; refer to results below the tri-
angle’s baseline). In contrast, the correlation between SIF
3 Results and GPP remained significant after controlling for the effects
of the components of canopy APAR, either fAPARcanopy
3.1 Relationship between canopy SIF and GPP or iPARcanopy , i.e., ρSIF,GPP(fAPAR) = 0.72, ρSIF,GPP(iPAR) =
observations 0.66 (equations below the triangle; Fig. 2).
We further investigated how the SIF–GPP relationship var-
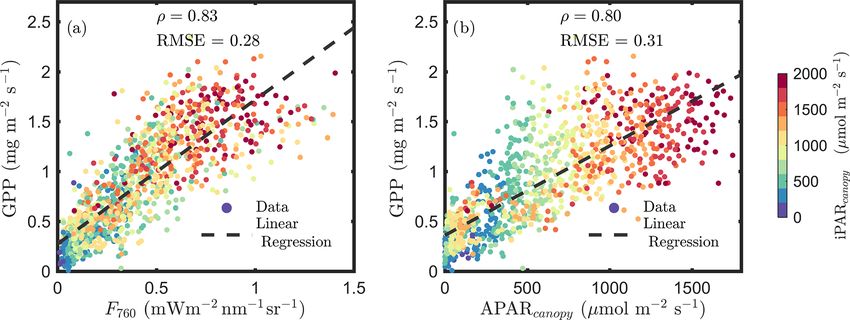
Figure 1a confirms the linear SIF–GPP relationship reported ied seasonally with growth stage and diurnally with time of
in previous studies and shows that F760 and GPP were the day (Fig. 3). The SIF–GPP correlation was significantly
strongly correlated with an overall correlation ρ = 0.83. This lower (by 22 %–27 %) for the senescent canopy than for the
correlation was slightly stronger than the relationship be- young and mature canopy. The Pearson correlation coeffi-
tween APARcanopy and GPP (an overall ρ = 0.80; Fig. 1b). cient was highest when the canopy was fully developed, with
The APARcanopy –GPP relationship was apparently com- the underlying surface covered in the mature stage (ρ = 0.77;
prised of parallel groups of responses (colors) with a large Fig. 3b). As for the different times of the day, we found
variation in GPP exhibited for the same levels of APARcanopy that their correlations were the strongest in the afternoon
(Fig. 1b). This relationship complies with the common un- (ρ = 0.89), while ρ was only 0.76 when the data were ac-
derstanding of the response of photosynthesis to light, show- quired in the morning (Fig. 3d vs. f).
ing the well-known saturation with irradiance as photosyn-
thesis of the whole canopy gradually shifts from light lim- 3.2 Dynamics of energy partitioning in photosystems
itation to carbon limitation, while the unexplained (by light
intensity) variation in GPP can be attributed to stomatal aper- The continuously acquired active fluorescence measurements
ture responses and a time-varying carboxylation capacity, es- offered a way to assess the dynamics of energy partitioning
pecially in the upper sunlit canopy, which experienced larger in photosystems and facilitated the understanding of the re-
variations in light intensity. SIF, which is affected by both lationship between fluorescence and photosynthesis before
light and carbon limitations, shows a more linear response to aggregation to the canopy at the photochemical level. We in-
GPP than APARcanopy (Fig. 1a vs. b). vestigated how the partitioning evolved over time.
Incoming radiation (i.e., iPARcanopy ) had a strong, posi- During the nighttime, as can be seen from the responses
tive, linear relationship with SIF, GPP and APARcanopy (as in the dark bars in Fig. 4, the photosystem energy partition-
shown in Figs. 1 and 2). We investigated these canopy- ing was stable for all leaves through the night, regardless
scale relationships with partial correlation analysis, as dia- of whether they were designated as sunlit or shaded during
grammed in Fig. 2, where, for simplicity’s sake, the sub- the day. Three efficiencies (8P , 8∗F and 8∗D ) showed little
scripts denoting canopy variables were omitted in the di- overnight change, and the reversible heat dissipation 8N was
agram. Our team (Yang et al., 2020) and others (Miao always close to zero. This null response for 8N agrees with
et al., 2018; Migliavacca et al., 2017) have previously the known status/behavior of the most important driver of
demonstrated that, in addition to incoming radiation inten- reversible heat dissipation, the xanthophyll pigment cycle,
sities, the energy available for photochemistry and fluo- which reverts overnight to the energy neutral form, violax-
rescence (i.e., APARcanopy ) is strongly affected by canopy anthin, and then converts during the day to antheraxanthin in
Biogeosciences, 18, 441–465, 2021 https://doi.org/10.5194/bg-18-441-2021P. Yang et al.: Unraveling the solar-induced chlorophyll fluorescence and photosynthesis relationship 447
Figure 1. Relationships between far-red SIF (F760 ) and GPP and between APARcanopy and GPP of a corn canopy in the 2017 growing
season, with a 30 min temporal resolution during daylight hours. F760 and APARcanopy were retrieved from FLoX canopy measurements.
GPP was obtained from the site’s flux tower measurements.
midday dips during the senescent stage. On the other hand,
8P decreased during mornings to midday lows and increased
afterwards (i.e., 8P diurnals were bowl shaped, as shown
in many studies). The changes in 8N and 8P corresponded
closely with the changes in incident radiation, while 8∗F
changes corresponded closely with the dynamics in incident
radiation in the morning but not at midday when the radia-
tion level was high. The light levels influenced the partition-
ing of absorbed radiation into the three different pathways.
However, other factors, such as leaf temperature, intercellu-
lar CO2 concentration and Vcmax (which varied seasonally)
also played roles in determining the absolute efficiencies of
each pathway.
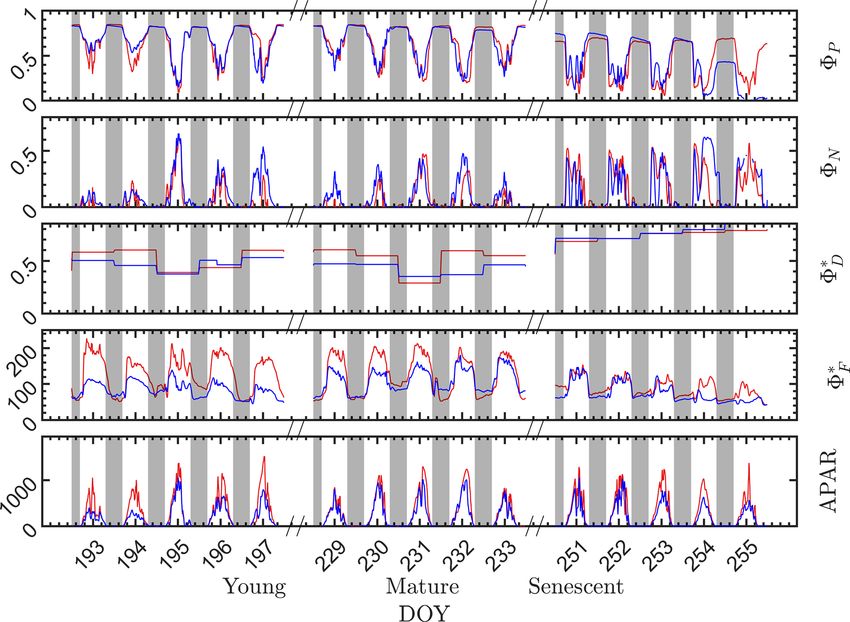
At the seasonal scale (Fig. 4), however, the nighttime en-
ergy partitioning over the three other pathways (8P , 8∗F and
8∗D ) displayed substantial variations. The nighttime 8P was
about 0.82 on all days during the young and mature stages,
which is close to the theoretical maximal value (Zhu et al.,
2008), but it was only about 0.64 during the senescent stage.
Figure 2. Pearson correlation coefficients among the canopy vari-
Similarly, the nighttime relative light use efficiency of flu-
ables iPARcanopy , APARcanopy , fAPARcanopy (indicated in bold
blue text), GPP and SIF for a corn canopy across the 2017 grow-
orescence 8∗F clearly decreased as the canopy development
ing season, based on the data set shown in Fig. 1a and b. The partial progressed from the physiologically robust (young and ma-
correlation coefficients between SIF and GPP (listed at the base of ture) stages to the senescent stage. For example, the night-
the triangle) were determined by removing the effects of the con- time 8∗F for both the sunlit and shaded leaves was above 60 in
trolling variables, fAPAR, iPAR and APAR, respectively. Measure- the young stage but was around 50 in the senescent stage. The
ments had a 30 min resolution. seasonal/growth stage decreases during nighttime in both 8∗F
and 8P were attributed to an increase in sustained heat dis-
sipation 8∗D , since nighttime 8N was always close to zero.
moderately high light levels and subsequently to zeaxanthin In extrapolating 8∗D to daytime, we assumed that the sus-
at high light levels by chemical de-epoxidation (Middleton et tained heat dissipation remained unchanged within any full
al., 2016; Müller et al., 2001). day (from 00:00 to 24:00 LT), but noticeable changes in 8∗D
During the daytime, there were dramatic day-to-day sometimes occurred between 2 d that were consecutive, e.g.,
changes in energy partitioning to photochemistry, fluores- between 8∗D on DOY 194 and DOY 195 and between DOY
cence and reversible heat dissipation (Fig. 4). Generally, both 230 and DOY 231, as indicated in Fig. 4.
8∗F and 8N increased during mornings to midday and de- Although the sunlit and shaded leaves had similar sea-
creased afterwards, except that 8N exhibited unexplained sonal and diurnal patterns, some interesting differences are
https://doi.org/10.5194/bg-18-441-2021 Biogeosciences, 18, 441–465, 2021448 P. Yang et al.: Unraveling the solar-induced chlorophyll fluorescence and photosynthesis relationship Figure 3. Relationships between far-red SIF (F760 ) and GPP of a corn canopy across the 2017 growing season, with a 30 min temporal resolution during daytime hours for three growth stages (a–c), namely young (Y ), mature (M) and senescent (S), for three times in 1 d (d–f), i.e., morning (09:00–11:00 local time – LT), midday (11:00–14:00 LT) and afternoon (14:00–17:00 LT). Colors refer to the iPARcanopy values obtained in conjunction with the GPP and SIF observations, as shown in the legend. Figure 4. Photosystem energy partitioning obtained from in situ active fluorescence measurements made on individual leaves of a corn canopy during the 2017 growing season. Shown are the absolute light use efficiency of photochemistry (8P ), the reversible heat dissipation (8N ), the relative light use efficiency of sustained heat dissipation (8∗D ), the relative light use efficiency of fluorescence (8∗F ) and the photosynthetically active radiation absorbed by individual leaves (APARleaf µmol m−2 s−1 ) for sunlit leaves (red lines) and shaded leaves (blue lines). The nighttime periods, from sunset to sunrise of the next day, are marked with gray rectangles. Biogeosciences, 18, 441–465, 2021 https://doi.org/10.5194/bg-18-441-2021
P. Yang et al.: Unraveling the solar-induced chlorophyll fluorescence and photosynthesis relationship                         449

observed. As expected, the radiation levels were higher for       clearly shows that the relationship between 8∗F and 8P dur-
the sunlit leaves than for the shaded leaves, which produced      ing daylight (09:00–17:00 LT) was different for the sun-
higher 8∗F for the sunlit leaves and slightly lower 8P at the     lit (Sun-adapted) vs. shaded (shade-adapted) leaves, since
young and mature stages. In comparison to the difference in       the sunlit leaves were more often exposed to iPAR above
8∗F , the difference in 8P was less pronounced. At the senes-     1000 µmol m−2 s−1 . The higher 8P values were obtained
cent stage, 8P of the shaded leaves was substantially lower       for relatively low iPARleaf , whether sunlit or shaded. For
than sunlit leaves despite receiving lower radiation, which       sunlit leaves, 8∗F and 8P were positively correlated over-
normally would lead to higher 8P . This could be attributed to    all (ρ = 0.53; Fig. 6a) and in conditions with moderate to
the different leaf ages and functionality of sunlit and shaded    high light intensity (iPARleaf > 500 µmol m−2 s−1 , excluding
leaves; for example, shaded corn leaves senesce earlier than      blue and teal dots), ρ = 0.60. In contrast, at low light in-
sunlit leaves. Additionally, 8∗D of sunlit leaves was higher      tensity (iPARleaf < 500 µmol m−2 s−1 ; blue dots), correlation
than the shaded leaves, while 8N of the sunlit and shaded         between 8∗F and 8P was weak and negative for 8P > 0.4.
leaves was similar.                                               These two efficiency terms were uncorrelated in shaded
   It is evident that the contribution to the photosynthetic      leaves (Fig. 6b), and 8∗F was much lower in the shaded than
process by the combined nighttime fluorescence and sus-           in sunlit leaves. The correlations on individual days are pre-
tained heat dissipation group (8F+D – red in Fig. 5) increased    sented in Fig. 8a, which shows that positive correlations be-
through the growing season to competitively reduce photo-         tween 8∗F and 8P are more often for sunlit leaves than shaded
chemical efficiency (8P – green), especially during senes-        leaves.
cence. The increase in sustained heat dissipation (Fig. 4) also      At the seasonal scale, the midday 8∗F and 8P values (the
resulted in a decrease in 8P in the daytime as the young          average of all values acquired between 11:00 and 14:00 LT)
and mature stages progressed through the senescent stage,         had a quasi-linear, positive relationship for both the sun-
although 8P can vary substantially during the daytime. Addi-      lit and shaded leaves when iPARleaf > 500 µmol m−2 s−1
tionally, the diurnally reversible heat dissipation (8N – gold)   (Fig. 6c). In contrast, at low average midday light inten-
was generally higher at the senescent stage than at the young     sities, the relationships were clearly negative. The 8P val-
and mature stages, which contributed to the reduction in pho-     ues tended to decrease with the increasing light intensities,
tochemical efficiency as well. In the pie charts, we focus on     while the relationship between 8∗F and iPARleaf was not def-
the energy partitioning in both nighttime and midday since        inite. However, the ranges for 8∗F in sunlit and shaded leaves
they portray the potential maximal 8P (i.e., the photosyn-        clearly represent two populations, i.e., 8∗F shaded was < 110
thetic reaction centers in the nighttime are mostly open) and     (Fig. 6c), whereas 8∗F sunlit was > 100 (Fig. 6c). These re-
the steady-state 8P at the most common time of day for satel-     sults could have implications for interpreting canopy-scale
lite observations, respectively.                                  measurements.
   The pie charts (Fig. 5) clearly show how the partitioning         The linear relationship obtained between 8P and 8N
of the relative efficiency pathway contributions changed with     was considerably stronger for both sunlit and shaded leaves
the growth stage on the three representative clear-sky days.      (Fig. 7a and b) than the correlation between 8∗F and 8P pre-
The nighttime 8P was reduced by 20 % between the young            viously shown for sunlit leaves (Fig. 6a). Here, both sunlit
and senescent stages, while 8F+D increased by 19 % during         and shaded leaves showed consistent and strong linear de-
senescence. The pie charts also clearly show the very strong      creases in 8P as 8N increased (Fig. 7a and b) in response to
role of reversible heat dissipation in limiting midday photo-     increases in the intensity of incoming light (iPARleaf ; Fig. 4).
synthesis throughout the growing season. For example, the         Furthermore, the 8P and 8N relationships definitely varied
percent contribution for the pathways from the young crop         in response to the sustained heat dissipation (8∗D ; levels rep-
(DOY 196) was 35 % for 8P , 23 % for 8N and 42 % for              resented in the color bar) in a similar fashion for both sunlit
8F+D . The corresponding values for leaves in the mature          and shaded leaves, although higher 8∗D values (orange and
crop (DOY 232) were 31 %, 14 % and 56 %. And for the              red dots) were obtained in sunlit leaves. The efficiency of
leaves in the senescing crop (DOY 254), the corresponding         photochemistry obviously declined at higher 8∗D , as indi-
values were 14 %, 26 % and 61 %. Combining these together,        cated with the arrows in Fig. 7, and it was especially pro-
Fig. 5 further highlights the complexity of energy efficiency     nounced in sunlit leaves. For shaded leaves, there were cases
dynamics underlying the photosynthetic process.                   with higher 8∗D that did not result in lower 8P (orange dots
                                                                  in Fig. 7b). When both thermal dissipations were fully man-
3.3   Relationships among photosynthesis, fluorescence            ifested, the 8P was greatly reduced; in sunlit leaves, this re-
      and heat dissipation at leaf level                          duction was ∼ 40 %. The correlations on individual days are
                                                                  presented in Fig. 8b, which shows 8N and 8P are negatively
Next, we examine the leaf level efficiency terms, ob-             correlated with each other for both sunlit and shaded leaves.
tained from in situ measurements, in terms of their com-             At the seasonal scale, as can be seen from Figs. 4 and 5,
bined responses. The first set compares 8∗F and 8P in the         8P decreased while 8∗D increased as the canopy progressed
context of variable iPARleaf (Fig. 6a and b). This figure         through its growth stages. Their seasonal relationship is de-

https://doi.org/10.5194/bg-18-441-2021                                                      Biogeosciences, 18, 441–465, 2021
450 P. Yang et al.: Unraveling the solar-induced chlorophyll fluorescence and photosynthesis relationship Figure 5. Summary chart of the efficiency responses presented in Fig. 4 for sunlit leaves. The energy partitioning in both nighttime (sunset– sunrise) and midday (11:00–14:00 LT) measurements for one representative date per growth stage (Y – DOY 196; M – DOY 232; S – DOY 254) is diagrammed in the pie charts. Clearly, the photosynthetic efficiencies (P – green) are constrained, especially during daytime, by the combined action of reversible thermal dissipation efficiency (N – gold) and the fluorescence and sustained thermal dissipation (F+D – red) efficiency. picted in Fig. 7c, showing a same-day comparison of the mid- ing negative relationship (8P vs. 8∗F ) into an observed ap- day 8P value (the average between 11:00 and 14:00 LT), as parent positive relationship at leaf scale, which contributes a function of 8N across the growing season, noting that 8∗D to the positive relationship of GPP and SIF at canopy scale. remained unchanged within any full day. Generally, 8N and In fact, accounting for the effects of either 8N or 8∗D re- 8P exhibited an overall negative correlation, but clearly their duced the correlation coefficients between 8P and 8∗F . For relationship was regulated by 8D . This is seen in the differ- sunlit leaves, controlling for only 8N reduced the correla- ent midday 8P responses at high vs. low 8∗D values. At the tion from 0.53 to 0.05 (by ∼ 0.48 units); after controlling for same level of 8N (around 0.05), the magnitudes of midday only 8∗D , the correlation dropped by 0.45 units to 0.08. For 8P varied by up to 0.45 (65 %; from 0.37 to 0.61 in Fig. 7c) shaded leaves, this reduction was from 0.10 to −0.31 after due to variations in the efficiency of the sustained heat dissi- controlling for 8N or to −0.35 after controlling for 8∗D . The pation, which varied between 0.1 and 0.6. reduction in the correlation between 8P and 8∗F was caused We have shown that 8P was regulated by heat dissipation by diurnal variations in 8N and seasonal variations in both (Figs. 5 and 7) and was moderately correlated with 8∗F at 8N and 8∗D . light levels above 500 µmol m−2 s−1 but was negatively cor- Results of model simulations are presented in Figs. 9 and related 8∗F at lower light levels (Fig. 6). With the dynamics 10. In comparison with Figs. 6 and 7, which describe our of energy partitioning within the photosystem now quanti- in situ measurements, these two figures show that the bio- fied, we interpret the emerging relationship between photo- chemical model outputs were more successful in describing chemical and fluorescence efficiencies, namely 8P and 8∗F photosynthetic efficiency as a function of reversible heat dis- (Table 2), in the context of thermal dissipation efficiencies sipation (8N ) than fluorescence efficiency (8F ). Specifically, (8N , 8∗D ). After eliminating the effects of both sustained and for the 8P − 8F relationships, the Fig. 9 simulation shows reversible heat dissipation, 8P and 8∗F were negatively and some similarity to the Fig. 6 measurements but clearly does equally correlated (ρ = −0.75) for both sunlit and shaded not capture the different responses we obtained for sunlit ver- leaves. As surprising as this is, the presence of either sus- sus shaded leaves. However, Fig. 10 generally replicates the tained or reversible heat dissipations changed this underly- general responses expected based on in situ measurements Biogeosciences, 18, 441–465, 2021 https://doi.org/10.5194/bg-18-441-2021
P. Yang et al.: Unraveling the solar-induced chlorophyll fluorescence and photosynthesis relationship                                      451

Figure 6. Relationships between the light use efficiency of photochemistry (8P ) and the relative fluorescence light emission efficiency (8∗F )
for sunlit leaves and shaded leaves across the 2017 growing season in a corn canopy are shown, including all daytime measurements (09:00–
17:00 LT – a and b) and midday (11:00–14:00 LT), seasonally averaged measurements (c). Colors refer to the iPARleaf values shown in the
legend bar. The data in (c) were classified into two groups by iPARleaf , with a threshold value of 500 µmol m−2 s−1 .

Figure 7. Relationships between the light use efficiency of photochemistry (8P ) and the reversible heat dissipation (8N ) for sunlit leaves and
shaded leaves across the 2017 growing season in a corn canopy are shown, including all daytime measurements (09:00–17:00 LT – a and b)
and midday (11:00–14:00 LT), seasonally averaged measurements (c). Colors refer to the midday 8∗D values shown in the legend. The arrows
indicate the shift in linear response between 8P and 8N as 8∗D becomes the dominant energy pathway, thus lowering the photosynthetic
potential.

https://doi.org/10.5194/bg-18-441-2021                                                                 Biogeosciences, 18, 441–465, 2021
452                  P. Yang et al.: Unraveling the solar-induced chlorophyll fluorescence and photosynthesis relationship

                                                                        plants in the field. Another likely reason contributing to the
                                                                        differences between simulations and observations is that, in
                                                                        using the model of van der Tol et al. (2014) to derive 8F
                                                                        from 8P , 8D is assumed to be a constant and 8N is empir-
                                                                        ically estimated as a function of 8P /8P0 . The observations
                                                                        shown in Figs. 4 and 5 prove that 8D varied over the grow-
                                                                        ing season and, therefore, cannot be considered as a constant.
                                                                        These findings may help improve the modeling of 8F at the
                                                                        biochemical level and thus improve our understanding of the
                                                                        relationship between SIF and GPP at the canopy scale.

                                                                        3.4   Comparison of light use efficiencies at leaf and
                                                                              canopy levels

                                                                        The responses of the efficiencies to APAR and the relation-
                                                                        ships between these efficiencies are diagrammed in Fig. 11,
                                                                        showing the Pearson correlation coefficients between pairs
                                                                        of variables for leaves (Fig. 11a) that were either sun-
                                                                        lit or shaded (indicated in bold blue text) and for canopy
                                                                        (Fig. 11b).
                                                                           At the leaf level, we see that 8∗F showed a moderate corre-
Figure 8. Diurnal correlations between 8∗F and 8P and between           lation to 8P for sunlit leaves (ρ = 0.53) but very low correla-
8N and 8P for sunlit and shaded leaves. The Pearson correlation         tion to 8P for shaded leaves (ρ = 0.10). The highest correla-
coefficients for the days with more than five available observations    tions were negative, denoting inverse relationships between
are presented.                                                          8N and 8P (−0.74 sunlit and −0.87 shaded), whereas sim-
                                                                        ilar positive correlations (0.64 sunlit and 0.68 shaded) were
                                                                        obtained between 8N and APARleaf (located in the center;
Table 2. Correlation coefficients (the first row) and partial cor-
                                                                        Fig. 11a) as expected, since 8N is well known to be light
relation coefficients (i.e., controlling for or eliminating sepa-
rate effects) between fluorescence and photosynthesis. The coef-        level sensitive when invoking the xanthophyll cycle. Notice
ficients are placed in italics if the relationship is not significant   that all of the high correlations (> 0.64 or < −0.74), whether
(p value > 0.10).                                                       positive or negative, are located on the left-hand side of
                                                                        Fig. 11a, which compares the efficiencies of photochemistry
  8∗F vs. 8P                       Sunlit leaves    Shaded leaves       with efficiencies of reversible thermal dissipation (8N ) and
                                                                        their connection through APARleaf . The remaining correla-
  Without controls                         0.53              0.10
                                                                        tions on the right-hand side, between 8∗F and either 8P , 8N
  Controlling 8N                           0.05             −0.31
                                                                        or APARleaf , are significantly lower (from −0.33 to 0.53).
  Controlling 8D                           0.08             −0.35
  Controlling both 8N and 8D              −0.75             −0.75          At the canopy level, 8Fcanopy also showed a moderate cor-
                                                                        relation to 8Pcanopy with ρ = 0.37 (Fig. 11b; for the scatter
                                                                        plot between 8Pcanopy and 8Fcanopy ; see Fig. A1), which falls
                                                                        between the values for sunlit and shaded leaves (Fig. 11a).
(Fig. 7), portraying the strong negative impact of 8N on 8P ,           An inverse relationship between 8Pcanopy and APARcanopy
but it does not convey the variability captured under field             (−0.41) was found at the canopy level, but this correla-
conditions. These differences occurred in the simulations be-           tion was much weaker than that at the leaf level (−0.75
cause we did not consider the physiological (i.e., enzyme ac-           for both sunlit and shaded leaves). The photochemical re-
                                                                                                 R531 −R570
tivity) or physical (i.e., thickness and pigment ratios) differ-        flectance index PRI = R    531 +R570
                                                                                                             (Gamon et al., 1992), as an
ences among leaves at different growth stages. Neither did              indicator of 8Ncanopy , appeared to have no correlations with
we consider the physical differences or photochemical poten-            either APARcanopy or 8Pcanopy , while at the leaf level these
tial differences (e.g., total chlorophyll content and Chl a/b           three variables had strong correlations (located on the left-
ratios; RuBisCO activity) between sunlit and shaded leaves              hand side of Fig. 11a). Comparing the efficiencies obtained
in this modeling experiment. Therefore, it is to be expected            from the leaf and canopy level measurements (i.e., 8Pcanopy
that the simulations for sunlit and shaded leaves would be              vs. 8P or 8Fcanopy vs. 8∗F ), no clear relationships were found
similar and not display the differences observed in field mea-          (ρ< 0.1; data are shown in Fig. A2).
surements. Furthermore, we did not include changes in leaf                 A comparison of Fig. 11a with Fig. 12a reveals that the
display geometry induced by low water stress (i.e., drought)            strength of correlations between pairs of variables describ-
in the simulations, but it is a common phenomenon in corn               ing energy partitioning for both sunlit and shaded leaves in-

Biogeosciences, 18, 441–465, 2021                                                           https://doi.org/10.5194/bg-18-441-2021
P. Yang et al.: Unraveling the solar-induced chlorophyll fluorescence and photosynthesis relationship 453 Figure 9. Reproduction of Fig. 6 with simulated variables from the biochemical model of van der Tol et al. (2014). Figure 10. Reproduction of Fig. 7 with simulated variables from the biochemical model of van der Tol et al. (2014). creased for most pairs when evaluated at midday vs. diurnal leaves showed similar but even stronger responses than sun- measurements (Table 3). For example, three pairs showed no- lit leaves overall at midday, especially for the following two table correlation enhancements for sunlit leaves in midday pairs: 8N vs. 8∗F (shaded; from −0.23 to −0.45) and 8N across the growing season, namely the negative correlations vs. 8∗F (from 0.10 to 0.27). In addition, for shaded leaves, between 8N and 8∗F (from −0.33 to −0.45) and between the midday positive correlation between APARleaf and 8N APARleaf and 8∗F (from −0.10 to −0.27) and the positive was also higher (from 0.68 to 0.77), as was the negative cor- correlation between 8P and 8∗F (from 0.53 to 0.62). Shaded relation between 8N and 8P (from −0.87 to −0.92), while https://doi.org/10.5194/bg-18-441-2021 Biogeosciences, 18, 441–465, 2021
454                  P. Yang et al.: Unraveling the solar-induced chlorophyll fluorescence and photosynthesis relationship

Figure 11. Pearson correlation coefficients between absorbed PAR (APARleaf and APARcanopy ) and light use efficiencies for all data ob-
tained for a corn canopy across the 2017 growing season at both leaf (a) and canopy levels (b). Light use efficiency of photochemistry
(8P ), relative fluorescence emission efficiency (8∗F ) and efficiency of variable heat dissipation (8N ) of sunlit leaves and shaded leaves (in-
dicated in bold blue text) during daytime (09:00 to 17:00 LT) are obtained from in situ active fluorescence measurements made on individual
leaves. Canopy light use efficiency of photochemistry (8Pcanopy ) and of fluorescence (8Fcanopy ) are approximated by GPP/APARcanopy and
F760 /APARcanopy respectively. PRI is used as an indicator of canopy light use efficiency of variable heat dissipation (8Ncanopy ), but the exact
values of 8Ncanopy are unknown (noted with question marks). The leaf level and canopy level variables had 10 min and 30 min resolutions,
respectively.

the positive correlation between APARleaf and 8∗F became a                 4     Discussion
weak negative association (from 0.25 to −0.14). No notice-
able correlation changes occurred for sunlit leaves at midday              4.1    Physical basis for the SIF–GPP relationship
vs. daily measurements for the following two pairs: 8N −8P
(ρ ≈ −0.75) or APARleaf −8N (ρ ≈ 0.61). The negative cor-                  Incoming radiation intensity, leaf biochemistry, leaf and
relations were equal for sunlit and shaded leaves between 8N               canopy structure all affect APARcanopy , which is the en-
and 8P whether determined for daily or at midday, but the                  ergy source for photosynthesis, SIF and heat dissipation. We
midday correlation was stronger (from −0.75 to −0.81). Es-                 found an equal contribution of iPARcanopy and fAPARcanopy
pecially noteworthy are the strong negative correlations that              to the observed SIF–GPP canopy relationship. The corre-
were observed (Table 3) in sunlit and shaded leaves for 8N                 lation coefficients between SIF and GPP remained rela-
and 8P (between −0.74 and −0.92) and APARleaf and 8P                       tively high after controlling either term. In stark contrast, af-
(between −0.75 and −0.81).                                                 ter holding APAR (their product; iPARcanopy × fAPARcanopy )
   A comparison of Fig. 11b and Fig. 12b reveals that, at                  constant, the SIF–GPP canopy correlation coefficient was re-
the canopy scale, all correlations between variable pairs were             duced from 0.83 to 0.27. This demonstrates the dominance
relatively modest (e.g., ρ ≤ ± 0.55) but were higher at mid-               of APARcanopy in determining the relationship between SIF
day than for daily observations across the growing season,                 and GPP. Compared to APARcanopy , SIF was slightly better
except for 8Ncanopy (as estimated with the PRI) vs. 8Fcanopy               correlated with GPP (Fig. 1). The physiological information
(≤ −0.07; indicating no relationship). For the remaining five              implied in GPP was seemingly better expressed with SIF than
pairs, the strongest and most improved responses at midday                 APARcanopy .
were between 8Pcanopy and 8Fcanopy (from 0.37 to 0.53) and                    The interfering effects of fesc at the canopy scale have
between APARcanopy and 8Pcanopy (from −0.41 to −0.55),                     not been considered explicitly. They are implicit in the rela-
with a stronger association also seen for APARcanopy vs.                   tions of ρSIF,GPP(APAR) (Qiu et al., 2019). When accounted
8Fcanopy (from −0.25 to −0.32). It is apparent that the canopy             for, they may provide a better estimate of the correlation
responses based on remote sensing, without including critical              attributable to the physiological response of photosystems
information on the sunlit/shaded canopy illumination frac-                 (i.e., ρSIF,GPP(APAR,fesc) > 0.27). The magnitude and sign of
tions (Figs. 11b and 12b), were less successful in describ-                ρSIF,GPP(APAR) are nevertheless consistent with the moder-
ing the energy partitioning that was provided at the leaf level            ate correlation we found between leaf 8∗F and 8P for sunlit
(Figs. 11a and 12a).                                                       leaves and the weak correlation for shaded leaves (Figs. 6 and
                                                                           11a). In addition, we found that the positive relationship be-
                                                                           tween 8∗F and 8P at the seasonal timescale is dominated by
                                                                           the progressive increase in sustained heat dissipation (8∗D )
                                                                           during senescence. In contrast, there was significant diurnal
                                                                           but no clear seasonal variation in 8N .

Biogeosciences, 18, 441–465, 2021                                                                https://doi.org/10.5194/bg-18-441-2021
You can also read


