REPORT Svalbard Beach Litter Deep Dive - Salt Lofoten AS
←
→
Page content transcription
If your browser does not render page correctly, please read the page content below
REPORT

Svalbard Beach Litter Deep Dive

                             SALT report no. 1033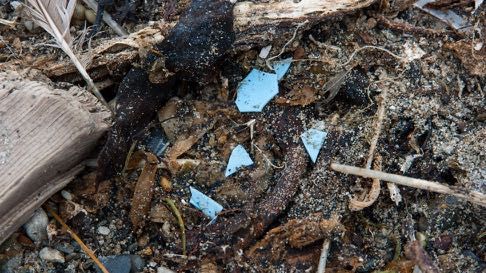
Rapporttittel / Report title
Svalbard Beach Litter Deep Dive
Forfatter(e) / Author(s)                                                                SALT rapport nr / Report no
Jannike Falk-Andersson, SALT (Development of Beach                                      1033
litter Deep Dive method, main author).
                                                                                        Dato / Date
Wouter Jan Strietman, Wageningen Economic
                                                                                        2019
Research (Development of net protocol, recorded
and provided data for net analysis, input section                                       Antall sider / Number of pages
2.1.2).
                                                                                        44 + attachments
Other project partners
                                                                                        Distribusjon / Distribution
Roger B. Larsen, UiT The Arctic University of Norway
                                                                                        https://www.sysselmannen.no/Svalbards-
Geir W. Gabrielsen/ France Collard, Norwegian Polar
                                                                                        miljovernfond/Resultat---Rapporter/
Institute
                                                                                        www.salt.nu
Eelco Leemans, Leemans maritime consultancy
Amanda Schadeberg, Wageningen Marine Research
(took notes during the workshop)
Emil R. Johannessen, SALT (took notes during the
workshop)
All partner institutions participated in the Svalbard
deep dive workshop and at the Arctic Frontiers
stakeholder workshop, and were given the
opportunity to provide feedback on a draft version of
the report.

Finansiert av / Financed by                                                             Referanse / reference

The Svalbard Environmental Protection Fund                                              18/00194-3
Sammendrag / Summary

«Beach litter deep dive» is a new method developed by SALT in cooperation with a broad range of experts. The
method aims at providing knowledge on the sources of marine litter and the reasons behind littering, including
whether litter originates from local-, regional- or global activities. It has proven a promising tool to cost-
effectively provide knowledge that can be used to implement measures that can prevent waste from entering
our oceans. This report summarises findings from a deep dive into beach litter collected through Clean-up
Svalbard. The aim of the project was both to refine the methodology and to identify items that should be given
particular attention in future monitoring of beach litter in the region. The analysis shows that the fishing
activity in the region, rather than long-range transport, is likely the most significant source of beach litter in the
region. Analysis of nets identified that the large majority of these were of a type used by the Norwegian and
Russian trawl fleet in the Barents Sea, and that these were sections of nets cut out to repair the trawl. Ropes,
including rope cut-offs, could also largely be traced back to fishing activities. Further analyses are needed to
identify the likely sources of other items, such as food- and cleaning containers, sanitary products and oil- and
chemical containers, but preliminary analysis suggests that there is a link between the nationality of these
containers and the nationality of vessels operating in the area.
Prosjektleder / Project manager                                                         Kvalitetskontroll / Quality control
Jannike Falk-Andersson                                                                  Kjersti Eline Tønnessen Busch
          © SALT Lofoten AS, Rapporten kan kun kopieres i sin helhet. Kopiering av deler av rapporten eller gjengivelse på annen måte er kun tillatt etter skriftlig samtykke fra SALT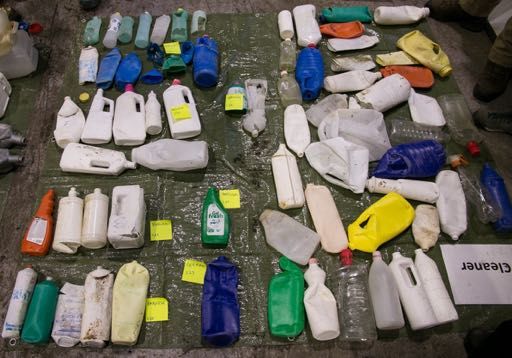
PREFACE
      This work to identify the sources of- and reasons behind marine litter found on the shores of
      Svalbard has brought together a number of stakeholders in collection of data, analysis and
      discussions on preventive measures. On behalf of SALT, Wageningen Economic Research, UiT The
      Arctic University of Norway, the Norwegian Polar Institute and Leemans Maritime Consultancy. I am
      grateful for the funding from the Svalbard Environmental Protection Fund, for the opportunity to
      develop the beach litter deep dive methodology further and provide new knowledge on the sources
      of marine litter at Svalbard. I would also like to acknowledge the co-funding from the MARP project
      (project number 257584/E10, POLARPROG), Wageningen Research, the Dutch Ministry of Foreign
      Affairs and the Dolfinarium (see attachment 6 for details). This reports also includes results from net
      analysis carried out as part of the 2017 Arctic Marine Litter project coordinated by Wageningen
      Economic Research.
      A special thanks is also extended to volunteers contributing to the Clean-up Svalbard project and all
      the stakeholders and experts contributing to the project. In addition to the project team, these were:
      Ben Wensink, Ymuiden Stores/ Wireco, Sarah Auffret, Association of Arctic Expedition Cruise
      Operators, Silje Hagen, Aktiv i Friluft, Dagfinn Lilleng, the Norwegian Directorate of Fisheries, Marloes
      Schravesande, University of Utrecht, Margrethe Keyser, Prosjekt Isfjorden, and Elisabeth Thomas,
      Plymouth Marine Laboratory.
      We would like to dedicate this report to Sarah Auffret whose knowledge about and passion for the
      issue of plastic pollution in the Arctic and reducing the use of single-use plastic products on Arctic
      expedition cruise vessels will be deeply missed. We believe this report will contribute to achieving
      her goals of a cleaner Arctic and more responsible human behaviour in the region.
      Tromsø, 30.03.19

      Jannike Falk-Andersson
      Project leader, SALT

Main chapters
1. Background and aim of the study
2. Knowledge status of the sources of marine
3. Svalbard beach litter Deep Dive
4. Results
5. Discussion
6. Conclusions
                                                                                                                  SALT
7. References                                                                                               post@salt.nu
8. Attachments                                                                                             +47 919 22 802
                                                                                                             Postboks 91
                                                                                                            8301 Svolvær
                                                                                                            www.salt.nu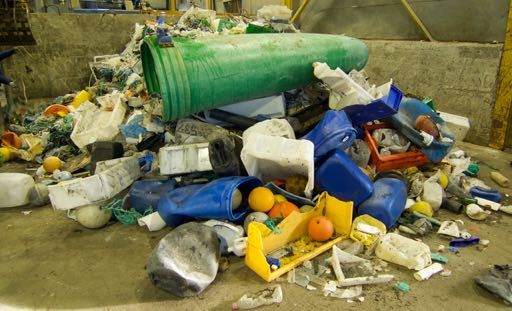
CONTENT
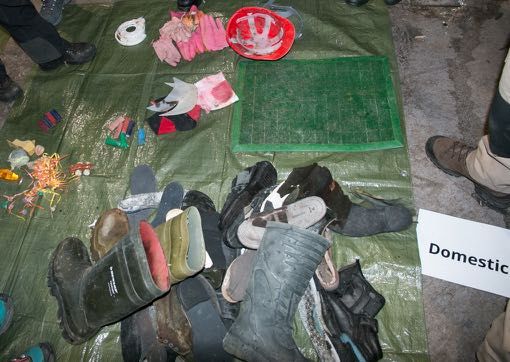
4.3.5 Domestic 28
Preface 3
4.3.6 Cleaner products 29
Content 4 4.3.7 Cosmetics 30
Tables 5 4.3.8 Plastic pieces 30
Figures 5 4.3.9 Industry 30
Summary and recommendations 7 4.3.10 Fishing nets 31
Key terminology 8 4.3.11 Ropes 32
1 Background and aim of the study 9 4.4 Feedback on the protocol 32
1.1 Introduction 9 4.4.1 Comments to source categories 33
4.4.2 Further ideas and
2 Knowledge status of the sources of marine recommendations for data collection and
litter at Svalbard 10 cooperation 33
2.1 Studies of beach litter at Svalbard 12
2.1.1 OSPAR Beach litter monitoring data 5 Discussion 34
12 5.1 Fisheries is the main source of litter at
2.1.2 The Arctic Marine Litter Project Svalbard 34
beach litter analysis 14 5.2 Local versus global sources of marine
2.1.3 Citizen science study involving litter 35
cruise tourists 15 5.3 How representative is beach litter with
respect to the sources of marine litter at
3 Svalbard beach litter Deep Dive 16 Svalbard? 38
3.1 Methodology 16 5.4 Implementation of the deep dive
3.1.1 Development of the Svalbard Deep protocol 39
Dive Protocol 16 5.5 Cooperation on data collection and
3.1.2 Development of the Net Protocol 17 stakeholder communication 40
3.1.3 Rope analysis 18
3.1.4 Deep litter deep dive workshop 19 6 Conclusions 41
4 Results 19 7 References 42
4.1 Day 1 Deep dive of the “rest” fraction 8 Attachments 45
collected at Franzøya 19 Attachment 1 Instructions beach litter deep
4.2 Analysis of nets 22 dive workshop Svalbard 45
4.3 Discussions on the different sources of Attachment 2 Deep dive protocol 50
litter 24 Attachment 3 Report from beach clean-up
4.3.1 Floats 24 by kv nordkapp 51
4.3.2 Fishery related items 25 Attachment 4 The net protocol 53
4.3.3 Plastic sheeting 26 Attachment 5 The workshop program 54
4.3.4 Food 27 Attachment 6 Specification of co-funding 56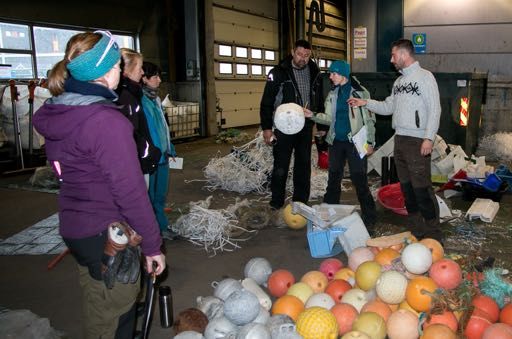
Tables
Table 1 Top 10 items in numbers from 14
                                                        Table 3 Overview of actors involved in beach
Svalbard Beaches.                             14
                                                        cleaning and analysis at Svalbard. "X" indicates
Table 2 Results from beach surveys. Litter              current actions, "(X") indicates potential
quantities given in g m-2. P: pebble, S: sand,          action.                                       34
M: mud, G: gravel, +: present. Table from
Bergmann et al (2017).                         15

Figures
Figure 1 Plastic input into the oceans by
                                                        Figure 10 Relative proportion of fisheries
different type of sources (Illustration: UNEP
                                                        related items in numbers and weight, as well
and GRID-Arendal (2016)).                     11
                                                        as the difference between the two.         21
Figure 2 Regional variations in total amount of
                                                        Figure 11 "Other floats" to the left and
plastic waste produced compared to the
                                                        "bundle of strapping band" to the right
proportion of plastic waste mismanaged
                                                        (Phote: WJ Strietman).                        21
(Illustration: UNEP and GRID-Arendal (2016)).
                                             11         Figure 12 The number of domestic items of
                                                        foreign, Norwegian and unknown origin     22
Figure 3 A global map illustrating the
estimated mass of mismanaged plastic waste              Figure 13 The number of nets being < 5-year-
(millions of tons) generated in 2010 by                 old and > 5 years old in 2017, 2018 and
populations living within 50km of the coast             combined 2017 and 2018                     23
(Adapted from Jambeck et al (2015)).        12          Figure 14 The proportion of nets being lost
Figure 4 Identifiable sources of litter at              accidentally vs those discarded in the 2017
Svalbard according to 2011-2016 OSPAR                   analysis vs the 2018 analysis. One net in the
beach litter registrations of number of litter          2017 analysis was evaluated as "unknown". 23
items.                                         13       Figure 15 The number of nets of different
Figure 5 Unidentifiable pieces of plastic,              types identified in the net analysis in 2017 and
broken apart at the beach. (Photo: WJ                   2018.                                         24
Strietman).                                   15        Figure 16 Experts identifying the origin of
Figure 6 Fish net analysis at the Longyearbyen          floats (Picture: WJ Strietman).               25
waste management facility (Photos: WJ.                  Figure 17 Analysis of various fisheries related
Strietman).                                  18         items (Picture: Sarah Auffret).               26
Figure 7 The basis for the deep dive analysis           Figure 18 Blue, white and transparent pieces
on Day 1                                      19        of sheeting (Photo: WJ Strietman)           27
Figure 8 The proportion of different litter             Figure 19 Food related items (Photo: WJ
categories in terms of number and weight, as            Strietman)                                    28
well as the difference between these, for the
"rest" fraction collected at Franzøya.      20          Figure 20 Domestic litter (Photo: WJ
                                                        Strietman)                                    29
Figure 9 Examples of rope finings, including
rope cut-offs, and expert opinion on the origin         Figure 21 Cleaner bottles (Photo: WJ
of the ropes, as well as a piece of net cut-off         Strietman)                                    29
and its origin (Photos by WJ Strietman and              Figure 22 Cosmetics (Phote: WJ Strietman) 30
SALT).                                         20

                                                    5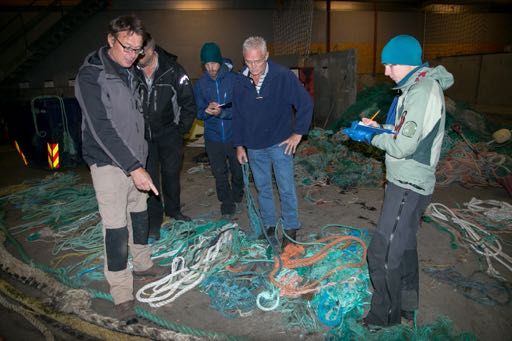
Figure 23 Industry related items (Picture:              authorities based on VMS data (right). (Figures
Sarah Auffret)                                 31       from http://www.ices.dk/explore-
                                                        us/Action%20Areas/ESD/Pages/Barents-Sea-
Figure 24 Rope analysis with experts (Photo:
                                                        Pressures-Abrasion.aspx).                    36
WJ Strietman)                               32
                                                        Figure 26 Plastic pollution in the ocean
Figure 25 Norwegian and foreign fisheries
                                                        showing the relative distribution of marine
activity in the Norwegian Economic Zone, as
                                                        plastic pollution and the average density on
reported to Norwegian authorities based on
                                                        beaches, on and at the sea surface and at the
VMS-data (left). Russian and non-Russian
                                                        sea floor (modified from Eunomia(2016)). 39
fisheries activities in the Russian Economic
Zone in 2014 as reported to Russian

                                                    6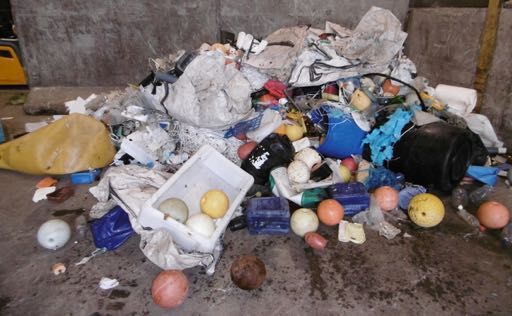
Summary and recommendations
Beach litter deep dive is a method for registering and analysing marine litter to give more
management relevant knowledge on the sources of and reasons behind littering. This report
summarizes the knowledge gained from implementing a deep dive on beach litter collected at
Svalbard as well as an extensive net protocol where experts in fishing gear helped identifying the
type of nets found, their likely origin and why they ended up at sea.

The analysis shows that Barents Sea fishing vessels are likely the most important source of marine
litter in the region. Furthermore, the net analysis documented a practice of discarding sections of
nets that have been cut out as part of repairing the trawl. The nets were of a type used by Norwegian
and Russian trawlers in the Barents Sea. There also seems to be a dominance of household litter
from Norway and Russia, although a small sample size made the conclusions less robust.

Further studies are needed, particularly on household items and oil- and chemical containers, in
order to determine the degree to which discarding of litter is taking place from different nationality
vessels operating in the area. This would also provide new knowledge on the significance of long-
range transport of litter into the region.

                                                   7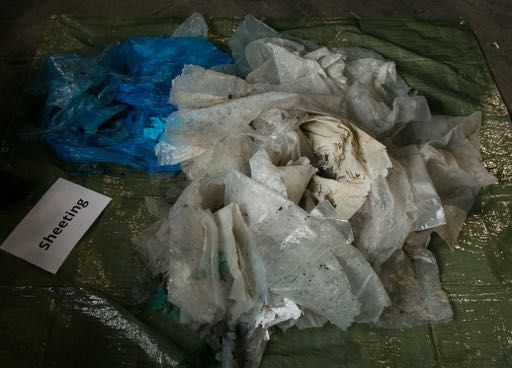
Key terminology
Marine litter: «any persistent, manufactured or processed solid material discarded, disposed of or
abandoned in the marine and coastal environment. Marine litter consists of items that have been
made or used by people and deliberately discarded into the sea or rivers or on beaches; brought
indirectly to the sea with rivers, sewage, storm water or winds; accidentally lost, including material
lost at sea in bad weather (fishing gear, cargo); or deliberately left by people on beaches and shores»
(UNEP 2005).
Marine debris: has been used as a synonym to marine litter but could also include detached natural
fragments as well as pieces of litter.
Marine plastic debris/marine plastic litter/marine plastic pollution/marine plastics: refers to the
plastic fraction of marine litter.
Waste: «any substance or object which the holder discards or intends or is required to discard» (EU
2008).
There are many definitions describing the size fractions of plastic. Generally, particles < 5 mm are
defined as microplastics and macroplastics are > 5 mm. The definitions used in this report are
generally as follows:

    •   Nanoplastic:            < 100 µm (Koelmans, Besseling, and Shim 2015)
    •   Small microplastics:    0.33-1.00 mm (Eriksen et al. 2014)
    •   Large microplastics:    1.01-4.75 mm (Eriksen et al. 2014)

    •   Mesoplastic:            4.76-200 mm (Eriksen et al. 2014)
    •   Macroplastic:           > 200 mm (Eriksen et al. 2014)

                                                   8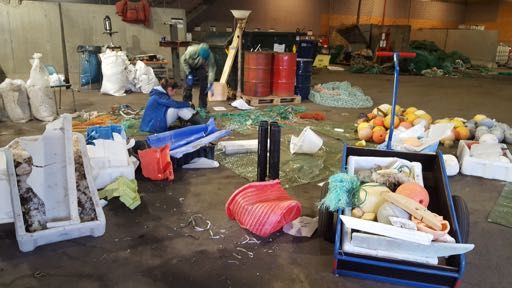
1 BACKGROUND AND AIM OF THE STUDY
1.1 Introduction
Marine plastic pollution is an ever-growing problem of global proportions due to increasing plastic
production, improper waste management and extreme durability (UNEP 2011). All around the world,
people are starting to realise the enormity of the impact and the challenge ahead to deal with this. In
one of Europe’s most uninhabited and unspoilt regions, Svalbard, marine litter is also building up in
large quantities. Although uninhabited and laying at the outer edge of Europe, the region is not
isolated. High levels of plastics have been found in the Svalbard and Barents Sea area at the sea floor
(M. Bergmann Klages, M. 2012), in the water column (Lusher et al. 2015), in ice cores from the Arctic
basin (Obbard et al. 2014), in Fulmar stomachs (Trevail et al. 2015) and along the shores (MOSJ 2015;
M. Bergmann et al. 2017). A conservative estimate suggests that there are around 101 million litter
items on the Barents Sea seafloor south of Svalbard, corresponding to 79 million tons (Buhl-
Mortensen and Buhl-Mortensen 2017). As it takes hundreds or even thousands of years for this
(mostly plastic) waste to degrade, the amount of plastic in the region is accumulating rapidly.

The presence of plastics in the Arctic could pose a serious threat to wildlife and local communities.
Animals of all sizes, from zooplankton to polar bears, could ingest plastics and associated chemicals.
The effect of this could be damages of respiratory and digestive systems, causing suffering, reduced
survival and potentially death. Animals may also get entangled in the litter, such as in trawl nets and
ropes, which may also lead to suffering and death. Litter also pose a safety risk to shipping in the
area due, for example, to the risk of propeller entanglement (UNEP 2005, 2011). Finally, the presence
of plastics on beaches also negatively affects recreational experiences (Wyles et al. 2015), which has
a direct impact on both locals and visitors, including the tourist industry in this area (Hallanger and
Gabrielsen 2018). Reducing the amount of litter in the region, is therefore vital to secure the health
of the ecosystems and the well-being of humans.
Prevention is the most cost-effective measure against marine litter, and an important first step in this
process is to identify the actors that need to be targeted to reduce littering. A key to identifying
actors contributing to marine litter at Svalbard, is to get a better understanding of the why so much
litter ends up in this relatively remote location. Through ocean currents, the region is potentially
influenced by pollution coming from other parts of the world (Van Sebille, England, and Froyland
2012). A by-product of this connection could be that large amounts of plastic litter arrive in the
region every day (Hallanger and Gabrielsen 2018). However, there are also activities in the vicinity of
the Islands that could represent a more regional source of litter. Large fisheries take place in the
Barents Sea, many of these close to the Svalbard islands, others further south where ocean currents
could transport litter northwards. There are also large shipping activities, as well as tourism, research
and recreational activities taking place in the region. Previous beach litter registrations suggest that
fisheries is the dominating source of the litter at Svalbard beaches (MOSJ 2015; M. Bergmann et al.
2017; Nashoug 2017). Involvement of fisheries experts is therefore important in order to understand
the sources of litter at Svalbard.

Beach litter analysis recording the number of items found of key litter categories has been
established as a key indicator of the sources of marine litter (Nelms et al. 2016). Current beach litter
protocols, however, have some limitations with respect to collecting information that can be used to
understand the sources of litter and identify appropriate management measures. An example is the
category “nets”, that does not differentiate between the types of fishing nets found, nor whether
these are lost or discarded. A qualitative beach litter analysis with fisheries experts at Svalbard found
that many of the nets were from cod and shrimp trawls and that some of these had clean cuts,

                                                    9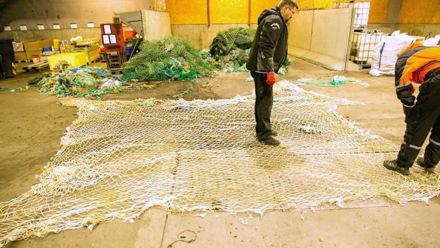
indicating they were discarded (Nashoug 2017). Nationality of containers can also say something
about the origin of the litter. Beach litter deep dives in Northern Norway, suggest a link between the
nationality of food containers and the nationality of vessels operating along the coast (Falk-
Andersson, Olaussen, and Macintyre 2018). Additionally, the analysis also records the relative
contribution of different sources in weight, thereby identifying which sources to target to reduce the
quantity of litter (Falk-Andersson, Olaussen, and Macintyre 2018). Finally, involving stakeholders
through beach litter deep dive workshops, also increases their awareness and thereby the likelihood
of them taking ownership of the problems and solutions to prevent marine littering (Falk-Andersson
2018).

The beach litter deep dive concept (Falk-Andersson, Olaussen, and Macintyre 2018) was developed
as a supplement to existing beach litter protocols, providing additional knowledge that is useful for
identifying and implementing preventive measures. The method has proven a promising and cost-
effective supplementary tool to regular beach litter analysis to provide knowledge and awareness
needed to combat littering. While a qualitative analysis on beach litter at Svalbard has been
conducted (Nashoug 2017) and beach litter protocols have been implemented (MOSJ 2015; M.
Bergmann et al. 2017), there have been no previous studies doing a detailed analysis of the litter
with the aim of identifying management measures that would give a reduction in marine litter in the
region.

To get a better understanding of the sources, the potential for reducing the amount of litter ending
up in the region and which stakeholders should be approached to achieve this, a beach litter deep
dive study was conducted on litter collected along the shores of Svalbard by volunteers in the
summer of 2018. The aim of the study was to refine the methodology of “beach litter deep dives”
and identify items that should be given particular attention in future monitoring. This will give better
insight into the reasons why items have ended up in the sea and what can be done to prevent this.

2 KNOWLEDGE STATUS OF THE SOURCES OF
MARINE LITTER AT SVALBARD
A global analysis of the sources of marine litter, shows that fisheries and shipping are believed to be
the main sources of plastic input into the ocean in the Svalbard region (Figure 1). This is because the
number of people living in the region is low, while there are large fishing and shipping activities. This
has been confirmed by beach litter analysis in the region (MOSJ 2015; M. Bergmann et al. 2017;
Nashoug 2017). Norway and Russia are the largest fisheries nations in the region, and these are also
the two countries that are bordering the waters around Svalbard and have the largest presence on
the Svalbard Island. Norway and Russia produce similar amounts of plastic waste, despite the large
difference in size and population of the two nations (Figure 2). Norway, however, has a lower rate of
mismanagement of waste compared to Russia (Figure 3).

                                                    10
Plastic input into the oceans
Atlantic Ocean
Pacific Ocean
Indian Ocean
Plastic sources
Fishing intensity
Coastal* inputs
Impervious surface in watersheds
Shipping
*Includes mismanaged waste combined with population density Data courtesy of Laurent Lebreton/The Ocean Cleanup.
Note: the map utilizes a dimensionless model source input binned Sources: IPCC scenario SRES B2; Jambeck, J., R., et al., Plastic waste inputs from land into the ocean,
on 5x5 degree bins. Circles are indicative of the amplitude of the Science, 2015; Watson, R. A., et al., Global marine yield halved as fishing intensity redoubles,
phenomena and do not express quantitative information. 2013; Halpern, B. S., et al., A Global Map of Human Impact on Marine Ecosystems, 2008.
Figure 1 Plastic input into the oceans by different type of sources (Illustration: UNEP and GRID-Arendal
(2016)).
Plastic waste produced and mismanaged
Norway
Canada Denmark Sweden
United Finland Russian
EU 27 plus Kingdom Federation
Norway Netherlands
Germany
Ireland Poland
Belgium Ukraine North
France Croatia Korea
United States Italy Turkey Japan
Spain
Greece Syria Iran South
Portugal China
Cyprus Lebanon Korea
Tunisia Pakistan
Morocco Israel India Hong
Kuwait Taiwan
Mexico Cuba UAE Kong
Haiti Dominican Republic Algeria Libya
Puerto Rico Egypt Saudi Arabia Bangladesh
Guatemala Honduras
Trinidad Oman Myanmar Vietnam
El Salvador Nicaragua Nigeria Yemen Philippines
and Tobago Senegal
Venezuela Ghana Thailand
Costa Rica
Panama Guyana Malaysia
Colombia Somalia Sri Lanka
Cote d'Ivoire Singapore
Ecuador
Indonesia Papua New Guinea
Peru Brazil Angola
Mauritius
Chile Australia
Uruguay South Africa
Argentina
Coastal population Plastic waste production
Million people Thousand tonnes per day, 2010 New Zealand
Less than 1
1 to 2 37 Total plastic waste
2 to 10 produced
10
10 to 50 Source: Jambeck, J., R., et al., Plastic waste inputs from land
50 to 263 1 into the ocean, Science, 2015; Neumann B., et. al., Future
0,2 Portion of plastic Coastal Population Growth and Exposure to Sea-Level Rise and
Land locked country waste mismanaged Coastal Flooding - A Global Assessment. PLoS ONE, 2015.
Figure 2 Regional variations in total amount of plastic waste produced compared to the proportion of plastic
waste mismanaged (Illustration: UNEP and GRID-Arendal (2016)).
11Figure 3 A global map illustrating the estimated mass of mismanaged plastic waste (millions of tons)
generated in 2010 by populations living within 50km of the coast (Adapted from Jambeck et al (2015)).
2.1 Studies of beach litter at Svalbard
While the number of studies on micro-litter has increased significantly the past 10 years, there are
few scientifically published studies on macro litter. Reports have been given out based on analysis of
beach litter, the majority of these being based on citizen science data collection, indicating the main
sources of litter in different parts of the world. Ocean Conservancy is an example of a global NGO
that encourage registration of beach litter and produces annual reports based on such data1. There
are no citizen science data collected at Svalbard using protocols based on Ocean Conservancy, but
OSPAR registrations have been taken place since 2011 (Falk-Andersson, Berkhout, and Abate 2019).
This section summarises the main findings from analysis of beach litter at Svalbard.
2.1.1 OSPAR Beach litter monitoring data
The OSPAR protocol (OSPAR 2010) has been applied at Været, Brucebukta and Luftskipodden at
Svalbard. The number of items in different source categories is recorded for a 100m stretch of beach.
Data collected in the period 2011-2016, was sorted according to source categories described in Falk-
Andersson et al. (2019) to illustrate the identifiable sources of litter2 at Svalbard (Figure 4). The figure
shows that pieces of rope made up the largest fraction of the litter, followed by litter “on the fly”.
The latter includes plastic bags, food containers and smoking wares and is classified as litter related
to outdoor activities, although such activities are expected to be of minor importance at Svalbard.
The next largest source is fisheries, followed by litter of domestic origin, such as cleaning agents,
sanitary items and wearables, and nets. Industry related items make up the smallest portion of the
number of identifiable items (Figure 4). The OSPAR data does not provide any information on the
weight of the source fractions. The report provided by the Governor of Svalbard, however, notes that
the majority of the litter consists of plastic originating from fishing vessels (MOSJ 2015). This
indicates that the number of items is not representative of the mass of the litter in terms of
1
https://oceanconservancy.org/trash-free-seas/international-coastal-cleanup/
2
The unidentifiable pieces of litter made up 49 % of the number of litter items found.
12identifying the main sources of litter. Furthermore, they point to fishing vessels in the Norwegian and
the Barents Sea as the likely sources of the bulk of the litter at Svalbard, but also recognise that some
of the litter may originate from cruise ships and other vessels. Apart from that, they find it difficult to
specify the sources further (MOSJ 2015).
Domestic
Rope
On the fly
Industry
Fisheries Nets
Figure 4 Identifiable sources of litter at Svalbard according to 2011-2016 OSPAR beach litter registrations of
number of litter items.
According to MOSJ (2015), no obvious tendency can be read out of the statistics based on the limited
number of beaches monitored today. Thus, based on the current monitoring data it is not possible to
say if the quantity of litter in the area is changing.
132.1.2 The Arctic Marine Litter Project beach litter analysis
The Arctic Marine Litter project3 was initiated in order to provide management relevant knowledge
on the origin, sources, causes and solutions for marine litter in the North Atlantic Arctic. As a part of
the project, monitoring of litter took place on 14 beaches at Svalbard4 applying the OSPAR (2010)
protocol for the 100 m stretch of beach analysis. Many of the locations analysed had likely been
cleaned by cruise passengers prior to the analysis of the Arctic Marine Litter Project. Thus, the
analysis may not be representative of the type of litter items that most often end up on the beaches
of Svalbard.
Excluding wood items5, in total, approximately 4.820 litter items were collected and analysed. The
breakdown of the number of items for each major category is shown in Table 1. (Wouter Jan
Strietman, Wageningen Economic Research, pers. com.).
Table 1 Top 10 items in numbers from 14 Svalbard Beaches.
Share
without
# Top 10 (based on the number of items) Share unidentifiable
pieces of
plastic
1 Unidentifiable pieces of plastic 63%
2 Nets and pieces of nets 7% 19%
3 Caps/lids 5% 14%
4 Strapping band 5% 14%
5 String and ropes 3% 8%
6 Industrial packaging/sheeting 3% 8%
7 Floats/buoys 2% 5%
8 Plastic bottles and containers 2% 5%
9 Plastic bags 2% 5%
3%
10 Cotton bud sticks 1%
19%
Other items 7%
As is shown in the table above, more than half of all litter items analysed were unidentifiable. These
were usually smaller than 10 cm in length. The number of unidentifiable pieces of plastic may have
been inflated as the litter sometimes broke into smaller pieces when picked up and transported to
3
The project was initiated in 2017 by Wageningen Economic Research and Leemans Maritime Consultancy.
4
Poolepynten, Sarstangen, Bay de la Recherche (5 locations), Hornsund, Worsleyhamn, Kapp Lee Stasjonen, Hiorthamn,
Anservika, Gipshuksletta, Phantomodden.
5
Wood items may be of cultural heritage and cannot be collected
14the vessel where it was analysed (Figure 5). The dominating identifiable items were nets/ pieces of
Figure 5 Unidentifiable pieces of plastic, broken apart at the beach. (Photo:
WJ Strietman).
nets, caps/lids, strapping bands, string/ ropes and industrial packaging/ sheeting. Many of these
items can be related to the fisheries (Wouter Jan Strietman, Wageningen Economic Research, pers.
com.).
2.1.3 Citizen science study involving cruise tourists
Expedition staff and cruise tourists onboard the vessels of two tourist cruse operators were involved
in a citizen science study where they applied a simple protocol for categorising and quantifying beach
litter in the north-western part of the Svalbard Archipelago. Transects between 90-120 m length at
six beaches were surveyed in 2016 and assigned to six categories (see Table 2). There were large
differences in the quantity of litter sampled at the different beaches, ranging from 9 to 534 g m-2. At
the most polluted beach, there were 525 g litter m-2 that was almost exclusively fisheries related
plastics, including a heavy net (M. Bergmann et al. 2017). Fisheries related plastic, including ropes,
buoys, floaters and nets, accounted for 44-100% of the total mass of litter found. Non-fisheries items
were mainly packaging material, bottles, cups, daily use articles (e.g. tooth brushes and lighters) and
toys (M. Bergmann et al. 2017). The study did not record the number of items.
Table 2 Results from beach surveys. Litter quantities given in g m-2. P: pebble, S: sand, M: mud, G: gravel, +:
present. Table from Bergmann et al (2017).
153 SVALBARD BEACH LITTER DEEP DIVE
Litter from volunteers cleaning beach litter at Svalbard is delivered in Clean-up Svalbard containers.
These are divided into three compartments: metal, ropes and nets, and burnable (the latter will be
referred to as “rest”). The Deep Dive analysis took place at the waste management facility at
Longyearbyen that were very helpful in facilitating the work. One container of ropes and nets were
analysed, with a focus on the nets, as well as two containers of “rest”.
The first day of the workshop one container of “rest”, mostly plastic litter collected by the coast
guard at Franzøya in Hinlopen was analysed using the deep dive protocol (See Attachment 1 and 2
for instructions and protocol). About 4.2 km of beach was cleaned, and it was assumed that 4m3
litter was collected in 5 hours. The cleaners noted that the majority of the litter that was found is
assumed to come from the fishing fleet as the findings included trawls, ropes, floats from trawls and
fish boxes (for maps and pictures, see Attachment 3). The rope fraction in this sample which is
reported in the result section is likely to be underrepresented in the deep dive analysis. This would in
particular be true for the larger ropes, in addition to nets and metal items. This is because the
majority of these items would have been separated from the “rest” compartment of the Clean-up
Svalbard container.
The second day of the workshop another container from clean-up Svalbard was analysed. This
container turned out to consist mostly of nets and ropes. Experts that had been involved in Clean-up
Svalbard said that litter in this container likely was the from the “ropes and nets” compartment, and
the few other items were likely due to someone sorting the litter wrong when emptying beach litter
in the Clean-up Svalbard container. Since this analysis did not provide new data, the results from Day
2 analysis of the “rest” compartment is not reported on. There were no other containers that could
be used for analysis as the litter had been shipped to the mainland for disposal.
3.1 Methodology
3.1.1 Development of the Svalbard Deep Dive Protocol
The deep dive protocol was developed during the summer of 2018 in a deep dive project analysing
beach litter in Northern Norway. A detailed description of the development of the protocol can be
found in Falk-Andersson et al (2018). A short summary is given here in English.
The analysis can be done on different types of litter and for different environments, for example
cities (Fråne et al. 2012), but beach litter has been the focus of these analysis and the protocol is
therefore most suitable for this type of litter. The OSPAR (2010), Keep Norway Beautiful and Lofoten
Waste management protocols (See Falk-Andersson et al (2019) for a description of the protocols)
were used as a basis for the deep dive protocol. Input from experts, either industry representatives
or experienced beach cleaners, beach litter analysis at Svalbard with fishers and other experts
(Nashoug 2017), as well as SALTs own experience from beach litter analysis, was used to determine
which categories should be expanded and which ones should be excluded. Items of particular
concern, such as batteries and bundles of strapping bands, were included in the protocol. The
presence of single use plastic grocery bags was also recorded separately as these are a particular
focus item both at the EU level and in Norway (EU 2015; Vestli 2015). Documenting if this item
represents a large pollution problem is therefore of importance. Plastic shopping nets were therefore
recorded separately from other types of plastic bags.
The nationality of the litter could indicate whether the litter found is of local origin, transported long
distances, or if marine activities in the area can explain their sources. For cleaning bottles, food
packaging, drinking bottles and sanitary products, the nationality of the items was therefore
16recorded where possible. The Norwegian deposit scheme makes the Norwegian drink bottles easily
identifiable from foreign bottles. Particular items that have been regularly observed when beach
cleaning were also recorded. These were Zalo (a Norwegian dishwashing liquid also used to clean the
deck of fishing vessels (Hartviksen 2016)), Idun tomato sauce and Idun mustard, and instant coffee
(nestle). All are Norwegian products. There were in some cases not sufficient space to note the
number of containers of different nationalities. A separate table with the relevant categories for
noting nationality would therefore be an advantage (Falk-Andersson, Olaussen, and Macintyre 2018).
While the Svalbard deep dive protocol differentiates between caps and lids of different types, it has
been concluded that compared to the effort put into analysis this doesn’t give particularly valuable
insight into their origin and why they end up at sea. Additionally, they make up a small fraction of the
litter in terms of weight and could therefore be counted as “caps and lids” but go into the “other”
category in terms of source. Schravensande, who took part in the deep dive, has studied caps to link
it to source, but there is no information available on the results of the study to evaluate if this type of
analysis can be used to link caps to likely source.
Fisheries related items that had been identified in Nashoug (2017) and Falk-Andersson et al (2018) as
likely discarded, were recorded separately in terms of numbers. This included tubes for plastic foil,
parts of conveyor belts and strapping bands (differentiating between single strapping bands and
bundles). The types of fish boat items found were also noted. Different colours of plastic sheeting
were differentiated between, since for example blue plastic sheeting can be linked specifically to
onboard processing of fish (Falk-Andersson, Olaussen, and Macintyre 2018). Transparent plastic is
also used for this purpose, but transparent plastic could also have other origins, such as construction
work. While the Svalbard beach litter deep dive protocol differentiated between different types of
plastic sheeting, the fact that these may have many different uses and origins, the knowledge gained
from the differentiation may not be justified. A qualitative note including pictures, could be sufficient
to identify if the origin is likely from industry or from household packaging that has degraded. As for
any category of litter found in a deep dive, further studies and descriptions can be justified if it
makes up a significant part of the litter (Falk-Andersson, Olaussen, and Macintyre 2018).
Apart from likely being of industrial origin, unidentified pieces of plastic did not give any significant
information to the deep dive analysis in Northern Norway (Falk-Andersson, Olaussen, and Macintyre
2018). This fraction was therefore not given particular attention during the Svalbard beach litter
deep dives and may be underrepresented in the sample.
A deep dive is a supplement to existing beach litter protocols, and the main aim is not to give a
representative representation of the litter, but to give supplementary knowledge that is useful for
implementing preventive measures. However, it is possible to get representative information if it is
applied on litter from known locations where explanatory variables (such as for example size of area
cleaned, substrate, prevailing wind directions) have been recorded. The information required
regarding the litter used for analysis depend on the aim of the study.
The final deep dive protocol applied can be found in Attachment 1 and 2. The nets were analysed
using a more detailed protocol (see section “Development of the net protocol”) and were therefore
excluded from the analysis of the “rest” fraction. However, it was concluded in Falk-Andersson et al
(2018) that differentiation between cut or torn nets gives more information than the OSPAR
differentiation between nets under or over 50 cm.
3.1.2 Development of the Net Protocol
A more detailed insight into fishing nets was needed to be able to match the type of net and type of
fisheries with the area where such fisheries take place, along with the underlying behaviour and
processes that have most likely contributed to the litter having ended up in the sea. Experts on
fisheries technology were involved in the evaluation procedure. The main experts for the analysis at
17the Svalbard Beach Litter Deep Dive were Roger Larsen, fisheries technologist, and Dagfinn Lilleng at
the Norwegian Directorate of Fisheries.
A total of 62 (sections of) fishing net were analysed during the workshop. The protocol (Attachment
4) was developed in collaboration with a former fisherman, Klaas-Jelle Koffeman, when 42 nets from
the Clean-up Svalbard containers were analysed in September of 2017. The scientific rigour of the
protocol was confirmed by the experts involved in the Svalbard beach litter deep dive workshop.
For the net analysis, the following characteristics are examined: 1) Size of the net, 2) Full nets or
sections of nets (and if so, which section) 3) Age of the net, 4) Type of fisheries involved, 5) Probable
fishing areas, 6) Accidentally lost or discarded, 7) Other relevant information
The procedure of examination is as follows: first, a piece of net is disentangled and spread out on the
floor for further investigation (Figure 6).
Figure 6 Fish net analysis at the Longyearbyen waste management facility (Photos: WJ. Strietman).
After that, the dimensions, mesh size and probable age of the net are registered, and photos taken.
The net is then thoroughly checked to determine whether there are any signs of being torn or cut. If
the net shows signs of cuts, it is determined whether they have been cut as part of the process of
cutting the net into the right shape before use or cut as part of the procedure to replace a piece of
broken net. Also, the type of fisheries involved is registered, and the likely reason why it had ended
up in the sea (lost or discarded), along with any other additional comments.
The net analysis is carried out with the help of fisheries experts. Measurements can be done by non-
fishing experts, but it is recommended that the conclusions as to the likely cause of why these nets
have ended up in the sea should be done by fisheries experts and/or (ex-)fishermen with knowledge
of net preparation and net repair procedures on board fishing vessels.
3.1.3 Rope analysis
Time did not allow for an analysis quantifying ropes according to type, nor cut-offs vs non cut-offs.
An evaluation of the age of the ropes (< or > 5 years) would also have given useful information about
current practices. A visual inspection where some of the ropes were laid out on the floor and
commented upon by the experts was conducted.
The ropes and nets that were analysed during the workshop, made up in total 1880 kg. They were
compressed and transported to the mainland for disposal (Hans Petter Lauritsen, Reno-Vest,
pers.com).
183.1.4 Deep litter deep dive workshop
The deep dive analysis was organised as a workshop at the Longyearbyen Waste Management
Facility where experts were involved in the analysis on day 1 and 2, and in discussions of preventive
measures on day 3 (see workshop program, Attachment 5). The participants were divided into
groups and given responsibility of different weight categories. Each group had one leader from the
project team. The protocol and instructions were sent out prior to the workshop (Attachment 1 and
2). Instructions were also given prior to starting the analysis. After sorting the different weight
categories, the whole team went around to the different tarps and discussed the findings. Notes
were taken during the discussions.
4 RESULTS
4.1 Day 1 Deep dive of the “rest” fraction collected at
Franzøya
3011 items weighing around 577 kg were analysed on day 1. Figure 7 shows the pile of litter that was
analysed. A large number of the non-fisheries items were quite worn, indicating that this was a beach
with a lot of old litter. This also made it difficult to identify many of the items to nationality and
brand. Data on bags had to be removed due to errors during registrations. Zero-value findings are
not reported in the figure (tobacco products, agriculture and nets). The “rest” fraction largely
excluded ropes and nets; thus, these categories will be underreported in the data from Franzøya.
Larger ropes, that are easy to separate out, are expected to be more or less absent from the sample,
while smaller ropes are expected to be underrepresented.
Figure 7 The basis for the deep dive analysis on Day 1
19The relative abundance of the main litter categories in the “rest” fraction collected by KV Nordkapp
at Franzøya in Hinlopen in terms of numbers and weight is shown in Figure 8. It illustrates that the
relative contribution of fisheries related items is over 40% higher in terms of weight compared to
number of items. There were relatively few items in the categories food-, sanitary- and cleaner-
products, which were the main items where nationality of products could be recorded. Presence of
burned plastics indicates a practice of burning litter, but it was not possible to say something about
the age of these plastic items and thereby not whether this is an on-going practice.
80
60
40
20
0
od
ry
Fis ic
ff
tic
s
g
r
Do ry
pe
es
ed stic
cs
pe ies
ne
ce
tin
t-o
t
-20
st
ta
Ot asti
ec
es
as
Ro
Fo
r
ie
a
ea
he
du
ee
ni
cu
Pi
m
pl
Bu t pl
rp
pl
Cl
Sa
Sh
In
rd
he
f
So
Ha
Ro
-40
-60 rn
Proportion (number) Proportion (weight) Difference
Figure 8 The proportion of different litter categories in terms of number and weight, as well as the difference
between these, for the "rest" fraction collected at Franzøya.
Rope-cut-offs dominated in terms of number of items, but in terms of weight the fisheries category
made up around 70% of the litter. A large number of small cut-offs, resulted in the “rope cut-offs”
making up a large proportion of the litter in terms of numbers, but a small proportion in terms of
weight (Figure 8). With respect to the ropes analysed the majority were cut-offs (94%). 783 ropes
being identified as cut off in both ends, and 53 pieces of ropes either being too old to identify
whether they were cut-offs or having minimum one end not being clear-cut. Smaller cut-offs could to
a large extend be traced back to ropes used on shrimp- and cod trawls (Figure 9). When the trawls
are repaired, the end of the rope is cut off and may fall onto the deck and/or the trawl. If these are
not picked up, they are likely to enter the ocean when the trawl is released into the water again
(Roger Larsen, Norwegian College of Fishery Science, UiT, pers.com.).
Figure 9 Examples of rope finings, including rope cut-offs, and expert opinion on the origin of the ropes, as
well as a piece of net cut-off and its origin (Photos by WJ Strietman and SALT).
20A closer look at fisheries-related items (excluding ropes), shows that the majority of the weight is
made up of trawl floats (Figure 10). “Other floats” were mainly made of light material, such as cork,
resulting in their relatively low weight Figure 11. The “fisheries” category consisted of part of
conveyor belts (4 pieces), tubes for plastic foil (13), 16 fish boat items of various types (fish baskets,
crab bait containers and a part of a crab pot) and 266 single pieces of strapping bands were found.
These were not weighed separately, but the 7 bundles of strapping bands were weighed separately
(Bundle of strapping band illustrated in Figure 11). These bundles of strapping bands made up a
relatively high proportion of the weight of the fisheries related litter. Items recorded as “fish boxes”
were mainly pieces of fish boxes, but there were some whole fish boxes. The latter were marked
with company names (Donegal co-op fishiries Killybegs, Kilhorn Bay Seafoods, Pers box (4),
Stømbergs (3), Hanstholm, Alliance Fish, Myregruppen, Royallsland, Norsk, ABSA, F.K. Hirtshals, Caley
Fisheries, P.C. Fisk, Prestfjord, Aarsæther, Iceland.)
40
30
20
10
0
Fisheries Large yellow Trawl Metal floats Other floats Fish boxes Bundles of
-10 float floats* strapping
bands
-20
-30
-40
Proportion (number) Proportion (weight) Difference
Figure 10 Relative proportion of fisheries related items in numbers and weight, as well as the difference
between the two.
Figure 11 "Other floats" to the left and "bundle of strapping band" to the right (Phote: WJ Strietman).
Analysis of cleaning bottles, water bottles and drinking bottles showed that out of those that could
be identified as being either foreign or Norwegian, most of them were foreign (Figure 12). However,
a significant number of the items were also Norwegian. The latter included 10 Zalo bottles and 5
instant coffee glass bottles and/ or plastic lids, as well as 8 Idun bottles (the latter not included in the
21analysis in Figure 12). The majority of the items could not be identified to nationality. The number of
items per nationality were not recorded for all categories, just the countries represented. Thus, this
data cannot be used to list the dominating nationalities found among the litter. The nationalities of
the containers were: Norway, UK, Greenland, Denmark, Spain, Portugal, Germany, Russia, Italy,
America, Estonia and China.
80
70
60
50
40
30
20
10
0
s
g
g
s
s
es
s
es
g
es
tle
tle
tle
tle
in
in
in
ttl
ttl
ttl
pp
pp
pp
ot
ot
ot
ot
bo
bo
bo
ra
ra
gb
ra
gb
gb
gb
g
er
w
w
w
g
in
kin
in
kin
in
kin
at
od
od
od
an
an
an
in
in
w
in
fo
fo
fo
cle
cle
cle
dr
dr
ign
dr
n
n
ign
ign
n
ign
n
ia
n
ow
n
re
ow
ia
ow
ia
eg
re
Fo
re
re
eg
kn
eg
Fo
rw
kn
kn
Fo
Fo
rw
Un
rw
Un
No
Un
No
No
Figure 12 The number of domestic items of foreign, Norwegian and unknown origin
4.2 Analysis of nets
The net analysis showed that all the nets were sections of nets and that the average size of each
section of net was 10-20m2. Most of the sections of nets were square in shape, indicating that they
had been cut out around damaged parts of a trawl net to be replaced by a new piece of net. The
results of the net analysis show large variations in the number of net sections being younger versus
older that 5 years old in the two analysis. Of the 42 nets analysed in 2017, 35 were < 5 years old,
while only 13 out of 62 nets were assessed to be < 5 years old in the 2018 analysis (Figure 13).
Combining the two analysis, over half the nets analysed were younger than 5 years.
2260
50
40
Number of nets
30
20
10
0
2017 2018 2017 and 2018
< 5 years > 5 years
Figure 13 The number of nets being < 5-year-old and > 5 years old in 2017, 2018 and combined 2017 and
2018
The evaluation of whether the nets had been torn and likely lost after being stuck on the seabed
(accidental loss) versus been cut out of the net after being damaged and thereby discarded were
similar between the two years. 88% and 92% of the sections of nets were judged to be discarded in
the 2017 and 2018 analysis respectively (Figure 14). The reasoning behind the “discarded” conclusion
is that for each of these cut-out sections of nets, one or more sides were torn, and one or more sides
cut. Like explained in the methodology, if the net shows signs of cuts, it is determined whether they
have been cut as part of the process of cutting the net into the right shape before use or cut as part
of the procedure to replace a piece of broken net. After replacing the damaged sections with new
netting material, these damaged sections ended up in the sea. The most likely reason behind this,
according to the fisheries experts, being deliberate discarding.
100
90
80
70
Proportion of nets
60
50
40
30
20
10
0
Accidental loss Discarded
2017 2018
Figure 14 The proportion of nets being lost accidentally vs those discarded in the 2017 analysis vs the 2018
analysis. One net in the 2017 analysis was evaluated as "unknown".
23The majority of nets analysed in both years were sections of nets from whitefish bottom trawl,
followed by shrimp trawl. In total, these made up bout 90% of the nets analysed the two years
(Figure 15).
Redfish
Capelin
Pleagic
Danish seine or whitefish trawl
Unknown
Shrimp trawl
Whitefish bottom traw
0 10 20 30 40 50 60
2017 2018
Figure 15 The number of nets of different types identified in the net analysis in 2017 and 2018.
Other information that came out of the analysis was that all of the nets analysed had been made
from polyethylene, a material which floats. Furthermore, expert knowledge helps in identifying the
type of fisheries involved. Shrimp trawls, for example, can use net of bigger mesh sizes in the front of
the trawl. Thus, only using mesh size to identify the type of fishery, may not always be accurate.
4.3 Discussions on the different sources of litter
Once the litter had been sorted into different categories and put on display, the workshop
participants evaluated the findings together. This was also followed up and discussed at the third day
of the workshop, where also possible management actions were discussed. These are notes from the
discussions on the different items. The pictures are not necessarily representative of all the litter
recorded in the protocol but are used to illustrate the findings. Where comments are made about
discards, this could either be deliberate or in some cases due to waste not being secured good
enough on deck.
4.3.1 Floats
The fisheries experts believed that the aluminium floats were probably Russian (see in the middle of
the picture in Figure 16). Ring floats were from gill nets, and many had branding. They used to be
popular, but they have since been replaced with floating ropes. In the North East Atlantic they
switched to ropes approximately ten years ago. It was noted that none of the rings had fouling. Gill
nets are generally not used in the Barents Sea area, and they are not used by Russian fishers at all.
Trawl floats (see bottom right of the picture in Figure 16) could be from deep water trawlers. The
ones with “bumps” were likely from shrimp trawlers, while the others could be from pelagic trawlers.
These floats could be from anywhere in the Atlantic. There has been a practice of smashing damaged
trawl floats open and discard them. They will therefore sink and won’t be found on beaches. It is not
24a mystery that we find lots of floats, as they are made to float and are likely to be washed ashore.
The floats are rarely dumped because they are valuable. The floats can be lost if gear breaks during
operation, or when gear snaps during howling. As with the ring floats, none of the trawl floats had
fouling on them.
Figure 16 Experts identifying the origin of floats (Picture: WJ Strietman).
4.3.2 Fishery related items
The type of fish boxes found on the shores of Svalbard are used a lot in the North Sea fishery and are
likely also used elsewhere in the North Atlantic. Many of the fish boxes were Norwegian, but such
boxes are not used very much any longer. Such crates are made from polyethylene and will therefore
float after ending up in the sea. Most fish auctions where such boxes are used, use a deposit scheme,
to make sure that most boxes get back to shore and to the place where they originate. It is a normal
practise that these are exchanged between boats within the same nations, but not between different
nationality vessels. They are used on all types of vessels to store fresh fish on ice. They are often
stored on deck and can therefore be lost in bad weather if they are not properly secured. The boxes
are usually made out of polyethylene, which floats. It is therefore likely that these are washed ashore
on beaches.
Plastic tubes are used to hold rolls of thin plastic film/sheeting. The plastic film is used to wrap frozen
fish on industrial freezing trawlers as part of fish processing on board these vessels. This process
takes place below deck. Therefore, the pipes ending up in the sea point towards deliberate
discarding. The black pipes in the middle of Figure 17 are examples of such plastic tubes. Conveyor
belts are also likely discarded.
25Figure 17 Analysis of various fisheries related items (Picture: Sarah Auffret).
Strapping bands are either encountered as shorter bits or large bundles. Larger bundles occur when
the strapping machine gets stuck and the mechanic has to run a large spool through the machine to
fix it. This is bulky to store and useless so is thrown overboard. If the rolls of strapping bands are
stored for too long onboard, they can get humid and cause the problem of jamming in the machines.
Sand in the machinery can have the same effect and could be a consequence of poor maintenance.
Strapping bands are a pure attitude/ discarding problem, especially the large bundles. Small pieces of
strapping band could be from activities conducted below deck (in processing) so they are unlikely to
go overboard by accident. Strapping bands are used in a number of industries as part of packaging,
including fish processing. The bands are strapped around boxes of frozen fish. It could be possible to
identify the likely sources and ages of the strapping bands based on knowledge of when these were
in use and the dimensions used onboard Norwegian vs Russian vessels.
4.3.3 Plastic sheeting
This category consisted mainly of thin white, blue and transparent sheets of plastic (Figure 18). It is
not entirely clear where the main share of these kinds of items originate from, but it is known that
(blue) transparent plastic film is used to wrap frozen fish on industrial freezing trawlers as part of fish
processing on board these vessels. This process takes place below deck. Therefore, plastic items from
this category ending up in the sea may point towards deliberate discarding. Blue sheeting is also used
to separate fish in the bait boxes and there is a practice of tying these together as the fishers to the
baiting. This can be found as bundle of tie-up plastic sheets. Black sheeting could either be sheeting
or remains of a garbage bag. It can be difficult to differentiate between sheeting and bags. Large
plastic pieces may also come from the building industry, but these are usually thicker. Sheeting often
does not travel very far, as it is quickly torn into smaller pieces or sinks out. Thus, it can be argued
that they have to originate from a local source.
26Figure 18 Blue, white and transparent pieces of sheeting (Photo: WJ Strietman)
4.3.4 Food
Figure 19 illustrates different types of food related items found during the deep dive. The most
common item found was drinking bottles with unknown origin. The reason this category is
dominating might be because logos and prints are eroded by sunlight, wind and waves. The second
most common item was drinking bottles from other nationalities. Most of the drinking bottles from
other nationalities had Cyrillic text printed on them. Plastic bottles mainly are made out of heavy
polymer and are therefore likely to sink if they end up at sea without the lid. The rather large number
of lids and caps found in the analysis, might implicate a “dark number” of bottles at sea.
Out of all the food wrappings, oil- and sausage packages were the most common. The fourth most
common item(s) was lids and caps. An evaluation of the caps and lids showed that they were mostly
from brands sold in Russia and Norway. That is not a surprising result because most of the fishing
vessels active in the Svalbard region are indeed from Russia and Norway. Another contributing factor
might be the geographical proximity of both Norway and Russia.
While some of the food items could be identified with respect to brand and nationality, the origin
cannot be assumed based on language only (e.g. Cyrillic alphabet), because where an item has been
bought may not be same area as where it has been released into the sea.
Food items are used in the galley and should not be going overboard by accident. If there were
imprints in the plastic that could identify the packaging, then it would be easier to identify the
producer as other prints or labelling wears off more quickly. On the other hand, such an ID system
would not identify the consumer or dumper. Another action that could be tested, is preorganized
waste containers for different types of garbage at the ports.
27You can also read


