Are Free Android App Security Analysis Tools Effective in Detecting Known Vulnerabilities?
←
→
Page content transcription
If your browser does not render page correctly, please read the page content below
Are Free Android App Security Analysis Tools Effective in
                                                           Detecting Known Vulnerabilities?
                                                                   Venkatesh-Prasad Ranganath        Joydeep Mitra
                                                                            Kansas State University, USA
                                                                           {rvprasad,joydeep}@k-state.edu
arXiv:1806.09059v7 [cs.CR] 29 Jun 2019

                                                                                            July 2, 2019

                                                                                               Abstract
                                                   Increasing interest in securing the Android ecosystem has spawned numerous efforts to assist app de-
                                               velopers in building secure apps. These efforts have resulted in tools and techniques capable of detecting
                                               vulnerabilities (and malicious behaviors) in apps. However, there has been no evaluation of the effective-
                                               ness of these tools and techniques in detecting known vulnerabilities. The absence of such evaluations
                                               puts app developers at a disadvantage when choosing security analysis tools to secure their apps.
                                                   In this regard, we evaluated the effectiveness of vulnerability detection tools for Android apps. We
                                               reviewed 64 tools and empirically evaluated 14 vulnerability detection tools (incidentally along with
                                               five malicious behavior detection tools) against 42 known unique vulnerabilities captured by Ghera
                                               benchmarks, which are composed of both vulnerable and secure apps. Of the 24 observations from
                                               the evaluation, the main observation is existing vulnerability detection tools for Android apps are very
                                               limited in their ability to detect known vulnerabilities — all of the evaluated tools together could only
                                               detect 30 of the 42 known unique vulnerabilities.
                                                   More effort is required if security analysis tools are to help developers build secure apps. We hope the
                                               observations from this evaluation will help app developers choose appropriate security analysis tools and
                                               persuade tool developers and researchers to identify and address limitations in their tools and techniques.
                                               We also hope this evaluation will catalyze or spark a conversation in the software engineering and security
                                               communities to require a more rigorous and explicit evaluation of security analysis tools and techniques.

                                         1     Introduction
                                         1.1    Motivation
                                         Mobile devices have become an integral part of living in present-day society. They have access to a vast
                                         amount of private and sensitive data about their users and, consequently, enable various services for their
                                         users such as banking, social networking, and even two-step authentication. Hence, securing mobile devices
                                         and apps that run on them is paramount.
                                             With more than 2 billion Android devices in the world, securing Android devices, platform, and apps
                                         is crucial [Sufatrio et al., 2015]. Companies such as Google and Samsung with access to a large pool of
                                         resources are well poised to tackle device and platform security. However, app stores and app developers
                                         share the task of securing Android apps. While app stores focus on keeping malicious apps out of the
                                         ecosystem, malicious apps can enter the ecosystem e.g., app installation from untrusted sources, inability to
                                         detect malicious behavior in apps, access to malicious websites. Hence, there is a need for app developers to
                                         secure their apps.
                                             When developing apps, developers juggle with multiple aspects including app security. Most app devel-
                                         opment teams often cannot tend equally well to every aspect as they are often strapped for resources. Hence,
                                         there is an acute need for automatic tools and techniques that can detect vulnerabilities in apps and, when
                                         possible, suggest fixes for identified vulnerabilities.

                                                                                                    1
While the software development community has recently realized the importance of security, developer
awareness about how security issues transpire and how to avoid them still lacks [Green and Smith, 2016].
Hence, vulnerability detection tools need to be applicable off the shelf with no or minimal configuration.
    In this context, numerous efforts have proposed techniques and developed tools to detect different vulner-
abilities (and malicious behavior) in Android apps. Given the number of proposed techniques and available
tools, there have been recent efforts to assess the capabilities of these tools and techniques [Reaves et al.,
2016, Sadeghi et al., 2017, Pauck et al., 2018]. However, these assessments are subject to one or more of the
following limiting factors:

  1. Consider techniques only as reported in the literature, i.e., without executing associated tools.
  2. Exercise a small number of tools.
  3. Consider only academic tools.

  4. Consider only tools that employ specific kind of underlying techniques, e.g., program analysis.
  5. Rely on technique-specific microbenchmarks, e.g., benchmarks targeting the use of taint-flow analysis
     to detect information leaks.
  6. Rely on benchmarks whose representativeness has not been established, i.e., do the benchmarks capture
     vulnerabilities as they occur in real-world apps?

  7. Use random real-world apps that are not guaranteed to be vulnerable.

    The evaluations performed in efforts that propose new tools and techniques also suffer from such limi-
tations. Specifically, such evaluations focus on proving the effectiveness of proposed tools and techniques in
detecting specific vulnerabilities. While such a focus is necessary, it is not sufficient as the effectiveness of
new tools and techniques in detecting previously known vulnerabilities is unknown. Hence, the results are
limited in their ability to help app developers choose appropriate tools and techniques.
    In short, to the best of our knowledge, there has been no evaluation of the effectiveness of Android app
vulnerability detection tools to detect known vulnerabilities without being limited by any of the above factors.
    In addition to the growing dependence on mobile apps, the prevalence of the Android platform, the
importance of securing mobile apps, and the need for automatic easy-to-use off-the-shelf tools to build
secure mobile apps, here are few more compelling reasons to evaluate the effectiveness of tools in detecting
known vulnerabilities in Android apps.

  1. To develop secure apps, app developers need to choose and use tools that are best equipped to detect
     the class of vulnerabilities that they believe (based on their intimate knowledge of their apps) will likely
     plague their apps, e.g., based on the APIs used in their apps. To make good choices, app developers need
     information about the effectiveness of tools in detecting various classes of vulnerabilities. Information
     about other aspects of tools such as performance, usability, and complexity can also be helpful in such
     decisions.
  2. With the information that a tool cannot detect a specific class of vulnerabilities, app developers can
     either choose to use a combination of tools to cover all or most of the vulnerabilities of interest or
     incorporate extra measures in their development process to help weed out vulnerabilities that cannot
     be detected by the chosen set of tools.
  3. App developers want to detect and prevent known vulnerabilities in their apps as the vulnerabilities,
     their impact, and their fixes are known a priori.
  4. An evaluation of effectiveness will expose limitations/gaps in the current set of tools and techniques.
     This information can aid tool developers to improve their tools. This information can help researchers
     direct their efforts to identify the cause of these limitations and either explore ways to address the limi-
     tations or explore alternative approaches to prevent similar vulnerabilities, e.g., by extending platform
     capabilities.

                                                       2
In terms of observations from tool evaluations, due to the sixth limiting factor mentioned above, ob-
servations from tool evaluations cannot be generalized to real-world apps unless the representativeness of
subjects/benchmarks used in tool evaluations has been measured, i.e., do the subjects/benchmarks capture
vulnerabilities as they occur in real-world apps? Despite the existence of numerous Android security anal-
ysis tools and techniques, there has been no evaluation of the representativeness of the benchmarks used in
evaluating these tools, i.e., do the benchmarks capture vulnerabilities as they occur in real-world apps?

1.2        Contributions
Motivated by the above observations, we experimented to evaluate the effectiveness of vulnerability detection
tools for Android apps. Incidentally, due to the inherent nature of the benchmarks, we also evaluated a few
malicious behavior detection tools. We considered 64 security analysis tools and empirically evaluated 19 of
them. We used benchmarks from Ghera repository [Mitra and Ranganath, 2017] as they captured 42 known
vulnerabilities and were known to be tool/technique agnostic, authentic, feature specific, minimal, version
specific, comprehensive, and dual i.e., contain both vulnerable and malicious apps.
    To ensure the observations from the above tools evaluation can be generalized to real-world apps, we
assessed if Ghera benchmarks were representative of real-world apps, i.e., do Ghera benchmarks capture
vulnerabilities as they occur in real-world apps?
    In this paper, we describe these evaluations, report about the representativeness of Ghera benchmarks,
and make 24 observations concerning the effectiveness of Android app security analysis tools.

1.3        Rest of the Paper
This paper is organized as follows. Section 2 describes Ghera repository and our rationale for using it to
evaluate tools. Section 3 describes the experiment to measure the representativeness of Ghera benchmarks
along with our observations from the experiment. Section 4 describes the evaluation of the effectiveness of
vulnerability detection tools for Android apps along with the 20 observations from the evaluation. Section 5
describes the incidental evaluation of the effectiveness of malicious behavior detection tools for Android
apps along with four observations from the evaluation. Section 6 discusses prior evaluations of Android
security analysis tools and how our evaluation relates to them. Section 7 provides information to access the
automation scripts used to perform the evaluation and the artifacts generated in the evaluation. Section 8
mentions possible extensions to this effort. Section 9 summarizes our observations from this evaluation.
Section A briefly catalogs the vulnerabilities captured in Ghera and considered in this evaluation.

2      Ghera: A Repository of Vulnerability Benchmarks
For this evaluation, we considered the Android app vulnerabilities cataloged in Ghera repository, a growing
repository of benchmarks that captures known vulnerabilities in Android apps [Mitra and Ranganath, 2017].
We created this repository in 2017 with the goal of cataloging vulnerabilities in Android apps as reported
by prior work.
    Ghera contains two kinds of benchmarks: lean and fat. Lean benchmarks are stripped down apps that
exhibit vulnerabilities and exploits with almost no other interesting behaviors and functionalities. Fat bench-
marks are real-world apps that exhibit specific known vulnerabilities.
    At the time of this evaluation, the number of fat benchmarks in Ghera was low. So, we considered only
lean benchmarks in this evaluation. In the rest of this paper, we will focus on lean benchmarks and refer to
them as benchmarks.
    Each benchmark capturing a specific vulnerability X is composed of three apps (where applicable): a
benign (vulnerable) app with vulnerability X,1 a malicious app capable of exploiting vulnerability X in the
benign app, and a secure app without vulnerability X and, hence, not exploitable by the malicious app.
Malicious apps are absent in benchmarks when malicious behavior occurs outside the Android environment,
e.g., web app. Each benchmark is accompanied by instructions to demonstrate the captured vulnerability
    1 We   use the terms benign and vulnerable interchangeably.

                                                                  3
and the corresponding exploit by building and executing the associated apps. Consequently, the presence
and absence of vulnerabilities and exploits in these benchmarks are verifiable.
At the time of this evaluation, Ghera contained 42 benchmarks grouped into the following seven categories
based on the nature of the APIs (including features of XML-based configuration) involved in the creation of
captured vulnerabilities. (Category labels that are used later in the paper appear in square brackets.)
1. Crypto category contains 4 vulnerabilities involving cryptography API. [Crypto]
2. ICC category contains 16 vulnerabilities involving inter-component communication (ICC) API. [ICC]
3. Networking category contains 2 vulnerabilities involving networking (non-web) API. [Net]
4. Permission category contains 1 vulnerability involving permission API. [Perm]
5. Storage category contains 6 vulnerabilities involving data storage and SQL database APIs. [Store]
6. System category contains 4 vulnerabilities involving system API dealing with processes. [Sys]
7. Web category contains 9 vulnerabilities involving web API. [Web]
Section A briefly catalogs these vulnerabilities and their canonical references.
2.1 Why Use Ghera?
Past efforts focused on the creation of benchmarks have considered criteria to ensure/justify the benchmarks
are useful, e.g., database related benchmarks have considered relevance, scalability, portability, ease of
use, ease of interpretation, functional coverage, and selectivity coverage [Gray, 1992]; web services related
benchmarks have considered criteria such as repeatability, portability, representativeness, non-intrusiveness,
and simplicity [Antunes and Vieira, 2010].
In a similar spirit, for evaluations of security analysis tools to be useful to tool users, tool developers, and
researchers, we believe evaluations should be based on vulnerabilities (consequently, benchmarks) that are
valid (i.e., will result in a weakness in an app), general (i.e., do not depend on uncommon constraints such
as rooted device or admin access), exploitable (i.e., can be used to inflict harm), and current (i.e., occur in
existing apps and can occur in new apps).
The vulnerabilities captured in Ghera benchmarks have been previously reported in the literature or
documented in Android documentation; hence, they are valid. These vulnerabilities can be verified by
executing the benign and malicious apps in Ghera benchmarks on vanilla Android devices and emulators;
hence, they are general and exploitable. These vulnerabilities are current as they are based on Android API
levels 19 thru 25, which enable more than 90% of Android devices in the world and are targeted by both
existing and new apps.
Due to these characteristics and the salient characteristics of Ghera — tool and technique agnostic,
authentic, feature specific, contextual (lean), version specific, duality and comprehensive — described by
Mitra and Ranganath [2017], Ghera is well-suited for this evaluation.
3 Representativeness of Ghera Benchmarks
For tools evaluations to be useful, along with the above requirements, the manifestation of a vulnerability
considered in the evaluation should be representative of the manifestations of the vulnerability in real-world
apps. In other words, the evaluation should consider vulnerabilities as they occur in real-world apps.
A vulnerability can manifest or occur in different ways in apps due to various aspects such as producers
and consumers of data, nature of data, APIs involved in handling and processing data, control/data flow
paths connecting various code fragments involved in the vulnerability, and platform features involved in the
vulnerability. As a simple example, consider a vulnerability that leads to information leak: sensitive data
is written into an insecure location. This vulnerability can manifest in multiple ways. Specifically, at the
least, each combination of different ways of writing data into a location (e.g., using different I/O APIs) and
4different insecure locations (e.g., insecure file, untrusted socket) can lead to a unique manifestation of the
vulnerability.
In terms of representativeness as described above and as desired in tool assessments (as mentioned in
Section 1.1), there is no evidence that the benchmarks in Ghera capture vulnerabilities as they manifest or
occur in real-world apps; hence, we needed to establish the representativeness of Ghera benchmarks.
3.1 How to Measure Representativeness?
Since Ghera benchmarks capture specific manifestations of known vulnerabilities, we wanted to identify these
manifestations in real-world apps to establish the representativeness of the benchmarks. However, there
was no definitive list of versions of apps that exhibit known vulnerabilities. So, we explored CVE [Mitre
Corporation, 2017], an open database of vulnerabilities discovered in real-world Android apps, to identify
vulnerable versions of apps. We found that most CVE vulnerability reports failed to provide sufficient
information about the validity, exploit-ability, and manifestation of vulnerabilities in the reported apps.
Next, we considered the option of manually examining apps mentioned in CVE reports for vulnerabilities.
This option was not viable because CVE vulnerability reports do not include copies of reported apps. Also,
while app version information from CVE could be used to download apps for manual examination, only the
latest version of apps are available from most Android app stores and app vendors.
Finally, we decided to use usage information about Android APIs involved in manifestations of vulnera-
bilities as a proxy to establish the representativeness of Ghera benchmarks. The rationale for this decision
is the likelihood of a vulnerability occurring in real-world apps is directly proportional to the number of
real-world apps using the Android APIs involved in the vulnerability. So, as a weak yet general measure
of representativeness, we identified Android APIs used in Ghera benchmarks and measured how often these
APIs were used in real-world apps.
3.2 Experiment
3.2.1 Source of Real-World Apps
We used AndroZoo as the source of real-world Android apps. AndroZoo is a growing collection of Android
apps gathered from several sources including the official Google Play store [Allix et al., 2016]. In May 2018,
AndroZoo contained more than 5.8 million different APKs (app bundles).
Every APK (app bundle) contains an XML-based manifest file and a DEX file that contains the code
and data (i.e., resources, assets) corresponding to the app. By design, each Android app is self-contained.
So, the DEX file contains all code that is necessary to execute the app but not provided by the underlying
Android Framework or Runtime. Often, DEX files include code for Android support library.
AndroZoo maintains a list of all of the gathered APKs. This list documents various features of APKs
such as SHA256 hash of an APK (required to download the APK from AndroZoo), size of an APK, and the
date (dex date) associated with the contained DEX file.2 However, this list does not contain information
about API levels (Android versions) that are targeted by the APKs; this information can be recovered from
the APKs.
3.2.2 App Sampling
Each version of Android is associated with an API level, e.g., Android versions 5.0 and 5.1 are associated
with API levels 21 and 22, respectively. Every Android app is associated with a minimum API level (version)
of Android required to use the app and a target API level (version) of Android that is ideal to use the app;
this information is available in the app’s manifest file.
At the time of this tools evaluation, Ghera benchmarks targeted API levels 19 thru 25 excluding 20.34
So, we decided to select only apps that targeted API level 19 or higher and required minimum API level
2 dex date may not correspond to the release date of the app.
3 API level 20 was excluded because it is API level 19 with wearable extensions and Ghera benchmarks focus on vulnerabilities
in Android apps running on mobile devices.
4 In the rest of this manuscript, “API levels 19 thru 25” means API levels 19 thru 25 excluding 20.
514 or higher.5 Since minimum and target API levels of apps were not available in the AndroZoo APK list,
we decided to select apps based on their release dates. As API level 19 was released in November 2014, we
decided to select only apps that were released after 2014. Since release dates of APKs were not available
from AndroZoo APK list, we decided to use dex date as a proxy for the release date of apps.
Based on the above decisions, we analyzed the list of APKs available from AndroZoo to select the APKs
to download. We found 2.3 million APKs with dex date between 2015 and 2018 (both inclusive). In these
APKs, there were 790K, 1346K, 156K, and 17K APKs with dex date from the years 2015, 2016, 2017, and
2018, respectively. From these APKs, we drew an unequal probability sample without replacement and with
probabilities 0.1, 0.2, 0.4, and 0.8 of selecting an APK from years 2015 thru 2018, respectively. We used
unequal probability sampling to give preference to the latest APKs as the selected apps would likely target
recent API levels and to adjust for the non-uniformity of APK distribution across years. To create a sample
with at least 100K real-world Android apps that targeted the chosen API levels, we tried to download 339K
APKs and ended up downloading 292K unique APKs. Finally, we used the apkanalyzer tool from Android
Studio to identify and discard downloaded apps (APKs) with target API level less than 19 or minimum API
level less than 14. This resulted in a sample of 111K real-world APKs that targeted API levels 19 thru 25
(excluding 20) or higher.
3.2.3 API-based App Profiling
Android apps access various capabilities of the Android platform via features of XML-based manifest files and
Android programming APIs. We refer to the published Android programming APIs and the XML elements
and attributes (features) of manifest files collectively as APIs. We use the term API to mean either a
function, a method, a field, or an XML feature.
For each app (APK), we collected its API profile based on the APIs that were used by or defined in the
app, and we deemed as relevant to this evaluation as follows.
1. From the list of elements and attributes that can be present in a manifest file, based on our knowl-
edge of Ghera benchmarks, we conservatively identified the values of 7 attributes (e.g., intent-
filter/category@name), the presence of 26 attributes (e.g., path-permission@writePermission), and the
presence of 6 elements (e.g., uses-permission) as APIs relevant to this evaluation. For each app, we
recorded the APIs used in the app’s manifest.
2. For an app, we considered all published (i.e., public and protected) methods along with all methods
that were used but not defined in the app. Former methods accounted for callback APIs provided by
an app and latter methods accounted for service offering (external) APIs used by an app. We also
considered all fields used in the app. From these considered APIs, we discarded obfuscated APIs, i.e.,
with a single character name. To make apps comparable in the presence of definitions and uses of
overridden Java methods (APIs), if a method was overridden, then we considered the fully qualified
name (FQN) of the overridden method in place of the FQN of the overriding method using Class
Hierarchy Analysis. Since we wanted to measure representativeness in terms of Android APIs, we
discarded APIs whose FQN did not have any of these prefixes: java, org, android, and com.android.
For each app, we recorded the remaining APIs.
3. Numerous APIs commonly used in almost all Android apps are related to aspects (e.g., UI rendering)
that are not the focus of Ghera benchmarks. To avoid their influence on the result, we decided to
ignore such APIs. So, we considered the benign app of the template benchmark in Ghera repository.
This app is a basic Android app with one activity containing a couple of widgets and no functionality.
Out of the 1502 APIs used in this app, we manually identified 1134 APIs as commonly used in Android
apps (almost all of them were basic Java APIs or related to UI rendering and XML processing). For
each app, we removed these APIs from its list of APIs recorded in above steps 1 and 2 and considered
the remaining APIs as relevant APIs.
To collect API profiles of apps in Ghera, we used the APKs available in Ghera repository because we
had eliminated extraneous APIs from these APKs by using the proguard tool.
5 Wechose API level 14 as the cut-off for minimum API level as the number of apps targeting API level 19 peaked at
minimum API level 14.
6While collecting API-based profile of apps in AndroZoo sample, we discarded 5% of the APKs due to
errors in APKs (e.g., missing required attributes) and tooling issues (e.g., parsing errors). Finally, we ended
up with a sample of 105K real-world APKs (apps) from AndroZoo.
3.2.4 Measuring Representativeness
We identified the set of relevant APIs associated with benign apps in Ghera using the steps described in
the previous section. Of the resulting 601 unique relevant APIs, we identified 117 as security-related APIs.
Based on our experience with Ghera, we were certain the identified APIs could influence app security. For
both these sets of APIs, we measured representativeness in two ways.
1. Using API Use Percentage. For each API, we calculated the percentage of sample apps that used it.
To observe how representativeness changes across API levels, we created API level specific app samples.
The app sample specific to API level k contained every sample app whose minimum API level was less
than or equal to k, and the target API level was greater than or equal to k. In each API level specific
sample, for each API, we calculated the percentage of apps that used the API.
The rationale for this measurement is, if Ghera benchmarks are representative of real-world apps in
terms of using an API, then a large number of real-world apps should use the API.
2. Comparing Sampling Proportions. For each API, we calculated the sampling proportion of sample
apps that used the API.
To calculate the sampling proportion, we randomly selected 80% of the sample apps, grouped them into
sub-samples containing 40 apps each, and calculated the mean of the proportions in each sub-sample.
We also calculated the sampling proportion of benign apps in Ghera that used the API by randomly
drawing 40 samples (with replacement) containing 40 apps each. We then compared the sampling
proportions with confidence level = 0.95, p-value ≤ 0.05, and the null hypothesis being the proportion
of benign apps in Ghera using the API is less than or equal to the proportion of real-world apps using
the API.
We performed this test both at specific API levels and across API levels.
The rationale for this measurement is, if Ghera benchmarks are representative of real-world apps in
terms of using an API, then the proportion of Ghera benchmarks using the API should be less than or
equal to the proportion of real-world apps using the API.
With Top-200 Apps. We gathered the top-200 apps from Google Play store on April 18, 2018, and
repeated the above measurements both across API levels and at specific API levels. Only 163 of the top-200
apps made it thru the app sampling and API-based app profiling process due to API level restrictions, errors
in APKs, and tooling issues. Hence, we considered 40 sub-samples with replacement containing 40 apps each
to measure representativeness by comparing sampling proportions.
3.3 Observations
3.3.1 Based on API Use Percentage
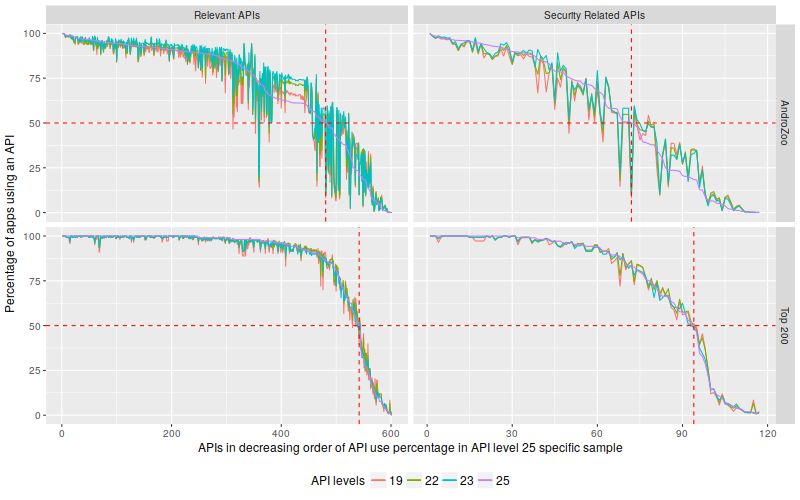
The color graphs in Figure 1 show the percentage of sample real-world Android apps using the APIs used in
benign apps in Ghera. The Y-axis denotes the percentage of apps using an API. The X-axis denotes APIs
in decreasing order of percentage of their usage in API level 25 specific sample. The graphs on the left are
based on relevant APIs while the graphs on the right are based only on security-related APIs. The graphs
on the top are based on the AndroZoo sample while the graphs on the bottom are based on the top-200
sample. To avoid clutter, we have not plotted data for API levels 21 and 24 as they were closely related to
API levels 22 and 25, respectively.
Since API level 25 is the latest API level considered in this evaluation, we focus on the data for API level
25 specific samples. In AndroZoo sample, we observe 80% (481 out of 601) of relevant APIs used in benign
apps in Ghera were each used by more than 50% (52K) of real-world apps; see the dashed red lines in the
top left graph in Figure 1. For the top-200 sample, this number increases to 90% (542 out of 601); see the
7Figure 1: Percentage of apps that use APIs used in benign Ghera apps.
dashed red lines in the bottom left graph in Figure 1. When considering only security-related APIs, 61% (72
out of 117) of APIs used in benign apps in Ghera were each used by more than 50% of real-world apps in
AndroZoo sample; see the dashed red lines in the top right graph in Figure 1. For the top-200 sample, this
number increases to 80% (94 out of 117); see the dashed red lines in the bottom right graph in Figure 1.
Barring few APIs in case of AndroZoo sample (i.e., dips for APIs ranked between 300 and 400 and closer
to 481 (vertical dotted line) in the top left graph in Figure 1), the above observations hold true for all API
levels considered from 19 thru 25 in both the AndroZoo sample and the top-200 sample.
Further, while we do not present the data in this manuscript, we made similar observations in cases of
malicious apps and secure apps in Ghera with both the AndroZoo sample and the top-200 sample.6
Above observations suggest a large number of real-world apps use a large number of APIs used in Ghera
benchmarks. Consequently, we can conclude that Ghera benchmarks are representative of real-world apps.
An Opportunity with Security-Related APIs In the bottom right graph in Figure 1, observe that
a large percentage of top-200 apps use many security-related APIs. This large percentage is no surprise
as these apps are likely to be widely used and are likely built with proper security measures to keep their
users secure. Surprisingly, based on the AndroZoo sample (see top right graph in Figure 1), this is also
true of real-world apps — 72 of the 117 security-related APIs are each used by more than 52K apps from
AndroZoo sample in all considered API levels. Thus, a large number of real-world apps use security-related
APIs knowingly or unknowingly and correctly or incorrectly. Hence, there is a tremendous opportunity to
help identify and fix incorrect use of security-related APIs.
3.3.2 Based on Sampling Proportions
Columns 4, 5, 8, and 9 in Table 1 report the number of relevant APIs for which the null hypothesis — the
proportion of benign apps in Ghera using API X is less than or equal to the proportion of real-world apps
6 The raw data supporting these observations is available as part of publicly available evaluation artifacts; see Section 7.
8AndroZoo Apps top-200 Apps
Representative Representative
APIs (%) APIs (%)
API Sample Sub- Relevant Security Sample Sub- Relevant Security
Level Size Samples Related Size Samples Related
19-25 105586 2111 414 (68) 110 (94) 163 40 571 (95) 116 (99)
19 105483 2109 415 (69) 110 (94) 143 40 569 (94) 116 (99)
21 93673 1873 438 (72) 110 (94) 156 40 565 (94) 116 (99)
22 78470 1569 450 (74) 111 (94) 153 40 569 (94) 116 (99)
23 55087 1101 464 (77) 113 (96) 128 40 567 (94) 116 (99)
24 7530 150 466 (77) 113 (96) 109 40 568 (94) 116 (99)
25 2863 57 430 (71) 112 (95) 104 40 568 (94) 116 (99)
Table 1: Representativeness based on sample proportions test. Of the 601 selected (all) APIs, 117 APIs were
security-related.
using API X — could not be rejected. This data suggests, for at least 68% of relevant APIs, the proportion
of Ghera apps that used an API could be less than or equal to the proportion of real-world apps in the
AndroZoo sample that use the same API. This is true across all API levels and at specific API levels. This
is also true for at least 94% of security-related APIs. In the case of the top-200 sample, this is true for at
least 94% of relevant APIs and 99% of security-related APIs.7
Further, we made similar observations in cases of malicious apps and secure apps in Ghera with both the
AndroZoo sample and the top-200 sample.
Considering Ghera benchmarks as a custom sample in which the proportion of benchmarks that used a
specific set of APIs (relevant or security-related) was expected to be high, the above observations suggest
such proportions are higher for these APIs in real-world apps. Consequently, we can conclude that Ghera
benchmarks are representative of real-world apps.
3.4 Threats to Validity
This evaluation of representativeness is based on a weak measure of manifestation of vulnerabilities — the use
of APIs involved in vulnerabilities. Hence, this evaluation could have ignored the influence of richer aspects
such as API usage context, security desiderata of data, and data/control flow path connecting various API
uses, which are involved and hard to measure. The influence of such aspects can be verified by measuring
representativeness by considering these aspects.
While we considered a large sample of real-world apps, the distribution of apps across targeted API
levels was skewed — there were fewer apps targeting recent API levels. Hence, recent API level specific
samples may not have exhibited the variations observed in larger API specific samples, e.g., API level 19
(see Figure 1). This possibility can be verified by repeating this experiment using samples of comparable
sizes.
The version of Ghera benchmarks considered in this evaluation was developed when API level 25 was the
latest Android API level. So, it is possible that tooling and library support available for API level 25 could
have influenced the structure of Ghera benchmarks and, consequently, the observations in Section 3.2. This
possibility can be verified by repeating this experiment in the future while using tooling and library support
available with newer API levels.
We have taken extreme care to avoid errors while collecting and analyzing data. Even so, there could be
errors in our evaluation in the form of commission errors (e.g., misinterpretation of data, misidentification
of APIs as relevant and security-related), omission errors (e.g., missed data points), and automation errors.
This threat to validity can be addressed by examining both our raw and processed data sets (see Section 7),
analyzing the automation scripts, and repeating the experiment.
7 These numbers will only be higher when lower p-value thresholds are considered.
94 Vulnerability Detection Tools Evaluation
4.1 Android App Security Analysis Solutions
While creating Ghera repository in 2017, we became aware of various solutions for Android app security.
From June 2017, we started collecting information about such solutions. Our primary sources of information
were research papers [Sadeghi et al., 2017, Reaves et al., 2016], repositories [Bhatia, 2014], and blog posts
[Agrawal, 2015] that collated information about Android security solutions.
From these sources, we reviewed 64 solutions that were related to Android security. (The complete list of
these solutions is available at https://bitbucket.org/secure-it-i/may2018.) We classified the solution
along the following dimensions.
1. Tools vs Frameworks: Tools detect a fixed set of security issues. While they can be applied immediately,
they are limited to detecting a fixed set of issues. On the other hand, frameworks facilitate the creation
of tools that can detect specific security issues. While they are not immediately applicable to detect
vulnerabilities and require effort to create tools, they enable detection of a relatively open set of issues.
2. Free vs. Commercial: Solutions are available either freely or for a fee.
3. Maintained vs. Unmaintained: Solutions are either actively maintained or unmaintained (i.e., few years
of development dormancy). Typically, unmaintained solutions do not support currently supported
versions of Android. This observation is also true of a few maintained solutions.
4. Vulnerability Detection vs. Malicious Behavior Detection: Solutions either detect vulnerabilities in an
app or flag signs of malicious behavior in an app. App developers typically use the former while app
stores and end users use the latter.
5. Static Analysis vs. Dynamic Analysis: Solutions that rely on static analysis analyze either source code
or Dex bytecode of an app and provide verdicts about possible security issues in the app. Since static
analysis abstracts the execution environment, program semantics, and interactions with users and other
apps, solutions reliant on static analysis can detect issues that occur in a variety of settings. However,
since static analysis may incorrectly consider invalid settings due to too permissive abstractions, they
are prone to high false positive rate.
In contrast, solutions that rely on dynamic analysis execute apps and check for security issues at
runtime. Consequently, they have a very low false positive rate. However, they are often prone to a
high false negative rate because they may fail to explore specific settings required to trigger security
issues in an app.
6. Local vs. Remote: Solutions are available as executables or as sources from which executables can be
built. These solutions are installed and executed locally by app developers.
Solutions are also available remotely as web services (or via web portals) maintained by solution
developers. App developers use these services by submitting the APKs of their apps for analysis
and later accessing the analysis reports. Unlike local solutions, app developers are not privy to what
happens to their apps when using remote solutions.
4.2 Tools Selection
4.2.1 Shallow Selection
To select tools for this evaluation, we first screened the considered 64 solutions by reading their documentation
and any available resources. We rejected five solutions because they lacked proper documentation, e.g., no
documentation, lack of instructions to build and use tools. This elimination was necessary to eliminate human
bias resulting from the effort involved in discovering how to build and use a solution, e.g., DroidLegacy
[Deshotels et al., 2014], BlueSeal [Shen et al., 2014]. We rejected AppGuard [Backes SRT GmbH, 2014]
because its documentation was not in English. We rejected six solutions such as Aquifer [Nadkarni et al.,
2016], Aurasium [Xu et al., 2012], and FlaskDroid [Bugiel et al., 2013] as they were not intended to detect
vulnerabilities, e.g., intended to enforce security policy.
10Of the remaining 52 solutions, we selected solutions based on the first four dimensions mentioned in
Section 4.1.
In terms of tools vs. frameworks, we were interested in solutions that could readily detect vulnerabilities
with minimal adaptation, i.e., use it off-the-shelf instead of having to build an extension to detect a specific
vulnerability. The rationale was to eliminate human bias and errors involved in identifying, creating, and
using the appropriate adaptations. Also, we wanted to mimic a simple developer workflow: procure/build
the tool based on APIs it tackles and the APIs used in an app, follow its documentation, and apply it
to the app. Consequently, we rejected 16 tools that only enabled security analysis, e.g., Drozer [MWR
Labs, 2012], ConDroid [Anand et al., 2012]. When a framework provided pre-packaged extensions to de-
tect vulnerabilities, we selected such frameworks and treated each such extension as a distinct tool, e.g.,
we selected Amandroid framework as it comes with seven pre-packaged vulnerability detection extensions
(i.e., data leakage (Amandroid1 ), intent injection (Amandroid2 ), comm leakage (Amandroid3 ), password
tracking (Amandroid4 ), OAuth tracking (Amandroid5 ), SSL misuse (Amandroid6 ), and crypto misuse
(Amandroid7 )) that can each be used as a separate off-the-shelf tool (Amandroidx ) [Wei et al., 2014].
In terms of free vs. commercial, we rejected AppRay as it was a commercial solution [App-Ray, 2015].
While AppCritique was a commercial solution, a feature-limited version of it was available for free. We
decided to evaluate the free version and did not reject AppCritique.
In terms of maintained vs. unmaintained, we focused on selecting only maintained tools. So, we rejected
AndroWarn and ScanDroid tools as they were not updated after 2013 [Debize, 2012, Fuchs et al., 2009]. In
a similar vein, since our focus was on currently supported Android API levels, we rejected TaintDroid as it
supported only API levels 18 or below [Enck et al., 2010].
In terms of vulnerability detection and malicious behavior detection, we selected only vulnerability de-
tection tools and rejected six malicious behavior detection tools.
Next, we focused on tools that could be applied as is without extensive configuration (or inputs). The
rationale was to eliminate human bias and errors involved in identifying and using appropriate configurations.
So, we rejected tools that required additional inputs to detect vulnerabilities. Specifically, we rejected Sparta
as it required analyzed apps to be annotated with security types [Ernst et al., 2014].
Finally, we focused on the applicability of tools to Ghera benchmarks.8 We considered only tools that
claimed to detect vulnerabilities stemming from APIs covered by at least one category in Ghera benchmarks.
For such tools, based on our knowledge of Ghera benchmarks and shallow exploration of the tools, we assessed
if the tools were indeed applicable to the benchmarks in the covered categories. The shallow exploration
included checking if the APIs used in Ghera benchmarks were mentioned in any lists of APIs bundled with
tools, e.g., the list of the information source and sink APIs bundled with HornDroid and FlowDroid. In this
regard, we rejected 2 tools (and 1 extension): a) PScout [Au et al., 2012] focused on vulnerabilities related
to over/under use of permissions and the only permission related benchmark in Ghera was not related to
over/under use of permissions and b) LetterBomb [Garcia et al., 2017] and Amandroid’s OAuth tracking
extension (Amandroid5 ) as they were not applicable to any Ghera benchmark.9
4.2.2 Deep Selection
Of the remaining 23 tools, for tools that could be executed locally, we downloaded the latest official release
of the tools, e.g., Amandroid.
If an official release was not available, then we downloaded the most recent version of the tool (executable
or source code) from the master branch of its repository, e.g., AndroBugs. We then followed the tool’s
documentation to build and set up the tool. If we encountered issues during this phase, then we tried to fix
them; specifically, when issues were caused by dependency on older versions of other tools (e.g., HornDroid
failed against real-world apps as it was using an older version of apktool, a decompiler for Android apps),
incorrect documentation (e.g., documented path to the DIALDroid executable was incorrect), and incomplete
documentation (e.g., IccTA’s documentation did not mention the versions of required dependencies [Li et al.,
2015]). Our fixes were limited to being able to execute the tools and not to affect the behavior of the tool.
8 In the rest of this manuscript, for brevity, we say “a tool is applicable to a benchmark” if the tool is designed or claims
to detect the vulnerability captured by the benchmark. Likewise, “a tool is applicable to a set of benchmarks” if the tool is
applicable to at least one benchmark in the set.
9 While Ghera did not have benchmarks that were applicable to some of the rejected tools at the time of this evaluation, it
currently has such benchmarks that can be used in subsequent iterations of this evaluation.
11We stopped trying to fix an issue and rejected a tool if we could not figure out a fix by interpreting the error
messages and by exploring existing publicly available bug reports. This policy resulted in rejecting DidFail
[Klieber et al., 2014].
Of the remaining tools, we tested 18 local tools using the benign apps from randomly selected Ghera
benchmarks I1, I2, W8, and W910 and randomly selected apps Offer Up, Instagram, Microsoft Outlook, and
My Fitness Pal’s Calorie Counter from Google Play store. We execute each tool with each of the above
apps as input on a 16 core Linux machine with 64GB RAM and with 15 minute time out period. If a
tool failed to execute successfully on all of these apps, then we rejected the tool. Explicitly, we rejected
IccTA and SMV Hunter because they failed to process the test apps by throwing exceptions [Li et al., 2015,
Sounthiraraj et al., 2014]. We rejected CuckooDroid and DroidSafe because they ran out of time or memory
while processing the test apps [Gordon et al., 2015, Cuckoo, 2015].
For nine tools that were available only remotely, we tested them by submitting the above test apps for
analysis. If a tool’s web service was unavailable, failed to process all of the test apps, or did not provide
feedback within 30–60 minutes, then we rejected it. Consequently, we rejected four remote tools, e.g.,
TraceDroid [van der Veen and Rossow, 2013].
4.2.3 Selected Tools
Table 2 lists the fourteen tools selected for evaluation along with their canonical reference. For each tool, the
table reports the version (or the commit id) selected for evaluation, dates of its initial publication and latest
update, whether it uses static analysis (S) or dynamic analysis (D) or both (SD), whether it runs locally (L)
or remotely (R), whether it is an academic (A) or non-academic (N) tool, whether it uses shallow analysis
(H) or deep analysis (E), and the time spent to set up tools on a Linux machine.
4.3 Experiment
Every selected vulnerability detection tool (including pre-packaged extensions treated as tools) was applied
in its default configuration to the benign app and the secure app separately of every applicable Ghera
benchmark (given in column 9 in Table 5). To control for the influence of API level on the performance of
tools, we used APKs that were built with minimum API level of 19 and target API level of 25, i.e., these
APKs can be installed and executed with every API level from 19 thru 25.
We executed the tools on a 16 core Linux machine with 64GB RAM and with 15-minutes time out. For
each execution, we recorded the execution time and any output reports, error traces, and stack traces. We
then examined the output to determine the verdict and its veracity pertaining to the vulnerability.
4.3.1 Ensuring Fairness
Consider only supported versions of Android: FixDroid was not evaluated on secure apps in Ghera
because Android Studio version 3.0.1 was required to build the secure apps in Ghera and FixDroid was
available as a plugin only to Android Studio version 2.3.3. Further, since we added benchmarks C4, I13,
I15, and S4 after Ghera migrated to Android Studio version 3.0.1, FixDroid was not evaluated on these
benchmarks; hence, we evaluated FixDroid on only 38 Ghera benchmarks.
Provide inputs as required by tools: COVERT [Bagheri et al., 2015] and DIALDroid [Bosu et al., 2017]
detect vulnerabilities stemming from inter-app communications, e.g., collusion, compositional vulnerabilities.
So, we applied each of these tools in its default configuration to 33 Ghera benchmarks that included malicious
apps. For each benchmark, we provided the malicious app as input together with the benign app and the
secure app.
Consider multiple operational modes: JAADAS [Keen, 2016] operates in two modes: fast mode in
which only intra-procedural analysis is performed (JAADASH ) and full mode in which both intra- and
inter-procedural analyses are performed (JAADASE ). Since the modes can be selected easily, we evaluated
JAADAS in both modes.
10 Refer to Section A for a brief description of these benchmarks.
12Tool Commit Id / Updated S/D L/R A/N H/E Set Up
Version [Published] Time (sec)
Amandroid [Wei et al., 2014] 3.1.2 2017 [2014] S L A E 3600
AndroBugs [Lin, 2015] 7fd3a2c 2015 [2015] S L N H 600
AppCritique [Allen, 2018] ? ? [?] ? R N ?
COVERT [Bagheri et al., 2015] 2.3 2015 [2015] S L A E 2700
DevKnox [DevKnox, 2016] 2.4.0 2017 [2016] S L N H 600
DIALDroid [Bosu et al., 2017] 25daa37 2018 [2016] S L A E 3600
FixDroid [Nguyen et al., 2017] 1.2.1 2017 [2017] S L A H 600
FlowDroid [Arzt et al., 2014] 2.5.1 2018 [2013] S L A E 9000
HornDroid [Calzavara et al., 2016] aa92e46 2018 [2017] S L A E 600
13
JAADAS [Keen, 2016] 0.1 2017 [2017] S L N H/E 900
MalloDroid [Fahl et al., 2012] 78f4e52 2013 [2012] S L A H 600
Marvin-SAa [Rinaudo and Heguiabehere, 2016] 6498add 2016 [2016] S L N H 600
MobSF [Abraham et al., 2015] b0efdc5 2018 [2015] SD L N H 1200
QARK [LinkedIn, 2015] 1dd2fea 2017 [2015] S L N H 600
Table 2: Evaluated vulnerability detection tools. “?” denotes unknown information. S and D denote use of static analysis and dynamic analysis,
respectively. L and R denote the tool runs locally and remotely, respectively. A and N denote academic tool and non-academic tool, respectively. H
and E denote the tool uses shallow analysis and deep analysis, respectively. Empty cell denotes non-applicable cases.
a We refer to Marvin Static Analyzer as Marvin-SA.Cumulative # of Considered Vulnerabilities
Year Crypto ICC Net Perm Store Sys Web Total # Tools11 API Levels
2011 0 7 0 0 2 0 0 9 0
2012 0 7 0 0 2 0 4 13 0
2013 4 7 0 0 2 0 7 20 1 19
2014 4 11 0 1 6 4 8 34 1 21
2015 4 14 1 1 6 4 9 39 3 22, 23
2016 4 14 1 1 6 4 9 39 4 24, 25
2017 4 14 2 1 6 4 9 40 9
2018 4 16 2 1 6 4 9 42 13
Table 3: Cumulative number of considered vulnerabilities discovered until a specific year (inclusive). Tools
column is cumulative number of evaluated tools published until a specific year (inclusive). API Levels column
lists the API levels released in a specific year.
QARK [LinkedIn, 2015] can analyze the source code and the APK of an app. It decompiles the DEX
bytecodes in an APK into source form. Since the structure of reverse engineered source code may differ
from the original source code and we did not know if this could affect the accuracy of QARK’s verdicts, we
evaluated QARK with both APKs (QARKA ) and source code (QARKS ).
Consider only supported API levels: Since the inception and evolution of tools are independent of the
evolution of Android API levels, a tool may not support an API level (e.g., the API level is released after
the tool was last developed/updated) and, hence, it may fail to detect vulnerabilities stemming from APIs
introduced in such unsupported API levels. To control for this effect, we identified the API levels supported
by tools.
Of the 14 tools, only three tools provide some information about the supported API levels (Android plat-
form versions). Specifically, JAADAS documentation states that JAADAS will work for all Android plat-
forms (as long as the platform version is provided as input). Amandroid was successfully used in [Wei et al.,
2018] to process ICC-Bench benchmarks [Wei, 2017] that target API level 25; hence, we inferred Amandroid
supports API level 25 and below. DIALDroid tool repository contains versions of Android platform corre-
sponding to API levels 3 thru 25 that are to be provided as input to the tool; hence, we inferred DIALDroid
supports API levels 19 thru 25.
In the absence of such information, we conservatively assumed the tools supported API levels 19 thru
25, and this assumption is fair because 1) API level 19 and 25 were released in October 2013 and December
2016, respectively, (see API Levels column in Table 3), 2) all tools were last updated in 2013 or later (see
Updated column in Table 2), and 3) every Ghera benchmark APK used in the evaluation were built to run
on every API level 19 thru 25.
Consider only applicable categories of vulnerabilities: While each tool could be evaluated against
all of 42 considered known vulnerabilities such an evaluation would be unfair as all tools are not geared to
detect all kinds of vulnerabilities, e.g., cryptography related vulnerability vs. storage related vulnerability.
Further, during app development, tools are often selected based on their capabilities pertaining to platform
features/APIs used in the app.
To control for this effect, for each tool, we identified the categories of vulnerabilities that it was applicable
to and evaluated it against only the vulnerabilities from these categories. Even within categories, we ignored
vulnerabilities if a tool was definitive not designed to detect them, e.g., MalloDroid tool was evaluated
only against SSL/TLS related vulnerabilities from Web category as the tool focuses on detecting SSL/TLS
related vulnerabilities; see entry in Web column for MalloDroid in Table 5. For each tool, Table 4 reports
the applicable Ghera benchmark categories.
11 In 2018, the total number of tools is 13 instead of 14 as the last updated date for AppCritique tool is unknown.
14API (Vulnerability) Categories
Tool Crypto ICC Net Perm Store Sys Web
Amandroid 3 3 3 3 3
AndroBugs * 3 3 3 3 3 3 3
AppCritique * 3 3 3 3 3 3 3
COVERT 3 3 3 3 3 3 3
DevKnox * 3 3 3 3 3 3 3
DIALDroid 3 3 3 3 3 3 3
FixDroid 3 3 3 3 3 3 3
FlowDroid 3 3 3
HornDroid 3 3 3 3 3
JAADAS * 3 3 3 3 3 3 3
MalloDroid 3
Marvin-SA * 3 3 3 3 3 3 3
MobSF * 3 3 3 3 3 3 3
QARK * 3 3 3 3 3 3 3
Table 4: Applicability of vulnerability detection tools to various benchmark categories in Ghera. “3” denotes
the tool is applicable to the vulnerability category in Ghera. Empty cell denotes non-applicable cases. “*”
identifies non-academic tools.
Consider the existence of vulnerabilities: Expecting a tool to detect vulnerabilities that did not exist
when the tool was developed/updated would be unfair. In terms of the purpose of this evaluation, this is not
a concern as the evaluation is less focused on individual tools and more focused on assessing the effectiveness
of the existing set of vulnerability detection tools against considered known vulnerabilities. In terms of the
execution of this evaluation, this is not a concern as almost all of the considered vulnerabilities (39 out of
42) were discovered before 2016 (see Total column in Table 3) and almost all of the evaluated tools (at least
10 out of 14) were updated in or after 2016 (see # Tools column in Table 3).
4.4 Observations and Open Questions
This section lists interesting observations along with interesting open questions that were uncovered but not
answered in this evaluation. While the data from this experiment supports the validity of the questions, the
answers to these questions require more experimentation.
4.4.1 Tools Selection
Open Questions 1 & 2 Of the considered 64 solutions, 17 tools (including Amandroid) were intended to
enable security analysis of Android apps; see Section 4.2.1. In other words, 26.5% of security analysis tools
considered in this evaluation enable security analysis of Android apps. Further, we have found these tools
be useful in our research workflow, e.g., Drozer [MWR Labs, 2012], MobSF [Abraham et al., 2015]. Hence,
we believe that studying these tools may be useful. Specifically, exploring two mutually related questions:
1) how expressive, effective, and easy-to-use are tools that enable security analysis? and 2) are Android app
developers and security analysts willing to invest effort in such tools? may help both tool users and tool
developers.
Observation 1 We rejected 39% of tools (9 out of 23) considered in deep selection; see Section 4.2.2.
Even considering the number of instances where the evaluated tools failed to process certain benchmarks
(see numbers in square brackets in Table 5), such a low rejection rate is rather impressive and suggests
tool developers are putting in effort to release robust security analysis tools. This number can be further
improved by distributing executables (where applicable), providing complete and accurate build instructions
(e.g., versions of required dependencies) for local tools, providing complete and accurate information about
15execution environment (e.g., versions of target Android platforms), and publishing estimated turn around
times for remote tools.
Observation 2 If the sample of tools included in this evaluation is representative of the population of
Android app security analysis tools, then almost every vulnerability detection tool for Android apps relies on
static analysis, i.e., 13 out of 14 ; see S/D column in Table 2.
Observation 3 Every vulnerability detection tool publicly discloses the category of vulnerabilities it tries
to detect. Also, almost all vulnerability detection tools are available as locally executable tools, i.e., 13 out
of 14; see L/R column in Table 2. So, vulnerability detection tools are open with regards to their vulnerability
detection capabilities. The likely reason is to inform app developers how the security of apps improves by
using a vulnerability detection tool and encourage the use of appropriate vulnerability detection tools.
Observation 4 Ignoring tools with unknown update dates (“?” in column 3 of Table 2) and considering
that we conducted the evaluation between June 2017 and May 2018, 9 out of 13 tools are less than 1.5
years old (2017 or later) and 12 out of 13 are less than or about 3 years old (2015 or later). Hence, the
selected tools can be considered as current. Consequently, the resulting observations are highly likely to be
representative of the current state of the freely available Android app security analysis tools.
4.4.2 Vulnerability Detection Tools
Table 5 summarizes the results from executing tools to evaluate their effectiveness in detecting different
categories of vulnerabilities. In the table, the number of vulnerabilities (benchmarks) that a tool was
applicable to (and applied to) in this evaluation and the number of vulnerabilities that were known when
a tool was developed or last updated before this evaluation is given by Applicable and Known columns,
respectively.
Every Ghera benchmark is associated with exactly one unique vulnerability v, and its benign app exhibits
v while its secure app does not exhibit v. So, for a tool, for each applicable benchmark, we classified the
tool’s verdict for the benign app as either true positive (i.e., v was detected in the benign app) or false
negative (i.e., v was not detected in the benign app). We classified the tool’s verdict for the secure app
as either true negative (i.e., v was not detected in a secure app) or false positive (i.e., v was detected in a
secure app). Columns TP, FN, and TN in Table 5 report true positives, false negatives, and true negatives,
respectively. False positives are not reported in the table as none of the tools except DevKnox (observe the
D for DevKnox under System benchmarks in Table 5) and data leakage extension of Amandroid (observe
the {1} for Amandroid1 under Storage benchmarks in Table 5) provided false positive verdicts. Reported
verdicts do not include cases in which a tool failed to process apps.
Observation 5 Most of the tools (10 out of 14) were applicable to every Ghera benchmark; see # Applicable
Benchmarks column in Table 5. Except for MalloDroid, the rest of the tools were applicable to 24 or more
Ghera benchmarks. This observation is also true of Amandroid if the results of its pre-packaged extensions
are considered together.
Observation 6 Based on the classification of the verdicts, 4 out of 14 tools detected none of the vulner-
abilities captured in Ghera (“0” in the TP column in Table 5) considering all extensions of Amandroid as
one tool. Even in case of tools that detected some of the vulnerabilities captured in Ghera, none of the tools
individually detected more than 15 out of the 42 vulnerabilities; see the numbers in the TP column and the
number of N’s under various categories in Table 5. This number suggests that in isolation, the current tools
are very limited in their ability to detect known vulnerabilities captured in Ghera.
Observation 7 For 11 out of 14 tools,12 the number of false negatives was greater than 70% of the
number of true negatives; see FN and TN columns in Table 5.13 This proximity between the number of false
12 AndroBugs, Marvin-SA, and MobSF were the exceptions.
13 We considered all variations of a tool as one tool, e.g., JAADAS. We did not count FixDroid as we did not evaluate it on
secure apps in Ghera.
16You can also read


