Real Estate Market Analysis: City of Rome
←
→
Page content transcription
If your browser does not render page correctly, please read the page content below
Real Estate Market Analysis:
Erie Boulevard Brownfield Opportunity Area & the City of Rome, NY

November 2016

Prepared for:
Bergmann Associates &
The City of Rome, NY

                                                 120 West Avenue, Suite 303
                                                 Saratoga Springs, NY 12866
                                                              518.899.2608
                                                 www.camoinassociates.com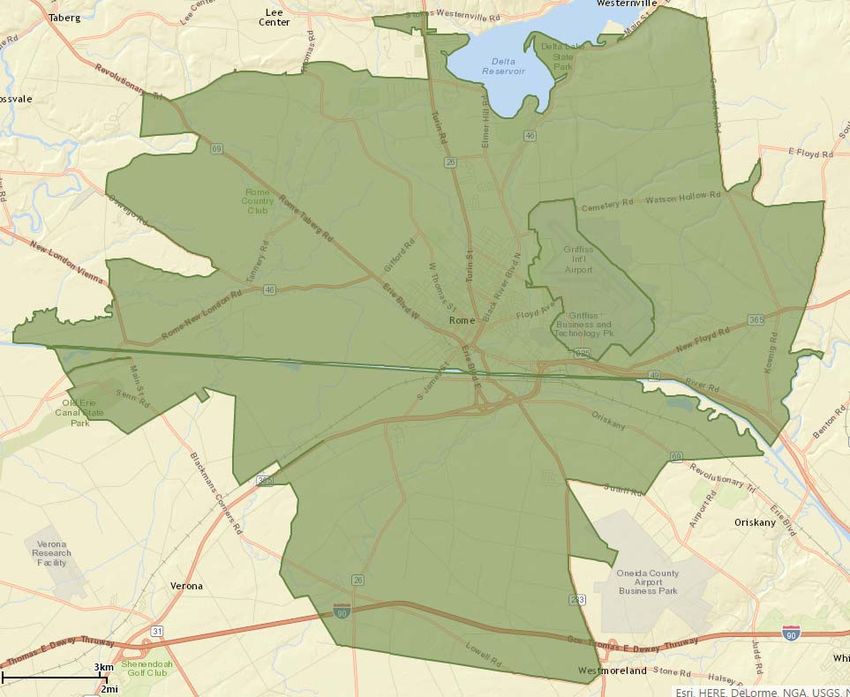
About Camoin Associates
Camoin Associates has provided economic development consulting services
to municipalities, economic development agencies, and private enterprises
since 1999. We specialize in real estate market analysis to evaluate the
feasibility and impacts of proposed projects. Through the services offered,
Camoin Associates has had the opportunity to serve EDOs and local and state
governments from Maine to California; corporations and organizations that
include Lowes Home Improvement, FedEx, Volvo (Nova Bus) and the New
York Islanders; as well as private developers proposing projects in excess of
$600 million. Our reputation for detailed, place-specific, and accurate analysis
has led to projects in 27 states and garnered attention from national media
outlets including Marketplace (NPR), Forbes magazine, and The Wall Street
Journal. Additionally, our marketing strategies have helped our clients gain
both national and local media coverage for their projects in order to build
public support and leverage additional funding. The firm currently has offices
in Saratoga Springs, NY; Portland, ME; and Brattleboro, VT. To learn more
about our experience and projects in all of our service lines, please visit our
website at www.camoinassociates.com. You can also find us on Twitter
@camoinassociate and on Facebook.

The Project Team
Michael N’dolo
Vice Principal, Project Principal
Dan Stevens
Economic Development Analyst, Project Manager
Alexandra Tranmer
Economic Development Analyst, Project Staff
Dina DeCarlo
Economic Development Analyst, Project Staff

Table of Contents

Executive Summary ........................................................................................................................................................................................... 1
Introduction ....................................................................................................................................................................................................... 6
Socioeconomic Profile and Trends ............................................................................................................................................................ 10
General Economic Outlook ..........................................................................................................................................................................16
Residential .........................................................................................................................................................................................................19
Retail....................................................................................................................................................................................................................31
Office ...................................................................................................................................................................................................................51
Industrial & Flex .............................................................................................................................................................................................. 62

               Camoin Associates | Erie Blvd BOA Market Analysis: Rome, NY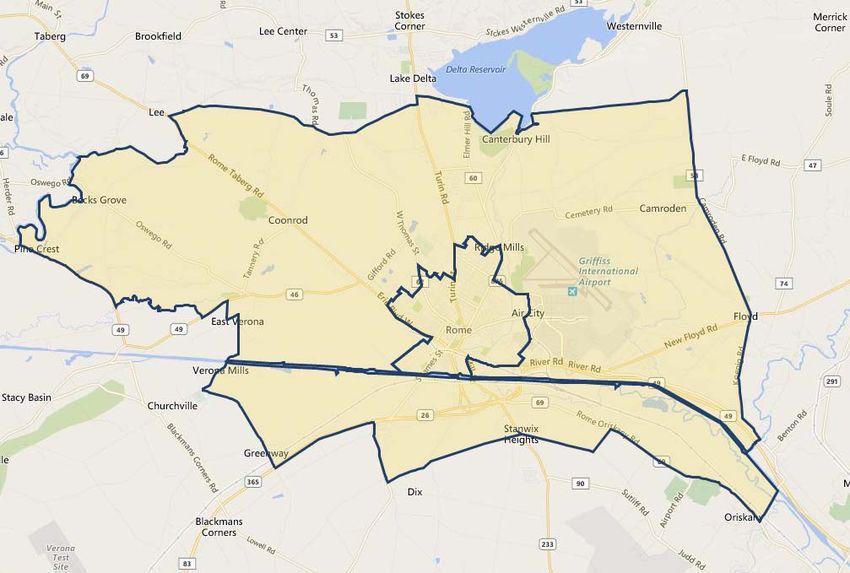
Executive Summary
As a sub consultant to Bergmann Associates, Camoin Associates conducted a real estate market analysis for the Erie
Boulevard Brownfield Opportunity Area (BOA) in the City of Rome, NY. The analysis considered the residential, retail,
office, and industrial markets to identify key trends and opportunities in the BOA and city. The key findings of the
analysis are discussed below, organized by each over-arching use type.
Residential
Housing is affordable, but quality is lacking. Housing prices are relatively affordable for the state and for
the region, contributing to the region’s overall affordable standard of living. Although prices have remained
stable, this also means that home values have not greatly appreciated over the last decade, limiting real
estate growth. In the City of Rome, the average cost of living is approximately $49,000, 24% less than the
State of New York average cost of living.
There is current and expected future demand for more modern housing in Rome, especially
downtown. The housing market has been fairly stagnant for a number of years in the city and projections
indicate income levels and population will not increase in any significant manner that would change the
housing market; however, there are three factors that are likely to drive demand for new housing in the
future.
o New Demand from Marcy Nanotech workers. The Marcy Nanocenter project will have a
transformative effect on the local housing market as it will attract hundreds of high-wage workers
looking for upscale modern housing units. These workers are generally expected to be younger
professionals with a preference for high-end apartments in downtown locations and areas walkable
to various amenities such as restaurants and entertainment options. While Utica is the closest urban
market to the project, Rome is well within commuting distance to the Nanocenter, and has the
potential to capture a significant share of this new housing demand.
o Pent-up Demand from local residents and workers. The existing housing stock does not align
with current housing preferences and needs. The Utica/Rome market has a “backlog” of demand for
more modern apartment units. In just the past few years this market demand has been
demonstrated as developers of high-end apartments in Utica have found strong demand and the
ability to achieve premium price points. More recent high-end apartment projects in Rome have
shown that the demand backlog for this type of housing extends to the Rome market. This comes
after years of little to no growth in the city’s apartment inventory, which has led to the “pent-up”
demand.
It should be noted specifically, that there is an opportunity for Rome to capture high-tech workers
(present and future) at Griffiss Business & Technology Park, many of whom do not live in Rome due
to the lack of modern housing and entertainment options.
o Replacement demand of old and obsolete housing. The City’s housing stock is old and
continuing to grow more obsolete. Nearly half of the city’s housing was built prior to 1950 while in
the BOA itself over half of the homes are greater than 75 years old. Only about 5% of housing in the
city was built after 1990. As homes continue to age they become more obsolete and less desirable.
Additionally, these types of homes that have the greatest upkeep and renovation needs are owned
by those least able to afford those kinds of improvements. The continued aging of the housing
stock will therefore increase demand for newer housing.
Mid- to upper-scale apartments will have greatest demand. The greatest demand for housing will be for
apartments with mid-level to upscale finishes and fixtures that are found in the downtown area and other
Camoin Associates | Erie Blvd BOA Market Analysis: Rome, NY 1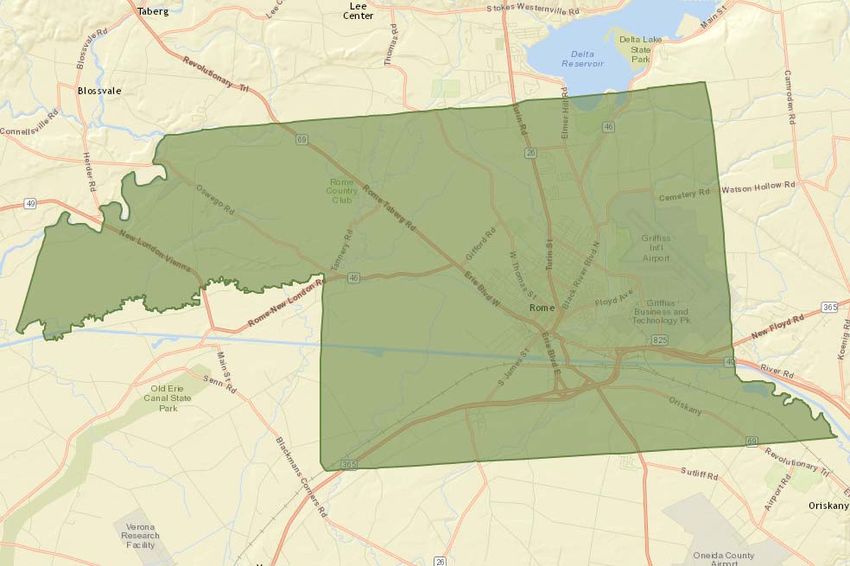
places walkable to shops and entertainment options. The primary driver of this demand, indicated above, is
the Marcy Nanotech development. Past experience with GlobalFoundries in Saratoga County has shown that
these types of workers look for modern, high-quality rental and are willing to pay a premium for these types
of units. Achievable rental rates are likely to be up to $2,000 per month for an upscale 2-bedroom unit,
although demand is anticipated for more mid-range units as well (in the roughly $1,200 to $1,500 per
month range for a 2-bedroom unit). The owner-occupied market is less likely to be impacted significantly in
the near future, but will strengthen as workers start to put down roots in the area.
Demand for apartments will also be driven by shifting preferences, especially among young professionals
and baby boomers. Young professionals increasingly prefer rental units in downtown areas rich in amenities.
This preference is driven, in part, by trends in waiting longer to get married and having children, difficulty in
getting mortgages and making a down payment, and more mobility overall.
Some townhouse demand also expected. Following apartments, townhouses are likely to see future
demand from the age 55+ cohort and young professionals. Two-story townhouses are likely to be in
demand by young professionals, while those in the 55+ group will have a greater preference for single story
units. Interviews suggested that townhouses in the $100 to $110 per square foot range would be feasible
(about $250,000 on average).
New entertainment options needed downtown to support residential market. According to market
analysis interviews, Rome’s lack of nightlife and entertainment options is a detriment to the downtown
housing market. For example, many of the engineers that work at Griffiss Business & Technology Park live in
Syracuse for this reason. To capture new residents downtown, including future Marcy Nanotech workers,
new entertainment options will be needed including music venues, bars, and restaurants. Additionally, year
round events would help promote downtown as a vibrant location that is attractive to live.
New age 55+ housing units will be needed. There is both current unmet demand and future demand for
age 55+ housing including higher-end apartment units that are walkable to shops and amenities.
Independent living units, including senior apartments, are also likely to be in demand. This specific housing
demand will be driven by a 10% increase in individuals ages 65+ in the City of Rome in the coming five
years.
Retail
Rome’s retail market has been flat. Both the city and BOA retail markets have been quiet with no
construction and no substantial trends, either positive or negative.
o No retail construction. The Greater Rome market has not seen any new retail construction since
2008, according to CoStar.
o Year-to-year fluctuations in net absorption but no clear trend. Net absorption of retail space in
the city has not been consistent. From 2011 through 2015, net absorption totaled 85,128 square
feet, but net absorption was negative 5,630 square feet.
o Vacancy and lease rates stable. Vacancy rates have hovered around 5% since 2012 and the
Greater Rome market has about 187,000 square feet of vacant retail space available. Note that the
BOA has low vacancy rates, but that does not necessarily indicate potential. Lease rates in the city
have generally been in the $8 to $9 per square foot range since 2009, although 2015 saw a modest
increase in average rates to $9.40.
Camoin Associates | Erie Blvd BOA Market Analysis: Rome, NY 2
Current consumer base demographics and spending patterns generally unfavorable for new retail
development. The median household income in the city is only $41,600 compared to $50,400 in Oneida
County and $58,000 in New York State. Both the BOA and city fall below the national average when it comes
to consumer spending on the Spending Potential Index (SPI). In no retail category does spending exceed
the national average of 100 in the City or Local Trade Area. Based on the market tapestry segmentation
analysis, the Local Trade Area, and much of Rome, is comprised of new, young families who earn incomes
below the national average, are budget conscience, and loyal to national chain retail stores.
Market segments may be opportunity for select retailers. The age cohort 65-74 year olds will continue
to grow over the next five years in the Local Trade Area and the City of Rome. Retail establishments that
serve this population will likely be in demand. Another large segment of the population is made up of 25-34
year olds. The market tapestry segmentation analysis for the Local Trade Area, and much of Rome, shows
that the region is made up of young families who earn incomes below the national average, are budget
conscience, and loyal to national chain retail stores. Based on these factors, retail development in the Local
Trade Area will likely be challenging, but could work if the retailer focused in on this particular subset of the
population. Additionally, the top four income segments, ranging $75,000-$200,000, are all anticipated to
grow over the next five years in the city.
The City is experiencing sales “leakage” in select retail categories and new businesses appear to be
feasible. The retail gap analysis, which measures how much spending by residents occurs outside of the
city, found that residents are leaving the city (or going online) to shop at businesses in several categories.
The retail categories with retail leakage are shown below with the number of potential businesses that could
be supported in each category indicated in parentheses.
Electronics & Appliance Stores1 (0) Other Misc. Retailers (1)
Full-Service Restaurants (2) Shoe Stores (1)
Clothing Stores (2) Used Merchandise (1)
Specialty Food Stores (1) Lawn & Garden Equipment (1)
Jewelry, Luggage & Leather Goods Health & Personal Care Stores (0)
Stores (1)
Book, Periodical & Music Stores (0)
Home Furnishings Stores (1)
Special Food Services (0)
Marcy Nanotech likely to have transformative impact on market. Based on current spending in the local
trade area and the City of Rome, there are minimal opportunities for additional retail stores. However, one
major future opportunity surrounds the building of the Marcy Nanocenter in Utica, NY. The 1,000-2,000 jobs
that are anticipated to accompany the plant will likely be high paying jobs, and individuals will seek out
entertainment and recreation options in the area. If Rome can harness its downtown composition into a
mixed-use retail/residential space with the appropriate retail mix, Rome could draw regional patronage.
Mixed-use style retail has greatest potential. Mixed-use style buildings and developments are more
market feasible than standalone retail options because of the potential for a built-in customer base with
residents on upper floors or in adjacent buildings, and the potential for creating more vibrant areas,
especially in the downtown area.
1
Electronics & Appliance Stores have significant leakage because online retailers have come to dominate this category. For this reason, we not
expect there to be any potential for “brick and mortar” businesses in this category.
Camoin Associates | Erie Blvd BOA Market Analysis: Rome, NY 3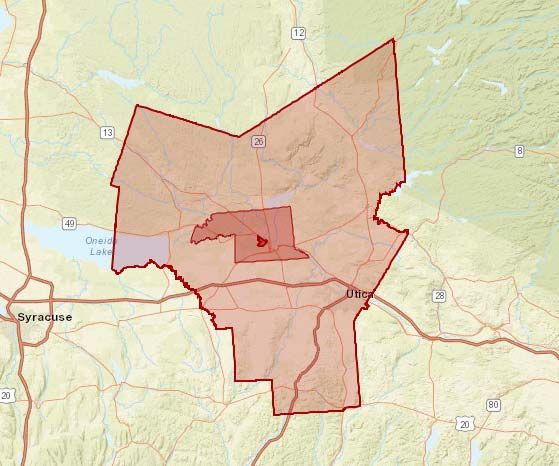
Office
Overall office market outlook is weak. Office utilizing jobs are not expected to drive demand for office
space in Oneida County or the Rome region. Both geographies are expected to lose a combined 452 office
jobs, resulting in negative absorption of regional office space. There have been no office buildings added to
the market since 2012, and while vacancy rates are low, the poor demand outlook means that the vacant
space will be able to absorb most, if not all office space needs.
Additionally, office rental rates fell by 15-20% due to the recession and have yet to rebound to their pre-
recession levels, indicating weakness in demand.
Potential exists for specialized office products. While the overall office market outlook is poor, there are
two sub-markets that appear to have some market feasibility: medical office space and short-term office
space.
o Medical office feasibility. Growth is expected in medical professions that would require office
space. A companion study, completed as part of the Downtown Rome BOA Step 3 planning effort,
found that a mid-scale multi-tenant clinic has market feasibility in downtown Rome due to expected
industry growth, an aging population, unmet health service needs, and a lack of modern medical
office space in the city.
o Short-term office space. The Marcy Nanotech project is expected to generate demand for short-
term office space (i.e, leases for less than one year) that is fully furnished and equipped with the
basics. GlobalFoundries in Saratoga County was a similar development that created demand for this
type of space, which was in short supply in the market. This kind of office space, coupled with short-
term apartments or lodging may be a successful niche product type.
Industrial & Flex
There is currently an excess of industrial property on the market. Vacancy rates for industrial space are
over 11% in Oneida County and Greater Rome. Prior to the recession, vacancy rates were generally in the
7% to 8% range in the Greater Rome market, where there is now about 590,000 square feet of vacant
industrial space. Oneida County has nearly 2.7 million square feet of vacant space in total. There has been
no new industrial construction in Greater Rome since 2009.
Demand for industrial space has been weak. Between 2007 and 2015 the Greater Rome market
experienced a net absorption of 350,000 square feet of space as industrial users left the area or closed.
Warehouse space was the biggest “loser” with a net absorption during this time of 270,000 square feet. Net
absorption of manufacturing space was negative 78,000 square feet. “Service” and “Distribution” were the
only industrial categories to see positive net absorption, although it was minor.
Flex space is in short supply. According to CoStar data, flex space (i.e., a mix of office and light industrial)
has low vacancy rates in Greater Rome and Oneida County at under 1% and 3.2%, respectively. Net
absorption of flex space, however, has been relatively minor with only 13,250 square feet absorbed in
Greater Rome since 2013. The data suggests that the market may be able to support new flex building in
the next few years.
Regional industrial growth expected in select sectors. The demand outlook in the region is strongest for
Transit and Ground Passenger Transportation. The industry is expected to gain 130 jobs in the next 10 years.
There are also potential opportunities within the Electrical Equipment, Appliance, and Component
Manufacturing and Food Manufacturing industries, which are expected to grow. Computer and Electronic
Camoin Associates | Erie Blvd BOA Market Analysis: Rome, NY 4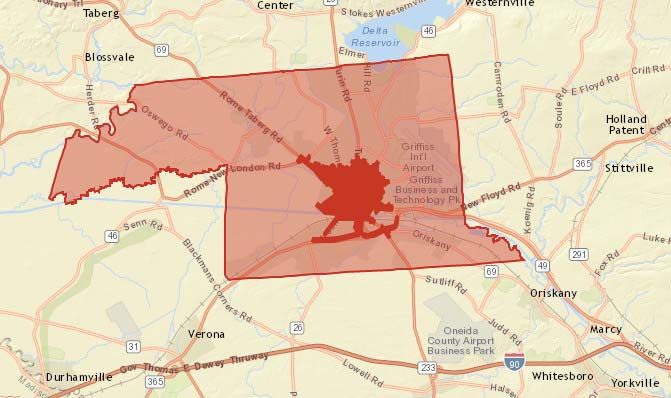
Product Manufacturing, Wood Product Manufacturing and Apparel Manufacturing are three other
manufacturing sectors that are also expected to grow.
Industrial and flex space demand likely to be absorbed by Griffiss or outside of Rome. Griffiss is well
positioned to absorb industrial demand in the near future as it caters specifically to those industries
expected to grow in the region. Furthermore, traditional industrial users, especially for warehousing and
distribution, are unlikely to locate in the city – choosing instead locations closer to the NYS Thruway and
where land is very cheap.
Marcy unlikely to generate much new demand for industrial or flex space in Rome. A companion
analysis completed as part of the Downtown Rome BOA Step 3 project explored the potential demand
generated for industrial and other spaces as a result of the Marcy project. The report found that due to the
heavily globalized supply chain of semiconductor manufacturing coupled with the need for “spinoff”
industrial users to be in close proximity to the facility itself, little demand for industrial space would be exist
in Rome. Any demand that did exist would likely be captured at Griffiss.
Camoin Associates | Erie Blvd BOA Market Analysis: Rome, NY 5
Introduction
As a sub consultant to Bergmann Associates, Camoin Associates conducted a real estate market analysis for the Erie
Boulevard Brownfield Opportunity Area (BOA) in the City of Rome, NY. The following market analysis consists of the
following interrelated studies:
Demographic & Socioeconomic Analysis
General Economic Outlook
Residential Market Analysis
Retail Market Analysis
Office Market Analysis
Industrial & Flex Market Analysis
Data Sources
Much of the data in this report were purchased from ESRI Business Analyst Online (ESRI) and Economic Modeling
Specialists, Inc. (EMSI). ESRI’s base data is the 2000 and 2010 Census. It uses proprietary statistical models and
updated data from the U.S. Census Bureau, the U.S. Postal Service, and various other sources to project future
trends. ESRI data is often used for economic development, marketing, site selection, and strategic decision making.
For more information, visit www.esri.com.
EMSI data are compiled from several sources, including the U.S. Census Bureau and U.S. Departments of Health and
Labor using specialized proprietary processes and models to estimate current statistics and predict future trends.
Visit www.economicmodeling.com for additional information.
CoStar data was also purchased for Oneida County. CoStar data provides detailed building-level data for all
commercial and multi-family properties in the market. It aggregates data to track trends in construction, net
absorption, inventory, lease rates, vacancy rates, and other key details.
In addition to gathering statistical data, Camoin Associates spoke with local experts to gain information on the
economic and market trends occurring within the city and region.
Geographies
The maps on the following pages show the areas used as comparison geographies throughout different sections of
the following report. Comparing the BOA area to the surrounding region allows for a greater understanding for
market realities and provides context for any trends at the local level.
Camoin Associates | Erie Blvd BOA Market Analysis: Rome, NY 6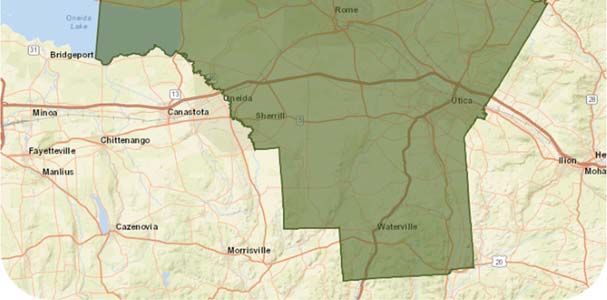
Erie Boulevard Brownfield Opportunity Area (BOA)

Local Trade Area
The Local Trade Area is a 5-minute drive time from the center of Rome. This area covers the area where city
residents would typically get their essential items like groceries, self-care items, and gasoline.

        Camoin Associates | Erie Blvd BOA Market Analysis: Rome, NY                                           7
City of Rome
Rome Zip Code Area (Zip codes 13441 & 13440)
The area depicted in green aligns with the zip codes 13441 and 13440. Industry data provided by EMSI is presented
at the zip code level and these two zip codes best represent the Rome region we are seeking to understand.
Camoin Associates | Erie Blvd BOA Market Analysis: Rome, NY 8Greater Rome
This area was used with real estate data provider, CoStar, which provides details on the supply side of residential,
retail, office, and industrial space.
Oneida County
Camoin Associates | Erie Blvd BOA Market Analysis: Rome, NY 9Socioeconomic Profile and Trends
General demographic and socioeconomic data were reviewed to gain an understanding of past trends, existing
conditions and future projections for the BOA area, Local Trade Area, City of Rome, Oneida County and New York
State.
Key Findings
Important findings of the socioeconomic analysis include:
Historic population data shows that the BOA, the Local Trade Area and the City of Rome lost population in
the last five years, 2010-2015, but Oneida County and the New York State grew in population.
While New York State will experience population growth in the coming four years, the BOA, the Local Trade
Area and the City of Rome do not show the same growth pattern, and instead will shed residents between
2015 and 2020.
Growth in median household income in the City will outpace income growth in the county.
Rome exceeds the BOA and the Local Trade Area in the percentage of the population is 65 and over, which
should bring attention to the specialty services that these cohorts currently need and will desire in the
future.
Incomes in the City of Rome are shifting from lower to higher income brackets over the course of the next
five years.
Basic Demographic Trends
The following table summarizes typical demographic and socioeconomic indicators for the BOA area, Local Trade
Area, City of Rome, Oneida County and the State of New York.
Of these geographies, the BOA, Local Trade Area and the City of Rome are expected to see their populations shrink
in the coming four years. However, the projected degree of population loss will be less than in the previous five
years, 2010-2015.
The greatest degree of negative change is projected in the Local Trade Area, where the population will decrease by
250 residents, or -1.7%. This loss is a slight rebound from loss experienced in the previous five years, 2010-2015,
when the Local Trade area lost nearly 430 residents, a population decrease of almost -3%.
The BOA region will shed 16 residents between 2015 and 2020, while the City of Rome is expected to lose around
160 residents, a slight total population loss of -0.5%. Conversely, Oneida County will experience a population
increase of over 1,200 residents, a gain of 0.5%, in the same timeframe. Overall, New York State will experience the
largest percentage of population growth, 2.1%, or an increase of over 415,000 residents.
Reflecting the decrease in population, households appear to be declining in the BOA. The number of households
decreased by ten in the last five years, and the BOA is expected to lose another seven by 2020. Loss of households
in the Local Trade Area will be curbed in the coming four years, decreasing by 96, compared to a loss of nearly 140
households in the last five years. The City of Rome will lose more households in the coming four years, compared to
the previous five years, with a projected decrease of 36 households between 2015 and 2020, while total households
decrease by 24 2010-2015.
During 2010-2015, household formation outpaced actual population growth in Oneida County, which could indicate
a few things. First, an increase of divorces during this time could lead to an increase in household formation, as well
as adult children moving out from parents’ or relatives’ households to create their own. Household formation will
Camoin Associates | Erie Blvd BOA Market Analysis: Rome, NY 10slow in the coming five years though in the county, adding 720 households by 2020. New York State will experience
consistent household growth, growing by 2.2% during 2010-2015 and adding another 2.3% in the next four years.
Average household size decreased in all geographies except for the BOA. The BOA saw a nominal increase in
average household size in the last five years, growing from 2.52 to 2.53. Household size will gain another .01 by
2020, bringing the average household size to 2.54. The BOA’s average household size is the second largest when
compared to the other geographies, following New York State, which had an average household size of 2.56 in
2015. Households in other geographies range from 2.28 to 2.36.
Owner occupied housing units in the BOA have trended downward in the last five years and will continue to
decrease in the coming five years. Between 2010-2015, owner occupied housing units decreased by 13 and will
decrease by another eight units by 2020. The Local Trade Area, the City of Rome and Oneida County also
experienced loss in owner occupied housing units between 2010 and 2015. The Local Trade Area and the City of
Rome will continue to loss owner occupied units in the next five years, while Oneida County will turn around and
increase owner occupied units by 33. However, this growth is less than the loss of the previous five years, 51 housing
units.
Growth in renter occupied units was consistent across all geographies in the last five years. The BOA added three
rental units, and is projected to add one more by 2020. Percentage growth in the Local Trade Area was nominal
2010-2015, but still showed an increase of 14 units. Growth will be curbed in the next five years, as the Local Trade
Area will lose four rental occupied units. Oneida County added the greatest percentage of units over the last five
years, 5%, totaling nearly 1,500 units. Rental units will continue to grow over 2015-2020, however at a slower rate,
2.1%, or 687 units.
In 2015, Oneida County had the highest median age among the geographies at 41.7. The BOA and the Local Trade
Area were tied for the lowest median age, 37.9. The BOA is the only geography that will see the median age
decrease in the next five years. New York State will see the largest increase in median age, jumping from 38.7 in
2015 to 39.5 in 2020.
Camoin Associates | Erie Blvd BOA Market Analysis: Rome, NY 11Basic Demographic Trends
Basic Demographics
Population
# Change 2010- % Change # Change 2015- % Change 2015-
2010 2015 2020
2015 2010 - 2015 2020 2020
BOA 1,037 1,014 998 -23 -2% -16 -1.6%
Local Trade Area 15,020 14,592 14,342 -428 -3% -250 -1.7%
City of Rome 33,725 33,277 33,118 -448 -1% -159 -0.5%
Oneida County 234,878 235,973 237,178 1,095 0% 1,205 0.5%
NYS 19,378,102 19,704,032 20,119,871 325,930 2% 415,839 2.1%
Households
# Change 2010- % Change # Change 2015- % Change 2015-
2010 2015 2020
2015 2010 - 2015 2020 2020
BOA 407 397 390 -10 -2% -7 -1.8%
Local Trade Area 6,401 6,263 6,167 -138 -2% -96 -1.5%
City of Rome 13,526 13,502 13,466 -24 0% -36 -0.3%
Oneida County 93,028 94,473 95,193 1,445 2% 720 0.8%
NYS 7,317,755 7,476,368 7,650,474 158,613 2% 174,106 2.3%
Average Household Size
# Change 2010- % Change # Change 2015- % Change 2015-
2010 2015 2020
2015 2010 - 2015 2020 2020
BOA 2.52 2.53 2.54 0.01 0.4% 0.01 0.4%
Local Trade Area 2.29 2.28 2.27 -0.01 -0.4% -0.01 -0.4%
City of Rome 2.28 2.26 2.25 -0.02 -0.9% -0.01 -0.4%
Oneida County 2.38 2.36 2.36 -0.02 -0.8% 0.00 0.0%
NYS 2.57 2.56 2.55 -0.01 -0.4% -0.01 -0.4%
Owner Occupied Housing Units
# Change 2010- % Change # Change 2015- % Change 2015-
2010 2015 2020
2015 2010 - 2015 2020 2020
BOA 229 216 208 -13 -6% -8 -3.7%
Local Trade Area 2,906 2,754 2,662 -152 -5% -92 -3.3%
City of Rome 7,774 7,586 7,464 -188 -2% -122 -1.6%
Oneida County 62,006 61,955 61,988 -51 0% 33 0.1%
NYS 3,897,837 3,905,258 3,943,122 7,421 0% 37,864 1.0%
Renter Occupied Housing Units
# Change 2010- % Change # Change 2015- % Change 2015-
2010 2015 2020
2015 2010 - 2015 2020 2020
BOA 178 181 182 3 2% 1 0.6%
Local Trade Area 3,495 3,509 3,505 14 0% -4 -0.1%
City of Rome 5,752 5,916 6,002 164 3% 86 1.5%
Oneida County 31,022 32,518 33,205 1,496 5% 687 2.1%
NYS 3,419,918 3,571,110 3,707,352 151,192 4% 136,242 3.8%
Median Age
# Change 2010- % Change # Change 2015- % Change 2015-
2010 2015 2020
2015 2010 - 2015 2020 2020
BOA 38.1 37.9 37.4 -0.2 -1% -0.5 -1.3%
Local Trade Area 37 38 38 0.6 2% 0.5 1.3%
City of Rome 40.2 40.7 41.0 0.5 1% 0.3 0.7%
Oneida County 40.8 41.7 42.2 0.9 2% 0.5 1.2%
NYS 37.9 38.7 39.5 0.8 2% 0.8 2.1%
Source: ESRI
Camoin Associates | Erie Blvd BOA Market Analysis: Rome, NY 12Annual growth rate projections for the above indicators are summarized in the following table. The number of
households and owner occupied households are projected to decrease at a faster rate in the BOA than the other
comparison geographies, however, overall population decline in the Local Trade Area will slightly outpace decline in
the BOA. The City of Rome will experience minimal population loss over the next five years, shrinking by -0.5%.
Income in the City will grow at the second fastest rate of all geographies, at 10%, however, it still trails the income
growth in New York State as a whole, 15%.
Annual Projected Growth Rates from 2015 to 2020
Median HH
Population Households Owner HHs
Income
BOA -1.6% -1.8% -3.7% 6.3%
Local Trade Area -1.7% -1.5% -3.3% 9.4%
City of Rome -0.5% -0.3% -1.6% 10.1%
Oneida County 0.5% 0.8% 0.1% 8.8%
NYS 2.1% 2.3% 1.0% 15.0%
Source: ESRI
Median household incomes for 2015 and projected incomes for 2020 are shown below. The City of Rome is
anticipated to experience a 10% gain in household income, or an additional $4,198, over the next five years. In 2015,
the disparity between the BOA’s household income and the City of Rome’s household income was $4,822. New York
State’s overall household income will see the largest percentage gain of all geographies, 15%, or an additional
$8,718.
Median Household Income
2015 2020 # Change % Change
BOA $ 36,759 $ 39,086 $ 2,327 6.3%
Local Trade Area $ 34,270 $ 37,491 $ 3,221 9.4%
City of Rome $ 41,581 $ 45,779 $ 4,198 10.1%
Oneida County $ 50,361 $ 54,781 $ 4,420 8.8%
NYS $ 58,048 $ 66,766 $ 8,718 15.0%
Source: ESRI
Age Distribution
A population’s age distribution is an indicator for current and future demand of goods and services that cater to
specific age cohorts. The graph below shows current age distribution in the City of Rome, with trend lines indicating
how this compares to age distribution in the comparison geographies. The second graph hones in on the area
around the BOA itself for a clearer look at the local population distribution.
Two cohorts are tied for the largest percentage of residents in the City, 25-34 year olds and 45-54 year olds, both
comprising 14% of the total population. The cohort of 55-64 year olds follows close behind, making up 13% of the
population, while 35-44 year olds make up 12%. Both the BOA and the Local Trade Area contain slightly higher
percentages of young children and infants than the City of Rome. The BOA’s population stands out as having a
greater percentage of baby boomers, aged 55-64, than the city or the Local Trade Area. However, looking towards
older cohorts, Rome exceeds the BOA and the Local Trade Area in the percentage of the population that is 65 and
over. Understanding the services that these cohorts currently desire, and will need in the coming years, will better
prepare regions to support an aging population.
Camoin Associates | Erie Blvd BOA Market Analysis: Rome, NY 13Household Income Distribution The largest income cohort in the Local Trade Area is
the course of five years. Incomes appear to be on the rise in the Local Trade Area, with lower incomes brackets
shrinking and higher income brackets growing over 2015-2020.

The City of Rome has overall higher incomes than the Local Trade Area. In 2015, the largest income cohort in the
City was $50,000-$74,999. Like the Local Trade Area, incomes are projected to grow in the coming five years, with
the top four income brackets growing in size, while the bottom three income brackets are projected to shrink. The
segment that is projected to have the largest growth captures earners who make between $75,000 and $99,999,
gaining 3.5% of the population. The segment that is expected to lose the greatest percentage of earners is $15,000-
$24,999.

        Camoin Associates | Erie Blvd BOA Market Analysis: Rome, NY                                               15
General Economic Outlook
Key Findings
The Government sector currently accounts for the greatest proportion of Oneida County’s economy
although public employment is expected to decline slightly in the near future.
Health Care and Social Assistance currently ranks second in terms of jobs followed by retail trade. The
Health Care industry is projected to see significant growth while the retail sector is expected to decline over
the next five years.
Accommodation and Food Services as well as Professional, Scientific, and Technical Services are the only
other sectors expected to experience any significant growth.
Economic Base
The greatest proportion of the county’s jobs are in the Government sector, which employs 26,500 people and
provides earnings of nearly $2 billion annually. The government provides among the highest average earnings per
worker at nearly $75,000. Health Care and Social Assistances is the next largest sector with over 20,000 jobs or 19%
of the county’s jobs. Retail Trade ranks third with just over 11,000 jobs or 11% of all jobs in the county.
Oneida County - Economic Base
Average
Sector Jobs Earnings Jobs % Earnings %
Earnings
Government 26,506 $1,985,564,460 25% 35.6% $74,910
Health Care and Social Assistance 20,198 $928,259,684 19% 16.7% $45,958
Retail Trade 11,304 $345,857,184 11% 6.2% $30,596
Manufacturing 8,516 $542,843,904 8% 9.7% $63,744
Accommodation and Food Services 7,414 $130,664,336 7% 2.3% $17,624
Finance and Insurance 5,737 $391,234,715 5% 7.0% $68,195
Transportation and Warehousing 3,618 $184,434,786 3% 3.3% $50,977
Professional, Scientific, and Technical Services 3,428 $227,416,948 3% 4.1% $66,341
Educational Services 3,265 $131,798,255 3% 2.4% $40,367
Administrative and Support and Waste
Management and Remediation Services 3,111 $106,402,422 3% 1.9% $34,202
Other Services (except Public Administration) 2,945 $78,325,220 3% 1.4% $26,596
Construction 2,412 $135,207,072 2% 2.4% $56,056
Wholesale Trade 2,304 $135,290,880 2% 2.4% $58,720
Information 1,558 $80,816,576 1% 1.4% $51,872
Arts, Entertainment, and Recreation 1,332 $38,976,984 1% 0.7% $29,262
Management of Companies and Enterprises 665 $52,798,340 1% 0.9% $79,396
Real Estate and Rental and Leasing 612 $23,500,800 1% 0.4% $38,400
Crop and Animal Production 335 $8,957,900 0% 0.2% $26,740
Utilities 249 $34,459,608 0% 0.6% $138,392
Unclassified Industry 217 $5,166,119 0% 0.1% $23,807
Mining, Quarrying, and Oil and Gas Extraction 136 $6,056,624 0% 0.1% $44,534
Total 105,864 $5,574,032,817 $52,654
Source: EMSI
Camoin Associates | Erie Blvd BOA Market Analysis: Rome, NY 16Employment Growth
Employment growth in both Rome and Oneida County is expected to lag behind the rate in Upstate New York, New
York State as a whole, and the nation overall. Over the next ten years, Rome’s employment base is projected to
increase by 2.4%, adding 332 jobs. This exceeds the pace of job growth projected in Oneida County, which is only
1.1% over ten years.
Employment Growth Summary
Average
2015 Jobs 2025 Jobs Change % Change
Earnings
Rome Zip Code Area 13,991 14,323 332 2.4% $51,885
Oneida County 105,864 107,027 1,163 1.1% $52,531
Upstate New York 2,666,989 2,785,253 118,264 4.4% $57,673
NYS 9,247,504 10,099,882 852,378 9.2% $81,879
US 145,244,709 161,715,772 16,471,063 11.3% $63,246
Source: EMSI
Employment by Industry
The following table provides additional detail on the industries projected to grow in Oneida County. Health Care
and Social Assistance is projected to see the greatest increase in employment with 2,660 new jobs by 2025 – an
increase of 13%. Accommodation and Food Services ranks second in projected growth with 942 new jobs
anticipated over the next 10 years. Several sectors will see significant declines including Government, Retail Trade,
Manufacturing, Finance and Insurance, and Information.
Oneida County Projected Employment Change by Industry
NAICS %
Description 2015 Jobs 2025 Jobs Change
Code Change
90 Government 26,506 25,664 (842) -3%
62 Health Care and Social Assistance 20,198 22,858 2,660 13%
44 Retail Trade 11,304 10,812 (492) -4%
31 Manufacturing 8,516 7,980 (536) -6%
72 Accommodation and Food Services 7,414 8,356 942 13%
52 Finance and Insurance 5,737 5,223 (514) -9%
48 Transportation and Warehousing 3,618 3,532 (86) -2%
54 Professional, Scientific, and Technical Services 3,428 3,728 300 9%
61 Educational Services 3,265 3,365 100 3%
56 Administrative and Support and Waste Management a 3,111 3,126 15 0%
81 Other Services (except Public Administration) 2,945 2,989 44 1%
23 Construction 2,412 2,385 (27) -1%
42 Wholesale Trade 2,304 2,268 (36) -2%
51 Information 1,558 1,103 (455) -29%
71 Arts, Entertainment, and Recreation 1,332 1,449 117 9%
55 Management of Companies and Enterprises 665 633 (32) -5%
53 Real Estate and Rental and Leasing 612 481 (131) -21%
11 Crop and Animal Production 335 317 (18) -5%
22 Utilities 249 310 61 24%
99 Unclassified Industry 217 302 85 39%
21 Mining, Quarrying, and Oil and Gas Extraction 136 147 11 8%
Total 105,864 107,027 1,163 1.0%
Source: EMSI
Camoin Associates | Erie Blvd BOA Market Analysis: Rome, NY 17Unemployment by Industry
The following table shows the industries with the highest levels of unemployment (as of February 2016). The
greatest unemployment figures are in the Government, Accommodation and Food Services, and Retail Trade
sectors. While the overall unemployment rate in the county is 4.5%, some industries have especially high rates
including Arts, Entertainment, and Recreation; Construction (although the season impacts this rate); and Mining,
Quarrying, and Oil and Gas Extraction.
Oneida County Unemployment by Industry
Estimated
NAICS 2016 February 2016 % of Regional
Description Unemployment
Code Jobs Unemployment Unemployment
Rate
90 Government 26,380 686 2.5% 14%
72 Accommodation and Food Services 7,865 638 7.5% 13%
99 No Previous Work Experience/Unspecified 228 601 72.5% 12%
44 Retail Trade 11,123 564 4.8% 11%
31 Manufacturing 8,658 381 4.2% 8%
23 Construction 2,384 350 12.8% 7%
62 Health Care and Social Assistance 20,707 343 1.6% 7%
Administrative and Support and Waste
56 Management and Remediation Services 3,117 318 9.3% 6%
71 Arts, Entertainment, and Recreation 1,268 215 14.5% 4%
52 Finance and Insurance 5,732 193 3.3% 4%
48 Transportation and Warehousing 3,675 155 4.0% 3%
54 Professional, Scientific, and Technical Services 3,472 130 3.6% 3%
81 Other Services (except Public Administration) 2,930 130 4.2% 3%
51 Information 1,563 74 4.5% 1%
21 Mining, Quarrying, and Oil and Gas Extraction 152 72 32.1% 1%
42 Wholesale Trade 2,288 69 2.9% 1%
61 Educational Services 3,135 67 2.1% 1%
53 Real Estate and Rental and Leasing 606 28 4.4% 1%
11 Crop and Animal Production 338 16 4.5% 0%
55 Management of Companies and Enterprises 651 5 0.8% 0%
22 Utilities 258 2 0.8% 0%
Total 106,530 5,037 4.5%
Source: EMSI
Camoin Associates | Erie Blvd BOA Market Analysis: Rome, NY 18Residential
The residential market analysis compares existing conditions and projected trends in residential development in the
BOA, City of Rome, and county. The multi-family residential market compares the BOA, the Greater Rome region
and the county. This analysis will help to identify potential development types that will serve currently unmet needs
in the City of Rome area, as well as be feasible under current real estate market conditions.
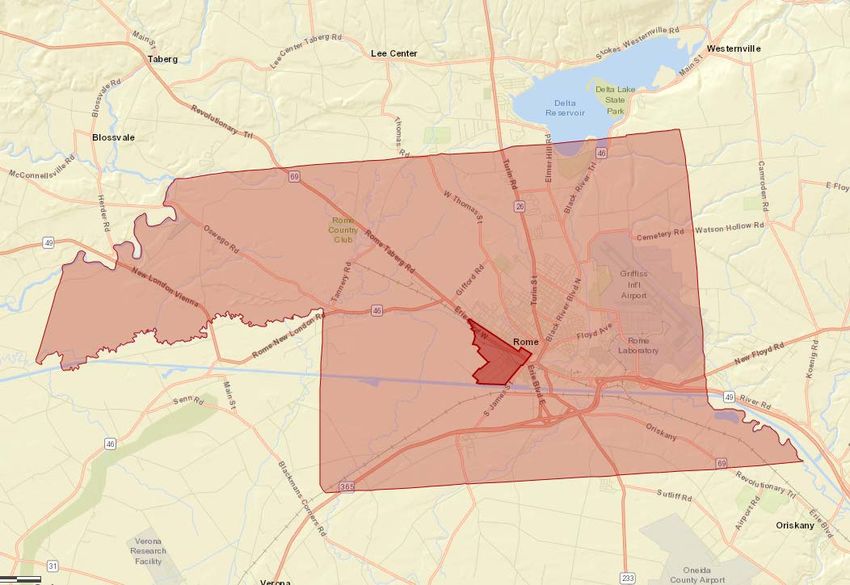
BOA Site (darker shading) within the City of Rome (lighter shading)
Oneida County, encompassing City of Rome and the BOA
Camoin Associates | Erie Blvd BOA Market Analysis: Rome, NY 19Takeaway Findings
Housing is affordable, but quality is lacking. Housing prices are relatively affordable for the state and for
the region, contributing to the region’s overall affordable standard of living. Although prices have remained
stable, this also means that home values have not greatly appreciated over the last decade, limiting real
estate growth. In the City of Rome, the average cost of living is approximately $49,000, 24% less than the
State of New York average cost of living.
There is current and expected future demand for more modern housing in Rome, especially
downtown. The housing market has been fairly stagnant for a number of years in the city and projections
indicate income levels and population will not increase in any significant manner that would change the
housing market; however, there are three factors that are likely to drive demand for new housing in the
future.
o New Demand from Marcy Nanotech workers. The Marcy Nanocenter project will have a
transformative effect on the local housing market as it will attract hundreds of high-wage workers
looking for upscale modern housing units. These workers are generally expected to be younger
professionals with a preference for high-end apartments in downtown locations and areas walkable
to various amenities such as restaurants and entertainment options. While Utica is the closest urban
market to the project, Rome is well within commuting distance to the Nanocenter, and has the
potential to capture a significant share of this new housing demand.
o Pent-up Demand from local residents and workers. The existing housing stock does not align
with current housing preferences and needs. The Utica/Rome market has a “backlog” of demand for
more modern apartment units. In just the past few years this market demand has been
demonstrated as developers of high-end apartments in Utica have found strong demand and the
ability to achieve premium price points. More recent high-end apartment projects in Rome have
shown that the demand backlog for this type of housing extends to the Rome market. This comes
after years of little to no growth in the city’s apartment inventory, which has led to the “pent-up”
demand.
It should be noted specifically, that there is an opportunity for Rome to capture high-tech workers
(present and future) at Griffiss Business & Technology Park, many of whom do not live in Rome due
to the lack of modern housing and entertainment options.
o Replacement demand of old and obsolete housing. The City’s housing stock is old and
continuing to grow more obsolete. Nearly half of the city’s housing was built prior to 1950 while in
the BOA itself over half of the homes are greater than 75 years old. Only about 5% of housing in the
city was built after 1990. As homes continue to age they become more obsolete and less desirable.
Additionally, these types of homes that have the greatest upkeep and renovation needs are owned
by those least able to afford those kinds of improvements. The continued aging of the housing
stock will therefore increase demand for newer housing.
Mid- to upper-scale apartments will have greatest demand. The greatest demand for housing will be for
apartments with mid-level to upscale finishes and fixtures that are found in the downtown area and other
places walkable to shops and entertainment options. The primary driver of this demand, indicated above, is
the Marcy Nanotech development. Past experience with GlobalFoundries in Saratoga County has shown that
these types of workers look for modern, high-quality rental and are willing to pay a premium for these types
of units. Achievable rental rates are likely to be up to $2,000 per month for an upscale 2-bedroom unit,
although demand is anticipated for more mid-range units as well (in the roughly $1,200 to $1,500 per
Camoin Associates | Erie Blvd BOA Market Analysis: Rome, NY 20month range for a 2-bedroom unit). The owner-occupied market is less likely to be impacted significantly in
the near future, but will strengthen as workers start to put down roots in the area.
Demand for apartments will also be driven by shifting preferences, especially among young professionals
and baby boomers. Young professionals increasingly prefer rental units in downtown areas rich in amenities.
This preference is driven, in part, by trends in waiting longer to get married and having children, difficulty in
getting mortgages and making a down payment, and more mobility overall.
Some townhouse demand also expected. Following apartments, townhouses are likely to see future
demand from the age 55+ cohort and young professionals. Two-story townhouses are likely to be in
demand by young professionals, while those in the 55+ group will have a greater preference for single story
units. Interviews suggested that townhouses in the $100 to $110 per square foot range would be feasible
(about $250,000 on average).
New entertainment options needed downtown to support residential market. According to market
analysis interviews, Rome’s lack of nightlife and entertainment options is a detriment to the downtown
housing market. For example, many of the engineers that work at Griffiss Business & Technology Park live in
Syracuse for this reason. To capture new residents downtown, including future Marcy Nanotech workers,
new entertainment options will be needed including music venues, bars, and restaurants. Additionally, year
round events would help promote downtown as a vibrant location that is attractive to live.
New age 55+ housing units will be needed. There is both current unmet demand and future demand for
age 55+ housing including higher-end apartment units that are walkable to shops and amenities.
Independent living units, including senior apartments, are also likely to be in demand. This specific housing
demand will be driven by a 10% increase in individuals ages 65+ in the City of Rome in the coming five
years.
Housing Stock Trends and Conditions
The Rome housing market can be categorized as stable, based on the constancy of home prices over the last
decade, even in times of national economic fluctuation. Fortune Builder reports that as of 2015, just over half of all
Rome homeowners had lived in their current properties for at least five years, reaching above the 39% of New York
State residents that can say the same.
Housing prices are relatively affordable for the state and for the region, contributing to the region’s overall
affordable standard of living. The average cost of living is approximately $49,000/year, 24% less than the New York
average cost of living.2 As of Summer 2015, the average home sales price in Rome was $111,641, falling greatly
below the New York State average of $532,891 and the national average sales price $307,586. Although prices have
remained stable, this also means that home values have not greatly appreciated over the last decade, limiting real
estate growth.
Based on the latest data from the real estate database RealtyTrac, there are currently 302 properties in Rome that
are considered to be in distress (this includes properties in default, that are being auctioned or that are bank
owned), 189 homes for sale on the market and another 238 that were recently sold. RealtyTrac also reports that
home sales during March 2016 were up by a third compared to the previous month, and up 300% compared to
2
Rome, NY Real Estate Market, http://www.fortunebuilders.com/rome-real-estate-and-market-trends/
Camoin Associates | Erie Blvd BOA Market Analysis: Rome, NY 21March of 2015.3 A search on Zillow.com shows that the highest listing in Rome currently sits at $495,000, while the
lowest are those properties up for auction, starting at $500. Houses in distress sell for over 70% less than a typical
home, and could lead to opportunities for investors. However, if properties are not maintained or secured, vacant
housing can also contribute to neighborhood blight.
In February of 2016, Rome was selected by the U.S. Department of Housing and Urban Development (HUD) as one
of the municipalities in New York State to receive a Community Needs Assessment (CNA) from the governmental
organization. The CNA kick starts a collaboration between different local and government partners to evaluate the
region’s current economic and demographic status, while strategically planning future endeavors to boost economic
activity and job creation.4 The community hopes the CNA will address issues like the high portion of people who
commute in to Rome to work, support and maintain the City’s existing housing stock while dealing with issues of
blight across the city and generally open up opportunities for capitalizing on economic development within the
region. There was a call from one resident to develop more housing options, especially condos and townhouses. The
Executive Director of the Genesis Group will chair the project, as he did when the CNA occurred in Utica in 2014.
While the community is excited about the CNA process, the greater goal of the initiative is to build a relationship
with HUD, which can lead to further funding opportunities in Rome’s downtown in the future.
Occupancy & Vacancy Rates
The chart below outlines the status and trends of housing units in the City of Rome, which contained a total of
15,011 units in 2015. In 2015, 51% of housing was owner-occupied, another 39% was renter-occupied, and the
remaining 10% was vacant.
The number of overall occupied units has remained flat in Rome, but the number of owner-occupied units is
trending downwards, while rental units are on the rise. Owner-occupied units are expected to decrease from 7,774
in 2010 to 7,464 units in 2020, a loss of 310 units, while rental occupied units are expected to see an increase of 250,
reaching from 5,752 to 6,002. Vacant units are also on the rise, with an increase of 325 units projected between 2010
and 2020. Overall, 265 units are expected to be added to the housing market in Rome over the course of 2010 to
2020. City Occupancy Trends
Based on 2010 Census figures, the overall 2010 2015 2020
vacancy rate reflects the vacancy rate of Total Housing Units 14,893 15,011 15,158
homeowner and rentals, all totaling around Occupied 13,526 13,502 13,466
9%. Owner 7,774 7,586 7,464
Renter 5,752 5,916 6,002
Vacant 1,367 1,509 1,692
Vacancy Rate (Own & Rent) 9% 10% 11%
Homeowner Vacancy Rate* 9% N/A N/A
Rental Vacancy Rate* 9% N/A N/A
Source: ESRI
* Includes For Migrant Workers, Seasonal, Sold-not occupied,
and Other categories. Some properties in Other and Sold-not
occupied include those in foreclosure or tied up in other legal
proceedings (about 553 units in 2010).
3
Rome Real Estate Statistics & Foreclosure Trends Summary, http://www.realtytrac.com/statsandtrends/ny/oneida-county/rome
4
Vanno, Philip, “HUD’s community needs assessment could help transform Rome’s future,” Observer-Dispatch, March 3, 2016.
http://www.uticaod.com/article/20160303/NEWS/160309810
Camoin Associates | Erie Blvd BOA Market Analysis: Rome, NY 22Age of Housing Stock
The age of an area’s housing stock is an important indicator because it can provide a high-level estimate of the
quality of the housing in an area. Although well-maintained older homes can contribute to the preservation of an
area’s local history and community character, older houses also tend to be costlier to maintain and have more
structural and environmental concerns. In many communities, substandard older housing is often occupied by those
residents that are least able to afford the regular maintenance that an older home requires.
The housing stock in the BOA is considerably older than the city’s or county’s housing options. Over half of the
BOA’s homes are greater than 75 years old. Just over a third of homes in the city and a third of all homes in the
Camoin Associates | Erie Blvd BOA Market Analysis: Rome, NY 23county are of a similar age. Housing development in the last fifteen years was minimal, with 4 units added in the
BOA (+0.8%), 270 units in the city (+2.1%) and 5,777 in the county (+5.2%). With little new housing being added
across the city, maintenance of older properties, including health and safety hazards will be key in ensuring
adequate housing options for city residences.
Multi-Family and Rental Market
The table to the right shows an overview of the multi-family housing in the City of Rome and Oneida County. Due
to the limited size of the BOA, there is not an abundance of activity to report in the table. Over the past five years,
the average vacancy rate for rental units in the Greater Rome Mulit-Family Snapshot
area was 5.1%, mirroring the vacancy rate in the county. Greater Oneida
Generally, a vacancy rate under 10% indicates a healthy rental Rome County
market and a vacancy rate of around 5% is typically Leasing Units
5-Year 5-Year
considered a strong market. Over 12 months, Greater Rome Average Average
absorbed 15 units, while the county absorbed 75. Vacant Units 82 249
Vacancy Rate 5.1% 5.0%
Rents in the Greater Rome Area range from $426 for a studio 12 Mo. Absorption Units 15 75
apartment to $843 for a 3+ bedroom unit. In Oneida County, 5-Year 5-Year
a typical asking rent for a studio apartment reaches $436, Rents
Average Average
while a 3+ bedroom unit runs for about $853 per month. Studio Asking Rent $ 426 $ 436
There has been no construction activity in the last 12 months 1 Bed Asking Rent $ 559 $ 585
in the Greater Rome area, although there has been other 2 Bed Asking Rent $ 703 $ 754
activity throughout Oneida County, with 79 construction 3+ Bed Asking Rent $ 843 $ 853
starts, 99 units under construction and 79 units delivered to Concessions 2.1% 1.8%
market within the last year. Sales in Greater Rome comprise a Inventory in Units
5-Year 5-Year
quarter of all sales in the county according to sales volume of Average Average
units. The actual sales price per unit in Greater Rome is more Existing Units 2,230 8,295
than $11,000 less than asking prices, while the difference 12 Mo. Construction Starts 0 79
between sales price per unit and asking price per unit in the Units Under Construction 0 99
county reaches $7,000. Lastly, the capitalization rate in 12 Mo. Deliveries 0 79
Greater Rome exceeds the county by more 2%. 5-Year 5-Year
Sales
Average Average
Sale Price Per Unit $ 22,560 $ 18,912
There are currently 188 multi-family buildings in Oneida Asking Price Per Unit $ 33,842 $ 26,178
County, an increase of only four buildings since 2007. The Sales Volume (Mil.) $ 2.5 $ 10.0
total number of units has grown by 283 between 2007 and Cap Rate 14.8% 12.4%
2015. The units built in the last eight years account for around Source: CoStar
3% of current inventory, which indicates a relatively older supply of rental units. The average square feet per unit has
remained relatively stable, around 775 square feet. The largest jump in average square feet occurred between 2014
and 2015. Vacancy rates have declined over time from 8.8% to 4.0% in 2015 – showing recovery since the housing
market collapse in 2008.
Camoin Associates | Erie Blvd BOA Market Analysis: Rome, NY 24Multi-Family Inventory and Vacancy - Oneida County
Avg. Square Vacant Vacancy
Year Buildings Total Units
Feet Units Rate
2015 188 8,499 783 206 4.0%
2014 186 8,274 775 238 4.8%
2013 185 8,240 775 213 4.3%
2012 185 8,240 775 252 5.1%
2011 185 8,240 775 322 6.5%
2010 185 8,240 775 349 7.1%
2009 184 8,216 775 398 8.1%
2008 184 8,216 775 409 8.3%
2007 184 8,216 775 431 8.8%
Source: CoStar
In the Greater Rome region, the number of multi-family buildings has remained stable over the last nine years at 36.
The number of vacant units has notably declined in the same time period, by nearly 70%. Correspondingly, vacancy
rates dramatically fell from over 10% in 2007 or 3.5% in 2015.
Multi-Family Inventory and Vacancy - Greater Rome
Total Avg. Square Vacant Vacancy
Year Buildings
Units Feet Units Rate
2015 36 2,195 708 56 3.5%
2014 36 2,195 708 63 3.9%
2013 36 2,194 708 51 3.1%
2012 36 2,194 708 100 6.2%
2011 36 2,194 708 134 8.3%
2010 36 2,194 708 140 8.6%
2009 36 2,194 708 162 10.0%
2008 36 2,194 708 167 10.3%
2007 36 2,194 708 174 10.7%
Source: CoStar
After little activity in the previous three years, 176 multi-family units were developed over 2014 and 2015. Another
24 were delivered to the market in 2010. The annual average from 2007 through 2015 was 22 units delivered
annually. There were no multi-family deliveries in Greater Rome or the BOA over the same time frame.
Multi-Family Deliveries
Oneida County
Year Units
2015 143
2014 33
2013 -
2012 -
2011 -
2010 24
2009 -
2008 -
2007 -
Source: CoStar
Camoin Associates | Erie Blvd BOA Market Analysis: Rome, NY 25You can also read