Graphene active sensor arrays for long-term and wireless mapping of wide frequency band epicortical brain activity
←
→
Page content transcription
If your browser does not render page correctly, please read the page content below
ARTICLE
                  https://doi.org/10.1038/s41467-020-20546-w                 OPEN

                  Graphene active sensor arrays for long-term and
                  wireless mapping of wide frequency band
                  epicortical brain activity
                  R. Garcia-Cortadella1,9, G. Schwesig2,9, C. Jeschke3, X. Illa 4,5, Anna L. Gray6, S. Savage6, E. Stamatidou6,
                  I. Schiessl 7, E. Masvidal-Codina4,5, K. Kostarelos 1,6, A. Guimerà-Brunet4,5, A. Sirota2 ✉ &
                  J. A. Garrido 1,8 ✉
1234567890():,;

                  Graphene active sensors have demonstrated promising capabilities for the detection of
                  electrophysiological signals in the brain. Their functional properties, together with their
                  flexibility as well as their expected stability and biocompatibility have raised them as a
                  promising building block for large-scale sensing neural interfaces. However, in order to
                  provide reliable tools for neuroscience and biomedical engineering applications, the maturity
                  of this technology must be thoroughly studied. Here, we evaluate the performance of 64-
                  channel graphene sensor arrays in terms of homogeneity, sensitivity and stability using a
                  wireless, quasi-commercial headstage and demonstrate the biocompatibility of epicortical
                  graphene chronic implants. Furthermore, to illustrate the potential of the technology to detect
                  cortical signals from infra-slow to high-gamma frequency bands, we perform proof-of-
                  concept long-term wireless recording in a freely behaving rodent. Our work demonstrates the
                  maturity of the graphene-based technology, which represents a promising candidate for
                  chronic, wide frequency band neural sensing interfaces.

                  1 Catalan Institute of Nanoscience and Nanotechnology (ICN2), CSIC and BIST, Campus UAB, Bellaterra, 08193 Barcelona, Spain. 2 Bernstein Center for

                  Computational Neuroscience Munich, Faculty of Medicine, Ludwig-Maximilians Universität München, Planegg-Martinsried, Germany. 3 Multi Channel
                  Systems (MCS) GmbH, Reutlingen, Germany. 4 Instituto de Microelectrónica de Barcelona, IMB-CNM (CSIC), Esfera UAB, Bellaterra, Spain. 5 Centro de
                  Investigación Biomédica en Red en Bioingeniería, Biomateriales y Nanomedicina (CIBER-BBN), Madrid, Spain. 6 Nanomedicine Lab, National Graphene
                  Institute and Faculty of Biology, Medicine & Health, University of Manchester, Manchester, UK. 7 Division of Neuroscience and Experimental Psychology,
                  School of Biological Sciences, Faculty of Biology, Medicine and Health, University of Manchester, Manchester M13 9PT, UK. 8 ICREA, Pg. Lluís Companys 23,
                  08010 Barcelona, Spain. 9These authors contributed equally: R. Garcia-Cortadella, G. Schwesig. ✉email: sirota@biologie.uni-muenchen.de; joseantonio.
                  garrido@icn2.cat

                  NATURE COMMUNICATIONS | (2021)12:211 | https://doi.org/10.1038/s41467-020-20546-w | www.nature.com/naturecommunications                                1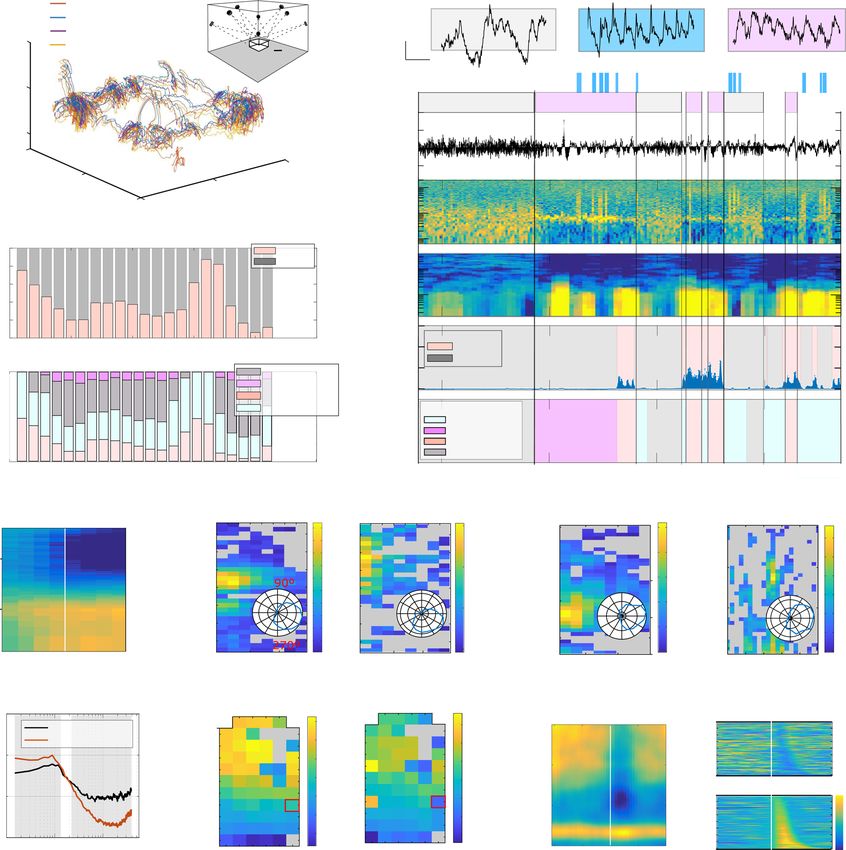
ARTICLE                                                                NATURE COMMUNICATIONS | https://doi.org/10.1038/s41467-020-20546-w

I
    ncreasing the bandwidth of neuroelectronic interfaces in terms           physiological role with an improved spatial resolution. However,
    of spatial resolution and sensitivity in a wide frequency range          in order to advance in the actual application of g-SGFET arrays,
    is a major and ongoing challenge in neural engineering. In the           several technical aspects remain to be thoroughly evaluated.
last decades, large efforts have been dedicated to the development              In this article, we present a sensing system composed of a
of neural sensing interfaces with high sensor-count on conformal             flexible 64-channel g-SGFET array and a wireless headstage
substrates1–10, which are required for highly biocompatible                  (Fig. 1c–f and supplementary information S1), which we use to
intracranial neural probes11–14. In this line, active sensors have           demonstrate the maturity of this technology in terms of long-
emerged as a promising building block for high-bandwidth neural              term and wide frequency band recording capabilities in freely
interfaces4,6,15–19 because they can be arranged in a multiplexed            moving animals from a system perspective. First, the focus is
array2,4,6–9 enabling high sensor-count probes. The detection                placed on the assessment of the in vitro characteristics of the
principle of active sensors is typically based on the modulation of          system; including the yield and homogeneity of the graphene
the conductivity of a transistor channel, which is electrically              sensors, their intrinsic noise and the impact of the data-
coupled with the biological environment through its                          acquisition (DAQ) system on the sensitivity of these devices.
gate8,9,15,18,20–22, producing a local signal pre-amplification.              Second, critical aspects for their chronic application in vivo have
Although active sensing technologies present substantial advan-              been resolved; including the stability of the graphene doping, the
tages over conventional micro-electrode arrays, their imple-                 long-term stability of the g-SGFETs sensitivity and their acute, as
mentation is currently limited by the demanding material                     well as chronic biocompatibility. Finally, we have applied this
properties required. In order to achieve long-term and highly                methodology to monitor the epicortical local field potentials
sensitive neural recordings, materials for active sensing are                (LFP) in a freely moving rat model simultaneously with its three-
expected to exhibit semiconducting or semimetallic properties, a             dimensional (3D)-position during long sessions of up to ∼24 h.
high electrical mobility and low intrinsic noise, in addition to a           The combination of behavioral and electrophysiological data has
high stability, easy integration in flexible substrates and bio-              been used to assess the capabilities of the wireless recording
compatibility. Some active sensors based on organic semi-                    system to monitor brain dynamics across unperturbed alternation
conductors and thin Si nanomembranes have exhibited                          of brain states and validate its sensitivity to detection of high-
promising performance, with novel transistor architectures17,22              frequency oscillations associated with sparse behavioral events. As
and insulating technologies4,14 improving their performance in               an illustration of unique features of the g-SGFET recording we
some typically constrained aspects such as their frequency                   provide a first case demonstration of infra-slow topographically
response or their long-term stability. Graphene-based active                 specific and brain-state invariant pattern associated with high-
sensors are another promising candidate to meet these require-               voltage spindles (HVS). Furthermore, we find changes in infra-
ments due to the flexibility of graphene23,24, its high expected              slow signal power between slow wave sleep (SWS) and rapid eye
stability25 and biocompatibility26,27, as well as its electronic             movement (REM) sleep and identify the modulation of theta
properties, including a high mobility of charge carriers28,29.               oscillations and sleep spindles by the phase of the DC-signal
Graphene solution-gated field-effect transistors (g-SGFETs) have              infra-slow dynamics during REM and SWS, respectively. The
demonstrated a high sensitivity for the detection of local field              results reported here demonstrate that neural probes based on
potentials15 (LFP), as well as a high performance in multiplexed             graphene active sensor arrays represent a mature technology, with
operation6,7. In addition, g-SGFETs have recently demonstrated a             a high sensitivity, stability and biocompatibility, which allows to
high sensitivity for the mapping of infra-slow (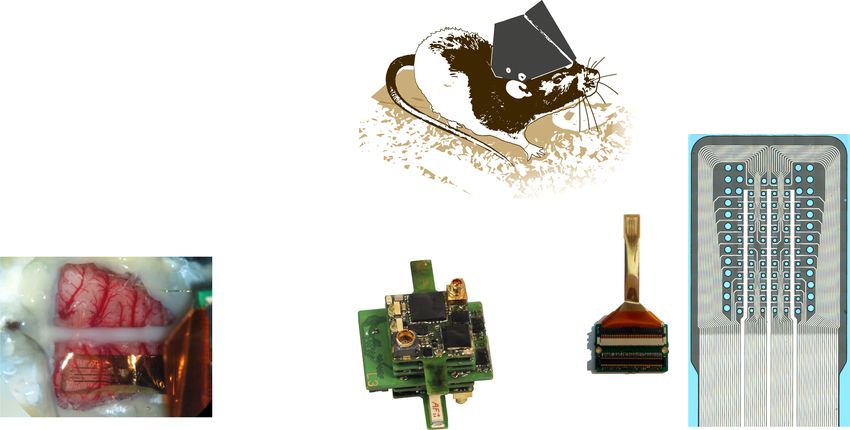
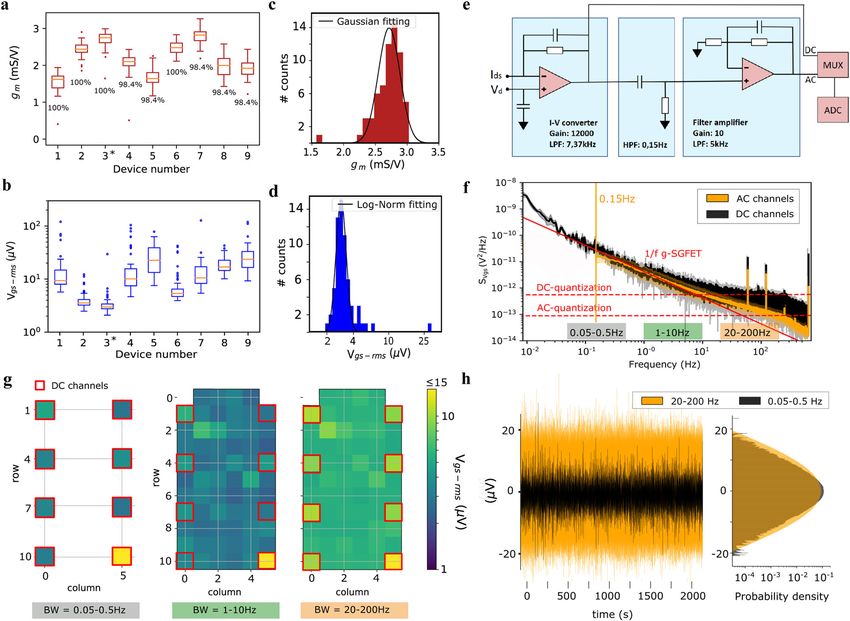
NATURE COMMUNICATIONS | https://doi.org/10.1038/s41467-020-20546-w                                                                         ARTICLE

Fig. 1 Graphene active sensor arrays for chronic, wireless monitoring of wide frequency band epicortical neural activity. a Schematic of a g-SGFET and
its equivalent circuit. The small-signal transduction from voltage to current is modeled by the current source GmVsig, where Gm ≡ dIds/dVgs. The DC current
is modeled by the Rds element. b Average stationary transfer characteristics of 8 g-SGFETs (left axis) and the gm of 64 g-SGFETs (right axis). The filled area
indicates the standard deviation. c Illustration of the rat with the untethered recording system implanted. The headstage and the 3D-printed frame to hold it
are covered by a 3D-printed enclosure. On top, the position markers of the motion capture (Mocap) system are fixed, which reflect light back to the Mocap
cameras placed in the room. The neural signals transduced by the graphene sensors are digitized and transmitted wirelessly to the signal receiver, which is
connected to a computer for signal recording. d g-SGFET array placed on the rat cortex; the position of the reference electrode in contact with the
cerebellum and two Pt-Ir electrodes at either side of the g-SGFET array are marked with arrows. e Photograph of the wireless headstage designed for these
experiments. f Photograph of the 64 g-SGFET array mounted on a customized connector (left) and zoomed image of the probe active area (right). The red
squares indicate the g-SGFETs on the array, which are connected to the headstage inputs with DC capabilities.

gm, 1.9 mS/V, is relatively high with respect to flexible silicon                a mean of 4.13 μVrms and a standard deviation of 1.14 μVrms
FETs8 and comparable with typical organic transistor values17,52                (excluding the outliers shown in Fig. 2b). These results show that
due to the high electrical mobility and gate capacitance of                     graphene-based neural probes prepared using a 4-inch wafer-
g-SGFETs. In Fig. 2b the equivalent noise at the gate (Vgs-rms) of              scale fabrication process can be obtained with a high homo-
the same devices is shown (see supplementary information S2).                   geneity and sensitivity. Additionally, upscaling of the fabrication
Vgs-rms is an important figure of merit to evaluate the sensitivity              process to an industrial scale is expected to further improve the
of the sensors47, which is defined as the ratio between the                      homogeneity of g-SGFETs characteristics, especially in terms of
integrated current noise (Ids-rms) of the transistor and its                    the contamination-dependent charge noise47,53.
transconductance. Although this parameter presents a larger
dispersion than gm, it is possible to identify 3 out of 9 probes with           Wireless headstage design and characteristics. Another aspect
96% of the g-SGFETs showing a Vgs-rms below 10 µVrms,                           that contributes to the sensitivity of the recording system is the
suggesting that the measured noise is not directly related to gm.               noise introduced by the headstage in the amplification and digi-
In fact, low-frequency noise in graphene has been reported to                   tization process. The amplification of the wide frequency band
originate from charge trapping-detrapping events53, which makes                 activity requires a DC-coupled system, which implies the digiti-
noise directly proportional to the density of traps and thus,                   zation of signals with large DC-offsets. In order to digitize signals
sensitive to impurities in the environment of graphene. Figures 2c,             with such a large dynamic range and minimize quantization
d show the distribution of gm and Vgs-rms, respectively, for the                noise, a two-stage transimpedance amplifier has been imple-
probe #3 labeled with an asterisk in Fig. 2a. The dispersion in the             mented (see schematic in Fig. 2e). The first stage converts the Ids
transconductance of the g-SGFETs can be taken into account in                   currents from the g-SGFETs into voltage, which contains a wide
the calibration of the neural signals, correcting dispersion in the             frequency band signal, including the infra-slow frequency com-
signal amplification. Therefore, the truly limiting factor in terms              ponents of Ids. In the second amplification stage (see Fig. 2e), the
of homogeneity of the g-SGFETs performance is the equivalent                    signal is high-pass filtered to remove the DC offset and fill the full
noise at the gate. Vgs-rms presents a log-normal distribution54 with            scale of the analog-to-digital converter (ADC). In order to

NATURE COMMUNICATIONS | (2021)12:211 | https://doi.org/10.1038/s41467-020-20546-w | www.nature.com/naturecommunications                                    3
ARTICLE                                                                  NATURE COMMUNICATIONS | https://doi.org/10.1038/s41467-020-20546-w

Fig. 2 Evaluation of system sensitivity. a Boxplot of gm for nine randomly selected probes from three different wafers produced in independent batches.
The yield in terms of gm above 70% of the median is indicated. b Boxplot for Vgs-rms measured in the 1–10 Hz frequency range, plotted for the same neural
probes evaluated in part a. All probes consisting of 64 g-SGFETs. The boxes extend from the lower to the upper quartiles, with a line at the median. The
whiskers extend 1.5 times the inter-quartile range and the data points beyond the whiskers are indicated by a dot. c Histogram of gm for the 64 g-SGFETs of
probe #3 (labeled in panel a) and Gaussian fit of the histogram excluding the outliers shown in panel a. d Histogram of Vgs-rms for the 64 transistors in
probe #3 (see panel b) and log-normal fit of the histogram excluding the outliers shown in panel b. e Equivalent circuit of the wireless headstage. f Power
spectral density (PSD) of the noise from DC channels (black) and AC channels (orange) in probe #3. The 1/f dependence is represented by the solid red
line. The vertical orange line indicates the hardware high-pass filter applied to AC channels at 0.15 Hz. The quantization noise of the DC and AC channels is
indicated by the horizontal dashed red lines. g Representation of the Vgs-rms for all g-SGFETs in probe #3 shown for different bandwidths; 0.05-0.5 Hz band
for the DC-channels (left), 1–10 Hz band (middle), and 20–200 Hz (right). The position of the g-SGFETs on the array connected to DC-channels of the
headstage is indicated by the red squares. h Time domain representation of the noise spectra shown in part f and g (DC-channels filtered in the 0.05–0.5
Hz band and AC channels in the 20–200 Hz band). Signal from eight channels are overlapped.

dynamically choose between a DC or AC coupling for each                        (SVgs(f)), defined as the PSD of the current noise over the
channel, a multiplexer has been added to switch between the                    transconductance (see Fig. 2f). The central part of the spectrum,
output of the first and the second stages, see Fig. 2e. Multiplexers            from roughly 0.05 Hz to 10 Hz, is dominated by the 1/f intrinsic
have been implemented in only 8 of the 64 channels in order to                 noise of the graphene transistors53. For frequencies below 0.05
minimize power consumption and, therefore, battery weight and                  Hz, the DC-channels show a slight increase above the 1/f noise,
volume of the dedicated wireless headstage.                                    which is attributed to the contribution of additional noise sources
   Having a relatively high transconductance is important in                   in the amplification chain, leading to slightly larger Vgs-rms values
order to pre-amplify the signals above the noise floor of the                   in the 0.005–0.05 Hz band (see supplementary information S2).
transimpedance amplifiers. However, active sensors typically                    Above 10 Hz the noise spectra present a significant increase above
present an intrinsic 1/f noise, which scales with the drain-to-                the 1/f noise, caused by the quantization noise of the headstage
source current47. Therefore, Vgs-rms is a more suitable figure of               amplifiers, which is more pronounced in DC-channels. The
merit to evaluate the sensitivity of active sensors. In order to               SVgs(f) integrated in different frequency bands is shown in Fig. 2g
validate that the sensitivity of the recording system is limited by            for all channels on the neural probe #3. The three maps
the intrinsic noise of the active sensors, it is paramount to                  demonstrate the similarity of the sensitivity of the system in the
evaluate the impact of the amplification electronics on the                     different ranges, with only a significant increase in the 20–200 Hz
sensitivity of the system in a wide frequency band. The noise level            band. In this band, the noise of the DC-channels exceeds
for DC and AC channels can be evaluated from the power                         the noise of the AC channels; however all the graphene
spectral density (PSD) of the equivalent voltage noise at the gate             sensors (except for an outlier) keep Vgs-rms values below 15 µV.

4                 NATURE COMMUNICATIONS | (2021)12:211 | https://doi.org/10.1038/s41467-020-20546-w | www.nature.com/naturecommunications
NATURE COMMUNICATIONS | https://doi.org/10.1038/s41467-020-20546-w                                                                    ARTICLE

The digitization noise for AC channels might be decreased by                    information S3). However, from these results it is not possible
further optimizing the gain of the second amplification stage.                   to distinguish among all different contributions. The accumu-
However, the intrinsic noise of the amplifier is expected to                     lated drift in the CNP measured during the first 24 h of
dominate for large amplification gains. In order to better illustrate            recording reaches approximately 50 mV, with a maximum
the constant sensitivity over frequency, Fig. 2h shows the time                 change rate of ∼20 mV/h in the first hour (see supplementary
domain representation of the noise signal filtered in the ISA band               information S3). Figure 3b shows the measured signal in two
(0.05–0.5 Hz) and the high-frequency band (20–200 Hz). The                      DC-coupled channels (high-pass filtered at 1 mHz) during the
histogram plotted next to the time-domain representation of both                first 2 h of recording. Figure 3c shows the amplitude-phase
signals shows their probability density distribution, which                     relationship between these two DC-coupled channels in the
demonstrates the similarity of their variance, as expected from                 0.005–0.05 Hz band (see “Methods” section). The left panel
the integration of a 1/f spectrum in these frequency bands. Note                shows the amplitude-phase coupling measured in PBS, while
that the apparently lower amplitude in the time-domain                          the right panel shows the equivalent results in vivo. The in vivo
representation of the infra-slow noise is due to the different                  signals exhibit fluctuations with a much larger amplitude than
timescales of 1/f noise in both frequency bands, but not due to a               the signals recorded in PBS, ruling out the transistor 1/f noise
different signal variance.                                                      and the headstage noise as the origin of these infra-slow
   These results show the high sensitivity of the system in a wide              oscillations. Further, the in vivo signals recorded in the
frequency band, with Vgs-rms below 5 μV in the infra-slow                       0.005–0.05 Hz band present fluctuations in anti-phase, which
frequency band. In the design of the headstage, we have                         confirm that neither instabilities in the reference electrode nor
considered the compromise between reaching maximum sensi-                       adsorption/desorption of chemical species on graphene are
tivity in the high-frequency range and minimizing the power                     responsible for these fluctuations. To conclude this discussion,
consumption of the DC-coupled recording system with a                           Fig. 3d shows the effect of drifts in the graphene doping on the
relatively high channel count. Smaller g-SGFETs are expected                    Vgs-rms of graphene sensors. These results demonstrate that
to present a higher intrinsic noise (see supplementary informa-                 their sensitivity does not change significantly due to the
tion S2), as expected for any active or passive sensor. Therefore,              accumulated drifts during up to 24 h if the initial bias is
our results indicate that the sensitivity of g-SGFETs in the infra-             selected properly. Therefore, daily tracking of the CNP and
slow frequency is not affected by the amplification electronics for              readjustment of the Vgs overpotential back to optimum values is
sensor areas below 100 × 100 μm. This is in strong contrast with                enough to keep a constant sensitivity over long-term monitor-
ISA detection using passive electrodes, for which the gain loss and             ing of the brain dynamics.
signal distortion is expected to increase for smaller sensor                        In addition to changes in the doping of graphene, the
dimensions. These results demonstrate the limits and the                        transconductance and noise of the g-SGFETs might vary over
scalability of the g-SGFET technology towards higher density                    time due, for instance, to the creation of defects in the graphene
arrays with ISA detection capabilities.                                         lattice. Pristine graphene has shown excellent chemical stability
                                                                                due to its sp2 hybridization25. However, dangling bonds at edges,
                                                                                grain boundaries, atomic vacancies or reconstructions in the
Signal stability and sensitivity over time. Once the performance                atomic lattice increase the reactivity of graphene, which might
of the graphene transistors and the headstage is properly assessed,             lead to the creation of defects over time25. In addition, there
the stability of the g-SGFETs in an in vivo chronic setting needs               might be mechanical causes of performance degradation such as
to be evaluated in order to ensure the reliability of the recording             detachment of graphene from the substrate or bending-induced
system.                                                                         strain on the graphene lattice and metal-graphene contacts.
   The Ids–Vgs curves of the g-SGFETs describe the relationship                 Another possible cause of sensitivity degradation could be the
between the measured drain-to-source current and the electro-                   encapsulation of the device by glial scar tissue58. This layer of
chemical potential at the graphene-electrolyte interface. The                   tissue can be modeled as an electrical impedance in series with the
minimum in Ids occurs at a particular gate voltage, referred to as              graphene-electrolyte interface59, which can eventually lead to a
the charge neutrality point (CNP), which is also related to a                   degraded frequency response of the g-SGFETs.
minimum in the sensitivity of the device (see Fig. 1a). The CNP                     In order to track changes in the sensitivity over time in a
corresponds to the bias conditions for which the Fermi energy in                chronic implant, the gm extracted from the Ids–Vgs curves and the
the graphene channel is, on average, closest to the energy with a               Vgs-rms were periodically measured for the 8 DC-coupled
minimum density of states (i.e., the Dirac point)55. The Vgs                    channels over 4 weeks. Figure 3e shows that gm remained
overpotential required to reach this energy depends on the                      approximately constant, suggesting that there are no major
doping56 of the graphene channel, as well as on the electro-                    creation of defects in the graphene channel in the in vivo
chemical potential of the reference electrode. Therefore, instabil-             environment. Similarly, the Vgs-rms shows only a slight increase in
ities in any of these two parameters will produce a shift of the                the last days. Figure 3f shows the current noise (Ids-rms) for all the
transfer characteristics in the Vgs axis. In turn, this shift implies           64 channels measured at 200 Hz over 4 weeks. At this frequency,
that Ids will present a drift and that the sensitivity of the g-                it is possible to estimate changes in the sensitivity of the recording
SGFETs might vary over time for a constant Vgs overpotential.                   system due to the low average power of high-frequency neural
Having a controllable doping of the g-SGFET and a homogeneous                   signals (see supplementary information S4). The numeric values
CNP among sensors is, therefore, of paramount importance to                     displayed in Fig. 3f indicate the percentage of g-SGFETs working
maintain a good sensitivity of the sensor array.                                (see supplementary information S4). The frequency response of
   Figure 3a shows the evolution of the transfer characteristics                the transconductance (gm(f)) has also been measured in vivo over
over 4 weeks after implantation of the neural probe (see                        4 weeks after implantation. For this purpose, two Pt-Ir electrodes
“Methods” for implantation details). The observed shift in the                  were implanted on both sides of the g-SGFET array (see inset in
CNP is presumably due to a combination of factors, including                    Fig. 3g) and 1 µA amplitude pure tone signals of different
desorption of contaminants by electrochemical cleaning of                       frequencies were applied using a current source. Figure 3g shows
the graphene-electrolyte interface57, adsorption of charged                     the magnitude of gm(f) for different days after implantation of
chemical species present in the environment or changes in                       the neural probe normalized by the mean magnitude at 1 Hz; the
the reference electrode potential (see supplementary                            phase of gm(f) is shown in the supplementary information S5. The

NATURE COMMUNICATIONS | (2021)12:211 | https://doi.org/10.1038/s41467-020-20546-w | www.nature.com/naturecommunications                             5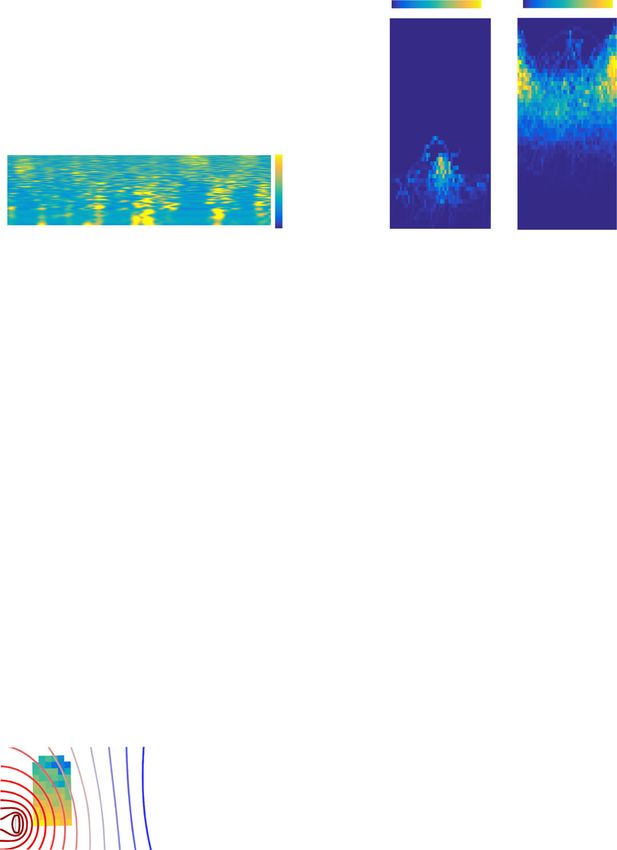
ARTICLE                                                                    NATURE COMMUNICATIONS | https://doi.org/10.1038/s41467-020-20546-w

Fig. 3 g-SGFET stability in-vivo. a CNP vs. time over 4 weeks. The inset shows the Ids–Vgs curves. Mean and standard deviation for n = 8 g-SGFETs
(1 outlier excluded). b Signal from two DC-coupled channels. Indicated positions corresponding to map in panel h. The spectrogram of channel (5,7) is
shown (bottom). c The phase-amplitude relation between the channels in panel b, for the noise measured in the beaker (left) and for the signals measured
in vivo (right). d Boxplot of Vgs-rms vs. shifts in the effective gating (Vgs–VCNP) of the 64 g-SGFETs. The colored area indicates the measured drift in the CNP
referred to a Ag/AgCl electrode during the first 24 h of recording. The initial bias and the CNP are indicated by the red and green vertical lines respectively.
e gm (top) and Vgs-rms (bottom) measured over 4 weeks post implantation; gm was obtained from the Ids–Vgs curves of the DC-coupled channels (n = 8 g-
SGFETs, 1 outlier excluded). f Current noise over 4 weeks after implantation (n = 64 g-SGFETs). The numeric values indicate the yield of working devices
(see supplementary information S4). The boxes in panels a and d–f extend from the lower to the upper quartiles, with a line at the median. The whiskers
extend 1.5 times the inter-quartile range and the data points beyond the whiskers are indicated by a dot. g Average and standard deviation of the
frequency-dependent transconductance (|gm | (f)) shown for different days after the implantation (n = 10 g-SGFETs). The inset shows the approximate
position of the Pt-Ir electrode close to the array, the simulated equipotential contour lines in a conductive plane and the relative signal amplitude measured
by each of the g-SGFETs in the array (see supplementary information S5). h Signals measured by all g-SGFETs on the array during a state of increased theta
activity on day 1 and day 6 after implantation.

approximately constant slope (in a log-log scale) follows a                      greater detail, by studying a large animal cohort, the stability of
fractional order attenuation (i.e., approximately ∝1/f0.1), which                the biological signal over time, a critical aspect in electrophysiol-
has been recently attributed to the non-ideal capacitive response                ogy research and for the long-term performance of brain-
of the graphene-electrolyte interface34. A calibration method to                 computer interfaces61,62. Furthermore, the polymers used as a
correct such transconductance variation has also been pro-                       substrate and passivation layers could be modified to reduce the
posed34. The evolution of the frequency response does not show                   moisture absorption14,63 and displace the neutral plane of the
major changes in the slope of the gm attenuation, indicating that                device at the position of the graphene channel (see “Methods”
there is not a significant increase in the electrical impedance in                section). Yet, the results presented in this section reveal a
series with the graphene-electrolyte interface due to device                     promisingly stable performance over time, which sets a lower
encapsulation60. To conclude, Fig. 3g shows the recorded neural                  bound for the stability of g-SGFETs in a chronic implant
activity in a state of increased theta power in day 1 and day 6 after            environment. Besides, from a system perspective, we show that g-
implantation, illustrating the good homogeneity and stability of                 SGFET arrays can measure very slow biological signals (high-pass
the g-SGFETs performance. Future studies could address in                        filtered above 1 mHz).

6                  NATURE COMMUNICATIONS | (2021)12:211 | https://doi.org/10.1038/s41467-020-20546-w | www.nature.com/naturecommunications
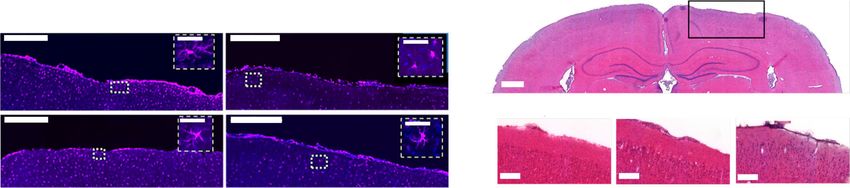
NATURE COMMUNICATIONS | https://doi.org/10.1038/s41467-020-20546-w                                                                         ARTICLE

Fig. 4 Biocompatibility testing of non-functional g-SGFET vs. control devices. a The timeline describes the procedures carried out on animals during the
biocompatibility study. b Schematic of the high-surface area g-SGFET prototype developed for biocompatibility testing in-vivo. c Discrimination ratio from
NOR test over different days after implantation (see “Methods” section). For all five groups tested, the discrimination ratio was above 0.5 at all timepoints.
Evaluated for n = 7 animals per group at all timepoints, except 12 weeks which had n = 3 (sham), n = 4 (platinum and naive) and n = 7 (blank). The boxes
from the lower to the upper quartile, while whiskers represent minimum and maximum values. d Inflammatory marker IL-17a in the brain tissue for all
groups and timepoints. Evaluated for n = 4 animals after 2 and 12 weeks, and n = 3 animals at 12 weeks. e Microglial activation state, expressed as a
percentage of total microglial presence in the site surrounding the electrodes. n = 3 animals at 2 and 12 weeks, n = 2 animals (or 3 for the contralateral
hemisphere) at 6 weeks. Bars in panels d and e indicate the mean and range of data point. f Iba-1 immunoflourescent staining to assess activation status of
microglia at the surgical site obtained from 40 sections per animal. Scale bar equals 500 µm (50 µm at the insets). g Haemotoxylin and Eosin staining at
2 weeks post implantation shows there is no structural damage to the cortical layers directly at the device implantation site. Forty sections at 25 µm per
animal were imaged. Scale bar equals 1 mm (top) and 200 µm (bottom). In panels d and e two-way ANOVA test with Dunnett’s multiple comparison to the
naive control within each timepoint with n = 3 or larger: *, **, ***, and **** indicate p = 0.015, p = 0.007, p = 0.0016, and p < 0.0001, respectively.

Biocompatibility of graphene devices following subacute and                     significant differences in the discrimination ratio were found in
chronic implantation. In order to assess the applicability of g-                animals implanted with any device at any of the timepoints
SGFET arrays for the long-term monitoring of brain activity under               (Fig. 4c). The inflammatory response of the tissue was evaluated
natural behavior we have also investigated the biocompatibility of              using two main techniques: ELISA of blood or brain tissue for a
graphene-based epicortical devices. For this purpose, animals were              panel of inflammatory cytokines, and immunohistochemical
implanted with one of three devices onto the parietal cortex of the             analysis of brain tissue for cells associated with inflammation.
brain, or had the full surgery without the implantation of any device           ELISA was performed for four cytokines: interleukin-6 (IL-6),
(sham control). A cohort of naive animals who had no intervention               interleukin-17a (IL-17a), interferon gamma (IFN-γ), and tumor
were used as a control. Three time points were chosen to assess                 necrosis factor alpha (TNF-a). In blood serum, there were no
tissue response: 2 weeks, 6 weeks, and 12 weeks post implantation               significant differences between any of the materials at any
(Fig. 4a). Non-functional devices were custom-designed with an                  timepoints (see Fig. S6). For cytokine expression in brain tissue,
enlarged surface area of CVD graphene, in order to maximize                     significantly higher levels of all four cytokines in both graphene
exposure of the material to the brain tissue (see Fig. 4b for device            and platinum devices were found at the 2 weeks timepoint, when
dimensions). The experiments were designed following the gui-                   compared with the contralateral hemisphere control. Whilst
dance from the ISO 10993 standard, which details the biological                 release of these factors is typically intended to prevent further
evaluation of medical devices. Ethylene oxide sterilization was                 damage to the CNS tissue, prolonged expression can be
applied prior to implantation64. After implantation, the immuno-                detrimental. By 6 weeks post implantation, there was still a
histochemical response of the tissue and potential effects on the               significant elevation of both IL17a and IFN-γ for graphene and
behavior were investigated.                                                     platinum devices vs. control expression, and by week 12, there
   Behavior was assessed with the novel object recognition (NOR)                was no significant expression of any cytokine for any treatment
test, used to assess impairment of cognition and memory65. No                   group (Fig. 4d and Fig. S7). These findings demonstrate that the

NATURE COMMUNICATIONS | (2021)12:211 | https://doi.org/10.1038/s41467-020-20546-w | www.nature.com/naturecommunications                                    7
ARTICLE                                                                NATURE COMMUNICATIONS | https://doi.org/10.1038/s41467-020-20546-w

adverse tissue response to graphene is transient in nature,                  the LFP dynamics related to spontaneous behavior. The analysis
comparable to the current clinical standard and specific to the               of the relationships between epicortical brain activity and freely
implantation site, with no observed systemic complications.                  moving behavior was performed over timescales enabled by the
   To confirm the ELISA data, manual counting of the activation               wireless recording system. This capability is critical for the study
state of microglial cells was also performed to assess the                   of sparsely occurring behavior events, as well as ISA patterns over
inflammatory state within the brain. Microglial cells are always              distinct brain states.
present within the brain, but their morphology serves as an                     Brain states were classified through a combination of spectral
indicator of the inflammatory state within the brain62. Expression            features in the epicortical LFP signal and motor data. In this way
of activated microglia was increased at both the 2 weeks and                 we distinguished the following classes: slow wave sleep (SWS),
6 weeks post implantation timepoints, and this activation was                REM sleep (REM), Awake Theta (AwT), and Awake Non-Theta
present to a significant level at 2 weeks post implantation in all            (AwNT). Figure 5b illustrates the criteria for the brain states
four treatment groups when compared with the contralateral                   classification, described in detail in the “Methods” section. First,
hemisphere. However, similar to the ELISA, the activation of                 slow wave (SW) states, showing increased power in the 1–25 Hz
microglia had returned to baseline levels by 12 weeks, indicating            band, and Theta states were identified (see Fig. 5b). The behavior
no prolonged inflammatory reaction to the devices (Fig. 4e, f and             of the animal was then classified in either active or inactive
Fig. S8). TUNEL cell counting was also performed, to assess any              periods from the motion tracking data (see Fig. 5b and “Methods”
cell death within the tissue as a result of the implantation of              section). During inactive motor behavior, SW states were
devices. At 2 weeks post implantation, there was a significant                classified as SWS except in direct proximity to HVS events,
increase in the number of TUNEL-positive cells for both                      while Theta states were categorized as REM if directly preceded
graphene and sham surgery groups. However, by 6 weeks there                  by SWS. On the other hand, Theta states occurring during active
was no evidence of cell death, which was also true at 12 weeks               behavior were classified as AwT and SW states as AwNT. Finally,
(Fig. S9). Finally, there was no obvious morphological changes               periods not assigned to Theta or SW states were classified as
seen with haemotoxylin and eosin staining. There was an                      AwNT regardless of the behavior of the animal. During the
appearance of sunken cortex in some brains, however, this was                majority of recording hours all four sleep/wake states were
due to perfusion fixation with the glass window in place, and                 expressed at least once in line with the polyphasic nature of rat
there was no effect on the thickness of the cortical layers below            sleep66–68. Their relative prominence however varied substan-
the implantation site, as shown in Fig. 4g.                                  tially over the course of the recording day paralleling the changes
   Overall, both cytokine expression and histological analysis of            observed in motor states (Fig. 5c), in line with circadian
the brain area at the implantation site showed an acute reaction to          rhythmicity.
the implantation of devices. However, this was not specific to the               Classification of brain states is typically based on the delta,
graphene devices, even though an enlarged surface area of                    alpha-beta and theta frequency bands (see “Methods” section),
graphene was used in order to maximize the material specific                  reflecting fast-time scale state-specific network dynamics. How-
response. By 6 weeks, the reaction showed clear signs of                     ever, some recent research highlighted the role of infra-slow
amelioration, and by 12 weeks, there was no detectable reaction              dynamics in the regulation of brain sub-states40, via modulation
to the devices using any technique. Graphene and Pt devices                  of higher LFP frequency bands during sleep39,45,69 and dynamic
showed a similar level of microglia activation compared to                   coordination and segregation of the resting state35,70. These
“blank” devices, while the latter shows much smaller presence of             results show the potential importance of ISA for a complete
inflammatory markers than for Graphene or Pt. These results                   classification and study of brain-states. The graphene-based
suggest that microglia activation is more strongly associated with           recording system presented here represents an ideal tool for the
surgical procedure and probe insertion, while inflammation is                 study of cortical ISA signals with a high accuracy and spatial
primarily affected by the device material. In this way, functional           resolution in freely behaving animals. The spectrogram in Fig. 5b
sensor arrays, which present a much lower graphene area, are                 illustrates changes of the spectral power for frequencies between
expected to cause an inflammation closer to that caused by                    0.015 and 4 Hz over the transition between SWS and REM. It is
“blank” devices. In addition, according to NOR test, graphene                possible to observe clear increase in the ISA-band power
devices did not affect significantly the animal behavior neither in           following the transition from SWS to REM, even at the single
acute nor chronic timepoints. Based on these results, graphene-              trial level (see Fig. 5b). Taking advantage of the long-term
based devices presented adequate biocompatibility for chronic                recording capabilities of our system, we could sample 44 of such
implantation, comparable to the equivalent platinum-based                    sparsely occurring SWS-REM (REM duration longer than 40 s)
devices.                                                                     state transitions within a 24 h period. Besides, the spatial mapping
                                                                             of ISA enabled by the g-SGFET technology allows to resolve the
                                                                             topographic region-specific modulation of ISA at the SWS-REM
Long-term monitoring of wide frequency band epicortical                      state transition (see supporting information S12). Interestingly,
brain activity during natural behavior. During the longitudinal              delta-band power, associated with slow oscillations, and infra-
in vivo assessment of the g-SGFET sensitivity, we recorded epi-              slow power showed changes in opposite directions between SWS
cortical brain activity in a freely behaving rat for up to 24 h.             and REM sleep. While delta band power expectedly decreases
Throughout the recording period, the 3D-motion of the animal                 from SWS to REM, associated with desynchronized cortical state,
was tracked with a motion capture (Mocap) system (see “Meth-                 infra-slow power increases in REM (see Figs. 5d, e and Fig. S12
ods” section and Fig. 5a). The conjunctive recording of animal               and statistical analysis in “Methods”).
motion and wide frequency band epicortical signals was used to                  In order to further illustrate the wide frequency band
classify brain states and behavioral states over the recording               sensitivity of the recording system, we quantified the strength
period. In turn, this classification was used to support two main             of modulation of LFP power in the slow frequency range (1–15
purposes. First, to validate the ability of the graphene-based               Hz) by the phase of the ISA activity during REM and
wireless recording system to perform long-term stable recordings             SWS. Interestingly, ISA phase significantly modulated theta
in freely moving rat across multiple brain states, and test its              power (8–9 Hz) during REM sleep (Fig. 5f-left) and spindle band
suitability to study infra-slow epicortical LFP dynamics. Second,            power (9–13 Hz) during SWS (Fig. 5f-right). The strength of
to assess the g-SGFET sensitivity in the high-frequency range of             ISA phase modulation was tenfold higher during REM compared

8               NATURE COMMUNICATIONS | (2021)12:211 | https://doi.org/10.1038/s41467-020-20546-w | www.nature.com/naturecommunications
NATURE COMMUNICATIONS | https://doi.org/10.1038/s41467-020-20546-w ARTICLE Fig. 5 Infra-slow to high-gamma correlates of sleep and behavioral states. a 3D trajectories of the head position of the rat. The inset shows a scheme of the position of the Mocap. b The spectrogram and raw LFP signal of an illustrative channel is displayed for distinct brain states (top); slow-wave (SW), high-voltage spindles (HVS) and Theta. Movement speed is displayed along with classification of motor state (middle) and brain states (bottom). c Top: percentage of time in the active vs. inactive state (interruptions to replace the battery not included). Bottom: percentage of time the rat was in each main brain state. d Average 0.015–4 Hz spectrogram for one DC channel triggered on REM episode onsets (n = 44). e Median PSD across SWS-REM transition episodes (n = 44) for 30 s periods pre and post REM onset. Shaded area marks frequency bins with significant difference (p < 0.05, permutation test). f Color-coded strength of modulation of LFP power across slow frequency range (y-axis) for one channel by the phase of ISA across 0.05–0.2 Hz range derived from one DC channel (see panel g) during REM sleep (left) and SWS (right) states. Gray color indicates nonsignificant modulation. Insets show circular plot of LFP power in theta/spindle band as a function of ISA phase. g Color-coded topographic maps of ISA phase modulation of LFP power in theta band during REM (left) and spindle band during SWS (right). ISA phase derived from DC channel marked with a red square. h Color-coded strength of modulation of LFP power across gamma frequency range (y-axis) for one channel by the phase of ISA across 0.05–0.2 Hz range derived from one DC channel (left) and by the phase of LFP in the slow frequency range rhythm (right) during REM. Inset, circular plot of LFP gamma power with respect to respective (ISA or theta) phase. i Average spectrogram for high- frequency range of LFP on posterior channel triggered on rear onset (n = 162). j Head elevation (bottom) and high gamma power (top, same channel as in i) color-coded and centered on rearing onset shown for all events sorted by duration of rear event. to SWS, and the ISA phase of maximal LFP power differed of LFP power across cortex, with both theta power during REM between states being close to the peak (~340°) in REM and and spindle power during SWS showing strongest modulation in ascending phase (~300°) in SWS. Taking advantage of the posterior part of the array (Fig. 5g). While theta oscillations coverage of a significant section of dorsal cortical mantle by our measured on the cortical surface are generated by volume array, we assessed the spatial extent of the ISA phase modulation conduction of multiple theta-rhythmic current generators of NATURE COMMUNICATIONS | (2021)12:211 | https://doi.org/10.1038/s41467-020-20546-w | www.nature.com/naturecommunications 9
ARTICLE                                                                NATURE COMMUNICATIONS | https://doi.org/10.1038/s41467-020-20546-w

entorhino-hippocampal circuits71,72, sleep spindles are generated            on more frontal channels of our array (see supplementary
by rhythmic currents of thalamo-cortical projections to granular             information S11). In strong contrast no such suppression was
cortical layers73. The fact that power of hippocampal theta and              observed in the gamma band between 60 and 70 Hz (see Fig. 5i
cortical spindle band is modulated by the phase of ISA derived               and supplementary information S11).
from cortical surface likely reflects global infra-slow dynamics                 Subsequently, we took advantage of the infra-slow recording
that co-modulates both limbic and cortical circuits. While the               capability of g-SGFET arrays to characterize topographic infra-
topographic profile of theta power (Fig. 5g) modulation by ISA                slow and spectral AC epicortical signals associated with rare
phase is consistent with anatomical localization of underlying               highly synchronous high-voltage spindle (HVS) oscillations78,79,
hippocampal theta current generators, stronger modulation of the             as the most likely cortical dynamics associated with large infra-
spindle power on posterior cortical areas might reflect anatomical            slow currents, similar to those shown during epileptiform activity
thalamo-cortical subcircuits that are more strongly co-modulated             in development80. Consistent with previous studies78,79, HVS
by ISA dynamics than derived from epicortical DC signal. Finally,            occurrence was associated primarily with alert immobility states
we tested whether g-SGFETs SNR is sufficient to detect                        (IMM) (566 events, Fig. 6a), where IMM is defined as the
fluctuations in the high-frequency LFP dynamics at different                  intersection between inactive and awake states. Benefiting from
time scales and to this end quantified the strength of modulation             the long-term unperturbed recording allowed by our system we
of broad range gamma power (30–200 Hz) by both ISA phase and                 could also sample significant number of HVS events during REM
theta rhythm phase during REM sleep. Gamma power in in the                   sleep (92 events), where they coexisted with hippocampal theta
range of 60-120 Hz was modulated by the ISA phase reaching                   oscillations visible on posterior derivations (Fig. 6b). While
maximum power at the peak of the ISA (~10°) (Fig. 5h-left) and,              median duration of HVS events was comparable in immobility
consistently with published work based on intracranial record-               and REM sleep (~5 s, Fig. 6c-top), the rate of detected HVS events
ings73, high gamma (120–150 Hz) power was modulated by theta                 varied across the recorded 24 h period, (Fig. 6c-bottom).
phase (Fig. 5h-right).                                                       Interestingly, HVS during both brain states were associated with
   Having established that we can record state-selective                     transient infra-slow fluctuations as visible in single examples
epicortical signals with g-SGFETs across a range of brain/                   (Fig. 6a, b) and average profiles (Fig. 6d, e). Specifically, positive
motor states, we subsequently went on to demonstrate                         (putative source) and negative (putative sink) infra-slow tran-
applicability of the technique for linking behavior and cortical             sients in, respectively, posterior and frontal positions on the array
physiology. To this end we focused on a specific and sparsely                 coincided in duration (median 5 s) with oscillatory dynamics of
occurring spontaneous behavior, rearing on the hindlimbs.                    HVS (Fig. 6c, d, e). Topographic profiles of spectral peak power of
Rearing is a exploratory behavior in rodents, which is context-              HVS were comparable for both states and showed maximal
and stress-sensitive74,75, has been hypothesized to support                  increase to baseline in frontal derivations overlaying sensory-
sampling of distal landmarks for construction of a cognitive                 motor cortex (Fig. 6f). REM-associated HVSs were, on average,
model of the surrounding environment75,76 and is implicated                  slower and larger in power than immobility-associated ones
in modulation of cortico-hippocampal interactions in theta and               (Wilcoxon ranksum test, p < 1e-19 for power and p < 1e-8 for
gamma frequencies76,77. In general, due to the sporadic and                  frequency, Fig. 6g). In contrast, spatial structure and magnitude
spontaneous occurrence of rearing events their neural physiol-               of infra-slow fluctuations associated with HVS as expressed by
ogy has been less widely investigated with conventional                      positive fluctuations on posterior and negative fluctuation on
recording methods compared to task-specific trained motor                     frontal DC channels, were comparable for both states (Wilcoxon
actions. Technologies that combine long-term recording                       ranksum test between IMM and REM, p = 0.5 for posterior peak
stability, high spatial resolution, wireless methodology and                 magnitude and p = 0.9 for frontal trough magnitude, Fig. 6h).
precise 3D-tracking of animal behavior, as presented here,                      Although future work is required to replicate these observa-
open the door to investigating this class of phenomena with a                tions in a large cohort of animals, our long-term recordings
great level of detail. Therefore, we took advantage of the                   enabled detailed quantitative analysis of rare physiological
presented technology to collect a large number of individual                 patterns and illustrate the power of this technology. Because of
spontaneous rearing events during a full 24 h period. Evaluat-               their sparse, strongly state dependent occurrence and distribution
ing the signature of rearing on the gamma epicortical activity               over a wide frequency band these events illustrate the class of
band is of additional interest for our study, since it can be used           phenomena whose functional study necessitates the integration of
to illustrate the capabilities of the g-SGFETs in the high-                  neural-behavioiral measurements with both high spatio-temporal
frequency LFP range. In order to robustly detect rearing                     resolution and large spatio-temporal span in freely moving
episodes we took advantage of the continuous 3D tracking,                    animals, as enabled by our wireless electrophysiology system.
detecting rearing events (n = 163) based on head elevation
above ground (see “Methods” and supplementary informa-
tion S6). While rearing events occurred throughout the                       Discussion
recording period, expression of rearing activity was highly                  Graphene active-sensor arrays represent an emerging technology
variable across the day, as with overall motor activity, ranging             in neural engineering, which has recently demonstrated a strong
from 250 s to 0 s spent rearing per hour (mean 43.8 ± 12.1 s,                potential for the production of high-count sensor arrays6,7, as
supplementary information S10). Additionally, rearing events                 well as for wide frequency band neural sensing33. In this article,
expressed variability in terms of height (mean 250,6 ± 2.7 mm,               we have presented a detailed characterization of various technical
see Fig. 5j and Fig. S10d) and duration (mean 5.7 ± 2.8 s, see               aspects required for their actual application, such as the homo-
Fig. S10e).                                                                  geneity in the performance of the graphene sensors, the specifi-
   Having detected this set of spontaneous rearing episodes we               cations required for a dedicated headstage, the limits in the
proceeded to analyze the power spectra of epicortical LFP, which             sensitivity of g-SGFETs or their chronic stability and bio-
showed distinct rearing-associated changes in brain signals for              compatibility in vivo and demonstrated lines of investigation
specific frequency ranges. Rearing was associated with the                    enabled by their technical characteristics.
suppression of epicortical high-frequency (90–200 Hz) activity                  In the first place, we have demonstrated the high yield and
(Fig. 5i), which was also observable on the single trial level across        homogeneity of the g-SGFETs produced in a wafer-scale process
the range of rear heights (Fig. 5j) and most prominently observed            using commercially available CVD graphene. This demonstration

10              NATURE COMMUNICATIONS | (2021)12:211 | https://doi.org/10.1038/s41467-020-20546-w | www.nature.com/naturecommunications
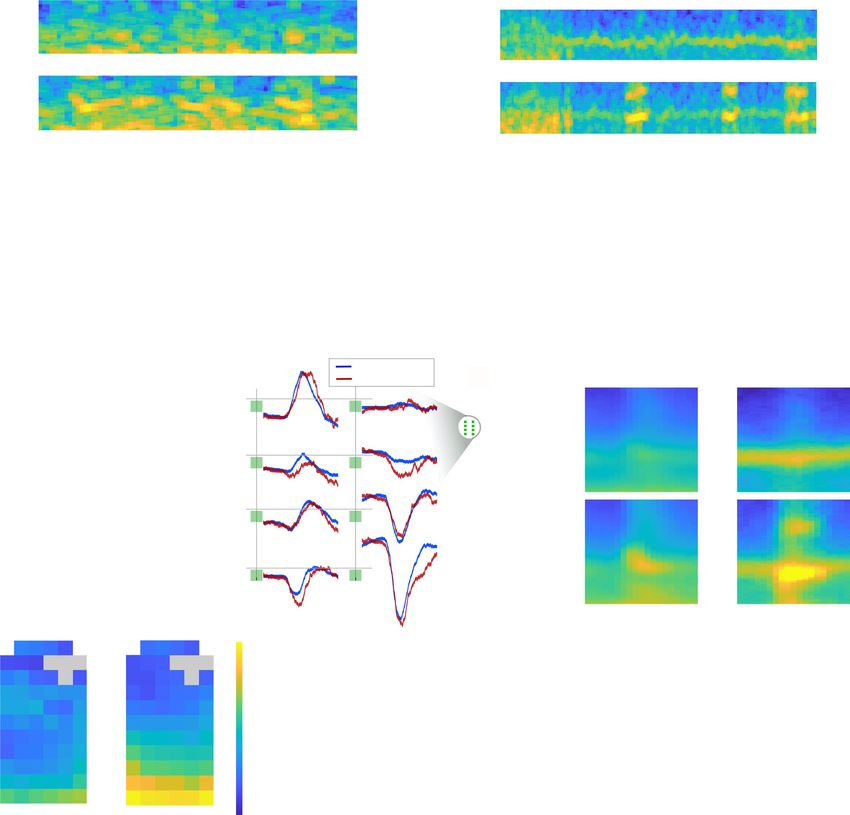
NATURE COMMUNICATIONS | https://doi.org/10.1038/s41467-020-20546-w                                                                          ARTICLE

Fig. 6 Topography of AC and DC dynamics associated with high-voltage spindles. a, b examples of HVS events during immobility (a) and REM sleep (b).
Spectrograms at posterior (top) and anterior (middle) positions on the array visualize dynamics of HVS (vertical lines at onsets) and ongoing oscillatory
dynamics (low-frequency synchrony in IMM, theta oscillation in REM). Bottom two panels show DC LFP signals from posterior (green) and anterior
(brown) positions on the array and head speed. c Distribution of duration of single HVS events for immobility and REM (top) and total hourly duration of
HVS across recorded period (bottom). d Average DC LFP traces triggered on HVS onset during immobility and REM sleep (channels arranged as in Fig. 2g-
left, inset showing anatomical localization of DC ECoG recording sites). e Average AC LFP spectrograms triggered on HVS onset during immobility (left)
and REM sleep (right). The spectrograms at posterior (top) and anterior (bottom) positions on the array contrasting spectral content associated,
respectively, with theta (posterior) and HVS (anterior) oscillations. Pseudo-color, spectral power (a.u.). f Topographic maps of change, relative to baseline,
in HVS power at peak oscillation frequency during immobility (left) and REM sleep (right). g Distributions of power and peak frequency of individual HVS
during immobility (blue) and REM sleep (red). h Distribution of DC fluctuation magnitude at posterior lateral and frontal medial derivations for single HVS
during immobility and REM (color code as in g).

represents an important milestone towards the production of                     process on the sensitivity of the recording system. In this way, we
graphene-based neural probes at an industrial scale. On another                 have identified the challenges in the design of full-band amplifiers
front, the application of graphene transistors for neural sensing               given specific energy and weight constrains for wireless applica-
also requires the development of specific electronic equipment for               tions. Furthermore, using a dedicated headstage we have
biasing the sensors and converting the measured drain-to-source                 demonstrated that the sensitivity of graphene active sensors in the
currents into equivalent voltage signals at the gate. In this study,            ISA band is not significantly affected by the rest of the data-
we have presented a dedicated wireless headstage, which allowed                 acquisition system components. Yet, we observed slow drifts in
describing the impact of the signal amplification and digitization               the measured signals in vivo, which were presumably attributed

NATURE COMMUNICATIONS | (2021)12:211 | https://doi.org/10.1038/s41467-020-20546-w | www.nature.com/naturecommunications                                    11
ARTICLE                                                                NATURE COMMUNICATIONS | https://doi.org/10.1038/s41467-020-20546-w

to adsorption of charged molecules on the graphene channel or                large statistical sample of events. The rate of occurrence during
drifts in the electrode reference potential. These drifts were easily        different brain states could be determined over a 24 h period,
eliminated with a high pass filter at 1 mHz; however, future                  highlighting their occurrence also outside the awake resting state
experiments could explore the functionalization of the graphene              in which they are commonly reported to be selectively occurring.
channel and use of alternative reference electrodes to maintain a            Specifically, we found them prominently expressed during REM
more stable doping level.                                                    sleep83. Having established this bimodal state specificity, we
   Moreover, we have demonstrated the stability of the graphene              analyzed HVS events separately for awake immobility and REM
sensors in vivo by characterizing their sensitivity over 4 weeks. In         sleep. Topographic analysis of the HVS peak power demonstrated
order to determine the stability of the signal quality we have also          that sensory-motor cortical preponderance for these oscillations
evaluated the signals induced by bipolar stimulation in the LFP              is comparable for these two states. In contrast, the large sample
frequency band, demonstrating a rather stable frequency response             size of events in both states allowed to identify a significant dif-
over time. These results suggest that the impedance of glial tissue          ference in both frequency content and power of the HVS between
surrounding the implant does not significantly affect the sensi-              these two brain states. Furthermore, the capabilities to simulta-
tivity of the g-SGFETs in vivo. To conclude the characterization             neously map ISA patterns allowed to determine the distinct
of the device stability, we have evaluated the biocompatibility of           topographic structure of spatially specific infra-slow frequency
graphene devices over 12 weeks via behavioral and histological               components associated with HVS, showing phase-reversal across
markers. These results demonstrate an acute foreign body                     anterio-posterior axis. Importantly, these ISA features were con-
response comparable to platinum-based devices, which returns to              served between REM-sleep and awake immobility, highlighting
values close to those of control animals 12 weeks after implan-              that the underlying origin of the DC signal is related to the HVS
tation. The demonstration of the graphene biocompatibility and               event itself and is independent of the brain state.
long-term stability in a chronic implant represents another                     Future work is required to replicate the presented results in a
important turning point towards the large-scale production of                large cohort of animals, follow them longitudinally and relate the
graphene-based neural probes.                                                surface pattern to intra-laminar and subcortical theta, spindle,
   The experimental validation of this technology opens up many              gamma77 and HVS84 generators. Although we have focused the
opportunities for electrophysiology studies in which having access           attention on epicortical ISA patterns, analyzing their correlation
to unconstrained behavior and multichannel recordings with                   with ISA dynamics across cortical laminae could provide
sensitivity in a wide frequency band is relevant. In this study, we          important insights into the origin and implications of ISA. A
have shown quasi-continuous monitoring of brain activity in long             promising strategy in this direction is to combine the epicortical
recording sessions of up to 24 h, which allowed us to acquire large          arrays presented here with graphene-based depth probes33.
samples of neural activity across unperturbed behavioral and                 Future chronic recordings of depth and large-scale LFP signals
brain states. In combination with 3D-tracking, the wireless                  across behaviors and behavioral states in freely moving uncon-
technology allowed us to explore the relation between neural                 strained animals will lay the foundation for a new qualitative step
activity patterns and behavior events, which occur sparsely over             in the brain dynamics investigation from infra-slow to very fast
time, with sufficient statistical power. In particular, analyzing             frequencies72, contributing to our understanding of the origins of
epicortical LFP signals with respect to rearing behavior we                  ISA dynamics in the context of resting states and default mode
observed differential modulation of the 60–70 Hz gamma                       networks and its links to faster brain dynamics.
and 90–200 Hz high gamma range. While high-frequency                            In summary, the thorough in vitro and in vivo evaluation of the
activity between 90 and 200 Hz was consistently suppressed in                sensing and long-term recording capabilities of graphene active
a topographic manner, no such suppression was observed for the               sensors from a system perspective demonstrates the maturity of
60–70 Hz range, pointing towards distinct behavioral selectivity             this technology and supports its application for the study of ISA
of underlying circuit mechanisms. The determination of                       without sacrificing high-frequency LFP components. In this
frequency-specific power modulation in the gamma range, even                  direction, we have successfully evaluated ISA patterns during
for single rearing events, demonstrates the high sensitivity of the          distinct brain states and the correlation of high-frequency oscil-
system in the high-frequency spectrum of the LFP.                            lations with specific sparsely occurring behaviors. Our results
   In the low-frequency range, we found that infra-slow power                represent an important step towards the broad implementation of
You can also read