Distant Lending, Specialization, and Access to Credit
←
→
Page content transcription
If your browser does not render page correctly, please read the page content below
Distant Lending, Specialization,
          and Access to Credit

                           Wenhua Di and Nathaniel Pattison

Working Paper 2003                                                                         January 2020
Research Department
https://doi.org/10.24149/wp2003
Working papers from the Federal Reserve Bank of Dallas are preliminary drafts circulated for professional comment.
The views in this paper are those of the authors and do not necessarily reflect the views of the Federal Reserve Bank
of Dallas or the Federal Reserve System. Any errors or omissions are the responsibility of the authors.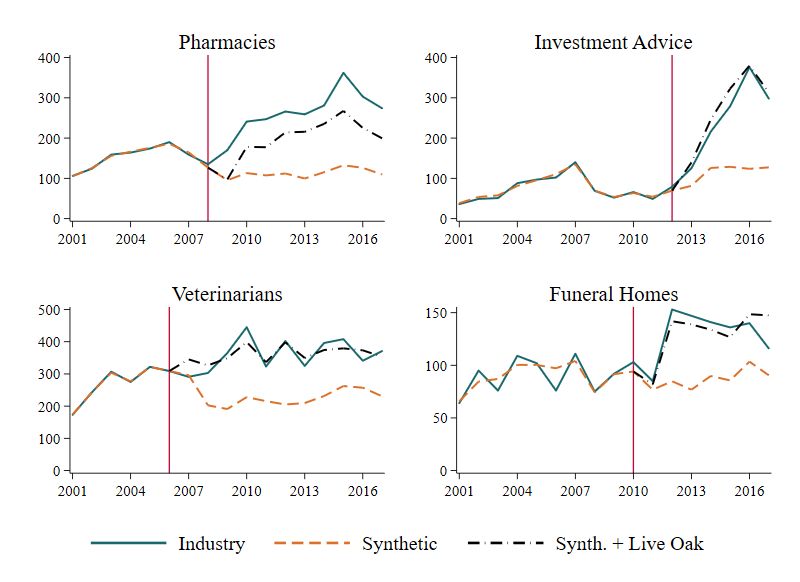
Distant Lending, Specialization, and Access to Credit *

                                 Wenhua Di† and Nathaniel Pattison‡

                                              December 2019

                                                   Abstract

Small business lending has historically been very local, but distances between small
businesses and their lenders have steadily increased over the last forty years. This paper
investigates a new lending strategy made possible by distant small business lending:
industry specialization. Using data on all Small Business Administration 7(a) loans from
2001-2017, we document a substantial increase in remote, specialized small business
lenders, i.e., lenders that originate many distant loans and concentrate these loans within
a small number of industries. These lenders target low-risk industries and, consistent with
expertise, experience better loan performance within these industries. We then examine
whether this industry-specialized lending serves as a substitute or complement to
traditional, geographically specialized lending. We exploit the staggered entry of a remote,
specialized lender to estimate the impact of specialized lending on credit access. Entry
significantly increases total lending, with no evidence of substitution away from other
lenders. The results indicate that specialized lending can deepen credit markets by
providing new loans to low-risk but underfinanced small businesses.

JEL Classifications: G21, G23, L11

Keywords: Small business lending, Banking competition, Specialization, Distance,
Credit access, Technology, Fintech

*The views in this paper are those of the authors and do not necessarily represent those of the Federal Reserve Banks or
the Federal Reserve System. An earlier version of this paper was circulated as “Remote Competition and Small Business
Lending: Evidence from SBA Lending." We thank SungJe Byun, Robert DeYoung, Scott Frame, Janet Garufis, Erik Mayer,
Daniel Millimet, Pia Orrenius, Yichen Su, Gregory Udell, Mike Weiss, brown bag participants at the Federal Reserve Bank
of Dallas and Southern Methodist University, and conference participants at the Federal Reserve System Applied Micro
Conference, the Community Banking in the 21st Century research and policy conference at the Federal Reserve Bank of
St. Louis, the Banking and Finance Workshop at the Federal Reserve Bank of Dallas, the Society for Government
Economists at the 2018 ASSA Annual Meeting, and the Stata Texas Empirical Microeconomics Conference. We thank
Benjamin Meier for his research assistance.
†
 Wenhua Di, Federal Reserve Bank of Dallas, 2200 N. Pearl St., Dallas, TX 75201, wenhua.di@dal.frb.org.
‡
 Nathaniel Pattison, Southern Methodist University, ULEE 301E, Dallas, TX 75275, npattison@smu.edu.

                                                           1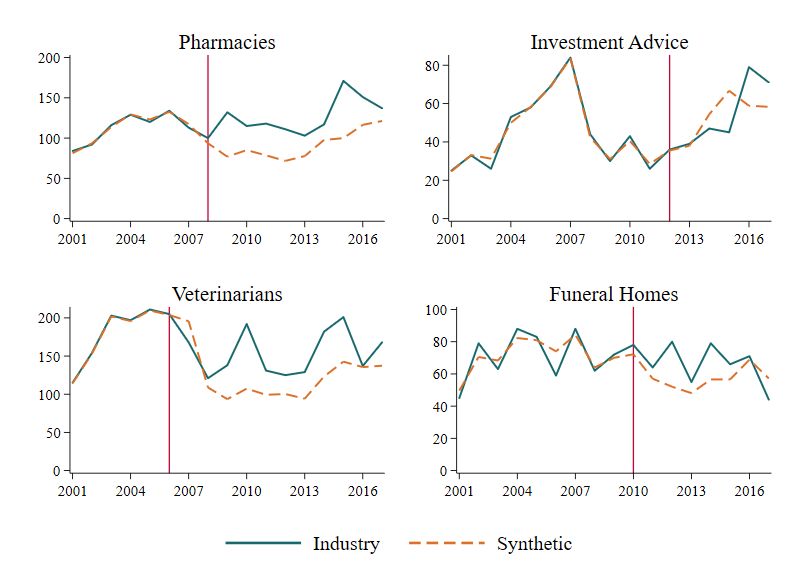
1        Introduction
Distance plays an important role in lending. This is especially true for small business lending, where
little public information is available about firms and the information that does exist is difficult to
acquire and communicate at a distance. Physical proximity aids in the collection and transfer of this
“soft” information, leading to better risk assessment and fewer defaults (Petersen and Rajan, 2002,
DeYoung, Glennon and Nigro, 2008, Agarwal and Hauswald, 2010).1 As a result, small business
lending tends to be very local. The median distance between small businesses and their lenders is
less than 10 miles, and the availability of credit depends on the presence of nearby bank branches
(Nguyen, 2019, Granja, Leuz and Rajan, 2018).
        Borrower-lender distances, however, have steadily increased over the past 30 years. The literature
attributes this increase to technological advances that enable lenders to better collect, transmit, and
process quantifiable or “hard” information.2 Small business credit reports, credit scoring, information
intermediaries, and improvements in information technologies have substantially increased the
availability and use of hard information. More hard information, in turn, decreases lenders’ reliance
on locally collected “soft” information and allows for more distant lending.
        Our paper investigates a related lending “technology” that often accompanies distant lending:
specialization. Local lenders are geographically specialized, lending almost exclusively to nearby
borrowers. However, as lenders expand their reach geographically, the larger set of potential borrowers
provides a degree of freedom that allows the lender to specialize along other dimensions such as
certain products, borrower types, or, for small business lending, certain industries. Specialization
allows lenders to develop expertise, take advantage of economies of scale (e.g. industry-specific
advertising), and focus on industries where distance is less important, thereby offsetting some
disadvantages of distant lending.
        In this paper, we examine distant lending and specialization in the context of small business
lending. Our first contribution is to document the presence and characteristics of remote, industry-
specialized lenders. We show a significant increase in distant small business lending, and then show
that these distant or remote lenders tend to concentrate their loans within fewer industries. These
lenders target lower risk industries and, consistent with expertise, experience better loan performance
in these industries. Our second contribution is to examine whether remote, industry-specialized
lending serves as a substitute or complement to traditional, geographically specialized lending. That
is, do industry-specialized lenders compete for the same borrowers or do they expand credit access
to a new segment of firms? We develop an identification strategy exploiting the staggered entry
of a large, remote lender into specific industries. Using the synthetic control method, we estimate
the impact of this entry on the total availability of credit in these industries and substitution from
other lenders.
    1
     A related literature emphasizes the role of hierarchical distance and communication costs between loan officers
and their superiors within an institution’s organizational structure (Liberti and Mian, 2008, Qian, Strahan and Yang,
2015).
   2
     Liberti and Petersen (2018) provide a recent review.

                                                         2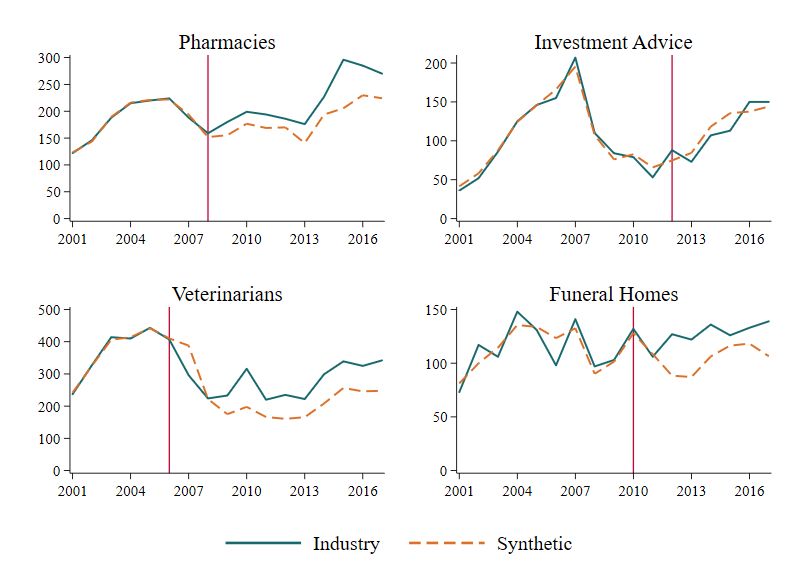
To examine the relationship between remote lending and industry specialization, we use loan-level
data for the universe of Small Business Administration (SBA) 7(a) loans from 2001-2017. SBA
7(a) loans are common, relatively low-cost loans partially guaranteed by the SBA and given to
credit-constrained small businesses.3 The SBA 7(a) data are uniquely well-suited for our analysis, as
they contain loan-level information on each borrower’s location (address), industry (6-digit NAICS
code), as well as the identity of the lender. We merge bank branch locations from the Federal Deposit
Insurance Corporation’s (FDIC) Summary of Deposits (SoD) data to compute the borrower-lender
distance for each loan.
       We begin by documenting new empirical facts about small business lending. In the past two
decades, the share of very distant small business loans (e.g. 100 or more miles) has grown. The
distribution of (log) borrower-lender distance has become increasingly bimodal, with a large share
of local loans and a growing share of very distant (likely online) loans.4 These changes in borrower-
lender distances are not unique to the SBA program. We find similar increases in distance using data
from the Community Reinvestment Act (CRA), which contain information on most small business
loans from larger banks. Second, many lenders making these distant loans tend to concentrate their
lending within fewer industries. That is, the increases in distant lending have been accompanied by
a significant increase in the number of institutions operating as remote, industry-specialized lenders.
These lenders tend to concentrate in industries with lower charge-off rates.
       We then investigate whether industry specialization is associated with industry-specific expertise
in lending, perhaps offsetting the other disadvantages of distant lending. To test this idea, we
examine the relationship between industry specialization and within-industry loan performance. We
first show, as in the prior literature, that the probability of default increases with borrower-lender
distance. Consistent with industry-specific expertise, however, we find a correlation between greater
industry exposure by a lender and lower charge-off rates within that industry. We also find that,
across lenders, industry concentration weakens the positive relationship between lending distance
and charge-off rates, suggesting that greater industry specialization helps offset the disadvantages
of distance.
       The second part of the paper investigates how the rise of remote, industry-specialized lending
affects access to credit. The challenge in identifying the impact of these lenders on credit access
is that remote lending has grown steadily, and we do not know how many loans would have been
originated without this growth. To address this challenge, we develop a strategy that exploits the
staggered entry of the largest remote SBA lender, Live Oak Bank, into specific industries. Live Oak,
a branchless bank based in North Carolina, is among the largest SBA lenders, originating more
than 6% of all SBA 7(a) loans (dollar-weighted) and a significantly larger share in the industries
   3
      In the 2017 Small Business Credit Survey Federal Reserve Banks (2017), 26% of employer small businesses seeking
a loan or line of credit applied for an SBA loan and, among (nonapplicant) employer small businesses already holding
a loan, 17% held an SBA loan. We discuss the size and importance of SBA 7(a) lending in Section 2.2.
    4
      Similar to this change in the distribution, DeYoung et al. (2011) finds that much of the increase in borrower-lender
distances between 1993 and 2001 can be attributed to large increases in distances by banks that adopted credit scoring
technology. Our paper shows that distances continue to increase between 2001 and 2017, and that the increase during
this later period is driven by a sizeable growth in very distant loans.

                                                            3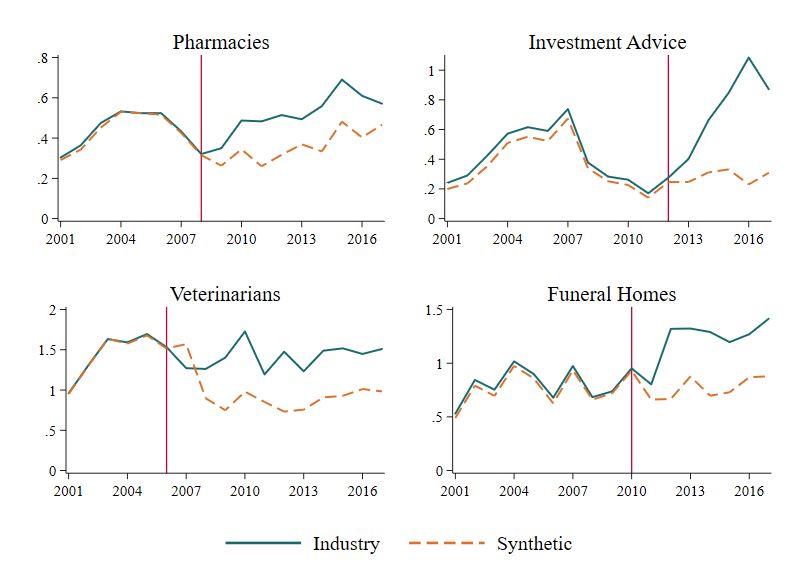
in which it operates. Moreover, it exhibits the two key features of remote, industry-specialized
lenders: (i) Live Oak gave 95% of its SBA loans to borrowers 100 or more miles from its single
office in North Carolina, and (ii) more than 80% of its loans were to just six of the more than 800
industries receiving SBA loans and describes industry-specific expertise as its primary advantage.
Upon entering an industry, Live Oak generates a sharp increase in remote lending, providing 12-58%
of all post-entry SBA loans to these industries.
The combination of Live Oak’s size and staggered entry into specific industries allows us to
estimate the impact of a sharp increase in remote lending on the total volume of lending and
substitution away from other lenders. Our identification strategy compares changes in total lending
in these “treated” industries (i.e. the industries that Live Oak enters) to changes in lending to a
group of control industries that Live Oak did not enter. Instead of choosing comparison industries
subjectively, we employ the Synthetic Control Method (SCM), developed in Abadie and Gardeazabal
(2003) and Abadie, Diamond and Hainmueller (2010), to systematically construct a synthetic
industry match for each treated industry and compare post-entry changes between the treated
industry and this synthetic control. The key identification assumption is that the timing of entry
by Live Oak into a specific industry does not coincide with other changes affecting lending to the
treated industries. This would be violated, for example, if Live Oak enters industries that are about
to experience unusual growth. We support the identification assumption with information about
the determinants of Live Oak’s entry decisions and several falsification tests.
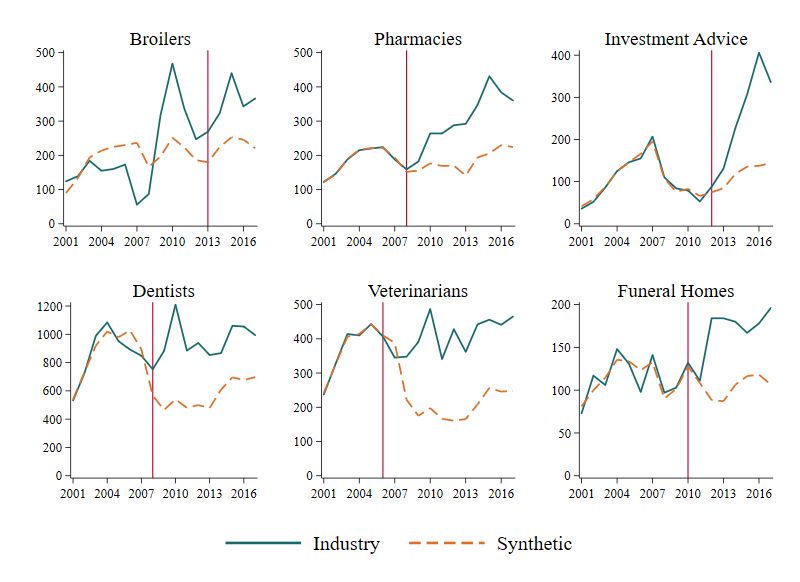
Our results indicate that entry by this remote, industry-specialized lender significantly increased
total lending to these industries. We find sharp increases in total SBA loans to the “treated”
industries after Live Oak’s entry, relative to the synthetic control. Moreover, we find no evidence
of substitution away from other SBA lenders. Other institutions’ SBA lending to these industries
remains unchanged upon Live Oak’s entry, suggesting that remote, industry-specialized lending
provides loans to borrowers who would not have obtained a loan otherwise.
One potential concern is that the increased SBA lending to these industries may reflect substitu-
tion away from non-SBA alternatives, which we do not observe in our main sample. We empirically
investigate substitution from non-SBA lenders using a proxy for total (SBA and non-SBA) lending
within each industry: counts of financial statements collected as a part of the loan application and
monitoring process. These counts are from The Risk Management Association’s (RMA) eStatement
Studies, in which hundreds of financial institutions including 9 of the 10 largest banks submit
borrower and applicant financial statements, and provide a measure of total (SBA and non-SBA)
lending activity by industry. Using this proxy, we again find no evidence of substitution away from
other lenders. When Live Oak enters, other lenders continue to report similar numbers of financial
statements from firms in those industries. A lack of substitution from non-SBA lending is consistent
with our earlier results and with institutional features limiting such substitution. Our main analysis
finds no substitution from other SBA lenders, so substitution from less similar, non-SBA lenders is
likely to be small. Moreover, the ability to switch from non-SBA to SBA lending is limited by the
SBA 7(a) program’s “credit elsewhere” test, which requires lenders to certify that SBA borrowers
4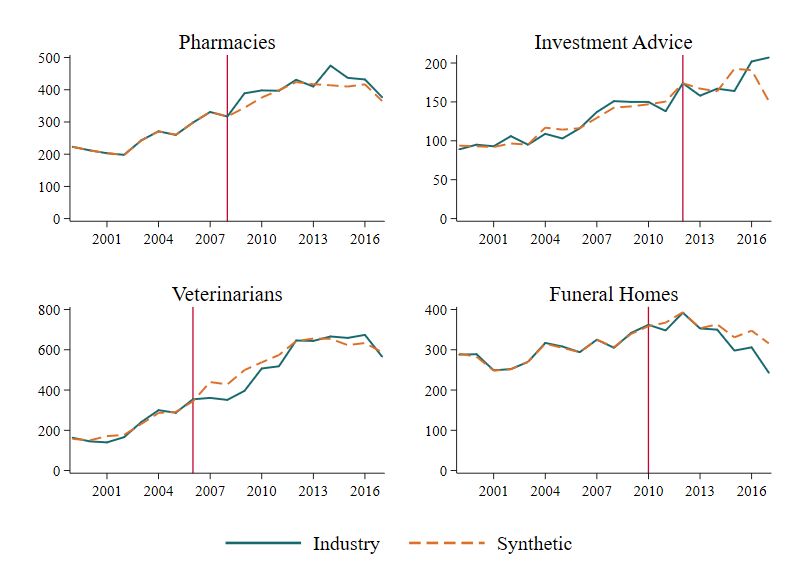
would be unable to obtain a loan with reasonable terms outside of the SBA program.
       The results suggest that Live Oak extends loans to borrowers who would not have otherwise
obtained a loan. Moreover, these new borrowers appear to be low-risk; very few (0.08%) of these
loans are charged-off within 3 years of origination. We investigate how Live Oak’s industry selection
and industry expertise can lead to new borrowers with better loan performance. We find that Live
Oak selects industries with lower charge-offs and with a weaker relationship between distance and
charge-offs. These differences in the relationship between distance and charge-offs are not priced
into interest rates by other lenders. Additionally, consistent with industry expertise, Live Oak
experiences lower charge-off rates than other lenders in the same industries. Thus, the bank focuses
on industries with lower charge-off rates, where the disadvantages of distant lending are weaker, and
then identify low-risk borrowers within these industries. Overall, our analysis shows that industry
specialized lending has the potential to deepen credit markets by providing new loans to low-risk
but underfinanced small businesses.
       This research adds to several strands of the literature. The first studies industry or sectoral
specialization by banks. Winton (1999) and Stomper (2006) provide models of sectoral expertise
and lending, demonstrating that sectoral specialization can be optimal for a bank (relative to
diversification) if it facilitates industry expertise and improves monitoring. The related empirical
literature generally finds that sectoral concentration by banks increases returns and reduces risk.5
These papers use bank-level data on charge-offs and returns and measure sectoral specialization
across fewer than 30 broad industry categories. An advantage of our data is that it contains
loan-level information on the detailed industry (NAICS code for more than 800 industries) and
whether the loan was charged off. This more detailed information allows us to examine differences
in specialists’ industry-specific charge-off rates, rather than bank-level charge-off rates as in the
existing literature.
       Second, our paper connects this research on industry specialization to the literature on the role
of physical distance in lending. Since it is difficult to assess the creditworthiness of small businesses,
lenders have relied on relationships with borrowers and “soft” information (Berger and Udell, 1995,
Petersen and Rajan, 1994). A large theory literature examines the role of physical distance and
information in banking competition (Sharpe, 1990, Rajan, 1992, Dell’Ariccia and Marquez, 2004,
   5
     Acharya, Hasan and Saunders (2006), using Italian bank-level data and exposure to 21 industry categories, finds
that sectoral concentration increases returns and reduces risk, but only for high-risk banks (those with many doubtful
or non-performing loans). Hayden, Porath and Westernhagen (2007), using German bank-level data and exposure
across 23 sectors, also finds that concentration generally improves returns and loan performance. Similarly, Boeve,
Duellmann and Pfingsten (2010) and Jahn, Memmel and Pfingsten (2016), using German bank-level data, find that
sectoral specialization leads to better monitoring and fewer write-offs. Tabak, Fazio and Cajueiro (2011), using
Brazilian bank-level data and exposure to 21 economic sectors, finds that sectoral concentration increases banks’
returns and lowers default risk. Dincbas, Michalski and Ors (2017) use interstate banking deregulation to identify
the impact of entry by banks more familiar with certain industries based on the industry compositions of the bank’s
original location. With state-level data on employment and output across 19 sectors, they find that, when a U.S. state
that is highly exposed to an industry allows bank mergers with a state that is less exposed to that industry, there is
subsequent growth of the industry in the less-exposed state. In contrast, using an international sample of large banks
and inferring banks’ concentration across 10 sectors, Beck, De Jonghe et al. (2013) find that concentration increases
risk without raising returns.

                                                          5
Von Thadden, 2004, Hauswald and Marquez, 2006, Frankel and Jin, 2015). Several empirical papers
provide evidence that physical proximity facilitates information collection, lowers transaction and
monitoring costs, and improves loan performance (Petersen and Rajan, 2002, Berger et al., 2005,
Degryse and Ongena, 2005, DeYoung, Glennon and Nigro, 2008, Agarwal and Hauswald, 2010,
DeYoung et al., 2011, Loutskina and Strahan, 2011, Granja, Leuz and Rajan, 2018). Our paper
documents that some disadvantages of distant small business lending can be offset by the ability to
specialize along other firm dimensions, namely industry.
Third, our paper relates to the literature examining entry and competition in lending and the
effects on credit availability, particularly as it relates to local and distant lenders. Detragiache,
Tressel and Gupta (2008) and Gormley (2014) provide models examining lending competition by
local and distant firms, and in particular, when foreign lenders compete with domestic banks. Entry
by these distant lenders can either increase lending to new borrowers, cause little change in total
lending, or induce a segmented credit market in which total lending falls. Empirically, in the context
of countries’ financial liberalization, papers find mixed effects. Entry by foreign lenders sometimes
reduces access to credit (Beck and Peria, 2010, Detragiache, Tressel and Gupta, 2008, Gormley,
2010) and sometimes increases access to credit (Giannetti and Ongena, 2009, 2012, Bruno and
Hauswald, 2013, Claessens and Van Horen, 2014).
Finally, our investigation of distant, largely online lending and its impact relates to a growing
literature that investigates the unique features of online FinTech lenders and their impact on access
to credit. In mortgage lending, Buchak et al. (2018) and Fuster et al. (2019) examine the rapid
growth of mortgage originations by shadow banks and FinTech lenders. Another set of papers
examines whether P2P lenders are substitutes or complements for traditional banks. Tang (2019),
De Roure, Pelizzon and Thakor (2019), and Wolfe and Yoo (2018) all find evidence that P2P
lenders and banks are substitutes, competing for an overlapping set of borrowers. Jagtiani and
Lemieux (2017) find some evidence that peer-to-peer loans are more common in areas underserved
by traditional banks.6
The paper proceeds as follows. Section 2 provides background information on local and remote
lenders, discusses the SBA 7(a) program, and describes the data. Section 3 examines the relationship
between distance, loan performance, and industry concentration among SBA lenders. Section 4
examines a case study of entry by Live Oak, the largest remote, specialized lender, in order to assess
the impact of industry specialization on credit availability. Section 5 concludes with a discussion of
our results, external validity, and broader implications.
2 Background, Setting, and Data
This section first provides more information on local lenders and the potential advantages of industry
specialization. We then discuss SBA 7(a) lending and the main data used in our analysis.
6
Outside of lending, Goodman, Melkers and Pallais (2019) find that an online college program complements
traditional education and could satisfy unmet demand for computer science training.
62.1 Background: Local Lenders and Industry Specialists
Most small business lenders are local lenders, i.e. geographic specialists. Both small and large banks
typically define their markets as the area around their physical branches and the median borrower
distance from the lender’s branch is less than 10 miles (Agarwal and Hauswald, 2010, DeYoung,
Glennon and Nigro, 2008, Granja, Leuz and Rajan, 2018).7,8 Economic theory provides multiple
reasons for this geographic proximity. Local lenders can use repeated interactions and relationships
to collect and transfer “soft” information about firms, giving them an advantage over distant lenders
(Berger and Udell, 1995, Petersen and Rajan, 1994, 2002). Even without information frictions,
distance-related transaction costs associated with originating and monitoring a loan can lead to
local lending (Degryse and Ongena, 2005). Additionally, local lenders may also be better informed
about local economic conditions and their effect on a firm’s profitability.
Alternatively, lenders may specialize along a non-geographic firm characteristic, namely industry.
For most industries and geographic markets, the pool of potential borrowers would be too small for
a lender to focus on specific industries within a local area (e.g. veterinarians within 20 miles), so
we view geographic and industry specialization as alternatives. Industry specialization may offer
two advantages for identifying profitable or low-risk borrowers. First, industry-specialized lenders
can select industries with lower risks or less competitive markets. Second, industry specialization
may facilitate expertise that offset the informational disadvantages of lending at a distance. More
experience in the industry may improve a lender’s ability to screen borrowers (e.g. through industry-
specific underwriting). For example, United Community Bank, an SBA lender with substantial
online lending, reports that it mitigates the risk of “working with more borrowers it doesn’t know
well” by “originating SBA loans only within specific industries it has decided to cultivate after
studying them carefully” (Schneider, 2016). Additionally, there may be industry-specific investments
or economies of scale. For example, a lender could hire industry experts to screen applicants, lower
borrower-acquisition costs through industry-specific advertising, or even provide consultancy for
business development. The remainder of the paper investigates the rise of industry-specialized
lenders, their loan performance, and the impact of this lending strategy on access to small business
loans.
7
The 2018 FDIC Small Business Lending Survey (Federal Deposit Insurance Corporation, 2018) surveyed ap-
proximately 1,200 banks, both small (assets less than $10 billion) and large (assets greater than $10 billion), about
their geographic market relative to their physical branch locations. Among small banks, 73.8% have a geographic
market within the city or county of their branches, and an additional 16.9% have a geographic market within their
metropolitan statistical area (MSA) or state. Large banks have wider geographic areas, with 20.5% viewing their
geographic market as the county of their branches, 18.3% at the MSA-level, and 42.8% at the state level. Only 18.4%
of large banks report the geographic market as national (or other).
8
Agarwal and Hauswald (2010), using application-level data from a leading small business lender, finds a median
distance from the firm to the bank branch of 2.62 miles for originated loans. Granja, Leuz and Rajan (2018) uses data
from the Community Reinvestment Act to calculate the median distance between borrower’s county and the county of
the closest lender’s branch. The median distance in 2016 was 6 miles. Using SBA 7(a) data to DeYoung, Glennon and
Nigro (2008) calculates the median distance between a borrower and the lending office (rather than the closest branch)
of the lender. The median distance to the lending office increased from 5.89 miles in 1984 to 21.28 miles in 2001.
72.2 Setting: SBA 7(a) Lending
Our setting for examining distance, industry specialization, and competition is the market for loans
guaranteed by the Small Business Administration. The Small Business Administration is a federal
agency tasked with helping to start, build, and grow small businesses. One way the SBA seeks to
support small businesses is through its 7(a) lending program, which provides guarantees for loans to
credit-constrained small businesses.9 Our paper focuses on lending within the SBA 7(a) program,
and the primary advantage of this setting, as we discuss in detail in Section 2.3, is that we observe
detailed information about each borrowers’ industry and location for the universe of 7(a) loans from
2001-2017.
SBA 7(a) lending is an important source of financing for small businesses, particularly for
larger loans and small businesses with employees. In 2017, SBA 7(a) originated more than 60,000
loans totaling $25.45 billion. For comparison, total small business lending reported through the
Community Reinvestment Act in 2017, a widely used measure of small business lending, was $242
billion. Thus, SBA 7(a) lending amounted to 10% of CRA reported lending.10 Relative to the loans
reported in the CRA, SBA loans tend to be large.11 For loans less than $100,000, SBA 7(a) loans
amount to less than 1% of CRA loans. However, for the larger loan size categories ($100,000-$1
million), SBA 7(a) loans amount to 5-7% of the number of loans and 4-6% of the dollar volume.
We cannot compare large loans, since the CRA does not include loans of more than $1 million.
However, loans for more than $1 million have accounted for more than 50% of SBA 7(a) lending
dollars each year since 2011.
SBA 7(a) lending is an especially common source of financing among small businesses with
employees. Of the 30 million small businesses in the U.S., only 20% have one or more employees
(Mills and McCarthy, 2016). SBA 7(a) loans are often made to these employer businesses, reflecting
a primary goal of SBA lending, job creation.12 In the 2017 Small Business Credit Survey (Federal
Reserve Banks, 2017), a survey of over 8,000 small businesses with 1-499 employees, 26% of employer
small businesses seeking a loan or line of credit applied for an SBA loan. Of those that already held
loans and did not apply in the last year, 17% held an SBA loan or line of credit. Thus, our analysis
of SBA lending accounts for a non-trivial share of small business financing, particularly for larger
loans and employer small businesses.
9
The SBA also has a 504 loan program. We focus on 7(a) loans because they are the SBA’s flagship program and
also because the specific bank we focus on in the case study provides almost no loans in the SBA 504 loan program.
10
These loan amounts are not directly comparable, as CRA data do not include loans for more than $1 million
while SBA 7(a) statistics do and the CRA only collects information from banks with assets over $1 billion. These
larger institutions represent 70% of all outstanding small business loans made by banks (Haynes and Williams, 2018).
In the CRA, small business loans are defined as those with original amounts of $1 million or less and were reported on
the institution’s Call Report or Thrift Financial Report as either “Loans secured by nonfarm or nonresidential real
estate” or “Commercial and industrial loans.”
11
Appendix Figure A.1 shows the ratio of SBA 7(a) to CRA lending across the three loan size categories available
in the CRA: loans less than $100,000, loans between $100,000 and $250,000, and loans between $250,000 and $1
million. Between 2004 and 2005, the asset threshold for CRA reporting increased from $250 million to $1 billion,
which changed the set of institutions reporting. After 2005, the threshold continued to be adjusted for inflation.
12
In the 1990-2009 matched sample of SBA 7(a) borrowers in Brown and Earle (2017), the median number of
employees among SBA 7(a) borrowers is seven and the mean is 14.
8To qualify for an SBA 7(a) loan, the borrower must run a for-profit business that meets SBA
industry-specific size standards. Additionally, the borrower must be unable to obtain a loan
elsewhere on “reasonable terms.”13 Lenders must document why the borrower could not obtain
a loan on reasonable terms without the SBA guarantee and must review the personal resources
of any applicants owning more than 20 percent of the small business. The loans can be used for
working capital, expansions, to purchase a business or franchise, to buy commercial real estate, or
to refinance debt.
The capital for loans in the SBA 7(a) program is provided by private lenders, which are mostly
commercial banks, though there are also credit unions and other non-bank lenders. Lenders make
most decisions regarding the SBA loans (subject to underwriting rules of the SBA such as a
maximum interest rate and borrower requirements). Depending on a lender’s experience, the SBA
either re-analyzes the lender’s underwriting decisions or delegates them to the lender. The Preferred
Lender Program (PLP) status, given to the most experienced SBA lenders, allows a lender to make
all underwriting and eligibility decisions. These PLP lenders make more than 80% of SBA 7(a)
loans.
The SBA provides the lender with a partial guarantee for the loan that, in the event of default,
reimburses the lender for a share of the amount charged off. The maximum guarantee is 85% for loans
up to $150,000 and 75% for loans exceeding $150,000 (with a maximum guarantee of $3.75 million
for a standard 7(a) loan).14 In exchange, the SBA charges lenders a fee that depends on the features
of the loan and the amount guaranteed. SBA lenders still face default risk and invest in screening
borrowers. First, the SBA only provides a partial guarantee. Second, as a means of ensuring
quality underwriting, the SBA reviews lenders’ decisions and can increase monitoring if portfolio
performance is weak. Finally, SBA borrowers are those who, according to the “credit elsewhere”
requirement, are not able to obtain conventional loans and so are likely to be riskier borrowers
or have less collateral. DeYoung, Glennon and Nigro (2008) and DeYoung et al. (2011) provide
empirical evidence of the importance of credit-screening, default, and information asymmetries in
lending through the SBA program.
2.3 Data: SBA 7(a) Loan Data Report
Our main analysis uses data from the SBA 7(a) Loan Data Report.15 The SBA data are uniquely
well-suited for our analysis, as they contain detailed information on the two key variables: industry
and location. The data contain information on the loans (approval date, amount, term, repayment
13
Temkin (2008) surveyed 23 banks that originate SBA loans about their application of the “credit elsewhere”
requirement, and the surveys suggest that “the lenders are aware of the credit elsewhere requirement and adhere
to the requirement.” Lender representatives report that most SBA applicants are referred to the program if (i) the
business shows insufficient net operating income to obtain a conventional loan, (ii) the collateral is limited, or (iii) the
borrower does not have sufficient equity for the down payment.
14
There have also been a few policy changes in SBA lending during the period we study. In particular, after the
Great Recession dramatically reduced the supply of small business loans, Congress passed the Recovery Act in 2009
and raised the SBA loan guarantee to 90 percent and removed the guarantee fee, which revived the SBA loan program.
Since these changes affect all industries similarly, they will be captured by the time controls in our empirical strategy.
15
We drop loans that were approved but canceled before origination.
9status), small businesses (address, NAICS industry code), and lenders (name, headquarter location).
Interest rate information is available beginning in 2008.
For each loan, we calculate the distance between the SBA borrower and the closest branch
of the institution making the loan. To determine branch locations, we use the Federal Deposit
Insurance Corporation’s (FDIC) Summary of Deposits (SoD), which contains branch location data
for all FDIC-insured institutions from 2001-2017. We link the SBA 7(a) lending institutions to
these branch networks using fuzzy matching, as lender names in the two datasets often do not
exactly match. We are able to match 92% of the borrowers to institutions, and the majority of the
unmatched institutions are credit unions or non-bank lenders, which are not FDIC-insured. Then,
for these borrower-institution matches, we use the Census Geocoder to determine the latitude and
longitude of the borrower’s listed address and are able to generate latitude and longitude coordinates
for 72%.16 Finally, we calculate the distance between each matched borrower and the closest branch
of the institution originating the loan. Appendix B provides more details on the matching procedure
and how we calculate distance. Our analysis sample consists of these loans from FDIC-insured
institutions (banks) for which we can calculate the distance from the borrower to the closest branch.
Our first analysis in Section 3 focuses on the relationship between industry concentration and
borrower-lender distance. Our sample for this analysis consists of all SBA 7(a) loans from 2007-2017,
the period when remote lending became increasingly common. Panel A of Table 1 reports the
summary statistics of the 2007-2017 matched SBA 7(a) loans used in Section 3. SBA 7(a) loans
had a median size of $80,000 (mean $267,000), median term of 84 months (mean 104 months),
and median interest rate of 6% (mean of 6.21%). The median borrower-lender distance was 2.02
miles, although the mean distance was 72.24 miles, indicating that distances are skewed to the
right. Finally, the mean three-year charge-off rate (i.e. the share charged off within three years of
origination) is 6%.
To examine differences across institutions, we also form a sample consisting of 2007-2017
institution-year observations. We restrict the sample to institution-years that originated at least
ten SBA loans and were matched to the FDIC bank branch data. These institutions make up 93%
of SBA 7(a) lending during our sample period. Panel B of Table 1 reports the summary statistics.
The median number of SBA loans per institution-year is 22 (mean 90.2). Most institutions are local
lenders. The median institution lending distance is 3.81 miles (mean 40.6 miles) and the median
share of loans given to borrowers located 100 or more miles from the closest branch is 0 (mean
9%). Our primary measure of an institution’s industry concentration is its top-five share, defined
as the share of the institution’s loans extended to its five most common industries.17 The median
16
Our results, however, are also robust to using a lending distance measure based on the county centroid of the
borrower’s project (firm), which is available for all borrowers with a matched lending institution (Table A.4 Column
5).
17
Businesses from more than 800 distinct 5-digit NAICS codes received SBA loans in our sample. To form the
top-five share, we index institution b’s industry shares in year t Sibt
Pin decreasing order from the largest share S1bt to
the smallest SIbt . The top-five share for institution b in year t is 5i=1 Sibt . Since we want to capture specialization,
we drop the industry “limited-service restaurants” when calculating top-five share. “Limited-service restaurants” are
the most common SBA industry and make up 9.5% of all SBA loans. Among the other industries, none make up
more than 2.2% of SBA loans. The qualitative features of the results in the section are not affected by including
10institution’s top-five share is 0.42 (mean 0.43). As a second measure of industry concentration, we
calculate a Herfindahl-Hirschman Index (HHI) for lender b in year t. The industry HHI for lender
P 2
b in year t is defined as HHIbt = i Sibt , where Sibt is the percent of lender b’s loans given to
industry i in year t. The HHI is increasing in industry concentration and takes a value from close
to 0 (least concentrated) to 10,000 (all loans to a single industry). In our sample of institution-year
observations, the median industry HHI is 859 and the mean is 986.
To investigate whether distances in SBA lending are representative of distances in small business
lending more broadly, we supplement our sample with data from the Community Reinvestment Act
(CRA). The CRA data reflect the broader small business lending market, reporting the volume and
borrower location (county) of small business lending for all commercial and savings banks with total
assets above $1 billion.18 However, unlike the SBA data, the CRA data do not contain information
on the industries of small business borrowers, so our main analysis of industry concentration relies
on data from the SBA. We replicate our distance measure in the CRA data by calculating the
distance between the center of the borrower’s county and the closest branch of the bank originating
the loan. Since SBA 7(a) loans are most comparable to the larger CRA reported loan categories, as
shown in Figure A.1, we calculate distance statistics using CRA loans above $100,000.
3 Lending Distance and Industry-Specialization
This section examines the relationship between remote lending and industry specialization. We first
provide evidence of the growth in distant small business lending and industry-specialized lending.
We then examine the relationships between distance in lending, industry-specialization, and loan
performance.
3.1 Changes in Borrower-Lender Distance
We begin our analysis by examining changes in distances between borrowers and lenders over the
last twenty years. Figure 1 plots the average distance between the borrower and lender from 2001
to 2017 for both SBA 7(a) loans and loans reported in the CRA data. Both sources show that the
average lending distance increased from less than 50 miles in 2001 to more than 150 miles in 2017.
The steady increase in average (and median) lending distance over the last three decades has been
documented in several papers (Petersen and Rajan, 2002, DeYoung et al., 2011, Granja, Leuz and
Rajan, 2018).19
Our focus is on the changes in remote or very distant lending. Figure 2 plots the distribution of
(log) borrower-lender distances for SBA 7(a) loans (panel a) and CRA loans above $100,000 (panel
“limited-service restaurants” or by excluding additional common industries.
18
Prior to 2005, the threshold for reporting was assets above $250 million. In 2005, it was increased to $1 billion
and has been inflation-adjusted since that time.
19
Granja, Leuz and Rajan (2018) focuses on the cyclicality of lending distance; loan distances increase during boom
periods and decline during busts. The sample for our Figure 1 excludes CRA loans for less than $100,000. If we
include these loans, our figure matches the cyclical fluctuations reported in Granja, Leuz and Rajan (2018).
11b) for 2001 and 2017, the first and last years in our sample. The figure reveals two striking features.
First, much of the difference in borrower-lender distances is from an increased number of remote
loans, i.e. those with more than 100 miles between the borrower and lender. Between 2001 and
2017, the median lending distance increased from 1.7 miles to 2.5 miles, while the 90th percentile of
lending distance increased from 22 miles to 604 miles.20 Second, most lending is still largely local.
Even in 2017, 71% of loans had a borrower-lender distance of less than 10 miles.
3.2 Remote, Industry Specialists
The premise of our paper is that distant lending allows lenders to specialize along other dimensions,
namely industry. We examine the relationship between institutions’ borrower-lender distance and
industry concentration. To compare changes over time, Figure 3 shows this relationship for three
periods. The figure plots an institution’s (log of) median borrower-lender distance against its top-five
industry share, defined as the share of the institution’s loans extended to its five most common
industries. The figure highlights two facts about distant lending and industry concentration. First,
in all periods, there is a positive relationship between distant lending and industry concentration.
For example, in the 2013-2017 period, institutions with a median borrower-lender distance less
than 10 miles have an average top-five share of 23%, while lenders with a median borrower-lender
distance of more than 100 miles have an average top-five share of 40%. We examine this relationship
between distance and concentration more formally in Section 3.2.3.
Second, comparing the three periods in Figure 3 reveals an increasing number of remote, industry
specialists, i.e. institutions with a high degree of both distant lending and industry concentration.
To illustrate this, we mark institutions that have a median borrower-lender distance greater than 100
miles and top-five share exceeding 32% (the 90th percentile in the 2001-2007 period) as solid circles.
Over the three periods, the number of these institutions meeting these criteria increased from seven
to 21. That is, Figure 3 shows that distant lending is associated with greater industry concentration,
and the number of institutions adopting this remote specialist lending model is increasing over
time. In the remainder of this section, we examine these two facts more formally and document the
characteristics of remote specialists and the industries in which they specialize.
3.2.1 Characterizing Remote, Industry Specialists
Remote, industry specialists lend to distant borrowers but concentrate lending in few industries.
Institutions engage in these practices to varying degrees, and there is not a specific threshold that
separates remote specialists from others. However, in this section, we adopt a specific classification
20
Online Appendix Figure A.3 shows changes in the median, 75th percentile, and 90th percentile of borrower-lender
distance for 2001-2017. The rise of remote lending can also be seen by looking at the largest lenders. For the fiscal
year 2016, four of the top ten national SBA lenders (by total loan amount) had branches in two or fewer states, three
of which (Live Oak Banking Company, Newtek Small Business Finance, and Celtic Bank Corporation) have only
a single location. Additionally, some remote lenders are older community banks that have adopted a large online
presence, e.g Carver State Bank founded in 1927, Evolve Bank & Trust founded in 1925, The Bankcorp Bank founded
in 1876 each gave more than 85% of its loans to remote borrowers.
12of a remote, industry-specialized lender in order to examine the growth and characteristics of this
lending model. We classify a lender as a remote specialist if its median borrower-lender distance
exceeds 100 miles and its top-five industry share exceeds 32% (the 90th percentile of the top-five
share during the 2001-2007 period). The qualitative patterns are not affected by using alternative
thresholds.
The lenders classified as remote specialists according to this definition are shown as solid circles
in Figure 3. We examine annual changes in the number of remote specialists by calculating distance
and concentration for each institution annually (rather than over a 5-6 year period as in Figure 3).
Figure 4 shows that between 2001 and 2017 the number of lenders classified as remote specialists
increased from less than 10 to more than 40. Similarly, the percent of SBA loans (in dollars)
accounted for by remote specialized lenders increased from less than 1.6% in 2001 to 17.4% in 2017.
3.2.2 Characteristics of Selected Industries
We also examine the specific industries chosen by the specialized lenders. We report detailed
tables in the Online Appendix and summarize this information here.21 Among the 21 lenders
classified as remote specialists in the 2013-2017 period, the average of the median borrower-lender
distance is 677 miles and the average top-five share is 58%. We consider a lender to specialize in
an industry if the industry receives at least 10% of its loans. By this definition, these institutions
specialize in 15 different industries. Hotels and gas stations are most commonly selected, and
health professionals (chiropractors, dentists, pharmacists, and veterinarians) and financial or legal
professionals (insurance agencies, investment advisers, and lawyers) are also common. There is also
a variety of other industries, including funeral homes, bakeries, and day care services. While remote
specialists originate a significant share of their loans to these industries, these industries make up a
relatively small share of total SBA lending. At an extreme, Carver State Bank originates 93% of its
loans to Insurance Agencies and Brokerages, but this industry receives less than 1% of all SBA loans.
On average, the specialized institutions originate 27% of their SBA loans to their chosen industry.
While these industries make up a significant share of specialists’ lending, the industries do not make
up a large share of all SBA lending. The average chosen industry receives only 1.2% of all SBA
loans. Thus, specialists give loans to their chosen industries at roughly 25 times the average rate.
How do specialists select industries? Many of the chosen industries have low charge-off rates.
The average three-year charge-off rate (from 2007-2012) for all industries receiving SBA loans
was 7.5%, while the average charge-off rate for industries chosen by specialists (weighted by the
number of specialists) is 2.8%. Thus, specialists focus on industries with better historical loan
performance. To examine whether selected industries differ in other characteristics, we also gathered
industry characteristics from The Risk Management Association (RMA) and IBISWorld Industry
Reports, which provide detailed information about market characteristics, industry conditions,
21
In Online Appendix Table A.1, we list the 21 specialized lenders in the 2013-2017 period, along with their median
borrower-lender distance and top-five share. We also list the institutions in which they specialize in Online Appendix
Table A.2.
13and characterizes industries along ten dimensions. Relative to the fifteen most common industries
receiving SBA loans, the specialists’ industries tend to have higher capital intensity and greater
regulation. Additionally, they have greater industry assistance, defined as protection, direct or
indirect government assistance, and support from associations and trade groups. The ability for
a lender to contact or advertise in industry-specific publications or venues may be an important
component of remote specialization.
3.2.3 Borrower-Lender Distance and Industry Concentration
This section more formally examines the positive relationship between lending distance and industry
concentration that is shown in Figure 3. We estimate the following regression for institution b in
year t:
top-fivebt = α + βlog(med. distance)bt + Controlsbt + τt + bt (1)
The dependent variable top-fivebt is institution b’s top-five share in year t. The variable log(med. distance)bt
is the log of the institution’s median borrower-lender distance in year t and β captures the relationship
between remote lending and industry concentration. We also examine the sensitivity to alternative
measures of industry concentration and lending distance. The specification also includes year fixed
effects (τt ), which capture shocks that are common to all lenders, such as changes in market-level
industry composition or common economic shocks affecting lending. In some specifications, we also
add Controlsbt , a set of lender-specific controls (lender volume ventiles or lender fixed effects). To
account for serial correlation within a bank over time, standard errors are clustered at the bank
level.
Table 2 reports the estimates from specification 1. Column 1 confirms the positive relationship
between an institution’s lending distance and its industry concentration. The coefficient of 0.0244
(significant at 1% level) indicates that a one standard deviation (152 log point) increase in an
institution’s log of median borrower-lender distance is associated with a 3.7 percentage point increase
in the institution’s top-five share. This is an 8.8% increase over the mean top-five share of 42%.
Column 2 adds ventile indicators for the institution’s lending volume (the total number of loans
originated by the institution during that year), Column 3 adds institution fixed effects, and Column
4 restricts the sample to a balanced panel of institutions who gave at least 10 SBA loans during each
year from 2001-2017. Across all specifications, the coefficient on lending distance remains positive
and statistically significant. The institution fixed effects specifications in Columns 3 and 4 show
that the positive relationship between distant loans and concentration holds within institutions over
time.
Columns 5-6 replace the log of the median borrower-lender distance with the share of loans
originated to borrowers 100 or more miles from the nearest branch. Additionally, in Appendix
Table A.3, we find a similar pattern when industry concentration is measured with the HHI index.
The positive relationship between distance and concentration remains significant when using these
alternative measures of distance and lender concentration. Overall, there is a robust positive
14relationship between lending to distant borrowers and industry concentration.
3.3 Industry Concentration and Loan Performance
If industry concentration facilitates expertise in lending to these industries, concentrated lenders
may experience better loan performance within the industries where they focus. To investigate
this idea, we examine whether loans from concentrated lenders perform better than loans from less
concentrated lenders. As mentioned, concentrated lenders tend to focus on industries with lower
charge-offs, which would lead to better loan performance even in the absence of expertise. So that
our estimates will not be driven by this industry selection, our regressions will include industry
fixed effects. Thus, our strategy compares within-industry across lenders.
Using the loan-level data, we estimate the following regression for a loan i from lender b to
industry j originated in year t:
Chargeof fibjt = α + β0 log(distibjt ) + β1 IndustrySharebjt + Xibjt γ + δj + τt + ibjt (2)
where Chargeof fibjt is an indicator for whether loan i from lender b originated to industry j during
year t was charged off within three years of origination. The variable log(distibjt ) is the log of the
distance between the borrower and the closest branch of the institution originating the loan.22 The
main specification also includes loan-level controls for size and term length (Xibjt ) and industry
(δj ) and year (τt ) fixed effects. Some specifications also include additional loan-level controls,
state-by-year fixed effects, and institution-specific fixed effects.
Our measure of industry concentration, IndustrySharebjt , is the share of total loans from lender
b in year t that went to industry j.23,24 The coefficient of interest, β1 , captures the correlation
between the probability that a loan in industry j is charged off within three years and the lender’s
IndustrySharebjt . If β1 is negative, it would reflect that lenders giving a larger share of their loans
to an industry experience lower charge-off rates relative to other lenders. Since the specification
includes industry fixed effects, β1 reflects how the probability of charge-offs varies among loans
given to the same industry. In some specifications, we add the interaction of the share of loans to
22
Table A.4 finds a similar pattern for small lenders, medium lenders, and large lenders, excluding Live Oak loans,
using the county distance measure, and using the lagged industry share. Table A.5 finds similar results when excluding
distance as a control.
23
We focus on contemporaneous shares as our primary measure. If lenders build expertise (e.g. by hiring industry
experts) then increase lending to the industry, current lending shares reflect expertise. However, if expertise are
developed through past exposure to an industry, it may be more appropriate to use a lagged measure. In robustness
checks, we find a similar effect using lagged shares. Moreover, contemporaneous and lagged shares are highly correlated;
the coefficient of correlation is 0.92.
24
An alternative measure concentration could be the number of loans a bank gave to the industry. This measure,
however, would potentially conflate the effects of bank size and concentration. Instead, we adopt the common approach
of using a measure that is comparable across banks of different sizes and then controlling directly for bank size in
the regressions (Acharya, Hasan and Saunders, 2006, Hayden, Porath and Westernhagen, 2007, Berger, Minnis and
Sutherland, 2017). However, to investigate the role of bank size, Columns 1-3 of Table A.4 estimate specification
(2) separately for small, medium, and large lenders. Consistent with both the share and number of loans capturing
industry expertise, the coefficient on IndustryShare increases in bank size, although the estimate for larger banks is
imprecise.
15an industry and borrower-lender distance, to examine whether industry concentration can mitigate
the disadvantages of lending at a distance.
Table 3 reports the results of specification (2). Consistent with the prior literature on distance
and lending, the positive coefficient on the log(dist) in Column 1 indicates that the probability of
default increases with borrower-lender distance, controlling for loan characteristics (dummies for
ventiles of loan size and term length). Column 2 adds the share of loans that a lender makes to the
industry. The negative coefficient on the share in the industry indicates that having a greater share
of loans to an industry is correlated with lower charge-off rates within that industry (relative to less
concentrated lenders). To provide a sense of the magnitude, these estimates imply that an industry
share of 52% would offset the additional risk of a 100-mile loan. The offsetting threshold is higher
for more distant loans and lower for closer ones. This negative relationship between concentration
and the probability of default remains similar when adding state-by-year fixed effects in Column
3. Column 4 includes the interaction of the “Share in industry” with the log of borrower-lender
distance. The coefficient is negative and significant, suggesting that concentration in lending can
mitigate the disadvantages of lending at a distance. Columns 5-8 repeat these specifications, but add
institution fixed effects. The coefficients decrease in magnitude, but remain statistically significant.
Thus, even within an institution, loan performance is better in the industries where the institution
is more concentrated. However, adding institution fixed effects causes the interaction of the industry
share with log(dist) to become statistically insignificant and slightly positive (Column 8).
4 Industry Specialization and Access to Credit
This section investigates whether remote, industry-specialized lenders can expand access to small
business loans. Industry-specialized lenders may use industry expertise to meet credit demand
that would be unmet by other lenders, thereby increasing access to credit. Alternatively, industry-
specialized lenders may compete for the same borrowers as other lenders, resulting in little change
to the total quantity of small business credit. It is also possible that cream-skimming by new
entrants with an informational advantage may induce a segmented credit market, as in the models
of Detragiache, Tressel and Gupta (2008) and Gormley (2014), ultimately reducing the availability
of credit.
The challenge in empirically examining the impact on credit is that remote lending has steadily
and endogenously grown over time, and we do not observe the counterfactual number of loans that
would have been originated in the absence of this growth. To overcome this challenge, we examine
the staggered entry of the largest remote, specialized SBA lender: Live Oak Bank.
4.1 Background Information: Live Oak Bank
As shown earlier in Figure 3, Live Oak Bank exhibits the two key features of remote, industry-
specialized lenders. Live Oak gave 95% of its SBA loans to borrowers 100 or more miles from its
single headquarters in North Carolina and 80% of its loans went to just six of the more than 800
16You can also read