Formation mechanisms of macroscopic globules in andesitic glasses from the Izu-Bonin-Mariana forearc (IODP Expedition 352)
←
→
Page content transcription
If your browser does not render page correctly, please read the page content below
Contributions to Mineralogy and Petrology (2021) 176:2 https://doi.org/10.1007/s00410-020-01756-3 ORIGINAL PAPER Formation mechanisms of macroscopic globules in andesitic glasses from the Izu–Bonin–Mariana forearc (IODP Expedition 352) Raúl O. C. Fonseca1 · Lina T. Michely2 · Maria Kirchenbaur3 · Julie Prytulak4 · Jeffrey Ryan5 · Kerstin Hauke6 · Felipe P. Leitzke7 · Renat R. Almeev3 · Chris S. Marien8 · Axel Gerdes9 · Rico Schellhorn6 Received: 29 August 2019 / Accepted: 28 October 2020 © The Author(s) 2020 Abstract The Izu–Bonin–Mariana volcanic arc is situated at a convergent plate margin where subduction initiation triggered the for- mation of MORB-like forearc basalts as a result of decompression melting and near-trench spreading. International Ocean Discovery Program (IODP) Expedition 352 recovered samples within the forearc basalt stratigraphy that contained unusual macroscopic globular textures hosted in andesitic glass (Unit 6, Hole 1440B). It is unclear how these andesites, which are unique in a stratigraphic sequence dominated by forearc basalts, and the globular textures therein may have formed. Here, we present detailed textural evidence, major and trace element analysis, as well as B and Sr isotope compositions, to inves- tigate the genesis of these globular andesites. Samples consist of K2 O-rich basaltic globules set in a glassy groundmass of andesitic composition. Between these two textural domains a likely hydrated interface of devitrified glass occurs, which, based on textural evidence, seems to be genetically linked to the formation of the globules. The andesitic groundmass is Cl rich (ca. 3000 g/g), whereas globules and the interface are Cl poor (ca. 300 g/g). Concentrations of fluid-mobile trace elements also appear to be fractionated in that globules and show enrichments in B, K, Rb, Cs, and Tl, but not in Ba and W relative to the andesitic groundmass, whereas the interface shows depletions in the latter, but is enriched in the former. Inter- estingly, globules and andesitic groundmass have identical Sr isotopic composition within analytical uncertainty (87 Sr∕86 Sr of 0.70580 ± 10), indicating that they likely formed from the same source. However, globules show high 11B (ca. + 7‰), whereas their host andesites are isotopically lighter (ca. – 1 ‰), potentially indicating that whatever process led to their formation either introduced heavier B isotopes to the globules, or induced stable isotope fractionation of B between globules and their groundmass. Based on the bulk of the textural information and geochemical data obtained from these samples, we conclude that these andesites likely formed as a result of the assimilation of shallowly altered oceanic crust (AOC) during forearc basaltic magmatism. Assimilation likely introduced radiogenic Sr, as well as heavier B isotopes to comparatively unradiogenic and low 11 B forearc basalt parental magmas (average 87 Sr∕86 Sr of 0.703284). Moreover, the globular textures are consistent with their formation being the result of fluid-melt immiscibility that was potentially induced by the rapid release of water from assimilated AOC whose escape likely formed the interface. If the globular textures present in these samples are indeed the result of fluid-melt immiscibility, then this process led to significant trace element and stable isotope fractionation. The textures and chemical compositions of the globules highlight the need for future experimental studies aimed at investigating the exsolution process with respect to potential trace element and isotopic fractionation in arc magmas that have perhaps not been previously considered. Keywords Izu-Bonin forearc · Andesites · Globular textures · Liquid immiscibility · B and Sr isotopes Communicated by Hans Keppler. Introduction Electronic supplementary material The online version of this article (https://doi.org/10.1007/s00410-020-01756-3) contains Spheroidal textures, commonly referred to as globules, supplementary material, which is available to authorized users. orbs, orbicules, ocelli, or varioles, are ubiquitous in many magmatic and metamorphic lithologies. However, the exact * Raúl O. C. Fonseca raul.fonseca@rub.de mechanisms that lead to the formation of spheroidal textures are not well understood and may comprise both primary Extended author information available on the last page of the article 13 Vol.:(0123456789)
2 Page 2 of 23 Contributions to Mineralogy and Petrology (2021) 176:2

and/or secondary processes. Primary magmatic processes minerals (Pauly et al. 2014; Fonseca et al. 2017). As such,
invoked to explain spheroidal textures include magma min- B isotope data, coupled with other geochemical information,
gling (Polat et al. 2009; Krassivskaya et al. 2009), two-liq- namely, Sr isotopes and fluid-mobile element concentrations
uid immiscibility (Gélinas et al. 1976; Ferguson and Cur- should allow us to assess the involvement of fluid-mediated
rie 1972; Philpotts 1982; Asiabanha and Bardintzeff 2013; processes in the genesis of these unique samples, as well as
Ballhaus et al. 2015), and spherulitic crystallization (Phil- the genetic relationship of the different textural components
potts 1977; Sandstå et al. 2011). Non-magmatic processes found in these samples.
include devitrification (Lofgren 1971) and alteration of vol- Using these data, we have found that the bulk of the
canic glasses (Hughes 1977; Hanski 1993), as well as the textural and geochemical characteristics of the globular
filling of vesicles that form during degassing by late-stage andesites from Unit 6 of Hole 1440B IODP Expedition 352
melts (Smith 1967; Sato 1978; Anderson Jr. et al. 1984). In are best explained by fluid-melt immiscibility (also known as
this framework, unique andesitic samples, recovered during degassing) that followed the assimilation of hydrothermally
International Ocean Discovery Program (IODP) Expedition modified forearc basaltic crust that is breaking apart upon
352 to the Izu–Bonin–Mariana forearc, may provide some subduction initiation. While some other possibilities, like
insights into processes that lead to the formation of sphe- for example, magma mingling and vesicle segregation can
roidal textures in nature. These samples, which were found explain some of the features of these samples, only fluid-
in Unit 6 of Hole 1440B during Expedition 352, consist of melt immiscibility is consistent with the majority, even if
a complex network of basaltic globules of elipsoidal shape not all of characteristics shown by these unusual globular
surrounded by a glassy groundmass of andesitic composi- andesites recovered during IODP Expedition 352.
tion. What makes these samples particularly unique is the
fact that no other rocks of such evolved andesitic composi-
tion were sampled during Expedition 352, where forearc Geological setting and sampling
basalts (FAB) and boninites comprise the vast majority of
samples recovered (Reagan et al. 2015). These samples are The Izu–Bonin–Mariana (IBM) arc system is an active intra-
also the only recovered samples that exhibit spheroidal or oceanic convergent plate margin trending north-south from
globular textures, whereas most other samples have been Japan to beyond Guam (Fig. 1a; Stern et al. 2003). The arc
described as being microcrystalline and hyaloclastic in is around 2800 km long and up to 350 km wide (Stern et al.
nature (Reagan et al. 2017). Moreover, the FAB sampled 2003). The formation of the IBM subduction zone began in
during Expedition 352, which surround Unit 6 andesites, the early Eocene and was triggered by a major event of plate
are thought to have been produced by decompression melt- reorganization. The very first episode of melting associated
ing during subduction initiation without the involvement of with subduction–initiation is generated by adiabatic decom-
recycled subduction components and with little to no fluid pression of mantle upwelling along a foundering Pacific
flux from the subducted slab (Li et al. 2019; Reagan et al. plate resulting from seafloor spreading (Fig. 1b, Reagan
2019; Shervais et al. 2019). et al. 2010; Shervais et al. 2019; Reagan et al. 2019). The
 Here, we present the results of a detailed petrographic firsts melt are MORB-like in composition with a low-to-neg-
and geochemical study of the globular andesite Unit 6 (Hole ligible subduction zone component and have been termed as
1440B) samples recovered during IODP Expedition 352 to “forearc basalts” (FAB) (Reagan et al. 2010; Shervais et al.
the Izu–Bonin–Mariana forearc to investigate which pro- 2018). The FAB and bonitites recovered during Exp. 352 are
cesses may have led to their formation. What follows is a similar in age and have been dated at 51.34 ±0.78 Ma and
detailed discussion of how these globular andesites may 51.27 to 50.33 Ma, respectively (Reagan et al. 2019). Unlike
have formed and the processes, primary or secondary, that the FAB, boninites show a geochemically significant slab
can account for the bulk of their textural and geochemical contribution when compared to the FAB (Li et al. 2019).
characteristics (and which do not). The toolbox to test these These slab components consists of slab melts, hydrous sedi-
different hypotheses comprises the detailed petrography of ment melts, and fluids from altered oceanic crust (Li et al.
the samples, the analyses of their trace element budget, as 2019).
well as their B and Sr isotope compositions. Boron isotopes, A primary aim of IODP Expedition 352 was to recover
in particular, are well suited to trace processes leading to the the entire volcanic sequence in the IBM forearc in order to
formation of these globular samples, as B is soluble in fluids increase our understanding of how subduction zone initia-
and significant stable isotope fractionation can occur even tion and the transition towards a mature arc system takes
at magmatic temperatures, especially when compared to the place. Expedition 352 Hole U1440B had a penetration depth
similarly light C or O (Hervig et al. 2002). Boron isotopes of 383.6 metre below the seafloor (mbsf) and recovered
are also highly fractionated as a result of low-temperature exclusively FAB, structurally spanning the range from vol-
alteration processes, when adsorbed into secondary clay canic extrusives to diabasic dikes. All U1440B units were

13
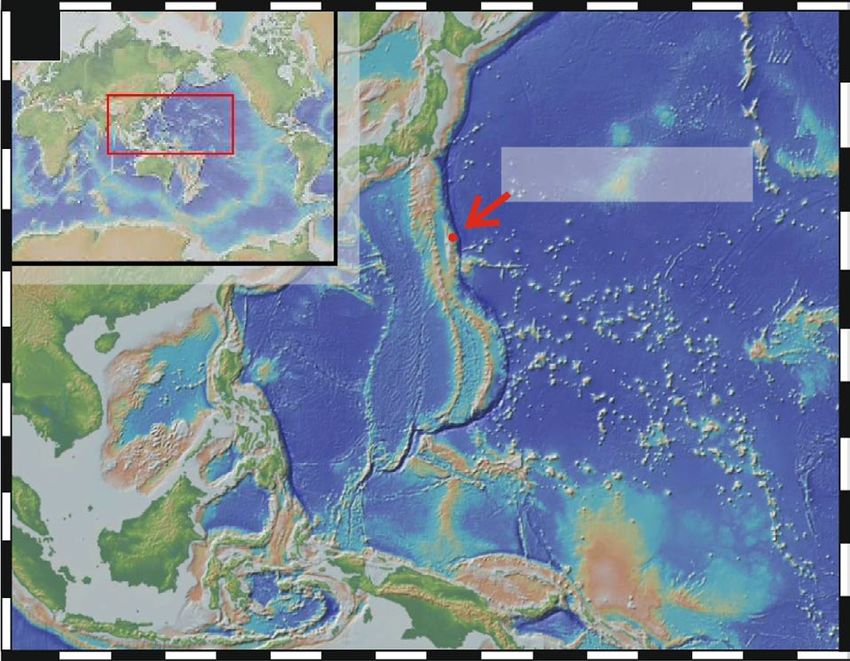
Contributions to Mineralogy and Petrology (2021) 176:2 Page 3 of 23 2 A B Fig. 1 a Topographic map from the Izu–Bonin–Mariana arc. The red arrow shows the approximate location of the drill sites of expedition 352 (Modified from Reagan et al. 2015). b Schematic illustration of the Izu–Bonin–Mariana arc formation (after Reagan et al. 2019) classified as basalts with the exception of Unit 6, which was 19R-6466, a resolution of 46.999 μm (voxel-size: 0.046999 classified as an andesite, based on both its major element × 0.046999 × 0.046999 [mm]) ,respectively, and 36.996 μm composition and its high-Zr and low-Cr contents. Unit 6 is (voxel-size: 0.036996 × 0.036996 × 0.036996 [mm]) were located within the FAB at around 227 mbsf and has a thick- chosen. Three-dimensional model reconstruction was manu- ness of approximately 80 cm (Reagan et al. 2015). Unit 6 is ally performed using the Avizo Fire 8.1 software package. exceptional when compared to other units in this Hole, both because of its overall andesitic composition, and because Major and trace element analysis of the presence of complex globular textures, which are the focus of this study. Three glassy andesite samples from Characterization of the major and minor element contents Unit 6 were investigated: Samples 352 U1440B 19R 1 W of each sample was carried out using a JEOL JXA-8200 14/18 cm (short: 19R-1418), 352 U1440B 19R 1 W 27/29 electron microprobe (University of Bonn) in wavelength cm (short: 19R-2729), and 352 U1440B 19R 1 W 64/66 cm dispersive mode (WDS) employing an accelerating voltage (short: 19R-6466) (Fig. 2). of 15 kV and a 15 nA beam current. The electron beam diameter was set between 1 and 25 μm depending on the textural heterogeneity and crystal size. The major and minor Methods element oxides MgO, Na2O, FeO, K 2O, TiO2, SiO2, Al2O3, MnO, CaO, P2O5, and Cl were quantified. Most of the major Microscopic petrography and 3D‑imaging element oxides were calibrated on a natural basalt from the Juan de Fuca ridge (VG2 NMNH 111240-52; Jarosewich Detailed petrography of each sample was carried out using et al. 1980), while Na2O was calibrated using a jadeite-diop- a ZEISS Axio Imager A1m microscope equipped with side eutectic glass, K2O using sanidine, P2O5 apatite, TiO2 in a Canon PowerShot A640. Samples were imaged under rutile, and Cl on scapolite (NMNH R6600), employing peak reflected light using both bright-field and dark-field illumi- to background calibrations. The ZAF algorithm was used to nation to enhance different textural features of the globules. correct for the different electron absorption properties of the Specialized software (AutoStich™) was then used to cre- samples, as well as the reference materials used for calibra- ate composite images of each sample, which enabled an tion. Major element concentrations are given as an average overview of the textures of a whole section while retain- of 10–20 representative spots on each measured area. Line ing microscopic resolution. In order to further character- scans (quantitative), as well as qualitative X-ray mapping ize the spatial relationship between the textural domains, were performed to observe major and minor element varia- high-resolution 3D computed X-ray tomography scans were tions over the three main textural domains. carried out. Samples were scanned using a GE Phoenix|X- Trace element abundances were acquired using a Reson- ray v|tome|x s equipped with a 240 kV microfocus tube. etics Resolution M50-E 193 nm Excimer laser ablation appa- For a three-dimensional overview of samples 19R-1418 and ratus coupled to a Thermo Scientific X-Series II Q-ICP-MS 13
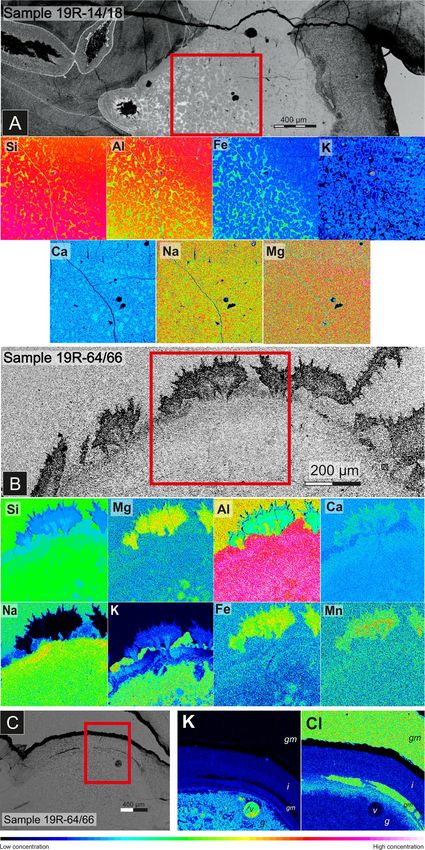
2 Page 4 of 23 Contributions to Mineralogy and Petrology (2021) 176:2

 at the University of Bonn, Germany. On each textural
 domain, a minimum of 15 spots were carried out using a
 laser fluence of ~ 6 J/cm2 and a repetition rate of 15 Hz. The
 spot size was generally set to 100 μm, with the exception
 of the interface veins, where the spot size was reduced to
 44 μm to avoid contamination from the adjacent andesitic
 groundmass. For each measured spot, 15 s of background
 signal were followed by 30 s of ablation signal. Trace ele-
 ment abundances were measured in two separate batches
 in order to optimize counting statistics and the analytical
 accuracy and precision of all nuclides measured (cf. method
 description in Fonseca et al. 2017). This was necessary due
 to the high number of measured trace elements. The nuclides
 7
 Li, 11B, 9Be, 29Si, 31P, 43Ca, 45Sc, 47Ti, 49Ti, 51V, 52Cr, 55Mn,
 59
 Co, 60Ni, 63Cu, 65Cu, 66Zn, 69Ga, 71Ga, 75 As, 85 Rb , 88 Sr ,
 89
 Y, 90 Zr , 91 Zr , 93 Nb, 95 Mo, 96 Mo, 98 Mo, 111 Cd, 115 In, 118 Sn,
 120
 Sn , 121 Sb , 123 Sb , 133 Cs, 137 Ba , 138 Ba , 139 La , 140 Ce , 141 Pr ,
 146
 Nd, 147 Sm, 151 Eu, 153 Eu, 157 Gd, 159 Tb, 163 Dy, 165 Ho, 166 Er ,
 169
 Tm , 172 Yb, 175 Lu , 179 Hf , 180 Hf , 181 Ta , 182 W , 184 W , 205 Tl ,
 208
 Pb , 232 Th and 238 U were monitored during LA-ICP-MS
 analysis. NIST-SRM-612 glass (Jochum et al. 2011a) was
 used as the external standard, with measurements carried
 out via standard/sample bracketing with no more than 15
 spots measured between each standard measurement. Addi-
 tional spots were carried out in the NIST-SRM-610 glass
 which was treated as an unknown to check for data accuracy
 and reproducibility. Concentrations obtained from NIST-
 SRM-610 were found to be within 5–10% within reported
 values for that reference material (Jochum et al. 2011a). To
 correct for differences in ablation efficiency, count rates
 were normalized to 43 Ca as the internal reference standard.
 Data reduction was carried out employing the methodology
 described by Longerich et al. (1996).

 Boron and Sr isotope analysis

 Boron isotope measurements were performed at the Goe-
 the University Frankfurt (GUF) by LA-MC-ICP-MS using
 USGS GSD-1G glass as the primary reference standard. The
 MPI DING StHs60/80-G glass and the USGS glass refer-
 ence materials BHVO and BCR-2G were used as secondary
 standards for quality control. Representative spot analyses
 were carried out on all textural domains (globules, andesitic
 groundmass and interface), as well as on some of the mate-
 rial found filling the vesicles in the samples. A RESOlu-
 tion (Resonetics) 193nm ArF excimer laser (CompexPro
 102, Coherent) equipped with a dual volume S155 laser
Fig. 2  Overview images of samples 19R-1418, 19R-2729 and 19R- cell (Laurin Technic, Australia) was used for the ablation of
7274. Optical microscopy images taken under dark-field illumination glass samples in a He atmosphere. The sample stream was
were combined to create this overview. All samples exhibit globules admixed with Ar and N2 and signals were smoothed using
surrounded by a andesitic groundmass and a devitrified interface. The
exception is sample 19R-2729, which only comprises the andesitic a squid device (Laurin Technic, Australia) prior to intro-
groundmass and minor interfacial material duction into the ICP. The MC-ICP-MS used was a Neptune

13
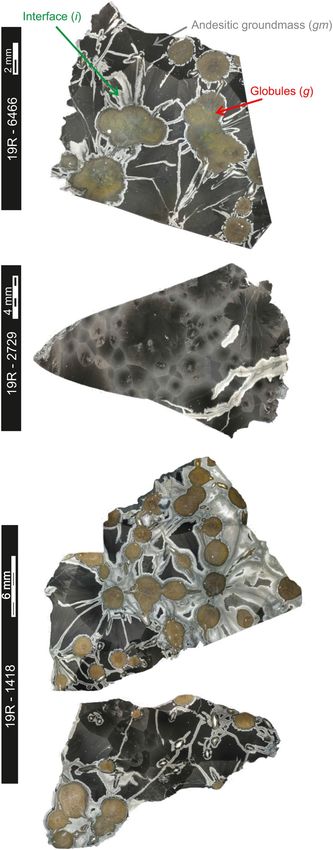
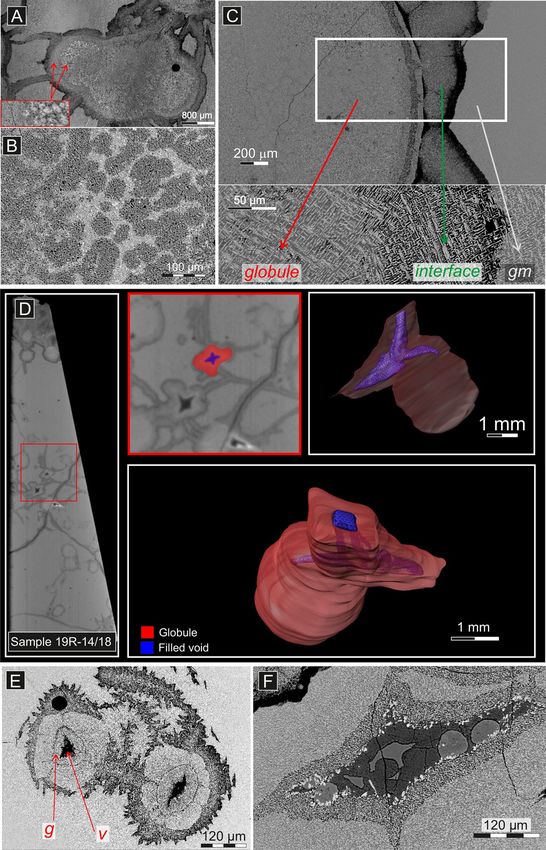
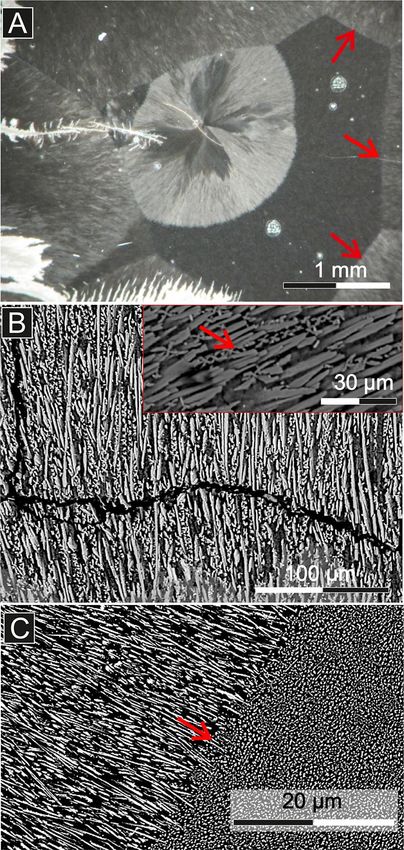
Contributions to Mineralogy and Petrology (2021) 176:2 Page 5 of 23 2

(ThermoScientific, Germany) equipped with nine Faraday to the boric acid standard SRM 951, using 4.0545 as the
cups connected to 1011 Ω amplifiers. The signal was tuned reference 11B/10 B ratio in agreement with Kasemann et al.
for maximum 11B sensitivity using standard GUF ICP condi- (2001). Quoted uncertainties are quadratic additions of the
tions (e.g. 1280 W RF power, 15.5 L/min cooling gas, 0.8 within run precision of each analysis and the reproducibility
L/min auxiliary gas) and sample gas flows (0.9 L/min Ar, of the GSD-1G glass during the session (SD = 0.2‰, n =
0.6 L/min He, and 0.003 L/min N2 ). These settings, cou- 20, Supplementary Table S1).
pled with a square laser ablation spot size of 200 μm and In addition to the B isotope analysis, the Sr isotopic com-
a depth penetration of 1 μm/s, yielded an 11B signal of ca. position of each textural unit was determined following the
500–800 mV/s on USGS GSD-1G during 26 s of ablation. procedure described in Marien et al. (2019). Approximately
This value corresponds to an average sensitivity of about 5 200 mg aliquots of globule, andesitic groundmass and inter-
V/pg 11B. Instrumental B background was low and uniform face fragmented material were used. Prior to sample diges-
during the analytical sessions, with a mean 11B of 0.46 ± tion, a 87Rb/84 Sr isotope tracer was added to each aliquot to
0.08 mV (±1SD) and a mean, mass bias uncorrected 11B/10B measure their Sr isotopic composition and Rb and Sr ele-
of 2.9 ± 0.2 (±1SD). The analytical sequence consisted of a mental abundances, in order to obtain precise Rb/Sr ratios
series of measurements of the standards (GSD-1G, BHVO, for later age correction of Sr isotope ratios. Each aliquot
BCR-2G and StHs60/80-G) followed by a block of samples. was subsequently digested on a hotplate in a 1:1 mixture
Every analysis consisted of 28 s of background acquisition, of conc. HF/conc. HNO3 for 24–36 h at 120 ◦ C. The solu-
26 s of sample ablation, and about 20 s between the analy- tion was subsequently dried down and treated three times
sis for signal washout. Spot locations were defined prior to with conc. HNO3 and evaporated to dryness. The dried down
analysis and the laser operated in fully automated mode over sample was taken up in 6 N HCl and equilibrated for 12 h
the analytical session (50–270 min). Prior to each analysis, at 120◦ C. A clear solution was dried down and processed
the surface was pre-ablated by five laser shots (ca. 0.5 μm for further ion exchange separation. Strontium separation
of depth) to remove any surface contamination. Laser spots was carried out using the same aliquot of digested globule,
used in each sample analysis typically covered an area of andesitic groundmass and interface aliquots. Strontium was
213 × 213 μm . Laser frequency was set to 10 Hz and the separated from the sample matrix using the method reported
laser energy density to ca. 3 J/cm2 , which resulted in crater by Marien et al. (2019). The Sr isotope composition, and
depths between 20 and 30 μm during 26 s of ablation. All Rb and Sr contents of each aliquot were determined using a
data treatment was done offline. The average blank level Thermo Scientific Neptune MC-ICP-MS located at Univer-
was subtracted from the 11B and 10 B intensities and outliers sity of Cologne (Germany). Measured ratios of 87Rb/85Rb
rejected based on the time-resolved 11B/10 B ratio using a 2 and 87Sr/86 Sr were corrected for mass fractionation using
-test. Correction for mass discrimination (about 11.6%) was the exponential law and normalized to NBS 987 ( 87Sr/86 Sr
accomplished via external calibration using a sample stand- of 0.710240). Rb-cuts were doped with Zr for mass bias
ard bracketing approach (GSD-1G, 11B of + 10.1 ‰ ± 0.5, correction and corrected using a 91Zr/90Zr = 0.21795 (Nebel
corresponding to 11B/10 B of 4.0955; Jochum et al. 2011b). et al. 2005). Rubidium was measured relative to NBS 984 (87
GSD-1G was analyzed every 25–30 min and mass discrimi- Rb/85Rb = 0.38554). Procedural blanks were typically 200
nation drift (< 1‰ over 60 min) over time was assumed pg for Sr and less than 70 pg for Rb.
to be linear. The B isotopic composition of the secondary
standards was well reproduced for StHs60/80-G ( 11B of
– 4.4 ± 1.0) and BCR2-G ( 11B of – 5.6 ± 0.7 ‰) when Results
compared to values reported in the literature for the same
standards (StHs60/80-G with 11B of – 4.5 ± 0.3 ‰, Rosner Textural relationships
and Meixner 2004; BCR2-G with a 11B of –5.9 ± 0.2 ‰,
Gangjian et al. 2013). However, BHVO-2G yielded 11B Three textural distinct domains were identified in each sam-
values of – 1.8 ± 1.2 ‰, which are over 1 ‰ lower than the ple: an andesitic groundmass (gm), that surrounds red brown
value of – 0.7 ± 0.12 ‰ for BHVO-2 (powder) reported by globules (g), and an interface (i) surrounding each globule
Gangjian et al. (2013). This offset is likely the result of B (Fig. 2). The dark grey to black andesitic groundmass is pre-
isotope heterogeneity of the BHVO-2G glass relative to the dominantly glassy with small skeletal crystallites at the μm
powdered sample characterized by Gangjian et al. (2013), to sub-μm scale (Fig. 3a). Distinct, mostly straight bounda-
as this was the only standard that yielded variable 11B over ries and triple junctions can be found within the andesitic
the course of the analytical session, despite having roughly groundmass where crystallites intersect, forming a “honey-
similar B concentrations to BCR2-G (2.5–4.2 g/g). Boron comb” pattern (Fig. 3a). In some areas the crystals seem to
isotopic compositions are expressed as 11B value relative have helix-shaped growths (close-up in Fig. 3b). Crystallites

 13
2 Page 6 of 23 Contributions to Mineralogy and Petrology (2021) 176:2

 possess an orbicular fabric (Fig. 4a, b). Globules are inter-
 connected to each other via a network of interface veins. In
 similar fashion to the andesitic groundmass, small skeletal
 crystallites can be identified within the globules, and radi-
 ate towards the globules’ surface. The globules are always
 separated from the andesitic groundmass by a light grey
 porous interface material (Figs. 2 and 4a). 3D X-ray micro-
 tomographic imaging further reveals that globules are almost
 spherical in shape and appear to have a uniform size dis-
 tribution, which is not immediately obvious from the 2D
 sections of the samples (cf. Fig. 4d). Moreover, where they
 merge (cf. Fig. 2), globules form hollow tubular structures
 that are filled by similar precipitates as those found in struc-
 tural voids or vesicles (Fig. 4d). These voids are elongated
 to spherical in shape, and can occur isolated included in the
 andesitic groundmass, but more often are found surrounded
 by a globule with fan-shaped interface areas (Fig. 4e). Voids
 can vary in size from a few micrometers to several hundreds
 of micrometers. The mineral precipitates found infilling the
 voids are very heterogeneous, with spherical-shaped aggre-
 gates surrounded by a soft, friable matrix mainly composed
 of the zeolite phillipsite and clay minerals (Fig. 4f).
 The interface (i) consists of devitrified andesitic ground-
 mass and is concentrated in areas with high globule density
 where its spreads radially from the globules (Fig. 2). Glob-
 ules are, for the most part, entirely surrounded by the inter-
 face, with only small slivers of the andesitic groundmass
 remaining. The contact between the globules and the inter-
 face is fan–shaped, and backscatter electron (BSE) images
 suggest that the interface is compositionally heterogeneous
 (Fig. 5a). Whereas the boundary between globules and the
 interface is sharper and plume shaped, the boundary between
 the interface and the andesitic groundmass tends to be ser-
 rated or jagged (Fig. 5b). As in the andesitic groundmass
 and globules, the interface’s groundmass is composed of
Fig. 3  a Photomicrograph of the andesitic groundmass taken using aligned skeletal crystallites (Fig. 5b). Interestingly, there
dark-field illumination, which shows “honeycomb” texture that forms
due to the re-orientation of the crystallites. b Backscatter electron is no obvious change in the spatial orientation of clinopy-
image (BSE) of skeletal-s to helix–shaped crystallites of clinopyrox- roxene crystallites along the transition from the interface
ene present in the andesitic groundmass. c Crystallites often intersect to the andesitic groundmass, with only a slight distortion
at right angles at the boundaries of “honeycomb” units, forming sharp visible between the globules and the other textural domains
interfaces
 (Fig. 4c bottom). The interface has lower density than the
 other textural domains, and because of this it appears darker
tend to be spherically oriented and converge towards the in the micro-tomographic images (Fig. 5c). Likewise, 3D
center of each honeycomb. The boundaries between each micro-tomographic imaging reveals that the interface always
honeycomb unit coincide with a sudden change in crystallite surrounds and connects globules to form a network of sheet-
orientation, specifically where they intersect at right angles like veins (Fig. 5c).
(Fig. 3c).
 The red-brownish globules exhibit circular to elliptical Mineral and glass chemistry
cross–sections, vary in size from the sub-mm scale to sev-
eral mm, and can occur isolated, in clusters, or are aligned The major element composition of all textural domains is
like “pearls on a string” (Fig. 2). Globules are texturally given in Table 1. The groundmass is of andesitic compo-
heterogeneous and exhibit complex internal micro-fabric, sition ( 60.27 ± 1.16 wt% SiO2 and 3.19 ± 0.34 wt% MgO)
where their outer rim is fine grained, whereas their cores and falls on the arc-tholeiite trend. The near 100% totals

13
Contributions to Mineralogy and Petrology (2021) 176:2 Page 7 of 23 2

Fig. 4  Backscatter electron
(BSE) images of the different
textural domains found in the
Izu-Bonin samples. a isolated
globule surrounded by interface
material. Red arrows point to
the rim of the globule and its
inner orbicular texture. Orb for-
mation was very heterogeneous
in this globule. Darker round-
ish orbs are surrounded by a
brighter ground mass. b Details
of the inner orbicular fabric
found in the globules. c Cross-
section of the transition between
globule, interface and andesitic
groundmass. Crystallite orienta-
tion is partially preserved over
the three textural domains,
albeit with some distortion as
they near the globules. d 3D
micro-tomographic reconstruc-
tion of the globules found in
sample 19R-14/18, where struc-
tural voids (in blue) are always
surrounded by semi-spherical
globular material (in red). e
BSE image of a cross-section of
structural voids surrounded by
globule and interfacial material.
f BSE image of a structural void
that is filled with zeolite and
clay material

of the microprobe analysis of the andesitic groundmass, diffraction indicate augite is the only major crystalline
as well as the absence of a clear H2 O band in the Raman phase in the andesitic groundmass (i.e. the crystallites). The
spectra obtained from this textural unit (Supplementary Fig. Raman spectra obtained from the andesitic groundmass, as
S1) suggest that it contains little to no water (less than 0.1 well as an augite reference spectrum from the RRuff data-
wt%, which is the detection limit of micro-Raman water base (Lafuente et al. 2016) are shown in electronic supple-
analysis—see Fonseca et al. 2017). X-ray diffraction of ment (Fig. S2A).
the andesitic groundmass reveals a degree of crystallinity The globules are more variable in major element oxide
of around 60 wt% ± 10. Raman spectroscopy and X-ray content compared to the andesitic groundmass. This is most

 13
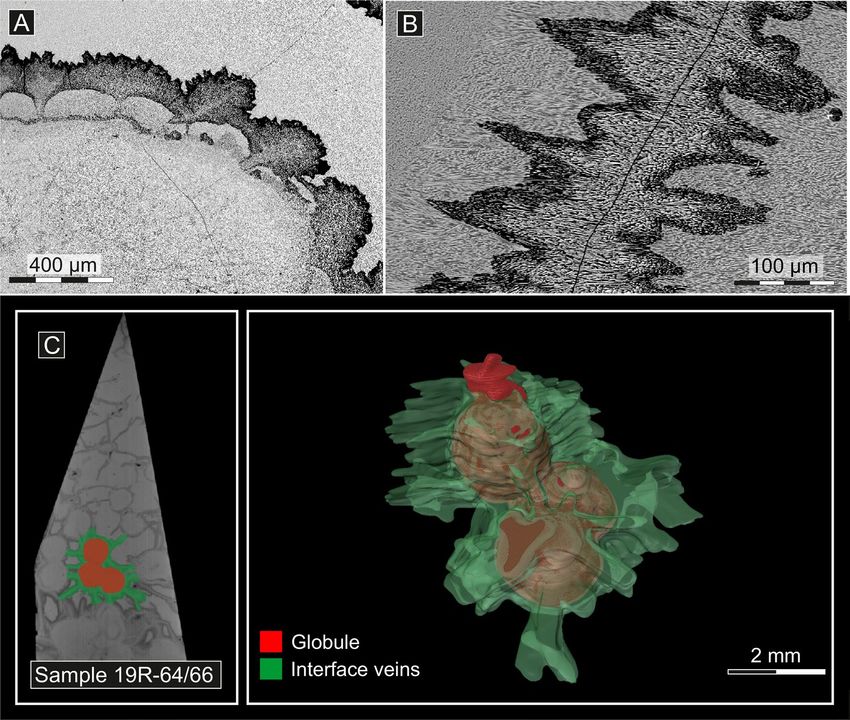
2 Page 8 of 23 Contributions to Mineralogy and Petrology (2021) 176:2 Fig. 5 a BSE image of the interface between globules and andesitic mass, the contact between the two textural domains is serrated or groundmass. Often the interface assumes a lobate or fan-like shape jagged. c Reconstruction of sample 19R-64/66, where the interface is expanding outwardly from the globules and into the andesitic ground- highlighted (in green), and is known to completely surround the glob- mass. b When interface veins are surrounded by the andesitic ground- ules (in red) apparent for SiO2 (± 3.5 wt%), Al2O3 (± 1.5 wt%), FeO and cristobalite as major phases present in these structural (± 4.5 wt%) and K 2O (± 1.17 wt%), which is related to voids (See Supplementary Fig. S2). However, identification their inner orbicular fabric (see Fig. 3a and Table 1), which of the matrix filling these structural voids using Raman spec- introduces heterogeneity at the scale of microprobe analysis. troscopy was not possible due to pronounced fluorescence. Importantly, the globules are enriched in K 2O by a factor Given the low electron microprobe totals (ca. 80 wt%), and of 30 when compared to the andesitic groundmass (0.1 vs. the presence of Mg, Fe and Si, the void-filling matrix likely ~ 3 wt%). As with the andesitic groundmass, totals of the consists of a mixture of clay minerals. microprobe analysis of globules are close to 100 wt% and Electron microprobe measurements of the interface no water band was visible in the recorded Raman spectra yielded totals of ca. 90 wt% (Table 1). The low electron (Supplementary Fig. S1). Moreover, Raman spectroscopy microprobe totals associated with the interface are con- and X-ray diffraction measurements revealed the presence of sistent with the presence of water or another volatile (e.g. microcrystalline cpx, as well as alkali feldspar in the glob- CO2). However, neither could be confirmed using Raman ules (see electronic supplement for details). Owing to low spectroscopy because background fluorescence was very totals, and surface charging effects, it was not possible to pronounced, which likely masked the presence of a water identify the phases found filling structural voids and vesicles or CO2 band. Notwithstanding the low microprobe totals, sometimes found included in the globules using the electron the major element composition of the interface is broadly microprobe. However, Raman spectroscopic analysis identi- similar to that of the andesitic groundmass. However, it is fied the zeolite phillipsite ((Na,K,Ca)1−2(Si,Al)8O16 ⋅ 6H2 O) depleted in N a2O, as well as Cl by close to a factor of ten 13
Contributions to Mineralogy and Petrology (2021) 176:2 Page 9 of 23 2

relative to the andesitic groundmass and globules (Table 1 domains and are similar to the more enriched FAB units
and Fig. 6b). As with the andesitic groundmass and globules, recovered in Hole U1440B and Unit 6 andesites from Exp.
the Raman spectrum of the interface clearly indicates the 352 (Table 2; Fig. 7).
presence of microcrystalline cpx, but no additional primary However, globules and andesitic groundmass show dis-
or secondary mineral phase was identified. tinct negative anomalies in Sr and Ti relative to U1440B
 FAB and Unit 6 andesites (Li et al. 2019; Shervais et al.
Trace element data 2019, Fig. 7), which is consistent with early fractional crys-
 tallization of plagioclase and a Ti-bearing phase (e.g. mag-
Nominally fluid-immobile elements like the HREE and the netite). When their trace element contents are normalized
HFSE show little variation between the different textural relative to the andesitic groundmass, fluid-mobile elements

Fig. 6  Element distribution
maps of two chosen areas in the
backscattered electron images.
Further X-ray maps from addi-
tional locations can be found
in the supplementary material.
a X-ray map showing qualita-
tively the inner globule element
variations with the strong dif-
ferences in the relative element
concentration for Si, Al, Fe
and K. b X-ray map showing
qualitatively the concentration
differences in the transition area
from globule to interface and
andesitic groundmass. Interest-
ingly, while potassium has fairly
high concentrations within the
globules, it is very depleted
in the andesitic groundmass.
In a similar case, sodium has
very low concentrations in the
interface when compared to
the globules and the andesitic
groundmass

 13
2 Page 10 of 23 Contributions to Mineralogy and Petrology (2021) 176:2

Table 1  Average composition andesitic groundmass globules crystallites
obtained with the EMPA. 40 µm
Major and minor elements gm g

 c px
were measured as oxides. 40 µm igtd igtb 400 µm
Abbreviations are listed in the
 Inner globule texture (orbs)
legend of the table. All quoted
 bulk av. gm error bulk av. g error igtb Error igtd error cpx error
uncertainties correspond to one
standard deviation from the SiO₂ 60.27 1.16 54.39 3.51 46.13 1.75 54.10 2.44 48.29 1.50
 TiO₂ 0.99 0.17 0.96 0.23 0.70 0.29 0.89 0.29 1.18 0.14
mean value
 Al₂O₃ 12.59 0.40 15.90 1.57 12.52 0.84 15.52 1.31 6.74 0.51
 FeO 12.15 1.06 11.81 4.55 24.10 2.36 11.86 2.80 21.45 2.99
 MnO 0.13 0.08 0.12 0.07 0.21 0.06 0.14 0.05 0.23 0.01
 MgO 3.19 0.45 3.14 0.56 3.25 0.80 3.13 0.84 8.67 1.01
 CaO 7.70 0.50 7.66 0.57 7.25 1.01 7.81 1.41 13.96 0.82
 Na₂O 3.15 0.34 3.21 0.42 3.15 0.36 3.17 0.46 0.32 0.14
 K₂O 0.11 0.03 2.92 1.17 0.42 0.18 2.48 1.20 0.09 0.06
 P₂O₅ 0.14 0.05 0.19 0.10 0.16 0.06 0.18 0.29 0.14 0.02
 Cl 0.31 0.03 0.03 0.01 - - - - - -

 Total 100.74 100.34 97.89 1.31 99.29 1.49 101.08 0.77

 interface voids

 id vfd

 Voi
 ib 200 µm
 200 µm

 d
 vfl

 bulk vfl vfd
 av. i error id error ib error error error vSiO₂
 SiO₂ 47.29 1.99 44.81 1.18 48.29 0.73 62.09 7.91 54.85 1.34 99.83
 TiO₂ 1.22 0.20 1.41 0.24 1.19 0.10 0.03 0.03 0.10 0.08 0.02
 Al₂O₃ 12.57 1.57 11.39 0.72 13.36 0.56 18.86 2.68 21.34 0.55 0.28
 FeO 15.03 1.29 16.68 1.02 15.07 0.71 0.11 0.06 0.30 0.08 0.19
 MnO 0.19 0.07 0.22 0.05 0.16 0.03 0.02 0.02 0.06 0.03 0.00
 MgO 5.72 0.26 5.65 0.40 5.62 0.32 0.04 0.04 4.96 0.30 0.01
 CaO 8.07 0.61 8.89 0.95 8.35 0.57 0.55 0.25 1.69 0.10 0.03
 Na₂O 0.39 0.09 0.45 0.05 0.43 0.07 5.11 1.17 1.01 0.26 0.12
 K₂O 1.36 0.18 0.98 0.17 1.16 0.12 6.46 1.33 1.77 0.23 0.04
 P₂O₅ 0.05 0.02 0.06 0.02 0.05 0.01 0.02 0.01 0.02 0.02 0.00
 Cl 0.04 0.02 - - - - 0.02 0.01 0.04 0.02 -

 Total 91.92 90.54 93.68 93.32 86.14 100.51

 gm andesitic groundmass; g globule; igtb inner globule texture bright; ibtd inner globule texture dark,
 cpx clinopyroxene, i interface, id interface dark, ib interface bright; vfl void fill light; vfd void fill dark;
 vSiO2 = void SiO2

show extensive variations in the globules and interface (cf. Ti and other first row transition elements (V, Cr, Mn and
Fig. 8a). Thallium, B, Rb, and Cs are enriched in the inter- Co—see Fig. 8b, c) show little change between the globules
face and the globules relative to the andesitic groundmass, and andesitic groundmass. The interface displays a slight
whereas Ba, P, W, and U are depleted in the interface and are enrichment of all elements after Ti of less than a factor of
mostly invariant in the globules (Fig. 8a). Lithium is the only two (cf. Fig. 8c).
element aside from W that displays a slight depletion in the
globules but shows a pronounced enrichment in the interface Boron and Sr isotopic composition
when compared to the andesitic groundmass. The concen-
tration of Sr is relatively constant in all textural domains The results of the B isotope analysis are shown in Fig. 9
(Fig. 8a). The light REE are depleted in the interface rela- and summarized in Supplementary Table S1. Globules
tive to the andesitic groundmass, but are slightly enriched in and interface interiors (“bright” in Fig. 9) share the same
the globules (cf. Fig. 8b), whereas the heavy REE show no 11B, within uncertainty, as well as the most elevated B
variation between the different textural domains (Fig. 8b). contents (35 and 97 g/g B, respectively). The andesitic
Fluid-immobile elements like the heavy REE, the HFSE, groundmass is isotopically light, with an average 11B of

13
Table 2  Trace element concentrations in g/g for the different textural domains
 Li ± B ± P ± Sc ± Ti ± V ± Cr ± Mn ± Co ± Ni ± Cu ± Zn ± Rb ± Sr ± Y ±

 19R-6466-gm 13.52 1.07 2.04 0.27 1217.73 89 34.68 0.62 5857.24 122 220.61 6.58 52.97 1.63 1721.80 36 33.37 1.03 41.08 1.96 142.33 5.91 166.63 6.21 1.63 0.08 51.47 0.85 65.59 1.56
 19R-1418-gm 13.64 0.69 2.19 0.33 1199.56 64 34.41 0.54 6511.76 112 199.30 7.11 46.99 1.80 1681.97 47 30.53 1.11 37.01 2.22 20.74 1.01 127.07 9.23 1.75 0.09 53.35 0.67 73.82 1.94
 19R-6466-g-1 8.83 0.83 48.27 2.91 1497.51 107 34.42 0.37 6303.62 203 217.07 8.47 52.07 1.70 1575.17 84 31.77 1.45 40.46 2.04 50.56 4.26 167.63 6.20 21.07 1.83 59.56 0.92 77.59 3.89
 19R-6466-g-2 10.46 1.77 29.53 3.42 1226.92 79 33.68 0.72 6478.59 113 215.46 7.97 52.16 2.13 1752.68 54 38.15 2.24 46.46 2.37 56.21 9.98 196.76 12.23 14.37 0.71 57.15 1.03 67.26 1.99
 19R-1418-g-1 6.76 1.32 31.56 3.48 1689.96 220 32.33 0.88 6061.47 127 183.78 9.03 43.13 2.23 1536.32 41 27.67 1.04 34.08 1.83 22.16 0.99 40.32 7.71 19.40 1.56 56.97 1.28 81.11 5.12
 19R-1418-g-2 6.60 0.66 31.68 2.00 1565.00 293 32.28 0.88 6217.74 252 198.15 10.24 47.18 2.40 1609.76 53 29.21 1.05 39.06 2.69 24.43 0.78 40.94 6.57 19.79 1.46 55.48 1.31 72.32 2.47
 19R-6466-ib 60.01 4.79 96.19 11.19 389.95 23 37.99 1.86 7481.70 612 261.34 14.62 60.62 3.22 2398.63 151 0.89 10.41 93.94 8.64 298.88 70.37 246.56 11.10 22.15 2.42 38.89 2.74 57.99 1.78
 Contributions to Mineralogy and Petrology

 19R-1418-ib 60.41 5.67 97.96 14.30 408.74 34 39.14 1.09 8291.81 189 241.01 8.41 57.37 2.17 2291.43 144 45.62 5.89 75.31 3.64 17.71 1.26 263.85 43.57 12.01 1.80 37.60 2.18 64.92 1.90
 19R-6466-id 41.01 7.64 63.11 10.69 443.41 54 38.84 0.78 7510.56 315 259.82 10.88 62.75 2.51 2316.17 208 84.85 13.86 71.94 13.38 361.06 162.19 167.55 16.57 11.52 5.13 28.54 5.61 63.70 12.53
 19R-1418-id 43.66 6.72 62.61 14.42 438.98 59 38.38 1.64 8245.34 498 250.63 16.77 58.82 4.12 2553.58 232 68.21 19.46 82.44 11.16 16.01 1.91 136.16 60.22 9.99 4.01 30.08 8.91 68.52 2.21

 Zr ± Nb ± Mo ± In ± Sn ± Cs ± Ba ± La ± Ce ± Pr ± Nd ± Sm ± Eu ± Gd ± Tb ±

 19R-6466-gm 118.56 3.63 2.96 0.13 0.32 0.157 0.19 0.013 1.85 0.22 0.02 0.005 14.29 0.38 3.91 0.07 13.62 0.30 2.39 0.06 14.45 0.40 5.53 0.15 1.83 0.06 8.37 0.26 1.52 0.05
 (2021) 176:2

 19R-1418-gm 135.95 2.57 3.21 0.13 0.28 0.039 0.18 0.019 1.76 0.13 0.03 0.006 15.59 0.38 4.39 0.15 14.11 0.33 2.56 0.07 15.53 0.51 6.00 0.19 1.96 0.06 9.20 0.30 1.68 0.05
 19R-6466-g-1 126.95 6.32 3.40 0.16 0.28 0.079 0.19 0.016 1.43 0.23 0.05 0.008 10.87 0.83 6.14 0.60 22.76 5.07 3.84 0.41 21.59 2.07 7.82 0.60 2.58 0.19 10.57 0.70 1.87 0.08
 19R-6466-g-2 119.18 2.10 3.20 0.11 0.19 0.046 0.18 0.012 1.36 0.10 0.04 0.009 26.40 5.76 4.66 0.25 18.72 2.22 3.03 0.21 17.36 1.04 6.59 0.34 2.15 0.10 8.87 0.34 1.61 0.06
 19R-1418-g-1 125.69 5.19 3.54 0.19 0.23 0.037 0.17 0.011 1.25 0.18 0.07 0.027 14.72 0.62 6.23 0.64 16.08 0.86 3.49 0.37 20.14 1.77 7.22 0.56 2.34 0.18 10.14 0.77 1.83 0.11
 19R-1418-g-2 120.64 3.93 3.58 0.29 0.20 0.040 0.16 0.016 1.08 0.23 0.09 0.029 14.26 0.88 5.33 0.41 16.31 0.74 3.20 0.25 18.16 0.90 6.67 0.49 2.20 0.16 9.25 0.47 1.66 0.08
 19R-6466-ib 160.42 11.18 2.92 0.30 0.35 0.095 0.25 0.025 3.62 0.44 0.33 0.070 3.41 0.88 0.94 0.19 7.11 1.77 1.15 0.16 8.33 0.66 4.20 0.31 1.21 0.11 6.85 0.49 1.34 0.09
 19R-1418-ib 177.49 7.08 3.59 0.26 0.18 0.067 0.25 0.027 3.08 0.46 0.17 0.047 2.47 0.22 1.21 0.16 7.57 0.70 1.34 0.09 9.46 0.41 4.82 0.14 1.38 0.09 7.68 0.29 1.47 0.07
 19R-6466-id 146.49 17.01 2.90 0.65 0.16 0.034 0.23 0.017 2.19 0.62 0.17 0.047 2.72 0.71 1.05 0.27 5.97 1.33 1.24 0.28 9.01 2.25 4.65 1.03 1.30 0.31 7.64 1.71 1.47 0.36
 19R-1418-id 166.00 25.70 3.87 1.57 0.18 0.027 0.25 0.030 2.43 0.75 0.10 0.028 2.48 0.64 1.28 0.21 6.85 0.77 1.39 0.13 9.96 0.76 5.00 0.31 1.42 0.12 8.13 0.42 1.55 0.04

 Dy ± Ho ± Er ± Tm ± Yb ± Lu ± Hf ± Ta ± W ± Tl ± Pb ± Th ± U ±

 19R-6466-gm 11.19 0.27 2.46 0.05 7.48 0.18 1.14 0.04 8.13 0.17 1.21 0.03 3.73 0.10 0.18 0.010 0.04 0.008 0.01 0.0056 0.67 0.127 0.23 0.012 0.08 0.005
 19R-1418-gm 12.42 0.34 2.77 0.09 8.40 0.30 1.27 0.04 9.08 0.26 1.33 0.05 4.26 0.10 0.19 0.012 0.04 0.009 0.01 0.0025 0.58 0.052 0.27 0.018 0.08 0.009
 19R-6466-g-1 13.52 0.63 2.89 0.12 8.48 0.36 1.29 0.05 9.29 0.35 1.34 0.06 3.89 0.18 0.19 0.011 0.03 0.007 0.38 0.0620 0.62 0.076 0.24 0.010 0.23 0.050
 19R-6466-g-2 11.89 0.33 2.52 0.07 7.59 0.19 1.14 0.03 8.31 0.27 1.18 0.04 3.68 0.09 0.18 0.008 0.02 0.006 0.64 0.1234 0.56 0.156 0.23 0.009 0.15 0.030
 19R-1418-g-1 13.26 0.84 2.94 0.17 8.98 0.48 1.35 0.08 9.75 0.54 1.44 0.08 4.03 0.19 0.19 0.011 0.02 0.008 0.07 0.0096 0.96 0.152 0.25 0.012 0.11 0.017
 19R-1418-g-2 12.27 0.33 2.69 0.12 8.11 0.34 1.22 0.05 8.83 0.30 1.30 0.04 3.84 0.13 0.19 0.013 0.02 0.008 0.06 0.0155 1.43 1.896 0.24 0.013 0.10 0.010
 19R-6466-ib 10.26 0.39 2.27 0.09 7.05 0.27 1.06 0.05 7.74 0.26 1.11 0.06 5.26 0.44 0.28 0.023 0.01 0.003 1.48 0.3206 0.46 0.390 0.29 0.191 0.03 0.015
 19R-1418-ib 11.43 0.34 2.52 0.08 7.72 0.24 1.18 0.05 8.39 0.24 1.22 0.04 5.60 0.27 0.28 0.024 0.01 0.009 0.19 0.0396 1.60 2.208 0.25 0.035 0.03 0.005
 19R-6466-id 11.49 2.57 2.56 0.60 7.74 1.88 1.20 0.30 8.55 1.79 1.24 0.30 4.70 0.55 0.22 0.049 0.01 0.009 1.02 0.3705 1.59 2.143 0.19 0.060 0.02 0.006
 19R-1418-id 12.05 0.27 2.68 0.08 8.10 0.22 1.26 0.05 8.90 0.30 1.29 0.05 5.27 0.70 0.26 0.057 0.02 0.010 0.13 0.0506 2.13 2.462 0.26 0.060 0.02 0.004
 Page 11 of 23

 For abbreviations see legend in the table. All quoted uncertainties correspond to one standard deviation from the mean value. gm groundmass; g globule; id interface dark; ib interface bright
 2

13
2 Page 12 of 23 Contributions to Mineralogy and Petrology (2021) 176:2

Fig. 7  Extended trace element distribution of andesitic groundmass
and globules of the Izu-Bonin samples normalized to N-MORB.
Values for N-MORB trace element data were taken from Arevalo
and McDonough (2010). Trace element data from all Hole U1440B
forearc basalt units (FAB), as well as Unit 6 andesite samples are
shown for reference (Shervais et al. 2019; Li et al. 2019)

-1‰ , albeit with a much larger uncertainty compared to
the globules or interface (Fig. 9). The larger variability
of andesitic groundmass B isotopic composition com-
pared to the remaining textural domains ( 11 B = – 1
± 2.4 ‰ ) could be related to its low B abundance (ca.
2 g/g ). However, this possibility is at odds with the excel-
lent reproducibility of the 11B of the BCR-2G reference
glass material, which has only slightly higher B contents
( 4.5 g/g ) than the andesitic groundmass. Closer inspec-
tion of the individual LA-MC-ICP-MS measurement spots
of the andesitic groundmass reveals that it is spatially het-
erogeneous. Indeed, measurements carried out near the
interface display a slight tendency towards more elevated
 11B, which could mean that heavier interfacial material
was sampled during the LA-MC-ICP-MS measurements.
If these data are excluded, an average 11B of – 4.9 ± 2.4
‰ is obtained (Figure 9). However, the variation in 11B
does not correlate with the B content of the same laser
spots in the andesitic groundmass, which is near constant
at 2.1 ± 0.3 g/g . The slightly heavier 11B of the andesitic
groundmass near the interface relative to the more distal
glass domains could be interpreted as the result of dif- Fig. 8  Enrichment-depletion diagram: Selected trace elements meas-
 ured in the globules and the interface normalized to the trace element
fusive fractionation of B isotopes. However, B diffusion, content of the andesitic groundmass. Trace elements were separated
as measured in haplogranitic melts is very slow and it into three groups and are arrange to best display the variations rela-
is thought to result in negligible B isotope fractionation tive to the andesitic groundmass. Closed symbols refer to sample
(Chakraborty et al. 1993). It would thus appear that the 19R-6466 while open symbols are used for sample 19R-1418
observed heterogeneity of the B isotopic composition of
the andesitic groundmass is unrelated to either contamina- In order to calculate the 87Sr/86Sr i for each textural
tion by material from the interface or diffusive B isotope domain, mass-bias-corrected 87Sr/86 Sr was corrected
fractionation but is rather an intrinsic characteristic of this assuming an age of 51.34 Ma, which was determined
textural domain. on FAB from Hole 1440B, both above and below Unit 6

13
Contributions to Mineralogy and Petrology (2021) 176:2 Page 13 of 23 2 2010; Li et al. 2019; Shervais et al. 2019), and display MORB-like trace element patterns. FAB also show little to no evidence of mass transfer from the slab to the overly- ing mantle wedge (Reagan et al. 2010), a view supported by recent Hf-Nd-Sr-Pb isotope data (Li et al. 2019). FAB samples from U1440B and Exp. 352 in general show uni- formly low fluid—mobile trace element contents (Sher- vais et al. 2019; Li et al. 2019), which indicates a lack of slab fluid inputs to their mantle sources. The question then arises as to how these unique andesites from Unit 6 formed, and why they have become enriched in fluid- mobile trace elements like Cl, K2O, and B. A similar andesitic composition as in the andesitic groundmass can be produced after ca. 75% fractional crys- tallization from a FAB parental melt has taken place (at Fig. 9 Averages of the B isotope composition ( 11B) obtained for 150 MPa—calculated using Rhyolite-MELTS after Gualda each textural domain in the Unit 6 globular andesite samples versus et al. 2012; average FAB taken from Shervais et al. 2019). their measured B concentrations ( g/g). Average worldwide MORB Because presumed FAB water contents average 0.5 wt% taken from (Marschall et al. 2017). Quoted uncertainties are given as t-factor 95% confidence level intervals. The B isotope composi- (based on LOI data from Shervais et al. 2019), such an tion of each individual LA-MC-ICP-MS are shown in Supplementary andesitic composition would be expected to contain up Table S1 to 2.4 wt% H2O after 75% fractional crystallization. LOI values reported for bulk unit 6 andesite samples ranges between 0.35 and 2 wt% (Shervais et al. 2019), values that (Reagan et al. 2019). Globules and the andesitic ground- are consistent with an andesitic melt that resulted from mass have an almost identical age-corrected 87Sr/86Sr i of 75% fractional crystallization but that has since degassed 0.705802 (±9—uncertainty in the last significant digit) and lost some of its water in the process. Even assuming and 0.705758 (±10), respectively, while the interface some loss of water due to decompression as the magma is clearly more radiogenic than globules and andesitic ascends to shallower crustal levels (50–100 MPa), an groundmass with 0.707127 (±9). Even though care was andesitic composition is still expected to have a bit over taken in separating the different textural domains, we 1 wt% of water under those conditions (Shishkina et al. cannot exclude the possibility each textural material 2010), which is at odds with the absence of water from was contaminated by the others. However, given that either globules or the andesitic groundmass. Moreover, the Sr content of all textural domains is broadly similar forearc basalts from U1440B have an average 87Sr/86Sr i (41–50 g/g ), contamination is likely to lead to only rela- of 0.703284 (Li et al. 2019), whereas our Unit 6 globular tively small variations in measured 87Sr/86Sr. All textural andesite samples have age-corrected 87Sr/86Sr i of 0.705802 domains have Sr isotopic compositions that are signifi- and are, thus, far removed from their presumed parental cantly more radiogenic than other recovered FAB samples melts. The formation of Unit 6 globular andesites is there- adjacent to Unit 6 (e.g. Unit 3 – 0.703745 ± 4; Unit 7 fore unlikely to have resulted from the fractional crys- – 0.703537 ± 4; Li et al. 2019). tallization of a FAB parental melt alone. The assimila- tion of altered oceanic crust (AOC) with higher 87Sr/86 Discussion Sr i may potentially explain the Sr isotopic composition of the andesitic groundmass. Indeed, the elevated Cl/K Origin of the Unit 6 andesites (>3) of the andesitic groundmass strongly supports the possibility that AOC assimilation has taken place (Bickle In order to understand how the globular textures found in and Teagle 1992; Wanless et al. 2010; Harris et al. 2015; the Unit 6 andesites have developed, we must first discuss Marschall et al. 2017). The range in measured 11B across how the andesites themselves have formed. The andesites all textural domains (i.e. between -5 and +7) could have from Unit 6 are unique in that they are the only occurrence been inherited from the assimilation of isotopically heavy of this lithology in the entire lithostratigraphy recovered AOC (cf. Smith et al. 1995; Brounce et al. 2012; Marschall during drilling of Hole 1440B and are both preceded and et al. 2017; Marschall 2018) as it was assimilated by an succeeded by FAB (Reagan et al. 2015; Shervais et al. 2019). FAB are assumed to represent the first episode of partial melting after subduction initiation (Reagan et al. 13
2 Page 14 of 23 Contributions to Mineralogy and Petrology (2021) 176:2 isotopically lighter FAB. The globules’ elevated K 2O and not result in virtually identical Sr isotopic compositions in Tl contents are beyond the level of enrichment expected both the globules and the andesitic groundmass, and because due to the incompatibility of these elements ( Nielsen the likely mode of eruption, in a deep submarine extensional et al. 2006; Prytulak et al. 2017), while the high 87Sr/86 setting associated with the start of subduction (e.g. Shervais Sr i of 0.705758, and high 11B of ca. +7‰ are consistent et al. 2019), would inhibit vesiculation (cf. Moore 1970; with the signature of oceanic crust that has been over- Moore and Schilling 1973; Cichy et al. 2010). There is also printed by hydrothermal activity at shallow crustal levels. no clear evidence that these presumptive vesicles contracted An important implication of AOC assimilation is that it due to degassing, or that resorption of H 2O into melt or would introduce water and other volatile components to globules has taken place (globules and andesitic ground- an erstwhile volatile-poor forearc magma. A similar pro- mass are seemingly anhydrous), which would be expected to cess has been invoked by Wanless et al. (2010) to explain result from extensive vesiculation and degassing (McIntosh the formation of dacites and tholeiitic andesites associ- et al. 2014; Marxer et al. 2015). Low-temperature seafloor ated with MORB from the East Pacific Rise, which share alteration of these samples would be expected to introduce many of the characteristics described above (e.g. high K 2O elements like Cl and B in addition to water in the form of and Cl contents). secondary clays, hydroxy-chlorides and palagonite (Pauly et al. 2014; Seyfried Jr et al. 1986; Gibson et al. 1996). How- Secondary versus primary processes ever, Cl is depleted in the globules relative to the andesitic groundmass and, aside from the voids and the interface, and As mentioned previously, globular textures, like the ones potentially alkali feldspar in the globules, neither textural exhibited by our samples can be explained by a number of domain shows evidence of extensive secondary mineralogy. primary (magma mingling, liquid immiscibility), second- Moreover, although the B concentration of the globules is ary (devitrification, alteration, spherulitic crystallization), over a factor of ten higher than in the andesitic groundmass, and hybrid processes (vesicle segregation). Below, we will its isotopic composition is heavier (Fig. 9. The higher 11B discuss the pros and cons of each one of these processes to of the globules compared to the andesitic groundmass is explain the formation of the Unit 6 Globular andesites, a inconsistent with the adsorption of B into secondary clays summary of which can be found in Table 3. and palagonite due to low-temperature alteration, which The alteration of volcanic samples can result in spheri- results in an enrichment of lighter 10 B (Pauly et al. 2014; cal structures by taking advantage of pre-existent spherical Fonseca et al. 2017). It is thus unlikely that the formation textures or fabrics, such as large roundish voids, vesicles or of the globules and the andesitic groundmass in the Unit spherulites like those depicted in this study. For example, 6 globular andesite can be explained by low-temperature prominent macroscopic varioles found in the flow-banded seafloor alteration. pillow lava from the Hooggenoeg Complex within the Another possibility that could explain the globular tex- Barberton Greenstone Belt in South Africa are thought to tures found in Unit 6 andesites is that the globules may con- result from the overprint of a pre-existent spherulitic tex- sist of segregation vesicles (Smith 1967). Segregation vesi- ture during low-grade metamorphism (Sandstå et al. 2011). cles are roundish and elongated structures that are thought to Spherulitic crystallization is indeed ubiquitous in our sam- be filled with the residue from the crystallizing magma sur- ples, yet in this case it did not result in the development of rounding them (Smith 1967; Sato 1978). They are thought spherical units, but rather in cells with mostly straight to to result from the migration of that residual liquid through a lightly curved contact surfaces redolent of a polygonal or permeable, already crystalline groundmass, characterized by granoblastic texture (see Fig. 3a; for a detailed description a rigid network of interlocking crystals (Smith 1967; Ander- of this process refer to the supplementary information). If son Jr et al. 1984). The migration of the residual liquid is alteration has been involved in the formation of the globules driven by the establishment of a pressure gradient due to of this study, it is not associated with spherulitic crystalliza- volatile build-up in a late-stage magma, whereby the liquid tion. Importantly, the near 100 wt% totals for the electron is pressed out of the crystalline groundmass into pre-exist- microprobe analyses of the globules are inconsistent with ing vesicles (Anderson Jr. et al. 1984). This process could low-temperature alteration of these samples, which would explain some of the textural characteristics of our samples typically result in the addition of water through de-vitrifica- (e.g. round shape of the globules), and the similarity in the tion and low-temperature alteration of the glass, even if the Sr isotope composition of the globules and andesitic ground- spherulitic textures were left intact (cf. Lowenstern et al. mass, as they derive from the same parental melt. Moreover, 2018). Another possibility is that vesicles, which could have Anderson Jr. et al. (1984) pointed out that material found originally formed as a result of degassing, were subsequently in these vesicles is often enriched in K2O relative to the infilled by an hydrothermal fluid forming the globules. This groundmass surround it, which we also see in the relation- possibility is highly unlikely, both because it would probably ship between globules and andesitic groundmass. However, 13
Table 3  List of possible processes that can be used to explain the sum of geochemical and textural characteristics exhibited by the Unit 6 Andesite samples from this study and the pros and cons
 of each hypothesis
 Process Compositional contrast Water content Textural characteristics Geochemistry

 Primary processes
 Magma mingling Yes. Compositions are similar enough Yes. The absence of water is consistent No. Mingling does not explain the Inconclusive. Similarity in age corrected
 that mingling could occur with mingling roundish shape of the globules, nor Sr isotopes could be explained if both
 the presence of a devitrified interface melts are co-genetic. Contrasting B
 isotope compositions is harder to
 explain unless one of the melts assimi-
 lated AOC
 Contributions to Mineralogy and Petrology

 Silicate melt immiscilibity No. SiO2 ∕FeO ratios are not suffi- Yes. Given that neither globules or Inconclusive. This process is consistent No. While consistent with the Sr isotope
 ciently different. glass matrix have water, this does not with the morphology of the globules, data, this process is not expected to
 invalidate the possibility of silicate but does not explain the presence of result in B isotope fractionation, or in
 melt immiscibility the interface, or the internal orbicular the fractionation of fluid-mobile trace
 fabric of the globules elements
 Fluid-melt immiscibility Inconclusive. Presumed solute Inconclusive. The absence of water Yes. The globule morphology, its Yes. Both fluid and conjugate melt are
 (2021) 176:2

 (due to degassing) composition falls outside of what is from both globules and andesitite relationship with the andesitic expected to have the same Sr isotope
 expected from experimental studies, groundmass is problematic, as one groundmass, and the presence of a composition once age corrected. Dif-
 where coupled enrichments in Al and would not expect degassing to be that devitrified interface are consistent ference in B isotope composition is
 Si and depletions in Fe and Mg are eficcient at seafloor pressures (e.g. with fluid-melt immiscibility consistent with fluid-melt equilibria at
 expected 50 MPa) magmatic temperatures (ca. 800 ◦ C).
 Fractionation of fluid-mobile elements
 is also consistent with previous work
 Hybrid process
 Segregation vesicles Yes. The different compositions are Inconclusive. In order for vesicula- No. Typical vesicles are elongated, Inconclusive. Similarity in age corrected
 entirely consistent with this possibil- tion to form, some volatile species irregular and submilimetric in size, Sr isotopes could be explained if both
 ity, albeit one would expect the more is required. However, the absence of a far cry from the round-shaped melts are co-genetic. Vesicles are often
 evolved composition to segregate into water from the andesitic groundmass almost cm-sized globules seen in our reported to be K2 O-rich. However,
 vesicles, not the other way around and globules does not rule out the samples. Also, segregation vesicles contrasting B isotope compositions
 degassing that would be needed for are typically restricted to the evolved is harder to explain unless one of the
 vesiculation to form mesostases of already crystalline melts assimilated AOC. Why would
 rocks segregrated melts be enriched in some
 fluid-mobile elements an not others?
 Secondary processes
 Spehrulitic crystallization No. Spherulitic crystallization on its Yes. Loss of water from a melt can Inconclusive. This process is clearly No. Spherulitic crystallization could
 own does not result in the establishe- result in rapid nucleation and the seen in the andesitic groundmass, have made the globules more suscepti-
 ment of compositional contrasts. development of spherulitic crystal- and it is overprinted by the interface, ble to alteration, and thus introduce B
 These may be established after later lization. This process is widespread but it is not observable to the same and Sr from seawater. However, low-T
 alteration in the andesitic groundmass, but is extent in the globules. Also the glob- adsorption of B would introduce light
 not mimicked to the same extent by ule’s internal orbicular fabric is not B isotopes, and alteration by seawater
 the globules consistent with the globules resulting does not explain the identical age cor-
 Page 15 of 23

 from this process rected Sr isotope ratios. Cl- depletion
 from the globules is also not explain-
 2

 able by spherulitic crystallization

13
You can also read


