Rapid parallel adaptation despite gene flow in silent crickets
←
→
Page content transcription
If your browser does not render page correctly, please read the page content below
ARTICLE
                  https://doi.org/10.1038/s41467-020-20263-4                OPEN

                  Rapid parallel adaptation despite gene flow in silent
                  crickets
                  Xiao Zhang          1,3 ✉,   Jack G. Rayner1,3, Mark Blaxter2 & Nathan W. Bailey1 ✉

                  Gene flow is predicted to impede parallel adaptation via de novo mutation, because it can
                  introduce pre-existing adaptive alleles from population to population. We test this using
1234567890():,;

                  Hawaiian crickets (Teleogryllus oceanicus) in which ‘flatwing’ males that lack sound-producing
                  wing structures recently arose and spread under selection from an acoustically-orienting
                  parasitoid. Morphometric and genetic comparisons identify distinct flatwing phenotypes in
                  populations on three islands, localized to different loci. Nevertheless, we detect strong, recent
                  and ongoing gene flow among the populations. Using genome scans and gene expression
                  analysis we find that parallel evolution of flatwing on different islands is associated with
                  shared genomic hotspots of adaptation that contain the gene doublesex, but the form of
                  selection differs among islands and corresponds to known flatwing demographics in the wild.
                  We thus show how parallel adaptation can occur on contemporary timescales despite gene
                  flow, indicating that it could be less constrained than previously appreciated.

                  1 Schoolof Biology, University of St Andrews, St Andrews, Fife KY16 9TH, UK. 2 Tree of Life, Wellcome Sanger Institute, Cambridge CB10 1SA, UK. 3These
                  authors contributed equally: Xiao Zhang, Jack G. Rayner. ✉email: xz42@st-andrews.ac.uk; nwb3@st-andrews.ac.uk

                  NATURE COMMUNICATIONS | (2021)12:50 | https://doi.org/10.1038/s41467-020-20263-4 | www.nature.com/naturecommunications                              1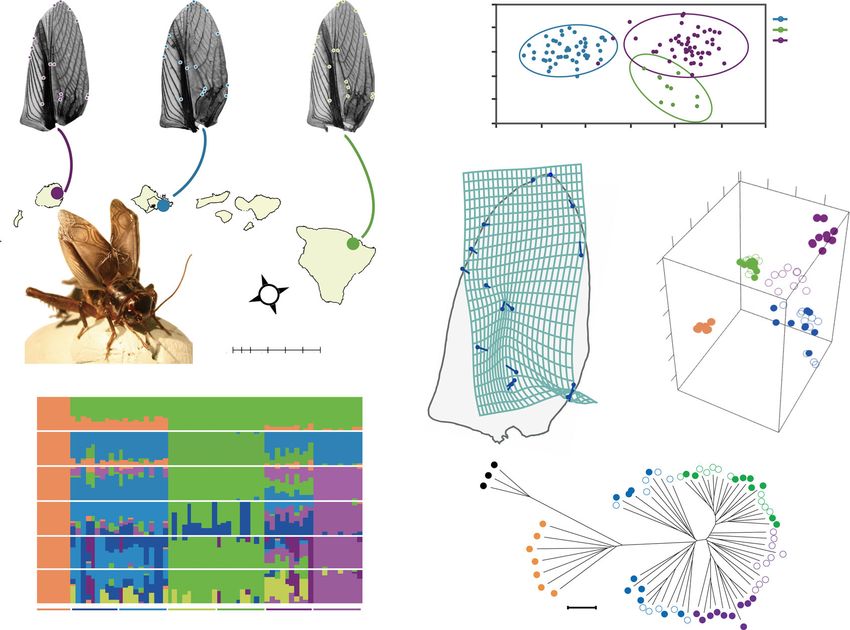
ARTICLE                                                                NATURE COMMUNICATIONS | https://doi.org/10.1038/s41467-020-20263-4

A
        daptive evolution can be surprisingly repeatable. Con-                  Here, we take advantage of the repeated evolutionary origin
        vergent phenotypic evolution occurs when similar                     and spread of flatwing crickets in multiple Hawaiian island
        selection pressures drive the spread of functionally                 populations to test the expected trade-off between gene flow and
identical traits at the organismal level but in different                    rapid parallel adaptation via independent mutational events,
populations1,2. One way this can occur is through adaptive                   which is predicted by standard evolutionary models5–10. We first
introgression, by repeatedly introducing the same pre-existing               compare morphometric differences among flatwing male crickets
adaptive allele from one population into others, whereupon                   on three islands of the Hawaii archipelago, then resequence 70
they are selected. In this scenario, gene flow is predicted to play           cricket genomes at high coverage: normal-wing and flatwing
an important role in moving the same allelic variants, which                 males from all Hawaiian populations, plus a non-parasitized,
share a single mutational origin, among populations3. In con-                normal-wing Australian population and a sister species outgroup
trast, parallel evolution occurs when traits that are functionally           T. commodus. Association and selection analyses localise flatwing
identical at the organismal level nonetheless have independent               to different loci in each of the three Hawaiian populations but
mutational origins at the genetic level3,4. In the latter case,              also highlight a putative genomic hotspot of adaptation, which
uniquely arisen adaptive genetic variants are independently                  has been subject to distinct processes that have left different
selected in different populations, and theory strongly predicts              signatures of selection in each population. By reconstructing
that high levels of gene flow will reduce the likelihood of par-              historical population demographic patterns both autosome-wide
allel evolution5–10. For that reason, the most compelling                    and for X-linked loci, we find evidence of extensive, recent, and
examples of parallel evolution are those that have been docu-                ongoing genome-wide gene flow among all three populations, but
mented in highly isolated populations, for example, the inde-                no evidence of flatwing introgression. We reconstruct the his-
pendent selection of different genetic variations that enable                torical demographic population genetics of these populations as
rabbits (Oryctolagus cuniculus) on different continents to sur-              well as signatures of selection on adaptation hotspots in each. We
vive myxoma virus11, and the repeated adaptive deletion of the               interrogate a candidate region identified by the analyses above,
Pitx1 gene, which causes stickleback (Gasterosteus aculeatus)                containing the gene doublesex (dsx), which has been widely
pelvic reduction in different spatially isolated lake systems12,13.          implicated in sex-specific adaptive traits in other insects, by
Exceptions to this general pattern are only predicted when                   quantifying gene expression in developing wingbuds of different
selection is extreme or mutation rates are particularly high3,14,            male morphs on two islands where flatwing crickets exist in
but these scenarios are difficult to empirically test in natural              appreciable abundance (Kauai and Oahu). Our results reveal that
systems. Most adaptive novelties arose and spread in the distant             parallel evolution can occur despite gene flow, indicate how this
past, necessitating the use of sophisticated techniques to dis-              process occurs, and implicate the doublesex pathway in the
tinguish processes such as incomplete lineage sorting and gene               repeated origins of an adaptive, male-feminising trait in wild
flow15–17. Dissecting the mutational origins of novel adaptive                insects.
traits undergoing convergent phenotypic evolution, while
simultaneously inferring gene flow, is complicated by these
sorts of demographic developments occurring during and after                 Results
episodes of adaptive evolution18,19. Thus a question at the                  Morphological analysis indicates unique wing adaptations.
centre of arguments about evolvability and adaptive potential                Structures formed by specialised veins on the forewings of male
remains largely unsolved: Can parallel evolution underpinned                 crickets normally produce sound when males move their wings
by independent mutations occur despite high levels of gene                   back and forth across one another during singing. However, these
flow, and if so, how?                                                         structures are either absent or severely reduced in flatwing males.
   We addressed this question using a unique system of rapidly               Thus feminised, flatwing males are prevented from making sound
evolving field crickets (Teleogryllus oceanicus) on the Hawaiian              even though they still move their wings in the motor pattern
archipelago. Typically, male crickets attract females for mating by          characteristic of singing, but without producing audible sound
rubbing their wings together to produce a conspicuous, long-                 (Fig. 1a)20,23,26. Flatwing venation differs between Kauai and
range acoustic signal. However, in approximately 2003, a variant             Oahu males and appears to be under independent genetic con-
segregating in the manner of a single locus on the X chromosome              trol23, so to test whether the wing venation of flatwing males is
—flatwing—arose and spread in a population on the island of                   morphologically distinct among all three populations we studied
Kauai20. This adaptive allele erases sound-producing structures              here, we collected right forewings of 114 wild flatwing male
on males’ wings during development, causing them to resemble                 crickets over multiple years from populations on the islands of
the undifferentiated wings of females (Fig. 1a)21. Silence protects          Kauai, Oahu and Hilo (Supplementary Table 1). Landmark-based
these ‘flatwing’ males from fatal attack by an acoustically                   geometric morphometric analysis23,27 revealed that wing vena-
orienting endoparasitoid fly, Ormia ochracea20. The combination               tion of flatwing males differed markedly among the three popu-
of a novel adaptive variant and acoustically orienting parasitoids           lations (multivariate analyses of variance: all P < 0.001,
has driven the recent, rapid evolution of male silence, increasing           Supplementary Table 2). We then used canonical variate analysis
the abundance of flatwing males from 0% to over 95% in ca.                    to visualise the main sources of variation among flatwing males
20–30 generations20. Protective flatwing male morphs were found               from the three islands. All three populations were distinguishable
2 years later on the neighbouring islands of Oahu, and 5 years               with Hilo flatwings more similar to Kauai flatwings than to Oahu
later on the Big Island (hereafter Hilo), and evidence from the              flatwings (Fig. 1b, c), though this must be interpreted cautiously
field shows that the flatwing morph is now fixed at 100% in the                 owing to the small number of Hilo flatwing crickets in the wild.
Kauai population (Fig. 1a)21–25. The flatwing male morph has                  However, this pattern is visible to the naked eye (Fig. 1a). Hilo
never been found outside of Hawaii. Previous research using lab-             and Kauai flatwing individuals tend to have completely lost their
reared lines provided evidence that both Kauai and Oahu flatwing              scraper—the thickened ridge of tissue on the wing margin, which
loci (fwK and fwO, respectively) show the same mode of inheri-               engages the other wing during movement—but a vestigial scraper
tance on the X chromosome yet are predominately associated                   has been retained by most Oahu flatwings (Fig. 1a, c). Despite this
with different restriction site associated DNA (RAD) markers,                variation, all flatwing males are functionally silent26. Although all
suggesting they are independently generated alleles21,23.                    flatwing males had reduced or absent resonators (enlarged wing

2               NATURE COMMUNICATIONS | (2021)12:50 | https://doi.org/10.1038/s41467-020-20263-4 | www.nature.com/naturecommunications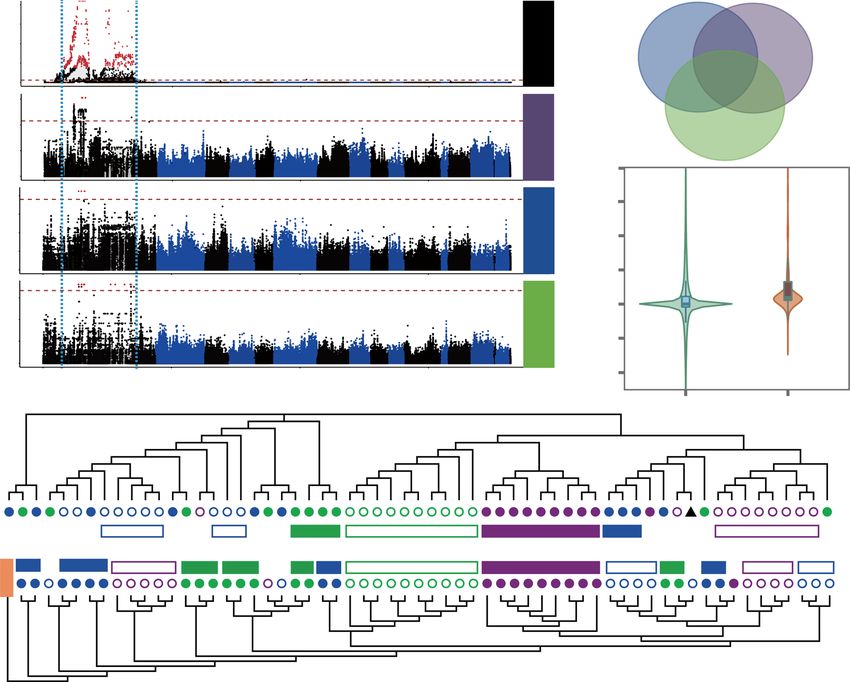
NATURE COMMUNICATIONS | https://doi.org/10.1038/s41467-020-20263-4 ARTICLE
a b 4.0
Oahu
Canonical variate 2
2.0 Hilo
Kauai
0.0
-2.0
-4.0
-6.0
-6.0 -4.0 -2.0 0.0 2.0 4.0 6.0
Canonical variate 1
Kauai Oahu Hilo
100% flatwing 45% flatwing 0.1 0.2
(Big island) 0
0.1
5% flatwing 0
c d -0.1
-0.1
-0.2
-0.3
N 0.3
E
0.2
PC 3 (4.5 %)
W
S 0.1
30 0 30 60 90 120 km 0
-0.1
%)
.7
-0.2
12
e
1(
PC
PC
K=2 2 (5
.1 %
)
K=3
K=4
f
K=5
K=6
Hilo (H/G)
Oahu (N/F)
Kauai (L/K)
K=7 Australia (A,C)
T. commodus (B)
AC N F G H K L 0.050
Fig. 1 Geographic, morphological and genetic variation in silent Hawaiian crickets. a Representative right forewings of flatwing T. oceanicus males from
populations on the Hawaiian islands of Kauai, Oahu and the Big Island (Hilo). Map drawn using QGIS v2.18.24 (http://qgis.org). Dots on wing veins
indicate geometric morphometric landmarks, and colours reflect the scheme used in this manuscript if not stated otherwise (purple = Kauai, blue = Oahu,
green = Hilo). Bottom left photo: A normal-wing male for comparison (Photo credit: N.W. Bailey). b Flatwing wing venation differs among the three
populations. Canonical variates analysis (CVA) showing multivariate differences in wing veins of flatwing males from Kauai, Oahu and Hilo. Source data are
provided as a Source Data file. c Deformation grid illustrating the major differences in forewing venation between flatwing males from the three
populations. The outline indicates a generic male forewing, and arrows show vectors representing landmark variation on CV1 (scaling factor of 10). d There
is clear population genetic differentiation among the three islands. Genome-wide differentiation among T. oceanicus populations shown in a three-
dimensional PCA scatter diagram based on autosomal SNPs. Australian T. oceanicus outgroup samples are indicated in orange. Solid circles = normal-wing
males, open circles = flatwing males. e However, population structure analysis indicated an optimal group size of K = 5, likely reflecting our inclusion of
lab-raised normal-wing Kauai males and lab-raised flatwing Hilo males. Different colours indicate genetically distinct groups. f Neighbour-joining
phylogenetic tree based on autosomal SNPs. Symbols and colour coding for T. oceanicus samples are as above, and black circles = T. commodus outgroup.
The scale bar represents the level of genetic similarity.
cells that vibrate during singing), the degree of this reduction More than 96% of the re-sequencing reads successfully mapped
varied among populations (Fig. 1a). to the T. oceanicus reference genome21, confirming the quality of
this re-sequencing dataset. We used a customised pipeline to
account for potential biases caused by outgroups or sequencing
Background genetic structure of cricket populations under errors to obtain a total of 107 million high-quality single
convergent fly selection. We resequenced whole genomes of 70 nucleotide polymorphisms (SNPs) (Supplementary Data 2). To
male crickets to an average depth of 25×. Twenty males (10 of each examine background genome-wide population structure exclud-
morph; flatwing and normal-wing) were derived from parasitized ing any sex-linked or flatwing-associated effects, a neighbour-
populations on each of three Hawaiian islands (Kauai, Oahu and joining tree based on pairwise genetic distances was constructed
Hilo) (Fig. 1a). Seven normal-wing male T. oceanicus from Aus- using autosomal SNP data (Fig. 1f). In Hawaii, individuals
tralia plus three males of the sister species T. commodus (which also grouped into three population-specific clades, and Oahu was
have normal-wing morphology) were also sequenced. Supplemen- most closely related to the Australian outgroup (Fig. 1f and
tary Table 3 provides further sampling details. Australian popula- Supplementary Fig. 2). Flatwing and normal-wing individuals
tions are not known to be subject to selection pressure from the were not split into two subclades except for Kauai individuals
parasitoid fly (Fig. 1a), making them a useful comparison in (purple circles of Fig. 1d, f and Supplementary Figs. 2, 3), which
selection analyses, and the sibling species T. commodus was used as likely reflects founder effects among these lab-reared samples.
an outgroup (Fig. 1 and Supplementary Table 3, Supplementary Principal component analysis (PCA) and genetic structure
Data 1). All crickets were wild-caught with the following exceptions: analysis are consistent with the NJ tree (Fig. 1d, e and
Because normal-wing crickets now appear to be extinct in the Kauai Supplementary Fig. 1). Morphometric and autosomal genetic
population24,28, and flatwing crickets only exist in extremely low data yielded notably similar patterns of relatedness among island
abundance in the Hilo population23, we resequenced lab-reared populations: Kauai and Hilo were more similar to each other than
individuals established from wild-caught ancestors for these groups. either was to Oahu despite their greater geographic distance.
NATURE COMMUNICATIONS | (2021)12:50 | https://doi.org/10.1038/s41467-020-20263-4 | www.nature.com/naturecommunications 3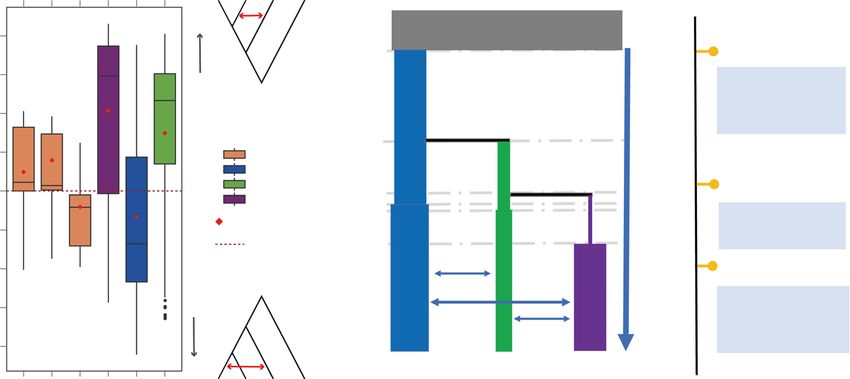
ARTICLE                                                                                                                        NATURE COMMUNICATIONS | https://doi.org/10.1038/s41467-020-20263-4

                         a                                   Population 2 (P2)                                                 b
                                                          Kauai Oahu Kauai Hilo Kauai Kauai     P1      P2      P3 Outgroup

                                                   0.8                                                                                            428.2 K
                                                                                               ABBA                                                                            827 BP
                                                                                               excess                                                                                    1,600~700 BP
                                                                                               (D>0)
                                                   0.6
                                                                                                                                                                                           Polynesian
                                                                                                                                    2.6
                                                                                                                                                                                          settlement of

                        Patterson’s D-statistics
                                                   0.4
                                                                                                                                     K                                                       Hawaii
                                                                                              Population 3 (P3)
                                                                                                                                                                               573 BP
                                                   0.2                                                       Australia
                                                                                                             Oahu                                        1                               567~ 417 BP
                                                                                                                                                         K
                                                   0.0
                                                                                                             Hilo                                                              426 BP    (1450~1600CE)
                                                                                                             Kauai                                                             404 BP
                                                                                                     Multiple individuals’ D                                                   389 BP     Expansion of
                                                   −0.2                                               (block size 500kb)
                                                                                                          Null expectation
                                                                                                                                                                                         agricultural land
                                                                                                                                                                               293 BP
                                                   −0.4
                                                                                                                                   3.1 K
                                                                                                                                                        1.2                              230 BP(1787 CE)
                                                                                                                                           1.5 ×10 -4    K
                                                                                                                                                                         2.7
                                                   −0.6                                                                                                                  K                  Arrival of
                                                                                              BABA                                         6.7×10⁻⁴                                         European
                                                                                              excess                                                          5.2×10⁻⁴                      explorers
                                                   −0.8                                       (D
NATURE COMMUNICATIONS | https://doi.org/10.1038/s41467-020-20263-4 ARTICLE
extant populations plus one assumed ancestral population, all flatwing-associated scaffolds were shared by all three islands
possible scenarios of island permutation for each divergence (Fig. 3b and Supplementary Fig. 7, Supplementary Table 7).
pattern, and two gene flow scenarios (i.e. whether or not Considering that one scaffold is a physically continuous genetic
recent gene flow occurred among the three islands) for each region, one possible explanation is that these regions contain
permutation. potential ‘genomic hotspots’ of adaptation in which recurrent
The results indicate that gene flow among all three islands mutations lead to the evolution of flawing morphology. Alter-
started recently, and occurred continuously until the present, natively, this pattern could be caused by adaptive introgression of
rather than transiently. Almost all scenarios assuming recent gene the same causative flatwing mutation(s) being masked in our
flow were more probable than those without gene flow analysis by potential biases of performing three separate GWASs,
(Supplementary Data 4). The best-fit model suggested that for example, due to population genetic structure. To further
crickets appeared in Oahu first, more than 800 years ago. Then, evaluate the idea that parallel evolution occurred in genetic
the Hilo population split from the Oahu population about 570 hotspots, we established maximum-likelihood phylogenetic trees
years ago. Finally, about 400 years ago, the Kauai population using SNPs extracted from (1) flatwing-associated scaffolds
diverged from the Hilo population. All three populations shared by different populations, (2) GWAS candidate SNP sets
experienced ancient bottlenecks followed by recent population from all populations combined, (3) each of the three population-
expansions, with symmetrical gene flow starting within the last specific GWAS candidate SNP sets separately, and (4) flanking
300–400 years and continuing today (Fig. 2b and Supplementary regions of these flatwing-associated SNPs. Given our precise
Data 4). These dates coincide with the history of the Polynesian knowledge of how recently flatwing appeared in each
settlement of Hawaii, followed by expansion of the human population20,22,23, if a single flatwing allele had arisen and
population, and the arrival of European explorers, respectively introgressed among populations, then trees built using restrictive
(Fig. 2b). We also used Pairwise Sequentially Markovian sets of markers strongly linked to the flatwing phenotype should
Coalescent (PSMC) models to infer more ancient demographic show elevated relatedness of all flatwing individuals regardless of
history (Supplementary Fig. 6)36. The ancestral effective popula- their population origin compared to normal-wing individuals.
tion size of Hawaiian crickets showed a peak about 20,000 years None of the unrooted trees using Hawaiian individuals, nor
ago followed by a decline involving at least a twofold decrease in rooted trees with Australian individuals as outgroups, supported
the effective population size coinciding with the last glacial such an adaptive introgression scenario: flatwing individuals from
maximum37, likely reflecting their putative ‘out-of-Australia’ different populations did not all cluster together as would be
origins and island-hopping across the Pacific38,39. expected if flatwing-associated regions were shared due to recent
introgression across populations (Fig. 3c, d and Supplementary
Figs. 8–25). Because the sex of crickets is determined by an XX/
Genomic hotspots implicated in rapid parallel adaptation of XO (female/male) system, and only males were used here (except
silent crickets. To dissect the genetic basis of convergent phe- the one reference genome that was represented by triangle), these
notypic evolution in silent Hawaiian crickets and test whether it trees can also be considered to suggest relationships of different
has been driven by adaptive introgression or parallel evolution, haplotypes.
we performed three independent genome-wide association stu- We further tested this idea using samples for which wild-
dies (GWAS), one for each island. Because of the extreme scarcity caught flatwing individuals were resequenced, i.e. Kauai and
of Kauai normal-wing males and Hilo flatwing males, GWAS Oahu flatwings, to avoid confounds of using lab-bottlenecked
involving these two morphs used lab stocks established from the individuals. If flatwing introgressed very recently through these
offspring of wild-caught individuals (see ‘Methods’ section). Our Hawaiian populations, a divergence of flatwing-associated allele
previous quantitative trait locus (QTL) mapping of flatwing in (s) between population pairs should be lower than the divergence
Kauai yielded a broad peak occupying approximately one-third of of other loci on the X chromosome40–42. Instead, we found that
the X chromosome (redrawn from ref. 21 using pseudomolecule net nucleotide divergence (d) between Oahu and Kauai wild
coordinates (bp); top panel of Fig. 3a). Here, we substantially flatwing individuals at flatwing-associated regions was signifi-
narrowed this candidate region to three small SNP datasets cantly greater than that for all other X chromosome regions
varying from 5 to 615 flatwing-associated SNPs, spanning (Fig. 3e, two-sided t-test: P < 0.001; n = 437 sliding windows
3–17 scaffolds of the X chromosome (Fig. 3a and Supplementary within flatwing region, n = 66,211 sliding windows outside
Table 6, Supplementary Data 5). Among all flatwing-associated flatwing region; additional statistical details are reported in
SNPs, 83 overlapped with 32 protein-coding genes, most of which Supplementary Fig. 26a), while absolute divergence (dxy) between
have a role in D. melanogaster wing development or other rele- flatwing-associated regions versus other X chromosome regions
vant developmental processes (Supplementary Data 6). was similar (Supplementary Fig. 26b, see ‘Methods’ section).
It was important that inferences from separate GWAS analyses These results, combined with a lack of shared flatwing-associated
were comparable across Hawaiian populations containing flatw- SNPs and structural variants and long-range, complete linkage
ing males; that is, flatwing-associated SNPs needed to be detected disequilibrium on flatwing-associated scaffolds (see below)
with a uniform criterion for false discovery rate (FDR) in all three supported the recent independent origins of flatwing crickets
analyses. We therefore subsetted the Hilo and Kauai flatwing- on different islands.
associated SNPs according to the most conservative criterion Structural variants (SVs) can have a strong influence on
based on the Oahu GWAS (Fig. 3a, red dots), for which all adaptive evolution in insects43,44. We identified a total of 6971
samples from both morphs had been obtained from the wild. deletions, 4482 translocations, 3385 inversions, 211 insertions and
Both the initial, relaxed set of flatwing-associated markers and the 17,670 copy number variation regions (CNVRs) located in the X
second, conservative set of flatwing-associated markers yielded chromosome among Kauai, Oahu and Hilo populations (Supple-
the same pattern: no flatwing-associated SNP was shared by any mentary Fig. 27, Supplementary Table 8). If the same structural
of the three populations (Supplementary Table 6, Supplementary variants were associated with flatwing morphology on different
Data 5). This pattern was consistent with different genetic causes islands, this would be inconsistent with independent mutational
of flatwing in Kauai, Oahu and Hilo, however, we found that origins of flatwing in those populations. However, we did not
different flatwing-associated SNPs in the populations were uncover any candidate association between structural variants
sometimes located on the same scaffold. Two of these candidate and the flatwing phenotype within islands except for Kauai
NATURE COMMUNICATIONS | (2021)12:50 | https://doi.org/10.1038/s41467-020-20263-4 | www.nature.com/naturecommunications 5ARTICLE NATURE COMMUNICATIONS | https://doi.org/10.1038/s41467-020-20263-4
a 100
b Oahu Kauai
Kauai QTL
-log10 (P)
75
0
50 0 2
25
2
0
1 0
-log10 (P) 15
Kauai
10
6
Hilo
5
0 e 2
8
1.5
-log10 (P)
Oahu
6
4 1
d (x10-3)
2
0 0.5
9
-log10 (P)
0
Hilo
6
3 -0.5
0
-1
Genome position (bp)
Chromosome X Flatwing-
c associated
regions
d
Fig. 3 Putative genomic hotspots containing different flatwing-associated loci in cricket populations on three Hawaiian islands. a Flatwing association
mapping. Data from a previously published flatwing QTL21 are shown on top, with red symbols showing flatwing-associated SNPs and blue vertical lines the
extent of the QTL on the X-linkage group (left-most block of black markers). Horizontal dashed lines indicate FDR-corrected significance thresholds, and
alternating shades of black and blue indicate different linkage groups. For the lower three panels, the most significant markers are defined as described in
the main text using the strictest criterion and plotted in red. b Venn diagram showing candidate X chromosome scaffolds associated with the flatwing
phenotype for each population, all detected using the most stringent Oahu criterion. c Unrooted maximum-likelihood consensus tree for the two flatwing-
associated scaffolds shared by all islands. d Rooted maximum-likelihood consensus tree for all 1 kb flanking regions of all flatwing-associated SNPs. c, d
Normal-wing males are represented with solid circles and flatwing males with open circles. Clustered individuals (≥2) are highlighted using filled (normal-
wing) and open (flatwing) boxes if they were from the same island population and shared the same wing phenotype. Black triangles represent the individual
used as the reference genome21. Orange rectangle represents seven Australian individuals, which were used as an outgroup. e Violin plot of net genetic
distance (d) outside and within flatwing-associated regions on chromosome X between flatwing Kauai and flatwing Oahu samples. Distances were
calculated in 10 kb sliding windows with 2.5 kb steps (n = 66,211 and 437 windows, respectively). Values for upper quartile, median, and lower quartile, plus
1.5× interquartile ranges, are indicated with box plots in the middle of the violin plots. Additional statistical details are provided in Supplementary Fig. 26a.
(Supplementary Fig. 27 and Supplementary Data 7-8), consistent Selection is expected to reduce genetic diversity and elevate
with the hypothesis of parallel evolution. linkage disequilibrium (LD)33,45. For all wild populations, flatwing
individuals repeatedly showed significantly lower nucleotide
Signatures of selection on flatwing-associated regions differ diversity (π) than normal-wing individuals in the flatwing hotspot
across populations. To examine the genomic signatures of scaffolds (Wilcoxon rank-sum tests, all P < 0.001, 5% of empirical
selection on flatwing males, we identified selective-sweep regions distribution, Fig. 4c, d and Supplementary Fig. 30a, b). FST between
by comparing π log-ratios vs. population differentiation (FST) flatwing and normal-wing individuals was also significantly elevated
between wild flatwing Hawaiian crickets and normal-wing Aus- above genome-wide levels (Fig. 4c, d and Supplementary Fig. 30).
tralian crickets, which are not under selection pressure from O. Consistent with recent extreme positive selection, we observed
ochracea (Fig. 4a)33,45. Approximately 1460 putative selective- unusually long-range complete LD and significantly negative
sweep regions were identified, comprising ca. 1% of the genome. Tajima’s D-values in Kauai, in which rapid evolution completely
Fifteen flatwing-associated SNPs were located in the selective- fixed the flatwing morphotype within ca. 15 years22,24,25 (top panels
sweep regions (Supplementary Table 9). The two flatwing ‘hot- of Fig. 4b and Supplementary Figs. 28, 29). However, the Oahu
spot’ scaffolds identified by GWAS analyses and shared by all population showed a much different signature of selection in this
islands (Contig18404_pilon and Contig6636_pilon, hereafter region (bottom panel of Fig. 4b, e). For Oahu flatwing individuals,
‘scaffold 18404’ and ‘scaffold 6636’; Fig. 3b) were also recovered the flanking regions of flatwing-associated SNPs showed only a very
in this independent selective-sweep analysis (Fig. 4 and Supple- modest elevation of LD (Supplementary Fig 28). In addition, when
mentary Figs. 28–30). we analysed all the wild Oahu samples (including flatwing and
6 NATURE COMMUNICATIONS | (2021)12:50 | https://doi.org/10.1038/s41467-020-20263-4 | www.nature.com/naturecommunicationsNATURE COMMUNICATIONS | https://doi.org/10.1038/s41467-020-20263-4 ARTICLE
a b 1
0.4
r2
00 000 000
i
ua
Significant Chr X bins 0.1
6
Ka
Significant autosomal bins
Count
0
g
4
Other autosomal bins
in
tw
Other Chr X bins
20
fla
0 3
2
) K
20 0 0 500 1000 1300
1
40 0
00
00
0
AC
60
log10 (
0
-1
hu
Oa
-2
g
in
tw
0 0.25 0.50 0.75 1.00
fla
40 0
60 0
00
00
20 0
0
0
80
FST Count
c 0 250 500 750 1000 1250
0.6
FST
0.4
0.2
Kauai
3
log10 (πAC /πK)
2
1
0
d 0.6
FST
0.4
Oahu
0.2
log10 (πAC /πF)
3
2
1
e 3 Australia
Tajima’s D
2
Kauai
1
0 Oahu
-1
Hilo
-2
0 250 500 750 1000 1250
Position (kb)
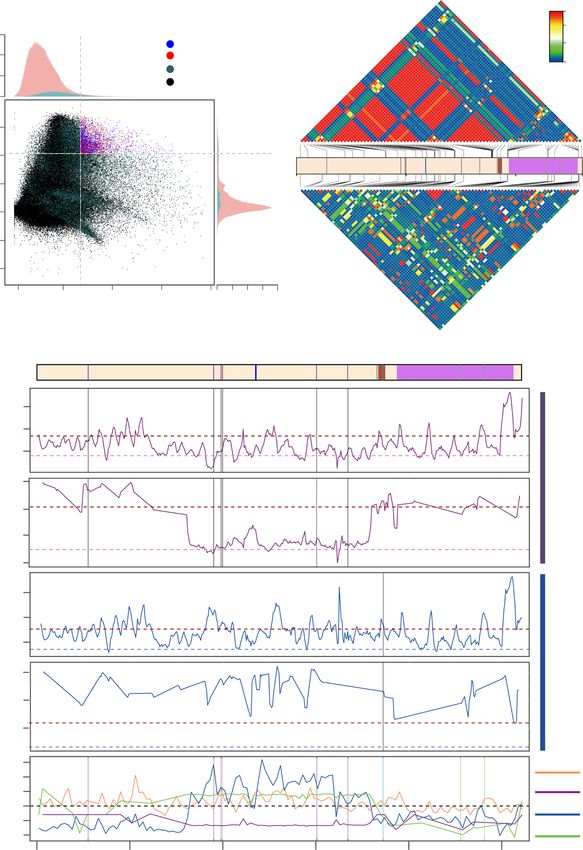
Fig. 4 Parallel adaptation is associated with different signatures of selection on putative flatwing hotspot, scaffold 18404. a Loci showing
signatures of selective sweeps in wild Kauai flatwing males were identified by examining the distribution of fixation index (FST) and relative diversity
(log10[θπ,unselected_normal-wing/θπ,selected_flatwing]) between flatwing Kauai individuals and normal-wing Australian individuals. Datapoints represent 10 kb
sliding windows calculated in 2.5 kb increments across the entire genome. Blue points and red points correspond to X chromosome and autosomal bins,
respectively, showing the most significant selective-sweep signatures (top 5% of the empirical distribution). b Patterns of linkage disequilibrium (LD) along
the flatwing-associated scaffold 18404. Top and bottom heatmaps show pairwise LD (r2) between SNPs (top—Kauai, bottom—Oahu), and SNPs were
filtered as detailed in the ‘Method’ section to ensure LD is comparable between flatwing males from Kauai vs. Oahu. The colour scale refers to the
value of r2. Protein-coding genes and flatwing-associated SNPs are indicated by blocks and bars with different colours respectively (Prospero = brown,
Doublesex = purple) in the middle panel. c–e, Signatures of selection on scaffold 18404 associated with parallel evolution in Hawaiian populations. Genes
and flatwing-associated SNPs are shown in the top panel using the same scheme as in b. FST and π were calculated using sliding-window analyses with
10 kb windows for c Kauai and d Oahu. πratio = θπ,unselected_normal-wing/θπ,selected_flatwing. Horizontal dashed lines represent mean whole-genome value for the
values shown in each panel, and dark red horizontal dashed lines in c and d represent the top 5% threshold values. e Tajima’s D for all wild-caught
individuals. Kauai flatwing (purple), Oahu (blue, all samples combined), Hilo normal-wing (green), Australian normal-wing (orange). The dashed horizontal
line indicates the Tajima’s D null hypothesis for neutrality.
NATURE COMMUNICATIONS | (2021)12:50 | https://doi.org/10.1038/s41467-020-20263-4 | www.nature.com/naturecommunications 7ARTICLE NATURE COMMUNICATIONS | https://doi.org/10.1038/s41467-020-20263-4
normal-wing), Tajima’s D was significantly positive at this strongly expression in females, but was also sensitive to genotype with
selected region (Fig. 4e). This pattern of Tajima’s D is consistent lower expression in flatwing carriers. These sex-specific effects of
with balancing selection, which in turn is consistent with field dsx are consistent with sex-specific developmental effects that
observations that the population in Oahu persistently contains have been found in other organisms, such as horned beetles
around 45% flatwing males22. The discovery of a new morph of (Onthophagus taurus) in which dsx dysregulation affects the
silent male, which is known to protect against the fly, ‘curly-wing’, development of male and female horn length in opposing
in Oahu raises the intriguing possibility that balancing selection directions48,49. We found no evidence of sex- or morph-
arises as a result of a competing, adaptive male-silencing variant, segregating dsx isoforms. We cannot exclude that these might
which exerts its phenotypic effects not through disrupting male be detected at a different developmental stage or in different
wing venation, as in flatwing, but instead through a disruption of tissues, but note with interest that there are now multiple
the 3-dimensional structure of the wings25. Finally, in contrast with exceptions to the expectation of sex-specific splicing in arthro-
Kauai and Oahu populations, Tajima’s D-values of Australian and pods53. The expression patterns of the above two transcripts were
Hilo populations fluctuate around 0 in this region (Fig. 4e). further validated by re-analysing an independent, previously
collected RNA-seq dataset (see ‘Methods’ section). Prospero was
lowly expressed in wingbud tissues (mean count-per-million of
Flatwing gene expression during wing development differs 0.35) so did not pass expression filtering of transcripts, nor
across islands and implicates doublesex. We performed a sepa- showed any evidence of differential expression between genotypes
rate gene expression study to examine the developmental genetic after relaxing the filtering threshold (unadjusted P > 0.88)
basis of the flatwing phenotype and test whether this is linked to (Supplementary Fig. 33). These results implicate a well-known
the putative hotspot identified above, scaffold 18404. Our GWAS regulator of sex-specific phenotypic development in the rapidly
and selection analyses highlighted two important candidate genes, evolved loss of male song in T. oceanicus, and provide further
prospero (pros) and doublesex (dsx), and three flatwing-associated evidence that a genomic adaptation hotspot has a vital role in
SNPs supported in the selection analysis were directly located determining multiple independently derived male-silencing
within introns of these genes (Fig. 4c, top panel). Pros and dsx phenotypes. Although it is currently not possible to establish
both have known roles in insect wing development. Pros is a whether dsx expression is causative or an associated downstream
transcription factor targeting Tollo, which induces cell sorting in effect of flatwing development, these findings suggest a tentative
Drosophila wings46,47. Dsx is also a transcription factor widely genetic mechanism of flatwing determination. Mutations in this
involved in sex-specific developmental patterning48,49, with region may alter the expression level of dsx, and contribute to
intriguing relevance to the evolution of sex-biased wing venation spatio-temporal variation of downstream genes.
in flatwing crickets. For example, a wing-specific isoform of dsx
acts as a master regulatory switch in the butterfly Papilio polytes,
switching an entire polymorphic, mimetic wing pattern on and Discussion
off in females50. Understanding the genetic mechanisms of adaptive evolution is a
Crickets are hemimetabolous and wing venation is established major focus of evolutionary biology54. Dissecting the mechanisms
early during nymphal development51, and there are widespread underlying convergent phenotypic evolution is extremely useful
gene expression differences between flatwing and normal- for gaining a better understanding of adaptation more generally:
wing genotypes during embryonic development even prior to why, in some cases, do adaptations in different populations and
hatching21. Crickets develop wingbuds from thoracic precursors, species share a genetic origin, whereas in other cases functionally
which eventually become externally articulated during later equivalent adaptations are the result of multiple independent
nymphal stages52. As such, we performed gene-level differential evolutionary origins? Gene flow is generally thought to counteract
expression analyses of developing wingbuds at the earliest stage the generation and maintenance of such parallel adaptations
when they become freely articulated, two instars prior to adult because it can introduce pre-existing adaptive alleles into popu-
eclosion (Fig. 5a). We collected wingbud samples from pure- lations under selection pressure, which can then be directly
breeding normal-wing and flatwing lines that we previously selected faster than de novo adaptive mutations can arise3–10.
established from Kauai and Oahu populations (no such lines were However, our results from silent Hawaiian crickets surprisingly
available for Hilo), and expression analysis reinforced the show that this need not be the case.
importance of the genomic region containing dsx to the The recent, abrupt, and rapid evolution of flatwing male
manifestation of independently derived flatwing phenotypes from crickets in multiple Hawaiian populations is one of the fastest
different populations. rates of convergent phenotypic evolution documented in the
There was little overall similarity in wingbud gene expression wild21,23. We found readily detectable variation in the morphol-
changes associated with flatwing genotypes from Kauai vs. Oahu ogy of adaptive flatwing phenotypes from populations on Kauai,
(Fig. 5b). In Kauai, 190 transcripts were uniquely DE between Oahu and Hilo, and these morphotypes were associated with
morphs, and in Oahu 449 transcripts were uniquely DE between different genetic loci. There were multiple signals of independent
morphs. Just 10 transcripts showed correlated differential origins of the silent flatwing male phenotype in different island
expression in both populations, and all of them were down- populations: (1) distinct morphometric patterns of flatwing
regulated in flatwing genotypes. Two of these consistently DE venation on different islands, (2) entirely non-overlapping
transcripts were located on scaffold 18404. One was dsx, the other flatwing-associated SNPs among all three populations, (3) all
a transcript with no functional annotation from an overlapping phylogenetic trees for flatwing-associated genetic regions falsified
region of the scaffold; both were among a cluster of transcripts a scenario of adaptive introgression (4) greater net nucleotide
that showed correlated morph-associated expression differences divergence at flatwing-associated regions (5) lack of shared
between islands (Supplementary Fig. 31). The extent of dsx flatwing-associated structural variants (6) long-range, complete
downregulation in flatwing genotypes mirrored the completeness linkage disequilibrium on flatwing-associated scaffolds in Kauai
with which song-producing structures on male wings were but not Oahu (7) little overall similarity in wingbud gene
feminised in each population; that is, dsx was more down- expression changes associated with flatwing genotypes from dif-
regulated in Kauai flatwing males, where male-specific wing ferent islands. This parallel adaptation occurred despite con-
venation is more reduced (Fig. 5c). Dsx showed higher overall siderable recent, ongoing gene flow among all three populations.
8 NATURE COMMUNICATIONS | (2021)12:50 | https://doi.org/10.1038/s41467-020-20263-4 | www.nature.com/naturecommunicationsNATURE COMMUNICATIONS | https://doi.org/10.1038/s41467-020-20263-4 ARTICLE
a b 10
Oahu genotype log2−fold change
5
0
−5
−10
5mm
−10 −5 0 5 10
Kauai genotype log2−fold change
c
F M
Kauai Oahu
log2 counts per million
8
6
4
F.Fw F.Nw M.Fw M.Nw F.Fw F.Nw M.Fw M.Nw
Sex.Genotype
Fig. 5 Differential gene expression analysis of developing male forewings. a Diagram of the penultimate nymphal instar from which right dorsal forewing
buds were sampled. Forewings are highlighted in red, hindwings in blue. Diagram drawn by JG Rayner. b The majority of transcripts identified as
differentially expressed between normal-wing and flatwing genotypes in Kauai (purple) and Oahu (blue) were non-overlapping, with the exception of 15
transcripts identified in black. Ten of the latter showed coordinated changes in expression (highlighted with a circle). Log2-fold changes > 0 on either axis
indicate normal-wing biased expression. c Top panel: diagrams of forewing phenotypes for female, flatwing and normal-wing males from Kauai and Oahu23.
Flatwing males’ wings are feminised to different degrees in Kauai vs. Oahu, but female forewings do not noticeably differ between genotypes. Bottom panel:
corresponding patterns of relative expression of doublesex in females and males from each population. Large points show means, small points show
individual observations for each replicate, and lines indicate the minimum and maximum values. Source data are provided as a Source Data file. Diagram is
drawn by JG Rayner.
NATURE COMMUNICATIONS | (2021)12:50 | https://doi.org/10.1038/s41467-020-20263-4 | www.nature.com/naturecommunications 9ARTICLE NATURE COMMUNICATIONS | https://doi.org/10.1038/s41467-020-20263-4
T. oceanicus in the Hawaiian islands have, like many island Philomachus pugnax61. In the cricket system, it is known that
species, lost long-distance flight capability, and migration appears flatwing haplotypes from Kauai (fwK) and from Oahu (fwO) can
to be maintained by human activities, which became more fre- be expressed in alternative genomic backgrounds23,27, but the
quent as human settlement increased 300 years ago (Fig. 2b). fitness consequences of this are not known. Future work testing
Flatwing phenotypes from different islands were associated constraints on convergent evolution via adaptive introgression is
with a small number of shared putative adaptation hotspots in the necessary to evaluate this scenario.
genome, and signatures of selection on these varied from popu- Empirical examples that violate this predictable trade-off are
lation to population and corresponded to known demographic rare. Part of the reason for this may be the well-known challenges
dynamics in the wild. Follow-up gene expression analyses gave of disentangling demographic signal from introgression or inde-
further support for the involvement of a transcription factor well- pendent mutational origins when convergent evolution is sup-
known for controlling sexually dimorphic morphological traits, posed to have occurred in the distant evolutionary past19, but the
doublesex, in multiple origins of adaptive male wing feminisation. silent Hawaiian cricket system is uniquely suited to overcome this
These results illustrate how strong selection associated with issue owing to the recent origin and spread of flatwing morphs in
genomic hotspots of adaptation can overwhelm the generally all three populations studied here22. If, as our results suggest,
predictable influence of gene flow. It remains an open question parallelism is less constrained by gene flow than previously
what level of gene flow would inhibit the parallel evolution of appreciated, it is worth considering what factors favour such an
male-silencing variants in this system. However, it is notable that outcome. The functional genetic basis of adaptive traits and the
the gene flow we detected in T. oceanicus was particularly strong phenotypic nature of the adaptation may each have important
compared to estimates in other species55–57. The precise roles in relaxing this constraint. In crickets and other ensiferan
dynamics of mutation, migration and drift in shaping adaptation insects, forewing venation is a sexually dimorphic trait critical for
is a longstanding and complex problem, so in the silent flatwing sexual reproduction. Signals emitted by resonating membranes on
cricket system and in other systems undergoing rapid convergent the wings are major components of the mate recognition system,
evolution, it would be illuminating to perform evolve and rese- often the first long-range signal detected by receivers, and they
quence experiments to define threshold levels of gene flow have a well-known role in sexual selection, reproductive isolation
beyond which parallel mutations localised within distinct popu- and diversification62. Male forewings and the signals they pro-
lations become swamped by adaptive variants originating from duce are highly variable across ensiferan taxa27,63–65. Traits
other populations. showing an obvious signature of extensive evolutionary variation
The tension between mutation and migration in shaping the have, by definition, arisen through the action of repeated genetic
dynamics of adaptive evolution is a central idea in evolutionary mutation, and could therefore be particularly disposed to recur-
theory, which predicts that adaptive introgression should reduce rent parallel evolution. In addition, loss of an existing complex
the role of de novo mutations when selection is extreme and gene trait may be more evolvable than gain of a novel trait66, because
flow is high3,5,14. Exceptions may occur when mutation rates are disrupting the developmental genetic pathways underlying a
particularly high, but it has been challenging to evaluate whether complex structure such as a cricket wing resonator or a stickle-
these trade-offs shape convergent phenotypic evolution in a back’s pelvic girdle can be achieved through simple genetic
predictable fashion. Most well-characterised cases of parallel change affecting one of many loci. Involvement of the doublesex
evolution via independent mutation involve a clear trade-off pathway in the evolution and development of flatwing male
between mutation and migration. For example, recurrent pelvic crickets is consistent with such an evolutionary mode of action.
reduction in freshwater populations of the stickleback Gaster- Dsx is an essential regulator of sexual dimorphism in insects, for
osteus aculeatus occurs due to a hyper-mutable enhancer region example, controlling the development of sexually dimorphic
of the transcription factor Pitx112,13. Affected populations are horns in the dung beetle Onthophagus taurus67 and the Japanese
isolated due to the repeated invasion of separate freshwater sys- rhinocerous beetle Trypoylus dichotomus68, female-limited wing
tems, yet high mutation rate of an important genomic hotspot of mimicry in Papilio butterflies50,69,70, sexual morphology in Dro-
adaptation has facilitated parallel evolution of adaptive pelvic sophila melanogaster48,49, and male scent organs in Bicyclus
reduction in each habitat. In contrast, introgressive hybridisation butterflies71.
between different species of mice introduced a pesticide resistance The emergence and spread of parallel adaptations in popula-
allele from Mus spretus to M. musculus domesticus, which was tions subject to gene flow are liable to be biased towards highly
subsequently selected due to the increased application of antic- evolvable traits such as those functioning in sexual selection and
oagulant pesticides in the mid-1900s58. Similarly, there is com- towards genomic hotspots of adaptation where relatively simple
pelling evidence that adaptive loci associated with mimetic wing changes result in functional losses. Given the increasing research
patterning in Heliconius butterflies have introgressed from species focus on evolutionary rescue and rapid adaptation in wild
to species, facilitating convergent adaptive radiations16,59. It is populations, the speed of such adaptation, its repeatability, and
important to note that shared derived adaptations introduced via the factors favouring it are important to dissect and translate to
migration as well as uniquely evolved adaptations can co-occur, applied contexts, to mitigate resistance evolution in agricultural
and compelling examples have been observed in the context of pests and human pathogens, and also to design effective inter-
antimalarial resistance in Plasmodium falciparum60. However, the ventions to cope with negative consequences of anthropogenic
evolutionary processes underlying the origins of these adaptations environmental change72. The repeated loss of song in Hawaiian
overwhelmingly obey the mutation-migration trade-off. Our crickets under pressure from eavesdropping parasitoids provides
findings contradict this general tendency and raise the interesting a compelling test case in a wild population undergoing ‘real-time’
possibility that incompatibilities between unique, derived adap- evolutionary adaptation, showing that extremely rapid parallel
tive alleles could act as constraints on convergent evolution via adaptation can occur despite evolutionary forces traditionally
introgressive hybridisation. A hypothetical example is where one thought to impede it.
coevolved system is resistant to introgression of alternative alleles
because the latter are individually maladaptive in combination
with the resident system. There is precedence for such genomic Methods
Morphometric analyses of male wings. Right forewings of wild flatwing male
incompatibilities to affect adaptive variants, for example the crickets were collected from three Hawaiian islands and mounted between two
homozygous lethal inversion polymorphism in the ruff, microscope slides (Supplementary Table 1). Fifty-two Kauai flatwings, 52 Oahu
10 NATURE COMMUNICATIONS | (2021)12:50 | https://doi.org/10.1038/s41467-020-20263-4 | www.nature.com/naturecommunicationsNATURE COMMUNICATIONS | https://doi.org/10.1038/s41467-020-20263-4 ARTICLE
flatwings, and 10 Hilo flatwings were sampled. The unbalanced sample size was depth were set as the half that of the autosomes. Heterozygous calls of X-linked
caused by the extremely low frequency of flatwing crickets in the wild in Hilo22. Slides SNPs were fixed to homozygous based on the allele depth if the depth of one allele
were photographed using a Leica DFC295 digital camera mounted on a Leica M60 was greater than three times the other one. If none of these alleles were supported
dissecting microscope. We performed a landmark-based geometric morphometric by the supermajority, the genotype was treated as unknown. Loci that had
analysis of these photos27. Specifically, landmark data were generated by manually unknown genotypes in more than 25% of all individuals were also excluded. To
placing 16 landmarks on each wing photograph using the tpsDig2 (v2.31)73 as avoid bias caused by outgroups (unrelated populations), multiple SNP datasets
described in Fig. 1a. The criteria for placement of each landmark are identical to those were generated independently and utilised accordingly for the following analyses
used by Pascoal et al.23 and Bailey et al.27. Morphological comparisons were then (Supplementary Data 2).
conducted using MorphoJ (v1.07a), which extracts shape information by performing a
Procrustes superimposition on all the landmark data74. A covariance matrix generated
from Procrustes distances was then used to perform principal component analysis Phylogenetic, principal component (PC) and population structure analyses.
(PCA) without a priori information of group (i.e. island) identity. The PCA results We used PLINK (v1.90b6.8)80 to calculate identity-by-state based on SNP datasets.
and corresponding group information were then analysed using a multivariate ana- The resulting distance matrix was then passed to PHYLIP (v3.696)81 to construct
lysis of variance (MANOVA) in R v. 3.5.2 to test whether flatwings from the three neighbour-joining phylogenetic trees (Fig. 1f and Supplementary Figs. 2, 3). T.
groups were morphologically different. They were, so we used a canonical variates commodus individuals were used as an outgroup. We generated consensus trees by
analysis (CVA) to visualise the differences among islands. CVA is designed to performing bootstrap replication 1000 times and merging them. Consensus trees
maximise the separation of three populations, producing axes, which best explain were then labelled and visualised using MEGA (v10.0.5)82 and FigTree (v1.4.4). We
inter-group variation23. A scatter diagram and a transformation grid plot were plotted used the smartpca programme in EIGENSOFT (v7.2.1)83 to perform the principal
to visualise the CVA results. component analysis (PCA) and visualised the result by plotting a scatter diagram
using rgl and ggplot2 R packages84. We used ADMIXTURE (v1.3.0) to estimate
population structure with the numbers of ancestral populations (K) from 2 to 7
Sampling, DNA extraction and whole-genome re-sequencing. Seventy indivi- after thinning the SNP set for linkage disequilibrium using PLINK with an r2
duals were collected for whole-genome re-sequencing (Supplementary Table 3). threshold of 0.185.
We used ten flatwing males and ten normal-wing males from each Hawaiian island
(Kauai, Oahu and Hilo), seven Australian T. oceanicus males and three males of a
Genetic diversity and linkage disequilibrium analyses. We used VCFtools
closely related, but reproductively isolated sister species from Australia, T. com-
(v0.1.16)86 to calculate genetic diversity with a sliding-window size of 10 kb and a
modus. The normal-wing males from Hilo and flatwing males from Kauai were
step size of 2.5 kb. To calculate linkage disequilibrium, the original SNP dataset was
collected from the wild in 2017. However, normal-wing males were non-existent in
first divided into subsets of each population using vcftools. The split VCF files were
the Kauai population at that time, and flatwing males were extremely scarce in the
then converted to haploview-recognised format using PLINK. Haploview (v4.2)
Hilo population, so for these groups we used laboratory specimens from stock
calculated correlation coefficients (r2), which are used to infer pairwise linkage
populations derived from previous collections at exactly the same locations; this
disequilibrium87. To visually depict LD patterns on scaffold 18404 (Fig. 4b), a
enabled us to breed extremely large population sizes to obtain enough of the rare
reasonable number of SNPs dispersed across the whole scaffold is necessary.
morphs for re-sequencing. For Oahu crickets, both flatwing and normal-wing
However, different sets of positions were polymorphic in flatwing Oahu and
samples were from wild populations. Australian individuals were collected from the
flatwing Kauai individuals, which makes direct visual comparison difficult to
wild in Australia in 2011. Single hind legs of each sampled individual were collected
interpret. To minimise visual bias caused by using different SNP sets, we used the
and preserved in 100% ethanol. Genomic DNA was extracted from legs using the
flatwing Oahu group as a standard and then selected the corresponding SNP in the
CTAB method. The quantity of the extracted DNA was measured using a Qubit
Kauai group; for sites at which the same SNP was unavailable in Kauai, the nearest
dsDNA kit. The quality of the DNA samples was evaluated using Nanodrop, 1%
one in its flanking regions was selected (Supplementary Data 9).
agarose gel electrophoresis, AATI Fragment Analyser and the Standard Sensitivity
Genomic DNA Analysis Kit. The Hamilton MicroLab STAR liquid handling sys-
tem was used to pre-normalise DNA samples before library preparation. DNA was Gene flow and demographic history inference. To avoid bias caused by
sheared to a 450 bp mean insert size using a Covaris LE220 focused-ultrasonicator. inbreeding, only wild-caught, unrelated samples were used to infer gene flow and
Sequencing libraries were prepared using Illumina SeqLab specific TruSeq Nano demographic history of Hawaiian cricket populations. We used the ABBA–BABA
High Throughput library preparation kit, Hamilton MicroLab STAR and Clarity (D-statistic) test30,88 and multiple individuals’ D-statistic test34 to detect gene flow
LIMS X (4.2) Edition, and then clustered onto a HiSeqX Flow cell v2.5 on cBot2s. among different populations. Six different scenarios were statistically tested. To do
The clustered flow cell was transferred to a HiSeqX for sequencing using a HiSeqX so, BAM files of individuals from three Hawaiian populations, one Australian
Ten Reagent kit v2.5. population and one outgroup population (T. commodus) were passed to ANGSD
(v0.930), which counted the number of ABBA and BABA sites and calculated D-
statistic metrics34,88. We inferred relatively late (within 10,000 generations)
Sequence quality checking, read alignment and SNP identification. Demulti- demographic parameters including the divergence of three populations, bottlenecks
plexing was performed using bcl2fastq (v2.20, Illumina), allowing 1 mismatch and migrations from the site frequency spectrum (SFS) using Fastsimcoal35. To
when assigning reads to barcodes. Adaptors were trimmed during the demulti- minimise bias caused by potential inbreeding, linkage and selection, the following
plexing process. Raw reads that included ≥5% unidentified nucleotides (N) or more criteria were applied to further filter SNP datasets before format conversion: (i)
than 65% low-quality nucleotides (Phred quality value ≤ 7) were discarded33. Only autosomal scaffolds were retained, based on previous linkage map, (ii) SNPs
Before alignment, index files of the field cricket (T. oceanicus) reference were with an r2 > 0.3 were excluded using the sliding-window method, (iii) PLINK was
generated using bwa and samtools (v1.3.1)75. The filtered pair-end sequence reads used to exclude one of the individual pairs, which had a proportion identity-by-
were then mapped to the reference genome21 using BWA-MEM (v0.7.12) with descent outlier, (iv) SNPs located inside genic regions were excluded, (v) Sites with
default parameters76. Secondary alignments with flag ≥ 255 were discard using a unknown genotype were also filtered. The filtered SNP dataset was converted to
customised Perl script33. Samtools (v1.3.1) was used to assess coverage individually. Arlequin format using PGDSpider (v2.1.1.5)89. We used Arlequin (v3.5)90 to
We used samtools and picard (2.14.1) to sort, format and index the resulting binary produce the minor allele SFS (folded SFS) and joint multidimensional SFS. Using
alignment map (BAM) files and remove PCR duplicates. To increase the accuracy Fastsimcoal (v2.6.0.3), we tested 62 models including effective population size
of alignments around indel regions, we detected indels and re-aligned these regions changes, different divergence scenarios, presence or absence of gene flow, and
using RealignerTargetCreator and IndelRealigner functions in GATK (v3.7.0)77. All permutations of three island populations. For each model, we performed 50
following analyses were conducted based on these re-aligned BAM files. We independent parameter inferences. For each run, 100,000 simulations per like-
detected SNPs and indels following GATK best practice workflows78. Briefly, raw lihood and 40 Expectation Conditional Maximisation (ECM) cycles were per-
SNPs and indels were first detected individually using HaplotypeCaller. Combi- formed to estimate parameters with maximum-likelihood. We compared different
neGVCFs was than applied to merge SNPs of different individuals from the same models using the Akaike Information Criterion (AIC), and estimated the 95%
population. The VCF records of multiple populations were then re-genotyped and confidence interval of the best model using 30 parametric bootstraps35. We used
aggregated using GenotypeGVCFs. Following the authors’ recommendations, hard- the Pairwise Sequentially Markovian Coalescent (PSMC) method to reconstruct the
filtering criteria (Qual By Depth < 2.0, Fisher Strand > 60.0, RMS Mapping Quality most recent common ancestor (TMRCA) distribution, infer the divergence time
< 40.0, Mapping Quality Rank-Sum Test < −2.5, Read Pos Rank-Sum < −1.0) were from now to the TMRCA, and finally infer the history of effective population
decided manually based on density plots of the raw SNP dataset and applied using size36. Since local density of heterozygotes information was used by PSMC, X-
SelectVariants and VariantFiltration. To further improve the accuracy of geno- linked scaffolds were excluded from this analysis. To further improve the accuracy
typing and economise computing resources, SNPs of extremely short scaffolds (≤5 of this analysis, only wild individuals with the highest sequencing depth (top 2,
kb) were not called. In consideration of the fact that sex of crickets is determined by sequencing coverage > 26×) were used. We used samtools to generate diploid
an XX/XO (female/male) system21, all males were fixed to have homozygous consensus sequences based on individual BAM file. Loci with abnormal depth were
genotypes of X-linked loci79. Low-quality SNPs potentially caused by sequencing masked by N. PSMC (v0.6.5-r67) was used to infer historical effective population
error were also discarded using a customised Perl script. Specifically, all SPNs with size with a mutation rate of 3.5 × 10⁻⁹ and a generation time of 0.25 year91,92.
Phred-scaled quality score < 30 or with abnormal depth (lower than one-third or
higher than three times the average sequencing depth of a particular individual)
were filtered33. The X scaffold was defined according to the previously published Genome-wide association analysis. The flatwing phenotype is known to be
linkage map21. For SNPs located in X-linked scaffolds, the criteria of abnormal inherited as a single locus, X-linked trait. Sex of crickets are determined by XX/XO
NATURE COMMUNICATIONS | (2021)12:50 | https://doi.org/10.1038/s41467-020-20263-4 | www.nature.com/naturecommunications 11You can also read