Pharmaceutical Needs Assessment 2018-2021
←
→
Page content transcription
If your browser does not render page correctly, please read the page content below
Wakefield Council – Public Health Intelligence

   Pharmaceutical Needs Assessment 2018-2021

   Final Assessment Document

   What is the current level of pharmaceutical service provision in Wakefield District and
where are the gaps that we can close in the future?

   To be published 31st March 2018

   Shane Mullen – Public Health Intelligence Manager
Version Control

  Version                Date                     Notes
  1.0                    03/11/2017               Pre-consultation draft shared with CPWY and local stakeholders
  2.0                    09/11/2017               Pre-consultation draft shared with the Health and Wellbeing Board
  3.0                    15/12/2017               Consultation document released
  4.0                    16/03/2018               Final Document created reacting to consultation feedback and submitted to
                                               HWB

Contents
Version Control ............................................................................................................................................................................ 2
Executive Summary...................................................................................................................................................................... 5
Main Findings ............................................................................................................................................................................... 6
Introduction ................................................................................................................................................................................. 7
    Responsibilities ........................................................................................................................................... 7
    Our Approach .............................................................................................................................................. 8
Purpose & Scope .......................................................................................................................................................................... 9
Methodology ............................................................................................................................................................................. 10
    Consultation Members ............................................................................................................................. 10
    Working Group Members ......................................................................................................................... 10
Local Information & Protected Characteristics .......................................................................................................................... 11
    Demography - Age .................................................................................................................................... 11
    Demography - Ethnicity............................................................................................................................. 14
    Demography - Language ........................................................................................................................... 16
    Demography – Sexual Orientation ............................................................................................................ 18
    Marriage and Civil Partnership.................................................................................................................. 18
Major Health Challenges ............................................................................................................................................................ 19
Life Expectancy & Mortality ....................................................................................................................................................... 20
    Cardiovascular Diseases ............................................................................................................................ 20
         Hypertension .................................................................................................................................................................... 20
         Chronic Heart Disease (CHD) ............................................................................................................................................ 21
         Stroke & Transient Ischaemic Attack (TIA) ....................................................................................................................... 22
         Related CVD Outcomes .................................................................................................................................................... 23
    Diabetes .................................................................................................................................................... 24
    Cancer ....................................................................................................................................................... 26
         Chronic Obstructive Pulmonary Disease .......................................................................................................................... 28
    Respiratory Diseases ................................................................................................................................. 30
      Prescribing costs for respiratory disease in NHS Wakefield total £8.5 million in 2016/17, this equates to just short of
  600,000 items. ......................................................................................................................................................................... 30
         Asthma ............................................................................................................................................................................. 30
    Musculoskeletal ........................................................................................................................................ 31
    Lifestyles & Behaviours ............................................................................................................................. 32

                                                                                                                                            Page | 2
Wakefield Pharmaceutical Needs Assessment 2018-2021                                                                            Monday, 19 March 2018
Maternal Health ........................................................................................................................................ 35
Current Healthcare Service Provision ........................................................................................................................................ 36
    Primary Care.............................................................................................................................................. 36
Secondary Care .......................................................................................................................................................................... 38
Tertiary Care .............................................................................................................................................................................. 39
Non-standard Pharmaceutical Services ..................................................................................................................................... 42
    Controlled Locality .................................................................................................................................... 42
    Dispensing Appliance Contractors (DACs) ................................................................................................. 42
    Dispensing Doctors ................................................................................................................................... 42
Service Provision ........................................................................................................................................................................ 43
    Essential (Necessary) Services................................................................................................................... 43
    Advanced Services .................................................................................................................................... 44
    Locally Commissioned Services ................................................................................................................. 44
    Contractors Survey findings ...................................................................................................................... 45
Service Coverage ........................................................................................................................................................................ 47
    Overall Essential Service Access ................................................................................................................ 47
    100 Hours Pharmacy Access ..................................................................................................................... 50
    Sexual Health Services .............................................................................................................................. 51
    Smoking Cessation Services ...................................................................................................................... 52
    Needle Exchange ....................................................................................................................................... 53
    Supervised Consumption .......................................................................................................................... 54
    NHS Urgent Medicine Supply Advanced Service (NUMSAS) ..................................................................... 55
    Healthy Living Pharmacy ........................................................................................................................... 56
Identifiable Gaps and Commissioning Intentions ...................................................................................................................... 57
    Consolidation of Pharmacy ....................................................................................................................... 57
    Funding Changes ....................................................................................................................................... 57
    Closure of Pharmacies............................................................................................................................... 57
    Increase Demand in our communities ...................................................................................................... 58
    Essential (Necessary) Services................................................................................................................... 58
    Advanced Services .................................................................................................................................... 58
    Enhanced Services..................................................................................................................................... 59
    The Healthy Living Pharmacy .................................................................................................................... 59
         Possible Future Roles for Community Pharmacy ............................................................................................................. 60
Bibliography ............................................................................................................................................................................... 61
Glossary of Terms ...................................................................................................................................................................... 62
Appendix A: Service Provision Table .......................................................................................................................................... 63
Appendix B: Consultation questionnaire ................................................................................................................................... 67
Appendix C: Contractors questionnaire ..................................................................................................................................... 69

                                                                                                                                           Page | 3
Wakefield Pharmaceutical Needs Assessment 2018-2021                                                                           Monday, 19 March 2018
Table of Figures
      Figure 1: Counts of residents within local HWB populations, projected until 2037 .................................................................. 11
      Figure 2: Counts of additional annual residents within local HWB populations, projected until 2037 ..................................... 12
      Figure 3: Growth rate of additional annual residents within local HWB populations, projected until 2037 ............................ 12
      Figure 4: Percentage of Wakefield’s total population, split by age band, projected until 2037 ............................................... 13
    Figure 5: Map showing the distribution of the registered population who are recorded as not using English as their main
language (SystmOne, 2014) .............................................................................................................................................................. 17
      Figure 6: Map of hypertension prevalence per 100,000 persons in SystmOne practices (standardised to pre-2013 ESP) ...... 21
      Figure 7: Map of CHD prevalence per 100,000 persons in SystmOne practices. ....................................................................... 22
      Figure 8: Map of Stroke & Transient Ischaemic Attack (TIA) prevalence per 100,000 persons in SystmOne practices. ........... 23
      Figure 9: Map of diabetes prevalence per 100,000 persons over-18 in SystmOne practices (standardised to pre-2013 ESP) . 25
      Figure 10: Age standardised rate of cancer incidence per 100,000 population, all ages, by tumour site and gender ............. 27
      Figure 11: Map of COPD prevalence per 100,000 persons over-18 in SystmOne practices (standardised to pre-2013 ESP) ... 29
      Figure 12: Map of asthma prevalence DSR per 100,000 persons in SystmOne practices (standardised to pre-2013 ESP) ....... 30
      Figure 13: Map of obesity DSR per 100,000 adults aged 18+ in SystmOne practices (standardised to pre-2013 ESP) ............. 32
      Figure 14: Map of overweight DSR per 100,000 adults aged 18+ in SystmOne practices (standardised to pre-2013 ESP) ...... 33
      Figure 15: Map of smoking prevalence per 100,000 persons in SystmOne practices (standardised to pre-2013 ESP) ............ 34
      Figure 16: Map showing the community pharmacies across the district. ................................................................................. 37
      Figure 17: Chart showing population-pharmacy ratio (per 100,000 persons) over time. ......................................................... 37
      Figure 18: Responses to consultation question – is there are a consultation area ................................................................... 45
      Figure 19: Responses to consultation question – can you access websites from a computer within your pharmacy .............. 45
      Figure 20: Responses to other service provided in the pharmacy ............................................................................................. 46
      Figure 21: One mile radius around pharmacies ......................................................................................................................... 47
      Figure 22: Drive time analysis .................................................................................................................................................... 48
      Figure 23: Drive time analysis for Pharmacies out Wakefield District ....................................................................................... 49
      Figure 24: 100-hour service provision against population working 49+ hours .......................................................................... 50
      Figure 25: Stop smoking services provided in community pharmacy........................................................................................ 52
      Figure 26: Needle exchange/sharps disposal against in-treatment opiate users ...................................................................... 53
      Figure 27: Supervised consumption against in-treatment opiate users .................................................................................... 54
      Figure 28: NUMSAS ready pharmacy ......................................................................................................................................... 55
      Figure 29: Healthy Living Pharmacy ........................................................................................................................................... 56

      Table of Tables
      Table 1: Size of ethnic groups (2011 Census) ............................................................................................................................ 14
      Table 2: Census ethnic groups applied to the primary information in 2017. ............................................................................ 15
      Table 3: Population age structure by selected ethnic groups (2011 Census) ............................................................................ 16
      Table 4: People predicted to have a longstanding health condition caused by a stroke .......................................................... 24
      Table 5: People predicted to have diabetes .............................................................................................................................. 26
      Table 6: People predicted to be living with cancer .................................................................................................................... 28
      Table 7: Projections of longstanding health condition being caused by bronchitis and emphysema ....................................... 29

                                                                                                                                           Page | 4
      Wakefield Pharmaceutical Needs Assessment 2018-2021                                                                     Monday, 19 March 2018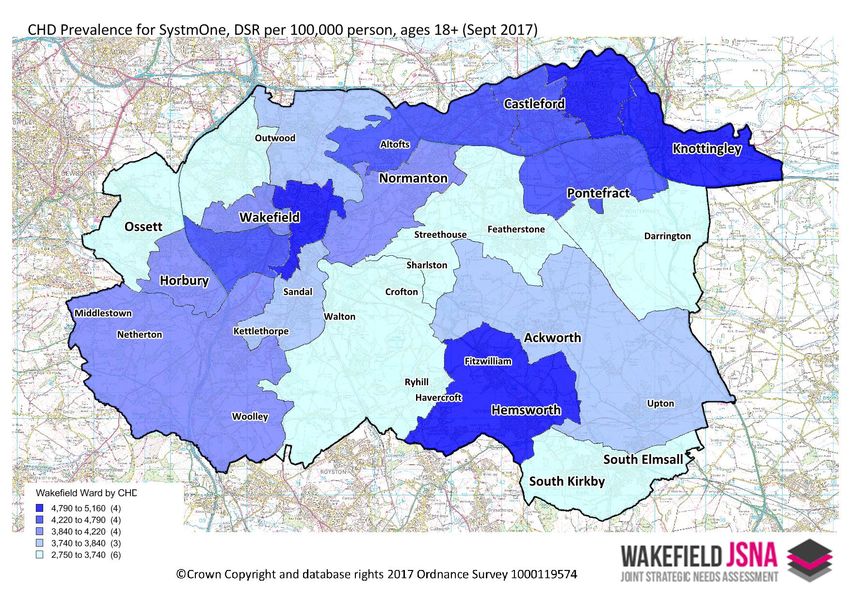
Executive Summary

   A Pharmaceutical Needs Assessment (PNA) is a statement of the need for pharmaceutical services.
Pharmaceutical services are provided from Pharmacies, Dispensing Appliance Contractors, Distance selling
pharmacies, Dispensing Doctors and Local Pharmaceutical Services.

    This PNA document provides details of current Community Pharmacy service provision as well as
information about other services that may impact upon the provision of pharmacy services (such as
primary care provision and secondary care services). The document references previous PNA’s,
demonstrating where there has been any change in provision or emerging change for consideration.

    This PNA has taken a strong focus on identifying gaps, and potential gaps, in service provision and
understanding how population changes will affect both the future requirements for necessary and other
relevant service provision, and the providers of those services.

    The PNA has found no gaps in service provision in the Wakefield Metropolitan District area. The district
is well provisioned in number and accessibility of community pharmacies, both within the district boundary
and within reasonable travel distance outside the district boundary.

   What is evident from the findings is the community pharmacy services are in a more vulnerable
position than they have been during the last Pharmaceutical Needs Assessment (2015-2018). The recent
announcement by a major national provider to close two hundred pharmacies, due to the funding pressure
highlights the increased strain on the sector.

   If significant changes in the need for pharmaceutical services occur during the three years, then the
Health and Wellbeing Board is required to publish a revised assessment as soon as is reasonably
practicable. Given the funding constraints, population growth and increased long term health condition
demand the Wakefield Metropolitan District area must remain vigilant to the demand on community
pharmacy. Supplementary statements to the PNA can be made if the provision of pharmaceutical services
changes.

                                                                                     Page | 5
   Wakefield Pharmaceutical Needs Assessment 2018-2021                  Monday, 19 March 2018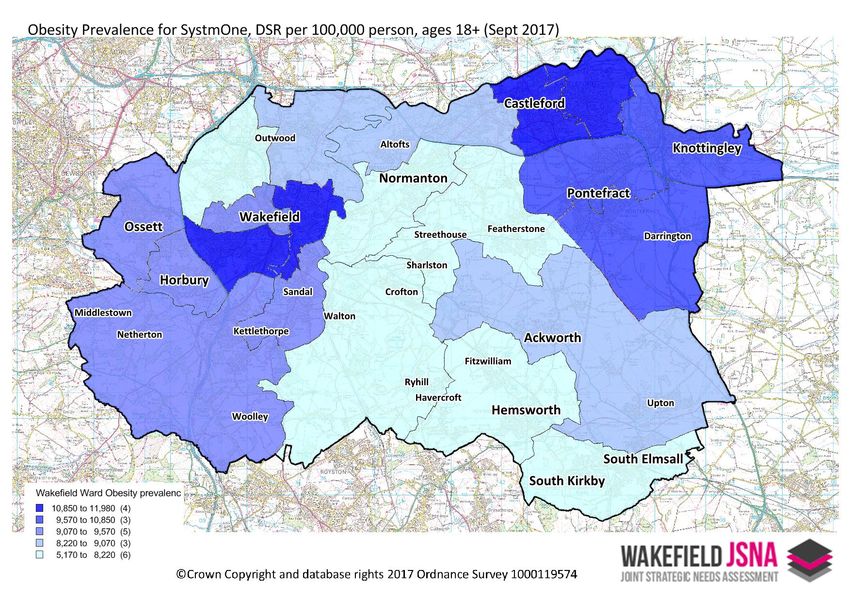
Main Findings
The PNA concludes:
There are no current gaps in the provision of necessary services in the area of the Health and
Wellbeing Board
There is a reasonable and adequate choice of pharmacies and pharmaceutical services in all areas
of Wakefield
There are no current gaps in the provision of other relevant services in the area of the Health and
Wellbeing Board
The PNA has not identified any future needs which could not be met by pharmacies already
currently on the pharmaceutical list which would form part of its commissioning intentions.
Page | 6
Wakefield Pharmaceutical Needs Assessment 2018-2021 Monday, 19 March 2018
Introduction

    The White Paper, Pharmacy in England: Building on Strengths – delivering the future, published on the
3rd April 2008 by the Department of Health (DH), set out a Governmental programme for a 21st Century
pharmaceutical service. The paper identified practical, achievable ways in which pharmacies and their
teams can contribute to improving patient care through delivering personalised pharmaceutical services in
the coming years. It proposed structural changes to primary legislation and actions to reform the current
regulatory system. In 2009 the requirement for PNA’s into PCT was introduced.

    The Health and Social Care Act 2012 brought fundamental changes to the way we plan and deliver
health improvements within the District. The Act has seen the end of the Primary Care Trust (PCT) and the
development of the Wakefield Clinical Commissioning Group (CCG), responsibility for public health has
moved into the Local Authority and Health Watch has become the voice of the public on health matters.
These organisations are tasked with working together through a Health and Wellbeing Board (HWB) to
ensure that there are local plans in place to protect and improve health outcomes and where necessary to
provide the best available Health and Social Care. The responsibility for assessing the Pharmaceutical Need
in an area now falls with the Health and Wellbeing Board.
    The learning from the afore mentioned whitepaper and changes to responsibility for Pharmacy in
England has underpinned thinking in subsequent documents and policy including documents in Public
Health England “A Way Forward for Public Health” and NHS England commissioning plans.
    In reaction to the NHS 5 year forward 2015 view the Pharmaceutical Services Negotiating Committee in
2016 produced a forward view for community pharmacy in England. The document builds on the NHS five
year forward view and various documents produced by the Department of Health (DH), Royal
Pharmaceutical Society’s and Pharmacy Voice’s. Outlining various opportunities to better use the
community pharmacy services to improve the nation’s health. These two documents are supporting NHS
England, Local Authorities and CCG’s in their commissioning of pharmacy services.

   Responsibilities
    From 1st April 2013, every HWB in England will have a statutory responsibility to publish and keep up
to date a statement of the needs for pharmaceutical services of the population in its area, referred to as a
Pharmaceutical Needs Assessment (PNA). The aim of the PNA is to provide a coherent account of the
commissioning environment for pharmaceutical services now and in the future.

   The National Health Service Regulations 2013 make the PNA a statutory requirement which HWBs must
complete by the 1st April 2015, and HWBs are required to produce a revised assessment within 3 years of
publication of their first assessment. This document is the first revised PNA within 3 years of the original
publication in March 2015.

                                                                                      Page | 7
   Wakefield Pharmaceutical Needs Assessment 2018-2021                   Monday, 19 March 2018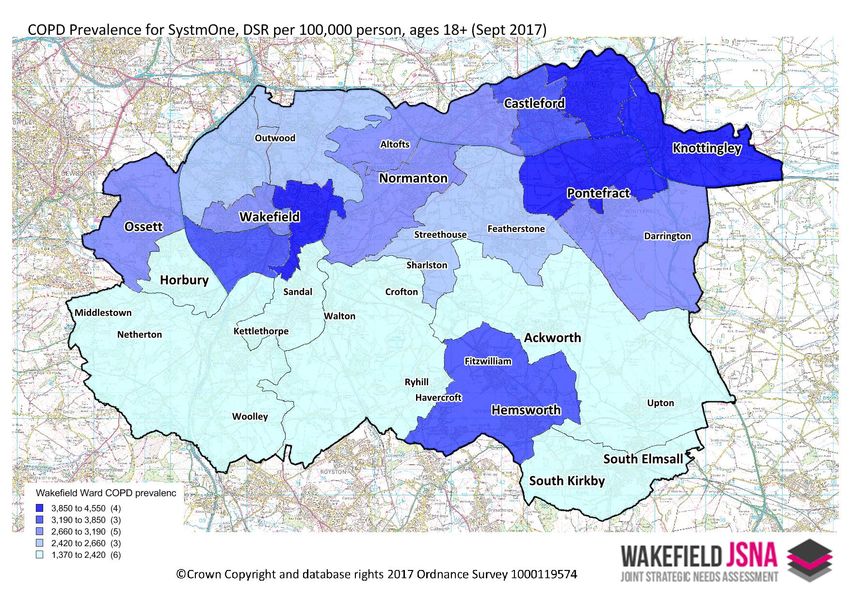
Our Approach
   Wakefield Council published its first Pharmaceutical Needs Assessment document in 2015 and made
subsequent revisions and updates, which have been published here. This document will replace the 2015
document once approved.

   A major role of primary care is to provide quality, medication treatment and services to the population.
When medicine is involved, invariably it would involve a pharmacy, particularly a community pharmacy for
primary care. The NHS Five Year Forward View (2014) states:

        “Over the next five years, the NHS will do far better at organising and simplifying the system.
    This will mean helping patients… get the right care, at the right time, in the right place, making
    more appropriate use of primary care… and far greater use of pharmacists.”

   Furthermore, the Public Health strategy for England (2010), “Healthy lives, healthy people”, states:

        “Community pharmacies are a valuable and trusted public health resource. With millions of
    contacts with the public each day, there is real potential to use community pharmacy teams more
    effectively to improve health and wellbeing and to reduce health inequalities.”

   This is relevant to Local Authorities as they have taken on responsibility for public health in their
communities. Community Pharmacy forms part of the workforce in the place based health and wellbeing
agenda that health and care resources are being arranged around.

   This Pharmaceutical Needs Assessment, now led by Public Health in the Local Authority, presents a
background of health issues in Wakefield District whilst providing a comprehensive depiction of health and
wellbeing in the district, existing pharmaceutical provision and of additional enhanced services. It further
describes those services currently commissioned and explores how they may be configured in the future to
meet population needs.

    The PNA should be read alongside our existing Joint Strategic Needs Assessment (JSNA) which will be is
updated monthly with new content reflecting the districts population need. Also, much of the
geographical analysis that has gone into this PNA resides in an electronic format on that website. We have
built a customised interactive tools that allows you to explore how local services are configured against
hypothesised need.

    JSNA               http://www.wakefieldjsna.co.uk/
    PNA                http://www.wakefieldjsna.co.uk/use-of-services/pna/distribution-of-
 Analysis          services/

                                                                                      Page | 8
   Wakefield Pharmaceutical Needs Assessment 2018-2021                   Monday, 19 March 2018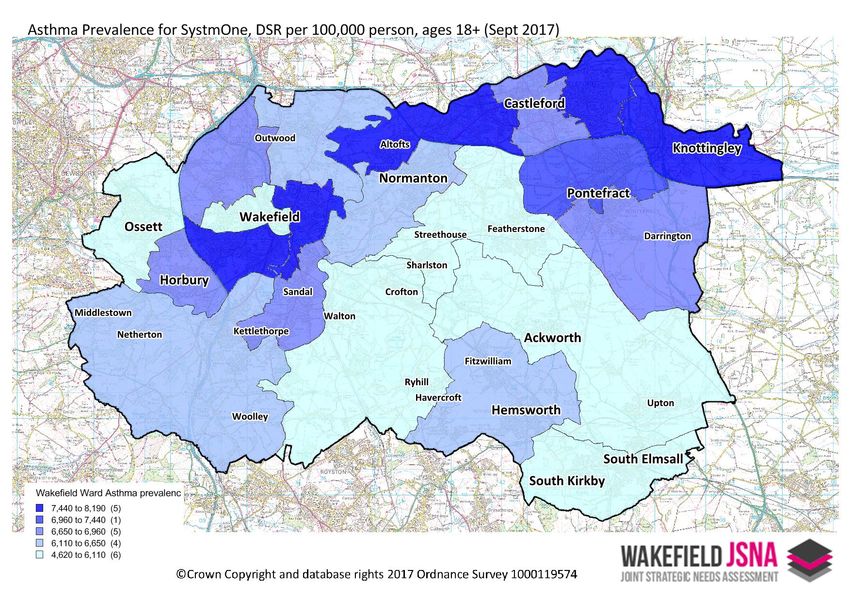
Purpose & Scope

    The purpose of a Pharmaceutical Needs Assessment is to provide a coherent account of the
commissioning environment for pharmaceutical services now and in the future. Therefore, this PNA is
about assessing the pharmaceutical needs of our population, mapping current provision and then assessing
the adequacy of the provision. Furthermore, it should assist in identifying if there are any current gaps in
pharmaceutical provision whilst ensuring that the services commissioned in the near future meet these
needs.

    The PNA purpose is to assess and contribute to reducing health inequalities by ensuring the right
pharmaceutical services are being provided in the right place to meet the needs of the local population. As
a result PNAs are used by the NHS and Local Authorities to make decisions on which services need/can be
provided by local community pharmacies. These services are part of the local health care economy and
have the potential to affect organisational budgets.

                                                                                     Page | 9
   Wakefield Pharmaceutical Needs Assessment 2018-2021                  Monday, 19 March 2018
Methodology
This PNA has been carried out by working with commissioners, service providers and relevant
stakeholders such as Wakefield Council, NHS England, Wakefield CCG, Community Pharmacy West
Yorkshire, Spectrum and Turning Point, to gather information around current service provision. We have
also worked hard to set this against a picture of community need.
The choice of which level data is represented is based on the size of the respective numerator
population, giving appropriate concern for fluctuations and disclosure risks.
Health needs pertinent to pharmaceutical services were then geographically represented as a
choropleth map (the coloured sections of the map), with service provision status overlaid (coloured dots
representing pharmacies and whether they provide a given service). Relevant stakeholders from
Wakefield Council and Wakefield CCG were consulted for their opinions on how services were distributed
respective to need and other data from locality health profiles. A contractor’s survey was additionally
conducted, asking the community pharmacists for opinions on provision within the district. The findings
from the contractors were included in the public consultation draft.
Local commissioners were then consulted to determine their response and commissioning intentions
to any gaps highlighted. Following this, a 60-day consultation period was enacted as required by the
regulations, prior to publication of the final PNA. The consultation was open to the public, professionals
and any other group who wished to make comment. Details of the consultation were distributed to
statutory stakeholders by email and letter, a survey was constructed and published to aid capture of
comments. Following the formal consultation the feedback was reviewed and appropriate amendments
were made to the document.
Consultation Members
The Local Pharmaceutical Committee
The Local Medical Committee for its area
Any persons on the pharmaceutical lists and any dispensing doctors
Any LPS chemist in its area with whom NHS England has made arrangements for the provision of
any local pharmaceutical services
Any Local Healthwatch organisation, and any other patient, consumer or community group which
has an interest in the provision of pharmaceutical services in its area
The local NHS trust or NHS foundation trust
Any neighbouring Health and Wellbeing Board
Consultation on the draft PNA commenced on 15th December 2017 and closed on 15/02/2017. This
was managed via the Council’s Consultation Listings.
Working Group Members
Shane Mullen (WMDC, Public Health Intelligence Manager)
Jez Mitchell (WMDC, Public Health Principal)
Joanne Hinchcliffe (WMDC, Public Health Commissioning Manager)
Anna Ladd (NHS England, Assistant Contracts Manager)
Ruth Buchan (CPWY, Chief Executive Officer)
Gillian McDonald (WCCG, Medicines Optimisation Pharmacist)
Page | 10
Wakefield Pharmaceutical Needs Assessment 2018-2021 Monday, 19 March 2018Local Information & Protected Characteristics
Demography - Age
The size of the resident population of Wakefield District is estimated to be in the region of 332,000,
making the District the 18th largest local authority in England and Wales. NHS Wakefield CCG which is
coterminous with the local authority and has a registered population of 367,000 people. As is typical
nationally, the Wakefield age profile shows the effect of baby-boom years of the 1950s and 1960s and
greater numbers of women in older age than men. Overall numbers are projected to keep on increasing,
albeit more slowly than elsewhere in the region, with improved life expectancy resulting in a greater
proportion of the population being made up of people in older age groups.
When compared with many other metropolitan districts, Wakefield’s age profile has smaller than
average proportions of people in the late-teen, early 20’s age bands. This reflects the absence of any
sizeable university presence within Wakefield District. In large university cities such as Leeds, by contrast,
increasing levels of participation in higher education in recent decades have created a population where
9.8% of people are aged 20-24, compared to 6.0% in Wakefield District.
Wakefield follows a national picture where the population structure is shifting towards that of an
ageing population. Implications of an ageing population are wide in terms of people living longer into older
age, with an increased demand for health and well-being services, a reduction in working age people, a
reduced contribution to the economy and lower incomes, and increased human resources for care services
(paid and unpaid carers).
The total population of Wakefield district is expected to rise by approximately 6,000 persons (337,500
in 2018 to 342,700 in 2021). Compared to other regional Health & Wellbeing Board areas with more
urbanised populations, the growth is quite marginal.
Figure 1: Counts of residents within local HWB populations, projected until 2037
Page | 11
Wakefield Pharmaceutical Needs Assessment 2018-2021 Monday, 19 March 2018Figure 2: Counts of additional annual residents within local HWB populations, projected until 2037
In terms of actual counts, this marginal growth rate is in the region of 1,600 to 1,800 additional persons
per year (
Figure 2). This steady growth is expected to continue until 2022, before declining steadily to a 1,000
person per annum growth.
Figure 3: Growth rate of additional annual residents within local HWB populations, projected until 2037
Expressed as an annual growth rate (permitting more reasonable comparisons), Wakefield’s annual
growth rate is the lowest amongst these comparators at approximately 0.5% per annum in the PNA’s
period (Figure 3). Again, this is expected to tail off in 2022.
When assessing population projections, there are expected to be shifts in the population structure in the
long-to-medium term, as the proportion of the population aged over 60 increases (
Page | 12
Wakefield Pharmaceutical Needs Assessment 2018-2021 Monday, 19 March 2018Figure 4). In the 60-79 age range, the size of this population has been steadily increasing for the last
decade and will continue to 2020, with the current figure of 65,900 expected to rise to 68,800 persons in
2018. After which, there is predicted to be a steeper gradient, peaking in 2029. There is a lagged effect in
this population structure, where large increases in the 80+ age range will not be seen until 2023.
Figure 4: Percentage of Wakefield’s total population, split by age band, projected until 2037
At 22 pharmacies per 100,000 people, Wakefield overall sits under the West Yorkshire average (24 per
100,000) and is equivalent to the England rate (22 per 100,000).
Key Issues for this Characteristic
Living arrangements are important because older people living alone may place a greater demand
on personal social services compared to older people with other living arrangements.
Most people aged over 65 years of age report at least one chronic condition, and the number of
conditions reported increases with age. The most common problems relate to movement vision
and hearing.
Uptake of seasonal flu vaccine in older people is essential to preventing premature mortality and
exacerbation of existing conditions.
Page | 13
Wakefield Pharmaceutical Needs Assessment 2018-2021 Monday, 19 March 2018Demography - Ethnicity
Wakefield has a relatively small but growing ethnic minority population. In 2001, 3.3% of population
defined their ethnicity as other than White British; by the 2011 Census this proportion had increased to
7.2%. The largest minority ethnic group is now ‘Other White’, while the largest group born outside the UK
are people born in Poland. The age structure of the different ethnic groups varies, with the main ethnic
minority groups having a far smaller proportion of people in older age than is typical in the White British
population.
Table 1: Size of ethnic groups (2011 Census)
Source Census 2011
The above table demonstrates the proportion of ethnic groups and the actual number people this
equated to at the last census.
Page | 14
Wakefield Pharmaceutical Needs Assessment 2018-2021 Monday, 19 March 2018Table 2: Census ethnic groups applied to the primary information in 2017.
Census Ethnicity on Primary Care Information Female Male Person
White No % No % No %
White: Any other White background 7806 4.6% 7888 4.7% 15694 4.7%
White: British 131422 78.2% 123477 73.5% 254899 75.8%
White: Irish 393 0.2% 542 0.3% 935 0.3%
139621 83.8% 131907 79.2% 271528 81.5%
Mixed
Mixed: Any other mixed background 834 0.5% 877 0.5% 1711 0.5%
Mixed: White and Asian 381 0.2% 435 0.3% 816 0.2%
Mixed: White and Black African 367 0.2% 485 0.3% 852 0.3%
Mixed: White and Black Caribbean 227 0.1% 225 0.1% 452 0.1%
975 0.6% 1145 0.7% 2120 0.6%
Asian
Asian or Asian British: Any other Asian background within 746
(c) 0.4% 749 0.4% 1495 0.4%
Asian or Asian British: Bangladeshi 21 0.0% 29 0.0% 50 0.0%
Asian or Asian British: Chinese 440 0.3% 409 0.2% 849 0.3%
Asian or Asian British: Indian 895 0.5% 885 0.5% 1780 0.5%
Asian or Asian British: Pakistani 2897 1.7% 3186 1.9% 6083 1.8%
4232 2.5% 4480 2.7% 8712 2.6%
Black/African/Caribbean/Black British
Black or Black British: African 989 0.6% 1101 0.7% 2090 0.6%
Black or Black British: Any other Black background within (d)
214 0.1% 224 0.1% 438 0.1%
Black or Black British: Caribbean 103 0.1% 100 0.1% 203 0.1%
1306 0.8% 1425 0.9% 2731 0.8%
Other
Other ethnic groups: Any other ethnic group 740 0.4% 903 0.5% 1643 0.5%
Other ethnic groups: Arab 34 0.0% 59 0.0% 93 0.0%
Other ethnic groups: Not stated 7111 4.2% 8244 4.9% 15355 4.6%
7885 4.7% 9206 5.5% 17091 5.1%
Uncoded 12499 7.4% 18291 10.9% 30790 9.2%
Source Primary Care information 2017
Whilst the two information sources are not directly comparable, they are still worth reviewing to
identifying any changing population demographics. The primary care information does not cover the entire
Wakefield population, and ethnicity is not universally coded with the system. The last line of the above
table demonstrates that around 9% of the population do not have an ethnicity coded. With this in mind it’s
worth noting the Asian, Mixed and Black/African/Caribbean/Black British have remained pretty static since
2011.
What is interesting it the “Other White” proportion has nearly doubled in this period, which we know
locally to reflect the eastern European nations who have settled in the district as migrant labour.
There has been a sharp increase in the “other, not stated”, which reflects an ethnicity shift locally worth
further research and consideration.
Internal migration has slightly shifted in Wakefield since the last PNA, with a net increased migration of
people from other part s of the UK into Wakefield compared to those moving away from Wakefield.
Further details of this can be found at; http://www.wakefieldjsna.co.uk/population-2/migration/
Page | 15
Wakefield Pharmaceutical Needs Assessment 2018-2021 Monday, 19 March 2018Table 3: Population age structure by selected ethnic groups (2011 Census)
Correspondingly, the South Asian and Black population have higher proportions of people aged under
16, and the ‘White: Other’ age structure is characterised by a high proportion of young adults.
Key Issues for this Characteristic
The Polish Migrant Worker HNA (2010) found the following key issues:
Heavy consumption of alcohol-linked to depression and isolation. Those in employment tend to
drink heavily after working to socialise or relax.
A high percentage of the population smokes. It is a cultural norm to smoke and people are often
unaware of free smoking cessation support.
Distrust of NHS primary care system can, in some cases, prompt travel to Poland for a second
opinion.
Population tend to put on weight once they come to the UK. English food is sweeter and contains
more wheat than Polish food.
The Black & Ethnic Minority Needs Assessment (2010) found the following key issues:
Inequalities exist in relation to almost every aspect of health although some due to poor access to
services, there are however certain areas where poorer health outcomes exist, for example long
term conditions. This includes diabetes which is significantly higher in South Asian communities, as
is CHD.
Research also suggests that compared with the white population, South Asian people are three
times more likely to require an emergency hospital admission for their asthma and Black people are
twice as likely.
Other inequalities exist in relation to infant mortality and ethnic minority women twice as likely to
die during childbirth as well as infant abnormality.
Demography - Language
As a consequence of increasing ethnic diversity there are now many languages spoken within the
district. For just over 11,000 residents, English is not the main language spoken. The most common non-
English main languages are Polish (4,194 people); Punjabi (889 people); Urdu (809 people); Latvian (409
people); Lithuanian (344 people); and Kurdish (268 people).
Using local SystmOne access, we have queried GP records for those persons who do not use English as
a main language. Although the recording of language is variable between practices, it does offer a low-
level picture of where linguistic difficulties may be most prevalent.
Page | 16
Wakefield Pharmaceutical Needs Assessment 2018-2021 Monday, 19 March 2018Figure 5: Map showing the distribution of the registered population who are recorded as not using English as their main
language (SystmOne, 2014)
**Each dot represent a pharmacy, this does not include the distance selling pharmacies
The greatest concentration the registered population who are recorded as not using English as their
main language, tends to be located around the Central Wakefield area. This will be relevant for
pharmacies in those locales.
Key Issues for this Characteristic
The Black & Ethnic Minority Needs Assessment (2010) found the following key issues:
Inequalities in both access and outcomes are inevitable in some minority groups if we consider
some of the wider determinants which impact on health inequalities. These are further exacerbated
by cultural and language barriers which prevent people accessing services early.
Page | 17
Wakefield Pharmaceutical Needs Assessment 2018-2021 Monday, 19 March 2018Demography – Sexual Orientation
There is no evidence to suggest that the proportion of Lesbian, Gay, Bisexual or Transgender (LGBT)
people in Wakefield is different from the national average. Estimating proportions of the population to be
LGBT is hampered by non-reporting. This is something that since the 2010 equity act has become
increasingly in focus for the health and social care services.
As part of reforms announced by the minister for Health in 2017, all patients are to have their sexual
orientation asked by their health care professional, to help the health and care service make assessment of
how equal members of protected characteristics are receiving services.
The Treasury and Department of Trade and Industry estimated that 6% of the population was Lesbian,
Gay or Bisexual (LGB) in 2005; the Office for National Statistics Integrated Household Survey in 2012
estimated that 1.5% of the population is LGB. These would suggest between about 4,900 and 19,500 LGB
people in Wakefield.
Key Issues for this Characteristic
The Vulnerable Groups Health Needs Assessment (2011) found the following key issues:
Although we know very little about the number, age distribution and ethnic composition of LGBT
people in the United Kingdom, we know that men who have sex with men (MSM) are vulnerable to
sexually transmitted infections (STIs) and the human immunodeficiency virus (HIV).
In the last 3 years outbreaks of (STIs) have occurred in the (MSM) population.
We know very little about the specific health needs of lesbian and transgendered populations.
However, social isolation associated with LGB sexual orientation may in some cases be exacerbated by
rurality, and pharmacies may play a part in addressing this. Sexual orientation may have an effect on
certain elements of sexual health (Chlamydia, for example) which are screened or treated in pharmacies. In
more recent times locally, self-harm and sexual orientation in young people has been linked, insights found
by public health and community services.
Marriage and Civil Partnership
Marriage and Civil Partnership are not considered significant factors in the assessment of
pharmaceutical services in Wakefield.
Page | 18
Wakefield Pharmaceutical Needs Assessment 2018-2021 Monday, 19 March 2018Major Health Challenges
Wakefield’s current priorities, as laid out in the Wakefield Health & Wellbeing Strategy and informed by
the JSNA, are:
People making healthier choices and having a good quality of life
Increase awareness of healthy living
Support people to make healthy choices
Improve the wider factors that make healthy living easier and improve quality of life
Increase the proportion of people who lead healthy lifestyles
Every child has the best start in life
Children are developing well and are healthy
Parenting enables development and health of children
The parenting context enables good parenting
Wakefield District is a place where mental health and wellbeing is everyone’s concern and everyone
contributes to enable the whole population to flourish
Improving the mental wellbeing of individuals, families and the population addressing the social
determinants and consequences of mental health
Reducing the impact of mental ill-health through promotion of positive mental health (‘living well’)
and prevention of mental disorder across the life course
Raising awareness and reducing stigma around mental health
Improve quality, efficiency and equality of access to services
Early identification and intervention so that fewer people of all ages and backgrounds develop
mental health problems
Improving participation and quality of life for people with a mental health problem
People ‘at risk’ of or diagnosed with long term conditions feel supported to reduce further harm
Preventing future harm to those ‘at risk’ of having a long term condition e.g. people with poor
lifestyles, high blood pressure
Improving quality and equality of access to services
Early detection and identification of long term conditions
Ensure that people with long term conditions are supported to take responsibility for self-care
Improving quality of life and participation for people with a long term condition e.g. employment,
independence
Our ageing population feel supported and have a good quality of life
Maintenance of behaviours that promote positive health and wellbeing
Ensuring that our district is age-friendly
Older people being independent and living in their own homes for longer
Uphold the National Pensioners Convention Dignity Code to uphold the rights and maintain the
dignity of older people
In greater detail, there are several areas of health challenge that community pharmacy can play a
significant role in improving health outcomes and closing inequalities. Much of this data has been sourced
from Wakefield’s current JSNA.
Page | 19
Wakefield Pharmaceutical Needs Assessment 2018-2021 Monday, 19 March 2018Life Expectancy & Mortality
Over recent years there have been gradual improvements to the life expectancy in the Wakefield
District. Based on latest calculations (2013-15), male children born today can expect to live to the age of
78.0, compared to around 79.5 years of age across England as a whole. As is the pattern nationally,
females born in Wakefield today are expected to live longer than males, to about the age of 82.0. This
compares to a national life expectancy amongst women of 83.1. The district has seen improvement since
the first PNA, however the gap to the national average still remains for both men and women locally.
Significant differences remain within the district. Males born today in the most deprived parts of the
district (top-10%) can expect to live 10.6 years less than their more affluent counterparts (10% least
deprived). For females the gap is 8.9 years. PHI produce a report looking in to the inequality issues in life
expectancy, given the flat line in improvement that we have seen locally. Deaths considered premature
(under 75 year) are increasing for the poorest women in the Wakefield district. The findings from the
report are summarised;
Deaths in females aged under 75 in the most deprived 5 deciles are increasing.
Wakefield residents die younger compared with the national averages.
Wakefield residents experience significantly more disability in their shorter life spans.
Women live longer compared to men, but with more disability and the inequality is worsening.
Men die far sooner, however the trend in inequality has been improving.
Wakefield loses a disproportionately large amount of its life-years in the most deprived communities to
chronic heart disease (CHD), lung cancer, chronic obstructive pulmonary disease (COPD) and – particularly
in men – chronic liver disease.
Cardiovascular Diseases
Collectively, heart and circulatory diseases cause more than 1 in 3 of all deaths in the UK.
Cardiovascular disease (CVD) could be avoided in 30% of cases, through people adopting healthy
behaviours. In the UK, death rates from coronary heart disease (CHD) are highest in areas of greatest
deprivation and Wakefield is no exception to this trend. Every year over 150,000 people have a stroke and
it is the third largest cause of death, after heart disease and cancer. The brain damage caused by strokes
means that they are the largest cause of adult disability in the UK. Cardiovascular disease can be
debilitating and impact on health, healthcare and social care usage, along with the financial stability of
those affected.
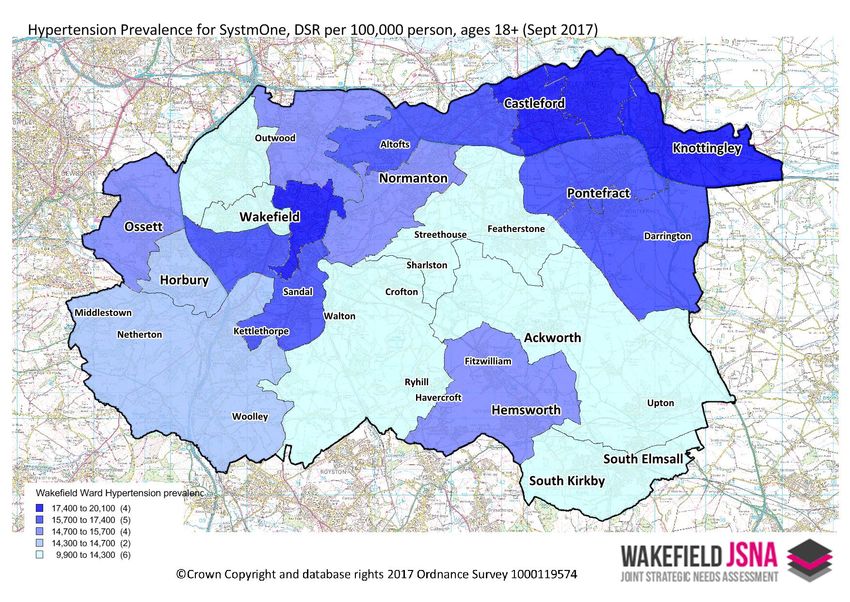
Hypertension
Wakefield has a recorded hypertension prevalence of 15.3% compared to the national average of
13.8% in 2015/16. This places Wakefield just below the upper quartile nationally. Wakefield has a similar
prevalence of hypertension when compared to other areas in the Region. In comparison to other areas in
our peer group, Wakefield sits in the lower quartile. Our prevalence rate has steadily risen over the past
five years, with approximately 54,000 persons on the hypertension register. The following charts reflect
this figure referring to the population in contact with primary health care services in September 2017.
In terms of their management, Wakefield has tended to perform well when keeping blood pressure
under 150/90. This reflects the known hypertensives in the area, as with all disease there is an additional
element of undiagnosed cases in a population. Improvements from 2008 onwards have been observed in
this measure. More recently, that performance has slipped over the last two financial years (12/13 -
13/14), with 81.7% of hypertension patients having their blood pressure under this critical value, compared
to the national average of 79.6%. Compliance with blood pressure checks has, as seen nationally, fallen
gradually to its current level of 90%.
Page | 20
Wakefield Pharmaceutical Needs Assessment 2018-2021 Monday, 19 March 2018In the following prevalence maps based on SystmOne primary care information, the map represents
90% of the registered population. The maps display this information on an electoral ward geographic level,
which mitigates the non-SystmOne GP sites. The wards containing Walton, Crofton and Ryhill is likely to be
under estimated the predominant practice in this ward is a non SystmOne GP.
Figure 6: Map of hypertension prevalence per 100,000 persons in SystmOne practices (standardised to pre-2013 ESP)
Source Primary Care Information 2017 **
New diagnoses of hypertension have traditionally been given a face-to-face cardiovascular risk
assessment. Wakefield has, in the past, massively exceeded national rates for this (88.6% in 2010/11
compared to national average of 82%). This figure has subsequently dropped to 78.4% in Wakefield
however the area still exceeds national average levels of 66.5%
Chronic Heart Disease (CHD)
Wakefield has a recorded CHD prevalence of 4.1% compared to the national average of 3.2%
(2015/16). This places Wakefield above the upper quartile nationally. This picture is similar compared to
other areas in the Region and our deprivation decile. In comparison to other areas in our peer group,
Wakefield also sits in the upper quartile. The area has seen a small decrease in the last 3 years, with
approximately 13,295 persons on the CHD register.
Page | 21
Wakefield Pharmaceutical Needs Assessment 2018-2021 Monday, 19 March 2018Figure 7: Map of CHD prevalence per 100,000 persons in SystmOne practices.
Source Primary Care Information 2017
The management of blood pressure amongst people on the CHD register is generally good. Wakefield
exceeds 89.3% when keeping blood pressure under 150/90, which is comparable with national, regional
and peer averages. Amongst those with CHD, the maintenance of cholesterol at 5mmol/l or less has
shown a degree of instability over time. Wakefield peaked at 82.2% in the 2010/11 period and exceeded
national averages. Since then, there has been a drop to 71.8% that mirrors national trends. Local
treatment with aspirin and beta-blockers has kept pace with national trends. Treatment of patients with a
history of myocardial infarction with ACE inhibitor, aspirin, beta-blocker and statin is comparable to
national rates.
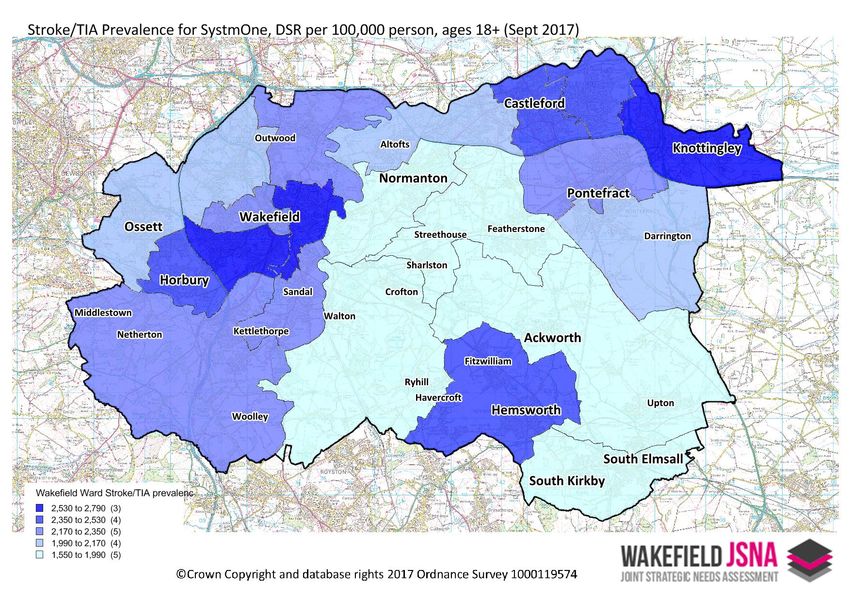
Stroke & Transient Ischaemic Attack (TIA)
Wakefield’s stroke register is about 2.1% of the population, compared to a national average of 1.7%
and an ONS cluster average of 1.9% - on both of which we sit outside the upper quartile. This is
representative of about 7,500 people in the registered population, with the register growing (accounting
for turnover) by about 80 persons per year. The control of blood pressure under 150/90 amongst those
with a stroke/TIA is good in Wakefield, with local rates exceeding all other relevant comparator averages
(86.9%, 2015/16). This has been steadily improving and been in excess of comparator rates since 2009/10.
Cholesterol control is comparable to other comparator rates, but otherwise unremarkable. The coverage
of cholesterol checks has improved in recent times closing the gap to the national average.
Page | 22
Wakefield Pharmaceutical Needs Assessment 2018-2021 Monday, 19 March 2018Figure 8: Map of Stroke & Transient Ischaemic Attack (TIA) prevalence per 100,000 persons in SystmOne practices.
Source Primary Care Information 2017
Related CVD Outcomes
Wakefield continues to have a high smoking-related deaths rate, at 354.6 per 100,000 (2013-15). This
is equivalent to approximately 1,959 unnecessary deaths per year. By most comparators, we do not
perform well here. We are outside the upper quartile nationally, within metropolitan districts and within
our deprivation decile. However, we are close to the median for our ONS peer group. Although the trend
is decreasing, it is at a rate that does not close the gap with the national averages.
The under-75 mortality rate from cardiovascular diseases considered preventable shows a similar
trend. Although we have seen great improvements in this measure over the last ten periods, the extent of
the gap has not closed against any of our comparators – irrespective of gender. There is a notable issue
here, however; this measure is heavily skewed against males. We lose approximately 520 people a year,
under the age of 75, to preventable cardiovascular diseases. Of these, 395 will be male. In the most recent
period available the gap for women has increased, suggesting that the issues for women are worsening.
Mortality from cardiovascular diseases shows a high degree of inequality, with our most deprived
decile having a far higher level of mortality than our least deprived areas (408 vs 212 per 100,000 persons).
This extremity is more pronounced in males and even more so when assessing those deaths under the age
of 75 (218 vs 65 per 100,000 males).
Page | 23
Wakefield Pharmaceutical Needs Assessment 2018-2021 Monday, 19 March 2018You can also read