Genomic signatures of inbreeding in a critically endangered parrot, the k ak ap
←
→
Page content transcription
If your browser does not render page correctly, please read the page content below
2
                                                                                                                                          G3, 2021, jkab307
                                                                                                                          DOI: 10.1093/g3journal/jkab307
                                                                                                           Advance Access Publication Date: 31 August 2021
                                                                                                                                               Investigation

Genomic signatures of inbreeding in a critically endangered
parrot, the ka
              ka
                po


                                                                                                                                                               Downloaded from https://academic.oup.com/g3journal/advance-article/doi/10.1093/g3journal/jkab307/6360462 by guest on 09 October 2021
Yasmin Foster    ,1,* Ludovic Dutoit      ,1 Stefanie Grosser    ,1 Nicolas Dussex                     ,2,3,4 Brodie J. Foster  ,1 Ken G. Dodds     ,5
Rudiger Brauning      ,5 Tracey Van Stijn     ,5 Fiona Robertson,1 John C. McEwan                        ,5 Jeanne M. E. Jacobs     ,6 and Bruce C.
              1
Robertson
1
  Department of Zoology, University of Otago, Dunedin 9054, New Zealand,
2
  Centre for Palaeogenetics, SE-106 91 Stockholm, Sweden
3
  Department of Bioinformatics and Genetics, Swedish Museum of Natural History, SE-104 05 Stockholm, Sweden
4
  Department of Zoology, Stockholm University, SE-106 91 Stockholm, Sweden
5
  AgResearch Invermay Agricultural Centre, Mosgiel 9053, New Zealand, and
6
  AgResearch Lincoln Research Centre, Christchurch 8140, New Zealand

*Corresponding author: Department of Zoology, University of Otago, 340 Great King Street, Dunedin 9016, New Zealand. Email: y.al.foster@gmail.com

Abstract
Events of inbreeding are inevitable in critically endangered species. Reduced population sizes and unique life-history traits can increase
the severity of inbreeding, leading to declines in fitness and increased risk of extinction. Here, we investigate levels of inbreeding in a criti-
cally endangered flightless parrot, the k
                                         ak
                                           apo (Strigops habroptilus), wherein a highly inbred island population and one individual from the
mainland of New Zealand founded the entire extant population. Genotyping-by-sequencing (GBS), and a genotype calling approach using
a chromosome-level genome assembly, identified a filtered set of 12,241 single-nucleotide polymorphisms (SNPs) among 161 k              akapo,
which together encompass the total genetic potential of the extant population. Multiple molecular-based estimates of inbreeding were
compared, including genome-wide estimates of heterozygosity (FH), the diagonal elements of a genomic-relatedness matrix (FGRM), and
runs of homozygosity (RoH, FRoH). In addition, we compared levels of inbreeding in chicks from a recent breeding season to examine if in-
breeding is associated with offspring survival. The density of SNPs generated with GBS was sufficient to identify chromosomes that were
largely homozygous with RoH distributed in similar patterns to other inbred species. Measures of inbreeding were largely correlated and
differed significantly between descendants of the two founding populations. However, neither inbreeding nor ancestry was found to be as-
sociated with reduced survivorship in chicks, owing to unexpected mortality in chicks exhibiting low levels of inbreeding. Our study high-
lights important considerations for estimating inbreeding in critically endangered species, such as the impacts of small population sizes
and admixture between diverse lineages.

Keywords: conservation; genetic management; offspring survival; inbreeding coefficient; inbreeding depression; heterozygosity; runs of
homozygosity

Introduction                                                                       studies (Huisman et al. 2016; Grossen et al. 2018; McLennan et al.
Extensive inbreeding between close relatives and subsequent fit-                   2019). It is now feasible for conservation programs to routinely in-
ness effects are a major threat to the resilience of critically en-                tegrate genomic sequencing into management strategies (Shafer
dangered populations (Charlesworth and Willis 2009; Frankham                       et al. 2015; Hendricks et al. 2018). Knowledge of population struc-
et al. 2017). Inbreeding is conventionally measured from pedi-                     ture, relatedness, and levels of inbreeding can inform breeding
grees, but advances in DNA sequencing technologies have made                       decisions and provide crucial insight into the future viability of
it possible to study the consequences of complex intergenera-                      endangered populations (Allendorf et al. 2010). It is therefore im-
tional inbreeding at the scale of the genome across entire species                 portant to evaluate the performance of different marker-based
or populations (Kardos et al. 2015a; Benazzo et al. 2017). Reduced-                measures of inbreeding and understand how they relate to
representation genome-wide sequencing allows for the cost-                         fitness-associated traits such as offspring survival (Keller 1998;
effective acquisition of single-nucleotide polymorphism (SNP)                      Fu et al. 2019).
datasets that are well-suited for computationally efficient popu-                      Reduced fitness in offspring of related parents is known as in-
lation genetic analyses (Baird et al. 2008; Andrews et al. 2016).                  breeding depression and results from increases in homozygosity
Furthermore, best practices for population genetic analyses using                  in two genetically distinct ways. These include the increase and
SNPs continue to be refined with findings from simulations                         exposure of homozygous recessive alleles maintained at low fre-
(Keller et al. 2011; Kardos et al. 2015a; Wang 2016) and empirical                 quencies by mutation-selection balance, and the increase of

Received: May 20, 2021. Accepted: August 23, 2021
C The Author(s) 2021. Published by Oxford University Press on behalf of Genetics Society of America.
V
This is an Open Access article distributed under the terms of the Creative Commons Attribution License (http://creativecommons.org/licenses/by/4.0/), which
permits unrestricted reuse, distribution, and reproduction in any medium, provided the original work is properly cited.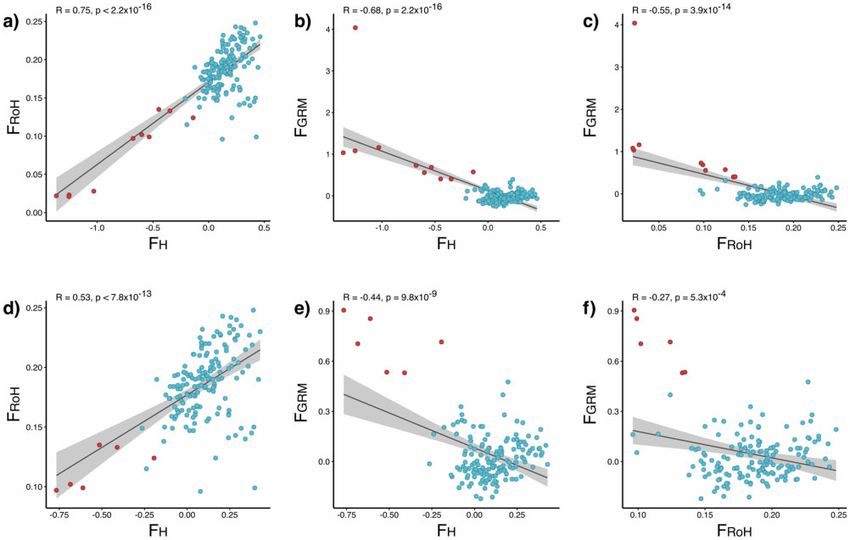
2   |   G3, 2021, Vol. 0, No. 0

homozygous alleles at loci exhibiting heterozygous advantage               mating system where a dominant male can father most of the
(i.e., overdominance) maintained at moderate frequencies by bal-           offspring, predisposes the ka          ka
                                                                                                                     po
                                                                                                                        to inbreeding (Clout and
ancing selection (Charlesworth and Willis 2009; Frankham et al.            Merton 1998; Robertson 2006; Merton et al. 1984). For instance,
2017). Inbreeding and resulting increases in homozygosity (i.e.,           one male ka     ka
                                                                                              po
                                                                                                 (Blades) from the Stewart Island founding popu-
exposure of harmful mutations) can elevate extinction risk in en-          lation has fathered 22 chicks (of which 18 survived) since being
dangered populations through increased susceptibility to disease           translocated to predator-free islands, representing a significant
(Benton et al. 2018; Townsend et al. 2018), reduced population             genetic contribution to the total population size of 201 adults (as
growth rates (Bozzuto et al. 2019), higher prevalence of congenital        of August 2021). Indeed, previous studies exploring the recent
defects (Ralls et al. 2000; Robinson et al. 2019), and reduced repro-      evolutionary history of ka       ka
                                                                                                               po
                                                                                                                  found a 30-fold decline in ge-

                                                                                                                                                              Downloaded from https://academic.oup.com/g3journal/advance-article/doi/10.1093/g3journal/jkab307/6360462 by guest on 09 October 2021
ductive success (Keller 1998). In small populations, there is also         netic diversity within the mitochondrial genomes of historical
concern that inbreeding, as well as demographic and environ-               and modern individuals (Bergner et al. 2016; Dussex et al. 2018).
mental stochasticity, can act in combination with genetic drift to         Reduced genetic diversity and inbreeding depression within
limit adaptive potential (Kimura 1957; Hoffmann et al. 2017; Dı́ez-        ka ka
                                                                                 po
                                                                                    manifests as a consequential number of early-death em-
del-Molino et al. 2018; Leroy et al. 2018; Mable 2019). However, it        bryos, smaller clutch sizes, and reduced hatching success, consis-
has also been suggested that in populations that experience re-            tent with a low number of effective breeders (Bergner et al. 2014;
duced effective population sizes over long periods of time, some           White et al. 2015). Current management strategies to mitigate in-
deleterious alleles can be purged through a combination of in-             breeding include preventing consanguineous matings and pro-
breeding and purifying selection (Hedrick and Garcia-Dorado                moting matings involving ka         ka
                                                                                                                  po
                                                                                                                     descended from the mainland
2016; Caballero et al. 2017).                                              founder (Robertson 2006; Bergner et al. 2014).
    Recent empirical and simulation studies demonstrate that in-               Estimating inbreeding from pedigree-based methods in ka               ka
                                                                                                                                                        po

breeding estimates from genomic approaches are more precise                would be futile, as their pedigrees are confounded by unknown par-
and less downwardly biased compared to traditional pedigree-               entage in the founding population and deep intergenerational con-
based methods (Keller et al. 2011; Taylor et al. 2015; Kardos et al.       sanguineous matings (Robertson 2006). Furthermore, pedigree
2015a; Wang 2016). Pedigree-based estimates of inbreeding pre-             analysis assumes that founders of the population are unrelated,
dict the expected proportion of an individual’s genome that is             which is unlikely to be true for the small founding island population
identical-by-descent (IBD), but low variances and the inability to         of ka ka
                                                                                    po
                                                                                       . In this study, we use a reduced-representation genotyp-
measure stochastic effects such as linkage and Mendelian segre-            ing-by-sequencing (GBS) approach (Elshire et al. 2011; Dodds et al.
gation can hamper the ability to detect inbreeding effects (Keller         2015) to revise measures of inbreeding in ka       ka
                                                                                                                                 po
                                                                                                                                    , which were previ-
et al. 2011; Knief et al. 2017; Kardos et al. 2018). In addition, large    ously estimated from microsatellites (Bergner et al. 2014; White et al.
multigenerational pedigrees are difficult to obtain for wild popu-         2015). Nearly all adult ka    ka
                                                                                                            po
                                                                                                               since the translocation of the found-
lations and may be impractical for long-lived species or species           ing population in the late 1970s, up to and including chicks from
with urgent conservation needs (Kardos et al. 2016). Numerous              the 2016 breeding season were included in genotyping. Together,
studies have demonstrated the utility of inbreeding estimates              these individuals encompass the total genetic potential of the ex-
generated from microsatellites, targeted-gene sequencing,                  tant ka ka po population. Deceased chicks and adults, and a single
reduced-representation sequencing, and whole-genome sequenc-               early-death embryo, were also genotyped. Discovery of SNPs was fa-
ing (Hoffman et al. 2014; Knief et al. 2015; Huisman et al. 2016;          cilitated by mapping of GBS reads to a high-quality genome assem-
Norén et al. 2016; Humble et al. 2018; Lemopoulos et al. 2019;            bly of a ka   ka
                                                                                            po
                                                                                               (Jane) provided by the Vertebrate Genome Project
McLennan et al. 2019). Other studies have evaluated the number             (Dussex et al. 2021; Rhie et al. 2021), allowing a rigorous reference-
and depth of genome-wide markers necessary to apply equitable              based approach (Shafer et al. 2017; O’Leary et al. 2018). We calcu-
population genetic analyses (Kardos et al. 2015a, 2018), and have          lated multiple estimators of inbreeding in ka                ka
                                                                                                                                           po
                                                                                                                                              , including
compared the effects of bioinformatic pipelines on population ge-          genome-wide estimates of heterozygosity (FH) and the diagonal ele-
netic inferences; in particular genotype callers and filtering             ments of a genomic-relatedness matrix (GRM, FGRM). Several studies
options (Andrews et al. 2016; Benestan et al. 2016; Paris et al. 2017;     using whole-genome sequencing have demonstrated that runs of
Shafer et al. 2017; O’Leary et al. 2018; Dı́az-Arce and Rodrı́guez-        homozygosity provide the most robust estimator of genome-wide
Ezpeleta 2019). With these recent advances, and the increasing             patterns of inbreeding (i.e., autozygosity) (Kardos et al. 2017, 2018).
availability of genome-wide SNP data, genomic methods are ripe             Therefore, we also screened for runs of homozygosity (RoH, FRoH) in
for integration into the conservation management of endangered             the GBS dataset and evaluated its accuracy relative to FH and FGRM.
populations (Wright et al. 2020).                                          In addition, levels of inbreeding were compared between the
    The critically endangered ka    ka
                                       po
                                          (Strigops habroptilus) is en-   descendants of the mainland and Stewart Island founding popula-
demic to New Zealand, and unique among parrots in that it is               tions to further investigate the impacts of previous bottlenecks
flightless, nocturnal, and possesses a polygynous lek mating sys-          (Dussex et al. 2018). Finally, we compared inbreeding estimates be-
tem (Powlesland et al. 2006). Ka  ka
                                     po
                                        underwent a significant pop-      tween deceased and surviving ka        ka
                                                                                                                     po
                                                                                                                        chicks from a recent breeding
ulation decline following the introduction of mammalian                    season to understand potential genetic factors underlying prema-
predators and other anthropogenic impacts, with a single male              ture mortality (Fu et al. 2019).
(Richard-Henry) surviving from the mainland of New Zealand
(Powlesland et al. 2006; Dussex et al. 2018). Ka   ka
                                                      po
                                                         were rediscov-
ered on Stewart Island (30 km south of New Zealand’s South
                                                                           Materials and methods
Island) and a small founding population of 61 individuals were             Study population and management
translocated (of which 39 have reproduced), together with the              The total extant population of ka  ka
                                                                                                                 po
                                                                                                                    is intensively managed by
single remaining mainland male, to predator-free offshore                  the ka ka
                                                                                     po
                                                                                        Recovery Team of the New Zealand Department of
islands from the late 1970s onwards (Powlesland et al. 1995). The          Conservation. Ka   ka
                                                                                                 po
                                                                                                    were thought to be functionally extinct
impacts of originating from a small insular population, having an          prior to the 1970s (Clout and Merton 1998). Between 1974 and
extended life span with infrequent breeding, and possessing a lek          1977, 18 surviving males were discovered in Fiordland on the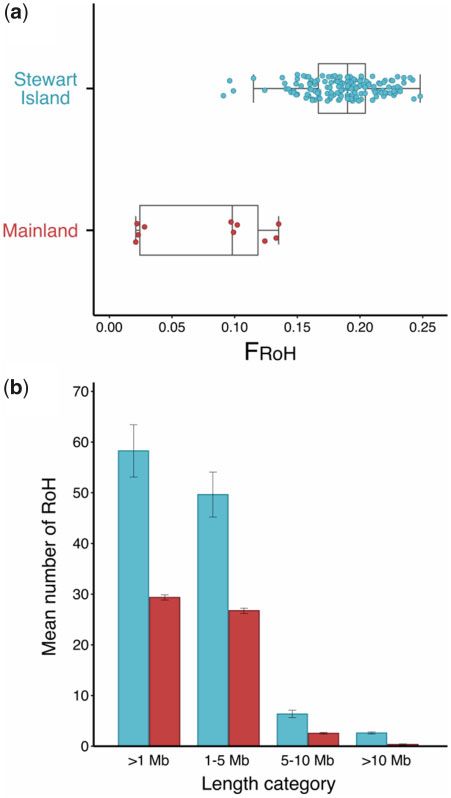
Y. Foster et al.   |   3

mainland of New Zealand, but only a single male (Richard-                 for the alignment of preprocessed GBS reads to the ka      ka
                                                                                                                                        po
                                                                                                                                           refer-
Henry) survived and contributed to the current managed popula-            ence genome. Briefly, the chromosomal-level assembly identified
tion (Clout and Merton 1998; Powlesland et al. 2006); Richard-            24 autosomes and ZW sex-chromosomes; total length
Henry and his descendants are referred to as the mainland                 1165.62 Mb, N50 scaffold 83 Mb, and N50 contig 9.5 Mb (NCBI:
founder and descendants hereafter (n ¼ 10). In 1977, a small insu-        GCA_004027225.1) (Dussex et al. 2021; Rhie et al. 2021). The as-
lar population on Stewart Island was also rediscovered and even-          sembly allowed for a rigorous reference-based approach where
tually translocated (n ¼ 61) to predator-free islands (Lloyd and          reads were mapped to a chromosome-level assembly before SNP
Powlesland 1994; Powlesland et al. 1995); this translocated popu-         calling, resulting in decreased type I errors (Davey et al. 2011;
lation and its descendants are referred to as Stewart Island

                                                                                                                                                       Downloaded from https://academic.oup.com/g3journal/advance-article/doi/10.1093/g3journal/jkab307/6360462 by guest on 09 October 2021
                                                                          Shafer et al. 2017). After alignment, Samtools v1.8 (view, sort, and
founders and descendants hereafter (n ¼ 153). Some relationships          flagstat) was used to convert and sort SAM files to BAM files, and
between individuals of the founding population are currently              to print statistics for checking alignment mapping rate (Li et al.
unresolved (Robertson 2006), and recent genomic data indicate             2009).
that the Stewart Island population constitutes a distinct lineage             Stacks v1.46 was used to call SNPs with a reference genome
that has been separated from the mainland population for thou-            (Catchen et al. 2013; Paris et al. 2017; Rochette and Catchen 2017).
sands of generations since the last ice age (Dussex et al. 2021).         Default parameters were used for ref_map.pl except to include a
The current population (as of August 2021) totals 201 individuals         reduction in soft clipping during pstacks (–max_clipped 0.5). Stacks
maintained on New Zealand predator-free islands: Whenua Hou               populations with default parameters and filtering for one SNP per
(Codfish Island), Te Hauturu-o-Toi (Little Barrier Island), Te            RAD locus (–write_single_snp) was used to output genotypes in
Ka kahu-o-Tamatea (Chalky Island), and Anchor Island. The ma-            VCF and PLINK formats for further downstream analyses
            ka
jority of ka   po
                  have been repeatedly transferred between these         (Catchen et al. 2013). After SNP calling, a total of 14 individuals
islands as part of management, and therefore the current loca-            with a high proportion of missing data (>70%) were removed, as
tion of individuals was not considered in our analyses. Capture,          well as one female Stewart Island founder (Jean), following ob-
handling, and sample collection were performed in accordance              scure parentage results in previous microsatellite datasets (B.
with ethical requirements approved by Nga    i Tahu and the New
                                                                          Robertson, unpublished data), which were reproduced in initial
Zealand Department of Conservation.                                       population structure analyses in the current study (results not
                                                                          shown). Variants were then filtered per individual in VCFtools
DNA sequencing
                                                                          v1.14 (Danecek et al. 2011) for a minimum read depth of two and
Ka ka
      po
         samples were obtained as blood and stored in lysis buffer
                                                                          a maximum read depth of 30 (–minDP 2, –maxDP 30) across geno-
(Seutin et al. 1991) until DNA extraction, or as tissue and stored in
                                                                          types to reduce repetitive elements and allowing up to 20% miss-
absolute ethanol at 20 C. Adult ka    ka po
                                               were sampled exclu-
                                                                          ing data (–max-missing 0.80), as to not remove excessive
sively from blood (n ¼ 138), and a selection of blood, chorioallan-
                                                                          numbers of markers while taking into consideration founder an-
toic membrane, and liver were sampled from surviving and
                                                                          cestry and the limited diversity within the ka         ka
                                                                                                                                    po
                                                                                                                                       genome
deceased chicks from the 2016 breeding season (n ¼ 38). Genomic
                                                                          (Huang and Lacey Knowles 2016; Shafer et al. 2017; O’Leary et al.
DNA was isolated from blood or tissue using standard phenol-
                                                                          2018; Ahrens et al. 2021). The Z-chromosome and W-chromosome
chloroform extractions following Sambrook et al. (1989). GBS was
                                                                          were removed from the dataset using VCFtools, so that only auto-
performed at AgResearch Invermay, New Zealand, closely follow-
                                                                          somal markers were used for downstream analyses. Genetic di-
                                                     ka
ing Elshire et al. (2011) and Dodds et al. (2015). Ka   po
                                                           GBS librar-
                                                                          versity can be biased when filtering for high minor allele
ies were double-digested with restriction enzymes PstI and MspI
                                                                          frequencies (MAF), since these markers can overestimate the pro-
(NEB R140L and R0106L, New England Biolabs, Ipswich, USA),
                                                                          portion of heterozygous sites (Ekblom et al. 2018), and strong MAF
with even digestion and no evidence of repetitive elements in
                                                                          filtering increases the downward bias of inbreeding and related-
Bioanalyser traces (2100 Bioanalyser, Agilent Technologies, Santa
                                                                          ness estimates (Weir and Goudet 2017; Goudet et al. 2018).
Clara, USA). Following ligation of barcoded adapters, libraries
were pooled and multiplexed. Amplification was followed by pu-            Therefore, we did not filter for MAF explicitly during SNP calling;
rification and size selection performed on a Pippin (193–500 bp,          some downstream softwares, however, can incorporate MAF fil-
SAGE Science, Beverly, USA; 2% agarose, dye-free with internal            tering (e.g., KGD; Dodds et al. 2015). Scripts for methods described
standards CDF2050, Marker L CDF2010). Each GBS library, con-              here are available from https://github.com/yasfoster/kakapo_
sisting of 94 samples, was run on a single lane of an Illumina            gbs.
HiSeq2500 generating single-ended reads for 101 cycles in high-               A principal component analysis (PCA) based on filtered SNPs
output mode (v4 chemistry).                                               was conducted in PLINK v1.9 and R (Purcell et al. 2007; R Core
                                                                          Team 2020) to rule out the presence of unexpected population
SNP calling and filtering                                                 structure. Two highly divergent founding populations, previously
Stacks v1.46 process_radtags was used to demultiplex raw reads            identified by Dussex et al. (2018, 2021), were apparent in the PCA
and trim barcodes (Catchen et al. 2013; Paris et al. 2017; Rochette       (Supplementary Figure S1). Consequently, three variations of the
and Catchen 2017). Trimming of additional Illumina adaptors               data were filtered separately after excluding different subsets of
and removal of low-quality bases (Q < 20) were performed using            individuals, to consider potential effects of population substruc-
trim_galore v0.4.5, a tool combining Cutadapt and Fastqc (Martin          ture on inbreeding estimates. Briefly, a main dataset containing
2011; Andrews et al. 2012; Krueger 2015). All reads were truncated        all individuals was filtered for minimum and maximum depth,
to the same length of 72 bp with Cutadapt v2.3 while optimizing           and for missing data, leaving a total of 12,241 SNPs for 161 indi-
the number of reads written (Martin 2011). Finally, MultiQc v1.5          viduals. Identical filtering was applied to a second dataset after
was used to collate the quality control information after every           the removal of the sole mainland founder Richard-Henry and his
read processing step before mapping to the reference genome               only three offspring (F1) prior to estimating inbreeding, leaving a
and SNP calling (Ewels et al. 2016). Burrow Wheelers Aligner v0.7.15      total of 12,089 SNPs for 157 individuals. Finally, identical filtering
(algorithm BWA mem; Li 2013) was used with default parameters             was performed on a third dataset after the removal of all
4 | G3, 2021, Vol. 0, No. 0
mainland descendants, Richard-Henry and both his F1 and F2 inbreeding under nonrandom mating within a population (Keller
descendants (n ¼ 10), leaving 12,207 SNPs for 151 individuals. and Waller 2002; Keller et al. 2011; Kardos et al. 2016). In a random
mating population, FH should be centered near zero, whereas
Measures of inbreeding positive FH values indicate individuals whose parents are more
Estimating individual inbreeding is strongly influenced by the closely related than expected with a deficiency of heterozygotes,
number of SNPs called, the variance explained by markers, and and negative values imply the opposite (Wang 2014; Waples and
the expected heterozygosity within the population (Kardos et al. Allendorf 2015).
2015a; Knief et al. 2017). To meet theoretical requirements for
detecting inbreeding depression, markers should have nonzero Genomic-relatedness matrix, FGRM:
Downloaded from https://academic.oup.com/g3journal/advance-article/doi/10.1093/g3journal/jkab307/6360462 by guest on 09 October 2021
variance and heterozygosity should correlate with the heterozy- The genomic relatedness matrix (GRM) and its diagonal elements
gosity of functional loci; this phenomenon is termed identity dis- of self-relatedness (FGRM) uses allele frequencies to provide unbi-
equilibrium (ID) (Weir and Cockerham 1973; Szulkin et al. 2010). ased estimates of individual inbreeding while accounting for read
We characterized the extent of variation in inbreeding and the depth in the genotype calls, implemented in the R package
degree to which markers reflect genome-wide heterozygosity us- “kinship using GBS with depth adjustment” (KGD v0.9.5, Dodds et al.
ing the inbreedR v0.3.2 package in R, with bootstrapping (n ¼ 1000; 2015). This fully corrected method of estimation (G5) described by
Stoffel et al. 2016). ID was quantified using g2, a metric that Dodds et al. (2015) uses methods equivalent to VanRaden (2008),
reflects how heterozygosity is correlated across markers, except that missing genotypes are not imputed. Genotypes are
whereby significant mean g2 values provide support for variance used for estimating inbreeding only if both alleles of a SNP may
in inbreeding in the population (Szulkin et al. 2010; Stoffel et al. be scored (i.e., if there are at least 2 reads). Individuals more in-
2016). We also calculated heterozygosity–heterozygosity correla- bred than average have positive values, whereas less inbred indi-
tion coefficients to estimate ID by dividing the SNP markers into viduals are expected to have negative values. The Python script
two random subsets and computing the correlation in heterozy- vcf2ra.py (available from https://github.com/AgResearch/KGD)
gosity between them, with subsetting replicated (n ¼ 1000) was used to convert VCF to the “Tassel” format for input into
(Balloux et al. 2004; Stoffel et al. 2016). The input variant files were KGD. Applying KGD filtering to the total dataset, 876 SNPs with a
formatted for inbreedR using the packages vcfR v1.10.0 and re- depth 1 Mb was used when identifying RoH (Pemberton et al.
2012). where j indexes SNPs with depth at least two in the individual,
Kj ¼ 1=2kj , kj is the depth, xj is the (inferred) number of reference
Inbreeding coefficient, FH: alleles in the genotype, and pj is the reference allele frequency
The inbreeding coefficient (FH), the probability that an individual (Dodds et al. 2015).
carries two IBD copies of an allele at a given neutral locus, was
calculated using VCFtools (–het) and confirmed with PLINK (–het) Runs of homozygosity, FRoH:
using method of moments (Purcell et al. 2007; Danecek et al. The accurate detection of runs of homozygosity (RoH) using
2011). FH is defined as, reduced-representation sequencing approaches is highly depen-
dent on read depth, SNP density, and the distribution of SNPs
ObsHom ExpHom across the genome. However, dense markers from GBS and the
FH ¼
#SNPs ExpHom availability of a high-quality chromosome-level genome assem-
bly provide the necessary framework to map and compare RoH
where ObsHom is the observed number of homozygous loci in an coordinates across the genome (Kardos et al. 2017; Ceballos et al.
individual, ExpHom is the expected number of homozygous loci 2018; Grossen et al. 2018; Zhang et al. 2019). RoH analyses using
under Hardy-Weinberg equilibrium, and #SNPs is the number of reduced-representation sequencing may not necessarily provide
markers called. FH ranges from 1 to 1 and measures the excess the complete picture of autozygosity across the genome, particu-
number of observed homozygous genotypes relative to the mean larly in regions with short RoH and low abundance of SNPs, mak-
expected homozygosity, and can be considered as a measure of ing boundaries of RoH difficult to identify. However, RoHY. Foster et al. | 5
estimates derived from reduced-representation sequencing may population, the depth and accuracy of the SNPs called, as well as
be considered plausible estimates of inbreeding if they are con- sample and effect sizes (Keller et al. 2011). Methods used to esti-
gruent with traditional estimators of heterozygosity (e.g., FH and mate inbreeding in this study have considered these criteria dur-
FGRM) (Kardos et al. 2015a). RoH was identified using the –homozyg ing parameter selection, such as subsetting the data, depth
function in PLINK (Purcell et al. 2007; Howrigan et al. 2011), setting adjustment for the GRM (Dodds et al. 2015), and using ID to con-
the parameters to appropriate values for ka ka
po
(SNP density: firm there was nonzero variation in heterozygosity measures
84.03 kb/SNP) while closely following Grossen et al. (2018) and (Weir and Cockerham 1973; Szulkin et al. 2010). All statistical
Kardos et al. (2015, Supplementary Table S1). To account for occa- analyses and plotting were performed in R Studio v1.3.959, using
sional mutations or sequencing error, a single heterozygous posi- the following packages: ggplot2 v3.3.2, ggpubr v0.4.0, ggfortify
Downloaded from https://academic.oup.com/g3journal/advance-article/doi/10.1093/g3journal/jkab307/6360462 by guest on 09 October 2021
tion was allowed in inferred RoH. The following parameters were v0.4.10, and inbreedR (Stoffel et al. 2016; Tang et al. 2016; Wickham
used to define RoH while ensuring that the edges of RoH are 2016; Kassambara 2020; R Core Team 2020). The inbreeding esti-
delimited: a minimum of 25 contiguous homozygous SNPs (– mates FH, FGRM, and FRoH were compared with Pearson’s correla-
homozyg-snp 25), minimum SNP density of one SNP every 130 Kb tions using the corr.test in R (Schielzeth 2010; Kardos et al. 2018)
(–homozyg-density 130), a maximum distance between neighbor- using the three datasets described above. Differences in inbreed-
ing SNPs of 1 Mb (–homozyg-gap 1000), and a maximum of one ing between mainland and Stewart Island founders and descend-
heterozygous site (–homozyg-het 1). Allowing up to three hetero- ants were compared with FRoH using the lm linear regression
zygous sites (–homozyg-het 3), as suggested by Ceballos et al. function in R, since linear regression is robust to violations of the
(2018), did not impact the number of RoH found. In addition, the normality assumption (Knief and Forstmeier 2018).
sliding window required >25 SNPs (–homozyg-window-snp 25),
was defined as homozygous if it had a maximum of 1 heterozy-
gous site (–homozyg-window-het 1) and allowed no more than 5
Results
missing site calls (–homozyg-window-missing 5). We generated high-density genome-wide SNPs for 123 adult
To calculate individual autozygosity or inbreeding (FRoH), a ka ka
po
and 38 chicks from the 2016 breeding season using GBS
minimum length threshold of >1 Mb was required to qualify a with reference-based genotype calling. Processed raw reads were
RoH as homozygous in order to exclude RoH resulting from back- aligned to a high-quality reference genome, resulting in a mean
ground relatedness or with strong linkage disequilibrium, which mapping rate of 98.51%. Calling SNPs with the referenced-based
typically can extend into shorter regions of up to 100 Kb approach yielded 56,218 SNPs. After filtering for minimum and
(McQuillan et al. 2008; Purfield et al. 2012). FRoH is defined as, maximum depth, removing sex-linked markers and individuals
with high SNP call missingness, and excluding variants with
P
LRoH more than 20% missing data, 12,241 SNPs with a mean depth of
FRoH ¼
LAuto 9.82 and density of 84.03 kb/SNP remained. After applying KGD
filtering, a total of 11,782 SNPs with a mean depth of 9.55 were
P
where LRoH is the sum of the total length of all of an individu- used to construct the GRM for all individuals (diagonal elements
al’s RoH, and LAuto the autosomal genome length (1028.67 Mb in are shown in Supplementary Figure S2B). Autosomal SNPs were
ka
ka po
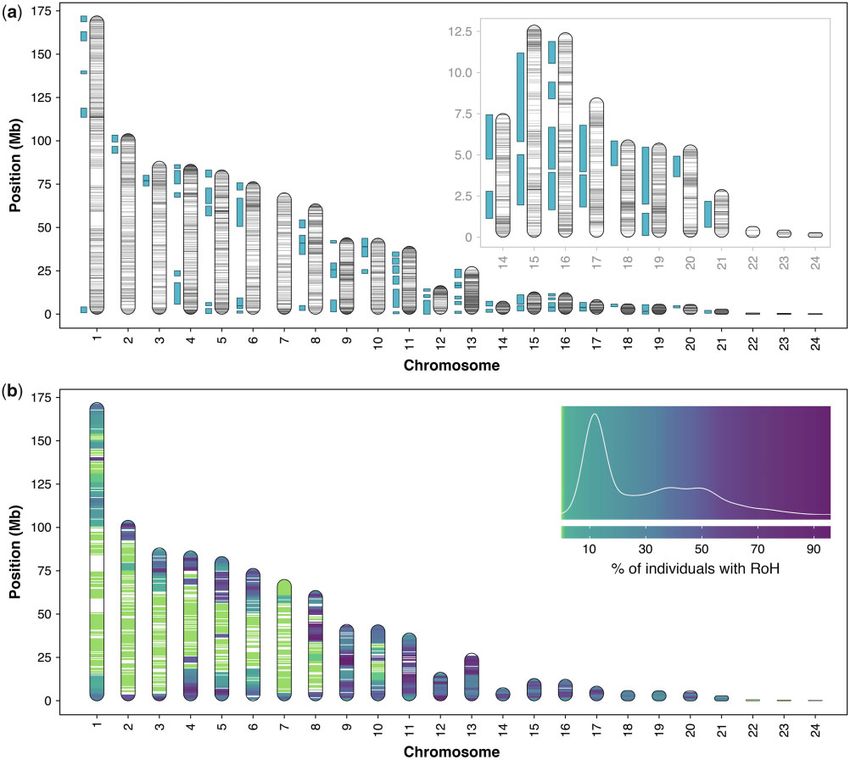
) (McQuillan et al. 2008). To compare alternative thresh- distributed across all chromosomes and concentrated toward the
olds, FRoH was additionally defined for long RoH >10 Mb (FRoH10). ends of the chromosomes (Figure 1A). Mean observed homozy-
The FRoH and FRoH10 estimates were compared between mainland gosity of the markers across all Stewart Island descendants was
and Stewart Island founders and descendants, and between de- 73.5%, and 62.8% for mainland descendants, and significantly dif-
ceased (n ¼ 9) and surviving chicks (n ¼ 25) from the 2016 breeding fered between descendant groups (P < 2.26 1011)
season. (Supplementary Figure S3). The PCA revealed no unexpected pop-
ulation structure; the mainland founder and its descendants sep-
Chick survivorship arated from the Stewart Island founders consistent with their
The inbreeding estimate FRoH was compared between deceased ancestry (Supplementary Figure S1).
and surviving chicks from the 2016 breeding season. We note, We compared multiple estimates of genome-wide inbreeding
however, that chicks were removed from this comparison if they among all ka ka
po
. First, ID using the metric g2 confirmed non-
were deceased from known nonbiological causes (n ¼ 4); e.g., zero variance (g2 ¼ 0.11 6 0.02 [SE], P ¼ 0.01; Supplementary
crushed eggs, chicks deceased after conflict or drowning after a Figure S4A), with a strong positive heterozygosity-heterozygosity
storm. The developmental stage was not considered, as age at correlation coefficient (r ¼ 0.989; Supplementary Figure S4B), indi-
death could not be resolved for all samples; thus, all samples are cating that the SNP markers meet the requirements to detect in-
referred to as chicks hereafter. Differences in inbreeding between breeding depression (Szulkin et al. 2010; Stoffel et al. 2016). Using
deceased (n ¼ 9) and surviving (n ¼ 25) chicks from the same the three subsets of data, we then compared the three inbreeding
breeding season were compared with FRoH using the lm linear re- estimates: FH, FRoH, and FGRM. For the total dataset including all
gression function in R (R Core Team 2020). A generalized linear individuals, the inbreeding coefficient FH was most strongly cor-
model (GLM) was performed using the glm function in R with a bi- related with FRoH (Pearson’s r ¼ 0.75, P < 2.2 1016; Figure 2A),
nomial distribution and logit link function, with fixed predictor and moderately but inversely correlated with FGRM (Pearson’s r ¼
variables of ancestry (mainland or Stewart Island) and inbreeding 0.68, P < 2.2 1016; Figure 2B). FRoH and FGRM were also mod-
(FRoH), and chick survivorship (dead or alive) as the response vari- erately but inversely correlated with each other (Pearson’s r ¼
able (e.g., survival ancestry þ FRoH), to evaluate if a relationship 0.55, P ¼ 3.9 1014; Figure 2C). For the dataset excluding the
between ancestry, FRoH and chick survival exists. mainland founder and his three offspring, the inbreeding coeffi-
cient FH remained most strongly correlated with FRoH (Pearson’s
Statistical analyses and visualization r ¼ 0.53, P < 7.8 1013; Figure 2D), and moderately correlated
To accurately measure the effects of inbreeding with SNPs, statis- with FGRM (Pearson’s r ¼ 0.44, P ¼ 9.8 109; Figure 2E).
tical power depends on the variation in inbreeding in a given However, FRoH and FGRM were only weakly correlated (Pearson’s r6 | G3, 2021, Vol. 0, No. 0
Downloaded from https://academic.oup.com/g3journal/advance-article/doi/10.1093/g3journal/jkab307/6360462 by guest on 09 October 2021
Figure 1 Autosomal chromosomes of the ka ka
po
reference genome illustrating distribution of single nucleotide polymorphisms (SNPs) and runs of
homozygosity (RoH) after reduced-representation sequencing. (A) 12,241 SNPs are represented across chromosomes (gray horizontal lines), and RoH
>1 Mb are represented adjacent to chromosomes (blue boxes) for an exemplary individual (Hillary) exhibiting excess homozygosity. Inset box displays a
zoomed view of the last 11 micro-chromosomes. (B) RoH prevalence across the ka ka
po
genome among all individuals (n ¼ 161) in nonoverlapping 500 Kb
windows, with density plot representing a color gradient scaled to prevalence distribution of RoH.
¼ 0.27, P ¼ 5.3 104; Figure 2F). For the dataset containing no were found across the genome up to and including chromosome
mainland founder or descendants, the inbreeding coefficient FH 21 (Figure 1B; Supplementary Figure S8A). No RoH were detected
was moderately correlated with FRoH (Pearson’s r ¼ 0.36, P < 7.7 on the remaining microchromosomes, perhaps because they are
106; Supplementary Figure S5A) but no correlations were found too short for RoH >1 Mb to accumulate or because the recombi-
between FH and FGRM (Pearson’s r ¼ 0.092, P ¼ 0.26; nation rate is too high (Figure 1, A and B). In most ka ka
po
, some
Supplementary Figure S5B), or FRoH and FGRM (Pearson’s r ¼ 0.09, chromosomes were almost completely covered with RoH (e.g.,
P ¼ 0.27; Supplementary Figure S5C). For all ka ka
po
, the mean FH chromosome 11, 15, and 19 for male ka ka
po
Hillary; Figure 1A).
was 0.09, mean FGRM was 0.04, and mean FRoH was 0.18 Scanning for RoH that were >1 Mb in length containing at least
(Supplementary Figure S6, A–C). When the Stewart Island and 25 SNPs found a total of 9,372 RoH across all individuals, among
mainland descendants were considered separately (within the to- which shorter segments between 1 and 5 Mb predominated
tal dataset), the Stewart Island mean FH was 0.15, mean FGRM was (Figure 3B). The mean number of RoH per individual was 56.49
0.03, and mean FRoH was 0.19 (Supplementary Figure S7, A–C). and mean length of RoH was 185.55 Mb. When considered by de-
For the mainland descendants, mean FH was 0.77, mean FGRM scendant groups, the Stewart Island individuals had a mean
was 1.07, and mean FRoH was 0.08 (Supplementary Figure S7, number of 58.30 RoH and mean length of 192.50 Mb (16.46% of ge-
A–C). nome in RoH), and the mainland descendants had a mean num-
Inbreeding was estimated among ka ka
po
descendant groups ber of 29.20 RoH and mean length of 80.63 Mb (6.92% of genome
using RoH along the autosomal genome (Figure 1, A and B). RoH in RoH) (Supplementary Figure S8, B and C). We additionallyY. Foster et al. | 7
Downloaded from https://academic.oup.com/g3journal/advance-article/doi/10.1093/g3journal/jkab307/6360462 by guest on 09 October 2021
Figure 2 Correlations between inbreeding estimates for all ka ka
po
(n ¼ 161): (A) FH and FRoH, (B) FH and FGRM, and (C) FRoH and FGRM. Pearson’s r- and P-
values are above each plot. Blue points represent Stewart Island-only descendants and red points represent mainland descendants. Correlations
ka
between inbreeding estimates for all ka po
except for the sole mainland founder and his three only offspring (n ¼ 157): (D) FH and FRoH, (E) FH and FGRM,
and (F) FRoH and FGRM.
divided RoH into size categories indicative of the probable timing descending grand-chicks (F2) had no RoH >10 Mb. Notably, de-
of their formation (McQuillan et al. 2008; Kirin et al. 2010). Of 9,372 spite the absence of a difference in FRoH between surviving and
RoH >1 Mb, 7,995 RoH were between the length of 15 Mb (85% of deceased chicks, the single mainland descendant chick that had
RoH, 1050 generations), 991 RoH between the length of two RoH >10 Mb was an early-death embryo. Furthermore, one
510 Mb (11% of RoH, 510 generations), and 385 RoH >10 Mb chick suspected of dwarfism also had the highest value of FRoH
(4% of RoH, 5 generations) (Figure 3B) (Howrigan et al. 2011; Xu out of all deceased chicks (Figure 4). Comparing the two different
et al. 2019). For inbreeding estimated from RoH >1 Mb, the mean ancestral groups, chicks descending from Stewart Island individ-
FRoH for Stewart Island descendants was 0.19 and 0.08 for main- uals had a mean number of 58.82 RoH with a mean length of
land descendants (Figure 3A; Supplementary Figure S7C). For in- 192.1 Mb, and chicks descending from mainland individuals (F2)
breeding estimated from RoH >10 Mb, which are associated with had a reduced mean number of 41.50 RoH and shorter mean
recent inbreeding events, the mean FRoH_10 for Stewart Island was length of 118.22 Mb. The number of RoH (P ¼ 6.25e-07) and length
0.03, and for the mainland descendants was 0.002 since all but of RoH (P ¼ 3.32e-08) per individual significantly differed between
one individual had no RoH >10 Mb (Supplementary Figure S7D). Stewart Island and mainland descendant chicks. FRoH (P ¼ 3.39e-
In addition, a linear regression showed a significant difference be- 08; Figure 4) and FRoH10 (P ¼ 0.006) were both significantly differ-
tween the FRoH of mainland and Stewart Island descendants ent between Stewart Island and mainland descending chicks.
(P < 2 1016) (Figure 3A).
We used FRoH to compare inbreeding between deceased (n ¼ 9)
and surviving (n ¼ 25) chicks from the 2016 breeding season.
Discussion
Deceased chicks had a mean number of 55.33 RoH with a mean Reduced-representation sequencing across the genome (e.g., GBS)
length of 175.75 Mb (15.08% of genome in RoH), and surviving is a cost-effective approach to evaluate inbreeding in populations
chicks had a mean number of 55.92 RoH with a mean length of under conservation management (Narum et al. 2013; Andrews
180.26 Mb (15.46% of genome in RoH). The number of RoH did not et al. 2016). Here, we used multiple genome-wide estimates to ex-
significantly differ between deceased and surviving chicks amine patterns of inbreeding in the ka ka
po , as pedigree-based
(P ¼ 0.87) or between length of RoH (P ¼ 0.75). There was no signif- methods are limited by depth (generations) and statistical power,
icant relationship between chick survival and their FRoH (P ¼ 0.76) and cannot accurately predict what proportion of the genome is
or FRoH10 (P ¼ 0.46; Figure 4). In addition, a GLM indicated that IBD ( Kalinowski and Hedrick 1999; Keller et al. 2011; Forstmeier
there were no significant effects of ancestry or FRoH on chick sur- et al. 2012; Kardos et al. 2015a). Genome-wide inbreeding esti-
vivorship (Supplementary Table S1). Similar to the mainland mates are particularly advantageous for ka ka po
since pedigree
founder (Richard-Henry) and his three offspring, all but one of his information is incomplete for the founders of the current8 | G3, 2021, Vol. 0, No. 0
Downloaded from https://academic.oup.com/g3journal/advance-article/doi/10.1093/g3journal/jkab307/6360462 by guest on 09 October 2021
Figure 4 Distribution of individual autozygosity (FRoH) between surviving
and deceased ka ka
po
chicks using runs of homozygosity (RoH) >1 Mb.
Blue points represent Stewart Island-only chicks, red points represent
mainland chicks, and the yellow point represents a chick with suspected
dwarfism.
genome with low nucleotide diversity and recombination, and in
regions subject to strong purifying selection (Pemberton et al.
2012; Curik et al. 2014; Kardos et al. 2017; Ceballos et al. 2018).
High rates of recombination break up haplotype blocks to gener-
ate increasingly shorter tracts of homozygosity, whereby shorter
RoH are indicative of background relatedness or inbreeding aris-
ing from distant common ancestry, and long RoH are signatures
of recent parental relatedness or occur in regions with low rates
of recombination (McQuillan et al. 2008; Pemberton et al. 2012).
The majority (85%) of RoH in ka ka
po ranged between 1 and 5 Mb
(Figure 3B), suggesting that the excess homozygosity observed in
the modern population originates from both inbreeding experi-
enced by distant common ancestors and resulting background re-
latedness of recent generations (Pemberton et al. 2012; Kardos
et al. 2015a). The distribution of RoH on chromosomes of ka ka
po
is consistent with the concentrated distribution of SNPs toward
chromosome ends (Figure 1B), where shorter RoH are known to
occur in regions of high recombination (Pemberton et al. 2012).
Estimates of FRoH based on long RoH (i.e., >10 Mb) may be more
ka
Figure 3 Distribution of individual autozygosity for all ka po
using runs powerful for detecting inbreeding depression (Kardos et al. 2015a),
of homozygosity (RoH) >1 Mb (n ¼ 161): (A) Boxplots comparing FRoH but their ascertainment from reduced-representation sequencing
between Stewart Island and mainland descendants. (B) Mean number of may be impacted by insufficient numbers of SNPs within certain
RoH for each length category. Error bars represent standard error. Blue
points and bars represent Stewart Island-only descendants, and red genomic regions (i.e., by long RoH being broken up into short
points and bars represent mainland descendants. RoH). A limited number of long RoH were found in ka ka
po
using
this approach (Figure 3B). The complete genomic architecture of
inbreeding in ka ka
po
may be further resolved with comparisons
population, whose relationship and age are unknown, and who using whole-genomes and corresponding mutational load, as
descend from two distinct ancestral populations (Bergner et al. well as identifying RoH deserts and islands (i.e., hotspots)
2016; Dussex et al. 2018, 2021). A total of 12,241 high-quality fil- (Pemberton et al. 2012; Curik et al. 2014). Indeed, using historical
tered SNPs were found in the dataset, which contained the ma- ka ka
po
genomes, Dussex et al. (2021) found an 8.5-fold increase
jority of adults (n ¼ 123) and chicks from the 2016 breeding in FRoH (>2 Mb) in a subset of the extant Stewart Island popula-
season (n ¼ 38), representing virtually the total managed ka ka
po tion compared to the extinct mainland population (including
population up until 2018. Richard-Henry).
SNPs were distributed across the ka ka po
genome and were Estimates of individual inbreeding levels remained correlated
concentrated toward the ends of chromosomes (Figure 1A), con- across the datasets containing all ka ka po
(Figure 2, A–C) and with
sistent with known patterns of recombination within bird the mainland founder and his three offspring excluded (Figure 2,
genomes (Backström et al. 2010; Ellegren 2010; Murray et al. 2017). D–F). However, when all individuals with mainland ancestry
Signatures of inbreeding were highly conspicuous across the ge- were excluded, only FH and FRoH remained correlated with each
nome, with entire micro-chromosomes almost completely cov- other (Supplementary Figure S5A), revealing that the majority of
ered with RoH in some individuals (e.g., chromosomes 11, 15, and variation in inbreeding levels in ka ka
po is driven by differences
19; Figure 1, A and B), reflecting extreme levels of homozygosity between the two divergent founding populations. The weakest
previously found in ka ka
po
(Dussex et al. 2021). Comparable lev- correlations between inbreeding estimates invariably involved
els of homozygosity are found in a highly inbred Scandanavian GRM methods (FGRM), which use estimated population allele fre-
gray wolf population in which entire chromosomes are quencies and are highly influenced by what initial population is
completely autozygous (Kardos et al. 2018). In Ficedula flycatchers, provided (e.g., Figure 2, C and F). This method may not be appro-
humans, and livestock, RoH are more abundant in regions of the priate for ka ka
po considering the extreme subdivision betweenY. Foster et al. | 9
mainland and Stewart Island founders, with additional ascertain- Willis 2009). Specifically, it was expected that mainland-
ment bias due to having only one mainland founder. Indeed, pre- descending chicks, which have mixed ancestry and lower levels
vious studies have found that inbreeding estimates from RoH are of inbreeding, would exhibit greater survivorship compared to
more accurate for smaller populations (low Ne), as GRM-based chicks descending from Stewart Island ancestry only. Inbreeding
approaches give too much weight to rare alleles causing biases was strongly associated with ancestry but did not have an effect
when there are subdivided populations and admixture between on chick survival (Figure 4), with neither inbreeding (FRoH) nor an-
individuals with diverse allele frequencies (Nietlisbach et al. 2019; cestry predicting survivorship (Supplementary Table S1). This
Alemu et al. 2021; Caballero et al. 2021). In ka ka
po
, weighting of pattern was driven by mortality in chicks descended from main-
rare alleles results in greater FGRM values for mainland descend- land ancestry, despite mainland descendants exhibiting the low-
Downloaded from https://academic.oup.com/g3journal/advance-article/doi/10.1093/g3journal/jkab307/6360462 by guest on 09 October 2021
ants because of their homozygosity for rare alleles, whereas est levels of inbreeding in the population, as well as mortality in
Stewart Island descendants are homozygous for common alleles Stewart Island chicks exhibiting both high and moderate levels of
(VanRaden 2008). inbreeding. Dussex et al. (2021) recently found that mainland
The inbreeding coefficient FH was significantly correlated with ka ka
po
had a higher mutational load than individuals from
FRoH (Figure 2, A and D; Supplementary Figure S5A), suggesting Stewart Island, suggesting that deleterious alleles may have been
that high-quality GBS datasets contain sufficient signal to esti- removed from the Stewart Island population through a combina-
mate genomic IBD in the absence of whole-genome data tion of genetic drift and purging. Limited evidence for inbreeding
(Allendorf et al. 2010). Kardos et al. (2018) found that FRoH mea- depression in our study may potentially also be explained by the
sured from the whole genomes of gray wolves were strongly cor- dynamics of purging and alleviation of some of the effects of in-
related with FRoH estimated from as few as 10,000 randomly breeding. We note, however, that detection of inbreeding depres-
subsampled SNPs across the genome (r2 ¼ 0.97); comparable rec- sion using comparisons of offspring survivorship (and other
ommendations are given by Allendorf et al. (2010: 10,000 SNPs) fitness traits) in critically endangered species are often limited by
and Gervais et al. (2019: 7,000 SNPs). Negative FH values result statistical power and sample size. Further evidence should be
from excess heterozygosity relative to Hardy-Weinberg propor- obtained using ka ka
po
chicks from subsequent breeding seasons.
tions and indicate that parents are, on average, less closely re- Current management strategies to mitigate inbreeding in
lated than expected under random mating (Keller and Waller ka ka
po
include the prevention of consanguineous matings, re-
2002; Kardos et al. 2016, Box 2). FH values in ka ka
po were more moval of infertile or overly successful males from breeding islands,
negative for the mainland founder (Richard-Henry) and its and favoring matings with mainland descendants (Elliott et al.
descendants than for Stewart Island descendants 2001; Robertson 2006; Bergner et al. 2014). Full-sibling and
(Supplementary Figure S7A), indicating that individuals with parental-offspring matings already naturally occur due to dispro-
mainland ancestry are relatively more outbred within the extant portionately successful males and the lek mating system of
population. Both FH and FRoH similarly reflected elevated levels of ka ka
po
(Eason et al. 2006; Bergner et al. 2014). For instance, one
inbreeding in Stewart Island descendants (Supplementary Figure male ka ka
po
(Blades) from the Stewart Island founding population
S7, A and C), and overall, FRoH estimates were elevated (maxi- has fathered 22 chicks (of which 18 survived), and between 1991
mum FRoH 0.248) compared to those estimated from RADseq data and 1999 another male founder (Felix) fathered 7 of a total 13
of the vulnerable New Zealand hihi (maximum FRoH 0.158) chicks (Miller et al. 2003; Eason et al. 2006). Current strategies that
(Duntsch et al. 2021). Mainland and Stewart Island descendants favor matings between mainland and Stewart Island descendants
differed significantly in their values of FRoH, with mainland could have unforeseen consequences for population viability. For
descendants possessing shorter and fewer RoH. Mainland example, the introduction of a single immigrant male to the Isle
descendants also had a lower number of RoH longer than 10 Mb, Royale wolf population initially appeared advantageous but ulti-
indicating that less significant inbreeding had occurred recently mately did not mitigate intensive inbreeding depression and now
in the ancestral population (Figure 3, A and B). Studies examining its imminent extinction, highlighting how deleterious mutations
founder-specific inbreeding depression suggest that the magni- hidden in a large outbred population can be detrimental once in-
tude of eventual inbreeding depression is influenced significantly troduced to a smaller inbred population (Hedrick et al. 2014, 2019).
by initial relatedness levels in the population, amounts of intro- Although genetic rescue is an appropriate strategy for inbred
gression, and variation among founders that exists due to the species when alternate populations are available for acquiring
segregation of large-effect deleterious recessive alleles (Lacy et al. genetic diversity (Ralls et al. 2020), source populations carrying a
1996; Allendorf et al. 2010). For example, heightened inbreeding low risk of causing outbreeding depression no longer exist in
depression in the Hawaiian crow (‘Alala ) was found to originate many endangered species (Kyriazis et al. 2021). In ka ka
po
, the
from a single pair that initially founded the captive breeding pop- consequences of introducing potentially harmful mutations from
ulation (Hedrick et al. 2016). Signatures of inbreeding in ka ka
po
the single mainland descendant (Richard-Henry) into the recov-
suggest that founder-specific effects are ongoing, with inbreeding ering extant population (Dussex et al. 2021), which has remained
estimates in descendants of two distinct ancestral populations consistently small enough for purging to take place (Robinson
remaining consistent across multiple generations. Furthermore, et al. 2019; Hoffmann et al. 2021), potentially challenges the bene-
founder-specific effects are likely to increase in magnitude due to fits of genetic rescue within ka ka
po
conservation management.
the extended lifespan, long generation time, and lek mating sys- Specifically, increases in homozygosity could have exposed dele-
tem of ka ka
po
, where certain individuals from the founding pop- terious large-effect alleles to selection, thereby removing them
ulation continue to contribute disproportionately to matings. from the Stewart Island population and reducing the impact of
Genetic rescue aims to increase fitness in endangered popula- inbreeding on fitness (Hedrick 1994; Wang et al. 1999; Keller and
tions through the introduction of unrelated individuals, with Waller 2002); although weakly deleterious alleles might still im-
demonstrated success in numerous species (Whiteley et al. 2015; pact individual fitness (i.e., genetic load) (Grossen et al. 2020;
Bell et al. 2019). Under this paradigm, we expected that offspring Mathur and DeWoody 2021). A study on the Chatham Island
with lower levels of inbreeding would exhibit signs of increased black robin, for example, revealed improved fledging success for
fitness as a result of heterosis or hybrid vigor (Charlesworth and chicks from highly inbred mothers (Weiser et al. 2016), suggesting10 | G3, 2021, Vol. 0, No. 0
that purging of some of the mutational load may have occurred. corresponding results are available on figshare at https://doi.org/10.
We recommend that ongoing conservation management in 6084/m9.figshare.15113106. Scripts are available from https://
ka
ka po
should focus on detecting individuals exhibiting inbreed- github.com/yasfoster/kakapo_gbs and https://github.com/
ing depression and monitoring the effects of mainland ancestry AgResearch/KGD. Supplementary material is available on figshare:
on the population (e.g., F3 hybrids between mainland and https://doi.org/10.25387/g3.14626371.
Stewart Island). Outcomes of strategies such as translocations
and artificial insemination may be improved if a greater empha-
sis is placed on the selection of individuals that carry desirable Acknowledgments
alleles for breeding (to minimize deleterious variation) rather
Downloaded from https://academic.oup.com/g3journal/advance-article/doi/10.1093/g3journal/jkab307/6360462 by guest on 09 October 2021
The authors are grateful to Nga i Tahu and the New Zealand
than individual relatedness alone (Kardos and Shafer 2018). Department of Conservation ka ka
po
Recovery Programme for the
Markers of homozygosity can be used to detect causal muta- management of ka ka
po
and collection of samples, with particu-
tions associated with malformations and disease (Kardos et al. lar thanks to Daryl Eason. They thank Andrew Veale for guidance
2016). In the California condor, the mutation underlying chondro-
during the initial stages of this research, and Benedikt Holtmann
dystrophy, a lethal form of dwarfism, is yet to be identified.
for statistical advice. The authors wish to acknowledge the use of
However, traditional pedigree analysis indicates that an autoso-
New Zealand eScience Infrastructure (NeSI) high performance
mal recessive allele is likely to be responsible (Ralls et al. 2000). In
computing facilities, consulting support, and training services as
ka ka
po
from the 2016 breeding season, an individual with signs
part of this research, with particular thanks to Albert Savary and
of chondrodystrophy possessed the highest FRoH value of all de-
Dinindu Senanayake.
ceased chicks (Figure 4). Mapping approaches based on RoH offer
new avenues to discover loci contributing to inbreeding depres-
sion and recessive monogenic diseases (Kijas 2013; Ceballos et al. Funding
2018). High-density SNP markers capable of reliably defining RoH
New Zealand’s national facilities are provided by NeSI and
may yield new candidate loci for malformations in inbred popu-
funded jointly by NeSI’s collaborator institutions and through the
lations, such as chondrodystrophy in the Californian condor and
ka
po
, and vertebral defects in Isle Royale wolves (Robinson Ministry of Business, Innovation and Employment (MBIE) re-
ka
search infrastructure programme. This project was also sup-
et al. 2019). Deleterious alleles in genes associated with immunity
may also be subject to purging (e.g., toll-like receptors, Nelson- ported by the MBIE via its funding of the “Genomics for
Flower et al. 2018), and should be considered in subsequent ho- Production & Security in a Biological Economy” programme
mozygosity mapping in ka ka
po
. Future investigations into dis- (Contract ID C10X1306). Funding was provided by the Royal
eases affecting ka ka
po
(e.g., cloacitis, aspergillosis) should also Society of New Zealand’s Marsden Fund project “Resolving the
incorporate homozygosity mapping and targeted-gene genomic architecture of hatching failure to improve conservation
approaches to identify susceptible individuals and minimize their of endangered birds” (Contract ID UOO1817) and a University of
exposure to sources of transmission. Otago Performance-Based Research Fund (PBRF) grant, both to
GBS provided congruent estimates of inbreeding across the B.C.R. N.D. was supported by the Swiss National Science
ka ka
po
genome based on relative (FH) and absolute measures of Foundation (P2SKP3_165031 and P300PA_177845) and the Carl
autozygosity (FRoH). Future studies should compare estimates of Tryggers Foundation (CTS 19:257). Y.F. was supported by a
inbreeding with additional quantitative phenotypic traits (e.g., University of Otago Doctoral Scholarship.
clutch size and birth weight) to further evaluate evidence for in-
breeding depression in ka ka
po (Hoffman et al. 2014; Bérénos et al.
2016; Huisman et al. 2016). Inbreeding estimates can also be in-
Conflicts of interest
corporated into a number of other methods, including analysis The authors declare that there is no conflict of interest.
of: linkage disequilibrium (Bersabé et al. 2015; Humble et al. 2018),
haplotype inference (Leitwein et al. 2020), selective sweeps
(Kardos et al. 2015b, 2017; Qanbari et al. 2019), homozygous dele-
Author contributions
terious genotype enrichment (Szpiech et al. 2019), inbreeding- Y.F., B.C.R., J.C.M., and J.J. conceived this study. B.C.R. and F.R. for
related patterns of DNA methylation (von Holdt et al. 2017), and collection and management of samples. F.R., B.C.R., T.V.S., K.D.,
nucleotide diversity (p) for estimating adaptive potential (Dutoit and R.B. conducted laboratory work and generation of data. Y.F.,
et al. 2017; de Villemereuil et al. 2019; Mable 2019). As whole- L.D., N.D., S.G., K.D., and R.B. for bioinformatic and statistical
genome resequencing data becomes available for ka ka
po
, the dy- support. Y.F., L.D., S.G., B.J.F., and K.D. for data analyses and in-
namics between inbreeding depression (White et al. 2015) and the terpretation. Y.F. wrote the main body of the manuscript, while
reduction of deleterious alleles through purging or drift (Dussex all authors contributed to improving the manuscript.
et al. 2021) should be further evaluated. Furthermore, resulting
inferences should be compared with the present study to assess
the computational- and cost- burden of whole-genome sequenc- Literature cited
ing (Kardos and Shafer 2018). Measures of homozygosity and
Ahrens CW, Jordan R, Bragg J, Harrison PA, Hopley T, et al. 2021.
autozygosity offer critical insight into the consequences of in-
Regarding the F-word: the effects of data filtering on inferred
breeding in endangered populations, with important implications
genotype-environment associations. Mol Ecol Resour. 21:
for conservation management.
1460–1415. doi:10.1111/1755-0998.13351.
Alemu SW, Kadri NK, Harland C, Faux P, Charlier C, et al. 2021. An eval-
Data availability uation of inbreeding measures using a whole-genome sequenced
Genome assembly available from BioProject ID: PRJNA489135, NCBI cattle pedigree. Heredity. 126:410–423. doi:10.1038/s414
assembly: GCA_004027225.1. Genotype data (VCF files) and 37-020-00383-9.You can also read