Archaeal intact polar lipids in polar waters: a comparison between the Amundsen and Scotia seas - Biogeosciences
←
→
Page content transcription
If your browser does not render page correctly, please read the page content below
Biogeosciences, 18, 3485–3504, 2021
https://doi.org/10.5194/bg-18-3485-2021
© Author(s) 2021. This work is distributed under
the Creative Commons Attribution 4.0 License.

Archaeal intact polar lipids in polar waters: a comparison
between the Amundsen and Scotia seas
Charlotte L. Spencer-Jones1 , Erin L. McClymont1 , Nicole J. Bale2 , Ellen C. Hopmans2 , Stefan Schouten2,3 ,
Juliane Müller4 , E. Povl Abrahamsen5 , Claire Allen5 , Torsten Bickert6 , Claus-Dieter Hillenbrand5 , Elaine Mawbey5 ,
Victoria Peck5 , Aleksandra Svalova7 , and James A. Smith5
1 Department  of Geography, Durham University, Lower Mountjoy, South Road, Durham, DH1 3LE, UK
2 NIOZ   Royal Netherlands Institute for Sea Research, Department of Marine Microbiology and Biogeochemistry,
P.O. Box 59, 1790 AB Den Burg, Texel, the Netherlands
3 Department of Earth Sciences, Utrecht University, Utrecht, the Netherlands
4 Alfred Wegener Institute, Helmholtz Centre for Polar and Marine Research, 27568 Bremerhaven, Germany
5 British Antarctic Survey, High Cross, Madingley Road, Cambridge, CB3 0ET, UK
6 MARUM – Center for Marine Environmental Sciences, University of Bremen, Leobener Str. 8, 28359, Bremen, Germany
7 School of Natural and Environmental Sciences, Newcastle University, Newcastle-upon-Tyne, NE1 7RU, UK

Correspondence: Charlotte L. Spencer-Jones (charlotte.spencer-jones@open.ac.uk)

Received: 7 September 2020 – Discussion started: 5 November 2020
Revised: 3 March 2021 – Accepted: 23 March 2021 – Published: 11 June 2021

Abstract. The West Antarctic Ice Sheet (WAIS) is one of             compassing the sub-Antarctic front through to the southern
the largest potential sources of future sea-level rise, with        boundary of the Antarctic Circumpolar Current. IPL-GDGTs
glaciers draining the WAIS thinning at an accelerating rate         with low cyclic diversity were detected throughout the water
over the past 40 years. Due to complexities in calibrating          column with high relative abundances of hydroxylated IPL-
palaeoceanographic proxies for the Southern Ocean, it re-           GDGTs identified in both the Amundsen and Scotia seas.
mains difficult to assess whether similar changes have oc-          Results from the Scotia Sea show shifts in IPL-GDGT sig-
curred earlier during the Holocene or whether there is under-       natures across well-defined fronts of the Southern Ocean. In-
lying centennial- to millennial-scale forcing in oceanic vari-      dicating that the physicochemical parameters of these wa-
ability. Archaeal lipid-based proxies, specifically glycerol di-    ter masses determine changes in IPL-GDGT distributions.
alkyl glycerol tetraether (GDGT; e.g. TEX86 and TEXL        86 ),   The Amundsen Sea results identified GDGTs with hexose-
are powerful tools for reconstructing ocean temperature, but        phosphohexose head groups in the CDW, suggesting active
these proxies have been shown previously to be difficult to         GDGT synthesis at these depths. These results suggest that
apply to the Southern Ocean. A greater understanding of the         GDGTs synthesised at CDW depths may be a significant
parameters that control Southern Ocean GDGT distributions           source of GDGTs exported to the sedimentary record and
would improve the application of these biomarker proxies            that temperature reconstructions based on TEX86 or TEXL    86
and thus help provide a longer-term perspective on ocean            proxies may be significantly influenced by the warmer waters
forcing of Antarctic ice sheet changes. In this study, we char-     of the CDW.
acterised intact polar lipid (IPL)-GDGTs, representing (re-
cently) living archaeal populations in suspended particulate
matter (SPM) from the Amundsen Sea and the Scotia Sea.
SPM samples from the Amundsen Sea were collected from
up to four water column depths representing the surface wa-
ters through to Circumpolar Deep Water (CDW), whereas
the Scotia Sea samples were collected along a transect en-

Published by Copernicus Publications on behalf of the European Geosciences Union.
3486                                                 C. L. Spencer-Jones et al.: Archaeal intact polar lipids in polar waters

1   Introduction                                                  group is relatively rapidly cleaved off, resulting in the preser-
                                                                  vation of the core GDGT lipid (c-GDGTs). c-GDGTs are
Over the past ca. 50 years the West Antarctic Ice Sheet           subsequently preserved in the sedimentary record and can
(WAIS) has lost ice mass at an accelerating rate, with some       be used to reconstruct Antarctic palaeoenvironmental change
suggesting that the complete collapse of the WAIS may al-         over long timescales (Kim et al., 2012; Shevenell et al., 2011;
ready be underway (Joughin et al., 2014; Mouginot et al.,         Etourneau et al., 2013, 2019). Thaumarchaeota are a ma-
2014; Rignot et al., 2019). The WAIS is grounded below            jor source of GDGTs to the environment with pure culture
sea level, and the edges of the ice sheet are floating ice        studies detecting GDGTs with 0–3 cyclopentane moieties,
shelves that are highly sensitive to changes in ocean prop-       crenarchaeol (cren, which contains four cyclopentane moi-
erties. Widespread ice sheet/shelf thinning will likely have      eties and a cyclohexane moiety), and the cren regioisomer
influence on biogeochemical cycling through ocean produc-         (cren0 , Schouten et al., 2000; Sinninghe Damsté et al., 2018).
tivity (Raiswell et al., 2008; Menviel et al., 2010; Wadham et    Other archaeal phyla (e.g. marine Euryarchaeota group II)
al., 2013), carbon reservoirs, and carbon sequestration (Yager    have been hypothesised as sources of GDGTs to the marine
et al., 2012; Wadham et al., 2019), in addition to sea ice and    realm (Lincoln et al., 2014a, b); however, this source is un-
ocean circulation changes (Menviel et al., 2010).                 likely to be significant in marine samples (Schouten et al.,
   One of the challenges in understanding and predicting the      2014; Zeng et al., 2019; Besseling et al., 2020). Furthermore,
behaviour of WAIS is a lack of long-term ocean temper-            archaea exist throughout the marine water column, with sev-
ature records (i.e. prior to the satellite era ∼ 1992). Such      eral studies suggesting a GDGT contribution to sediments
records are needed to better understand the links between         from deep water Thaumarchaeota (e.g. Ingalls et al., 2006;
WAIS stability, physical properties of the Southern Ocean,        Shah et al., 2008; Kim et al., 2016).
and biogeochemistry which might vary on centennial to mil-           IPL-GDGTs may be used as proxies for tracing (recently)
lennial timescales (Smith et al., 2017; Hillenbrand et al.,       living archaeal populations (e.g. Pitcher et al., 2011; Sin-
2017). Organic geochemical proxies based on the ratios of ar-     ninghe Damsté et al., 2012; Elling et al., 2014, 2017).
chaeal membrane lipids can be used to reconstruct past ocean      AOA enrichment cultures reveal three common GDGT head
temperature and biogeochemistry. Glycerol dialkyl glycerol        groups – monohexose (MH), dihexose (DH), and hexose-
tetraether (GDGT) lipids are particularly promising, with the     phosphohexose (HPH) (Schouten et al., 2008; Pitcher et al.,
TEX86 , TEXL   86 , and OH-GDGT proxies having been widely        2010, 2011) – with all three IPL head groups reported in en-
used to reconstruct ocean temperatures in tropical, temperate,    vironmental samples (Lipp et al., 2008; Lipp and Hinrichs,
and northern polar regions (e.g. Jenkyns et al., 2004; Huguet     2009; Schubotz et al., 2009; Schouten et al., 2012; Xie et al.,
et al., 2006, 2011; Sinninghe Damsté et al., 2010; Darfeuil       2014; Evans et al., 2017; Sollich et al., 2017; Besseling et al.,
et al., 2016). In contrast, only a handful of studies have suc-   2018). HPHs are a common IPL in all AOA enrichment cul-
cessfully applied these proxies in the Southern Ocean (Kim        tures to date, with MH and DH intermittently present (Pitcher
et al., 2012; Shevenell et al., 2011; Etourneau et al., 2013,     et al., 2011; Elling et al., 2017; Bale et al., 2019). The in-
2019). This reflects a combination of low concentrations of       terpretation of IPL-GDGTs as proxies for living archaeal
GDGTs with an incomplete understanding of archaeal pop-           biomass is complicated by their degradation to c-GDGTs
ulations and habitat/niche preference (Kim et al., 2010). A       with increasing evidence that some IPLs are preserved fol-
better understanding of the source of GDGTs in the South-         lowing cell death (Bauersachs et al., 2010; Huguet et al.,
ern Ocean and factors that impact archaeal populations could      2010; Schouten et al., 2010; Xie et al., 2013; Lengger et al.,
improve application of TEX86 -based proxies in this environ-      2014). Kinetic modelling has suggested greater preservation
ment.                                                             of glycolipids compared with phospholipids (Schouten et al.,
                                                                  2010), therefore suggesting that HPH-GDGTs may have po-
Tracing archaea with intact polar lipids                          tential as biomarkers for living, metabolically active thau-
                                                                  marchaeotal populations (Schouten et al., 2012; Elling et al.,
Archaea are a key component of picoplankton within the            2014, 2017). However, HPH-GDGT abundance is variable
polar oceans (Delong et al., 1994; Murray et al., 1998;           across the I.1a Thaumarchaeota clade, which could make
Church et al., 2003; Kirchman et al., 2007; Alonso-Saez           the interpretation of this biomarker in environmental stud-
et al., 2008) and have an important role in biogeochemi-          ies complex (Elling et al., 2017). DH-GDGTs and DH-OH-
cal cycling and in marine food webs. GDGTs are impor-             GDGT on the other hand are thought to be produced exclu-
tant cell membrane components present in many marine ar-          sively by I.1a Thaumarchaeota with more uniform abundance
chaea (Schouten et al., 2013a, and references therein), in-       across the clade (Pitcher et al., 2011; Sinninghe Damsté et
cluding the ammonia oxidising archaea (AOA) Thaumar-              al., 2012) and could therefore be potential tracers for living
chaeota (previously assigned to the phylum Crenarchaeota;         Thaumarchaeota (Elling et al., 2017).
Brochier-Armanet et al., 2008; Spang et al., 2010). Marine           In this study, we present the first characterisation of IPL-
archaea produce isoprenoid GDGTs with a polar head group          GDGTs in suspended particulate matter (SPM) from two
(intact polar lipids – IPLs). Upon cell death the polar head      locations in the Southern Ocean, the Scotia Sea and the

Biogeosciences, 18, 3485–3504, 2021                                                  https://doi.org/10.5194/bg-18-3485-2021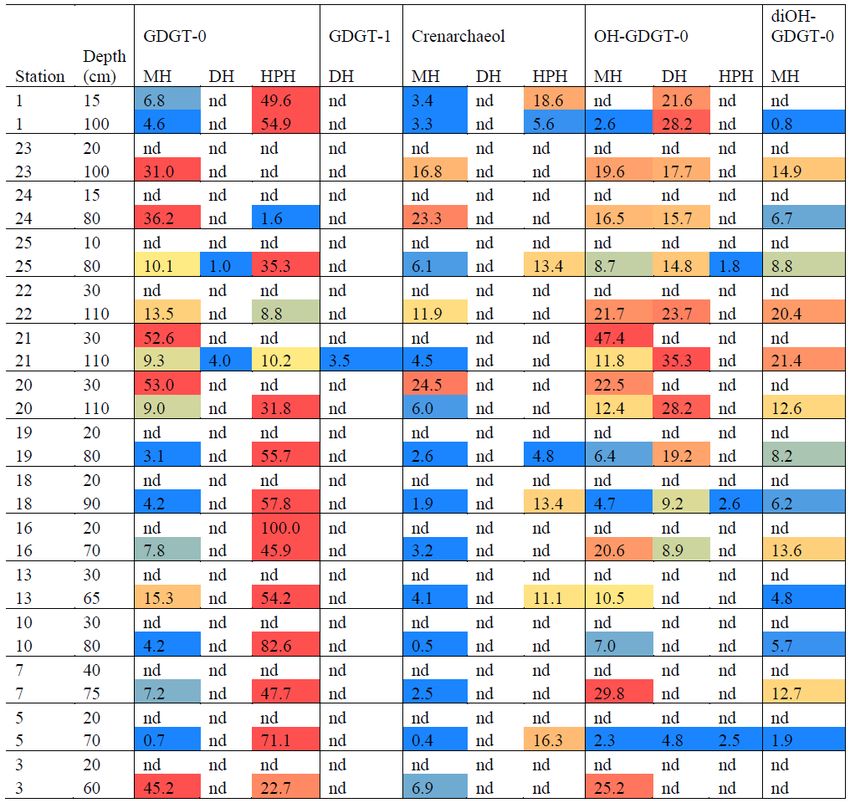
C. L. Spencer-Jones et al.: Archaeal intact polar lipids in polar waters                                                      3487

Amundsen Sea. The first aim of this study is to characterise        1995), is upwelled at the continental slope, and can pro-
the distributions of IPL-GDGTs within the Southern Ocean            trude onto the shelf where it mixes with shelf waters cooled
in order to expand our understanding of thaumarchaeotal dis-        by interactions with the ice shelves and atmosphere (some-
tributions in polar regions and improve our interpretation of       times below the surface freezing point), renewing LCDW
GDGT-based proxies. The second aim of this study is to un-          and forming Antarctic Bottom Water (AABW) (Carter et al.,
derstand the environmental controls on IPL-GDGT distribu-           2009, and references therein).
tions in the Southern Ocean. In this study, we analyse the wa-         The Scotia Sea is located in the eastern Atlantic sector of
ter column profiles of IPL-GDGTs with 18 samples from the           the Southern Ocean (20 to 65◦ W) bounded by the South At-
Amundsen Sea and 30 samples from a transect in the Scotia           lantic Ocean to the north, by the Drake Passage to the west,
and Weddell Sea.                                                    and by the Weddell Sea to the south (Fig. 1). The Scotia Sea
                                                                    is influenced by the eastward flow of the ACC, via the Drake
                                                                    Passage, and by a northward component of the ACC, caused
2     Methodology                                                   by topographic steering and northward outflow of recently
                                                                    ventilated waters from the Weddell Sea, whereby Weddell
2.1    Study area                                                   Sea Deep Water (WSDW) is incorporated into the ACC (Lo-
                                                                    carnini et al., 1993; Naveira Garabato et al., 2002a, b), thus
The Southern Ocean drives the global thermohaline circula-          creating a region of high mixing (Heywood et al., 2002) and
tion and is therefore a major regulator of Earth’s oceans and       intense water mass modification (Locarnini et al., 1993).
climate (Carter et al., 2009). The eastward-flowing Antarc-            The Amundsen Sea extends from 100 to 130◦ W and is
tic Circumpolar Current (ACC) connects all the major ocean          bounded by the sub-Antarctic Pacific to the north (Fig. 1).
basins, resulting in a major role in the distribution of heat,      The Amundsen Sea water column south of the PF mainly
salt, and gases (Carter et al., 2009). The surface waters of        consist of a thin upper layer of cold and fresh AASW overly-
the Southern Ocean show clear shifts in water properties            ing relatively warm CDW. The Amundsen Sea Embayment
(salinity and temperature), which mark ocean fronts and in          is located offshore from one of the major WAIS drainage
the present study include the sub-Antarctic front (SAF), the        basins, and observations show a clear trend in glacial retreat
polar front (PF), the southern front of the ACC (SACCF),            over recent decades (e.g. Mouginot et al., 2014; Paolo et al.,
and the southern boundary of the ACC (SBACC) (Carter et             2015; Rignot et al., 2019). The deep ice shelves (extending
al., 2009, and references therein). Antarctic surface waters        up to 1000 m below sea level) surrounding the Amundsen
(AASWs; 100 m thick), extending from the Antarctic conti-           Sea Embayment are exposed to unmodified CDW which can
nental shelf to the PF, are characterised by near-freezing tem-     be up to 4 ◦ C above the in situ freezing point (Jacobs et al.,
peratures and salinity values up to 34.3 practical salinity units   1996, 2011; Rignot and Jacobs, 2002; Jenkins et al., 2010;
(PSU), although these properties can vary on a regional basis       Rignot et al., 2013; Webber et al., 2017) so that CDW may
(Carter et al., 2009, and references therein). The transition       drive enhanced melt rates and ice sheet instability in this re-
between AASW south of the PF and sub-Antarctic surface              gion (Shepherd et al., 2001; Zwally et al., 2005; Rignot et al.,
water (SASW) north of the SAF occurs in the Polar Frontal           2008; Pritchard et al., 2009; Wingham et al., 2009).
Zone. Due to complex mixing processes, the properties of
surface water in the Polar Frontal Zone are often variable, but     2.2   Sample collection
this water is generally warmer (3–8 ◦ C) and less dense (salin-
ity 34–34.4 PSU) than AASW (Carter et al., 2009, and refer-         A Seabird Scientific SBE 911plus conductivity–
ences therein). Lastly, SASW is comparatively warmer (6–            temperature–depth (CTD) instrument with a 24-bottle
12 ◦ C), with salinity > 34.3 PSU (Carter et al., 2009, and ref-    rosette was used to vertically profile the water column and
erences therein). Circumpolar Deep Water (CDW) together             collect water for organic geochemical analysis. Water was
with CDW-derived, modified deep water masses, such as               collected on board the RRS James Clark Ross (expeditions
Warm Deep Water in the Weddell Gyre (e.g. Vernet et al.,            JR272 and JR257) during March–April 2012 (austral au-
2019), is a key Southern Ocean water mass and can be de-            tumn) from 15 stations along the former WOCE A23 section
tected between ∼ 1400 and > 3500 m depth offshore from              (Meredith et al., 2001) traversing the Scotia Sea between
the Antarctic continent. CDW can rise to meet AASW or               the northern Weddell Sea and South Georgia (Table 1 and
even outcrop along the Antarctic continental margin (Carter         Fig. 1; Allen et al., 2012; Venables et al., 2012), as well
et al., 2009, and references therein). Mixing of CDW with           as on board the R/V Polarstern expedition PS104 during
different water masses gives rise to two types: upper CDW           February–March 2017 (austral summer) from five stations
(UCDW) defined by an oxygen minimum, high nutrient con-             in the Amundsen Sea Embayment (Table 2 and Fig. 1; Gohl,
centrations, and a depth of 1400–2500 m; and lower CDW              2017). Water samples were collected in 10 L Niskin bottles.
(LCDW) defined by a salinity maximum of 34.70–34.75 PSU             In the Scotia Sea, the depth of the sample collection was
(Carter et al., 2009, and references therein). In contrast to       dependent on the expression of the mixed layer and seasonal
UCDW, LCDW extends south of the SBACC (Orsi et al.,                 thermocline as observed during each CTD deployment. At

https://doi.org/10.5194/bg-18-3485-2021                                                    Biogeosciences, 18, 3485–3504, 2021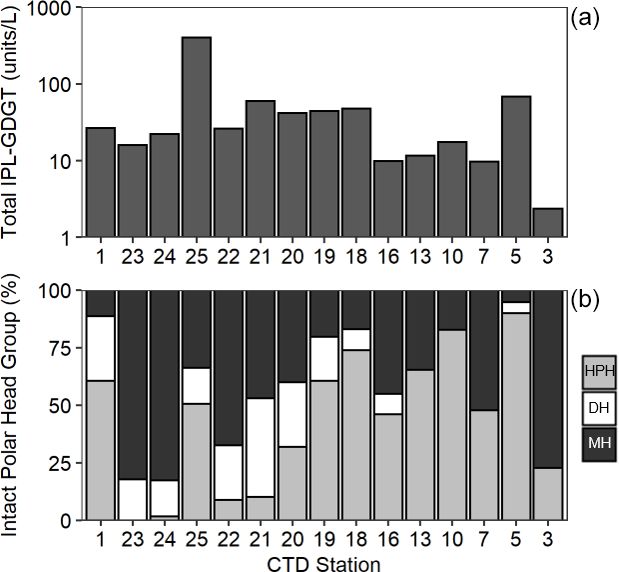
3488 C. L. Spencer-Jones et al.: Archaeal intact polar lipids in polar waters
The filters were subsequently stored in foil at −20 ◦ C and
then transported to Durham University (UK; Scotia Sea sam-
ples) and the Alfred Wegener Institute (Germany; Amund-
sen Sea samples). Samples were freeze-dried prior to lipid
extraction.
2.3 Sample extraction
Total lipids of the Scotia Sea sample set were extracted at the
Royal Netherlands Institute for Sea Research. Freeze-dried
samples were extracted using a modified Bligh and Dyer
methodology as detailed in Besseling et al. (2018). Briefly,
sample filters were cut into small pieces using solvent-
cleaned scissors. The total lipids were extracted using a
monophasic mixture of K2 HPO4 (8 g L−1 adjusted to pH 7–
8), dichloromethane (CH2 Cl2 ), and methanol (CH3 OH) at
a ratio of 0.8 : 1 : 2. Extractions were repeated three times
and pooled. The pooled extract was subsequently phase sep-
arated by adjusting the ratio of K2 HPO4 : CH2 Cl2 : CH3 OH
to 0.9 : 1 : 1. The CH2 Cl2 layer of the resultant biphasic mix-
ture was transferred to a round-bottom flask. This was re-
peated three times and the Bligh–Dyer extract dried under a
stream of N2 .
Total lipids of the Amundsen Sea sample set were ex-
tracted at the Alfred Wegener Institute (Germany). Freeze-
dried samples were extracted ultrasonically using CH2 Cl2
and CH3 OH at a ratio of 2 : 1 for 15 min. This was repeated
three times, the extracts pooled and dried under a stream of
N2 . The resulting total lipid extract was fractionated over a
silica column using hexane (for elution of the alkanes and
highly branched isoprenoids) followed by CH2 Cl2 : hexane
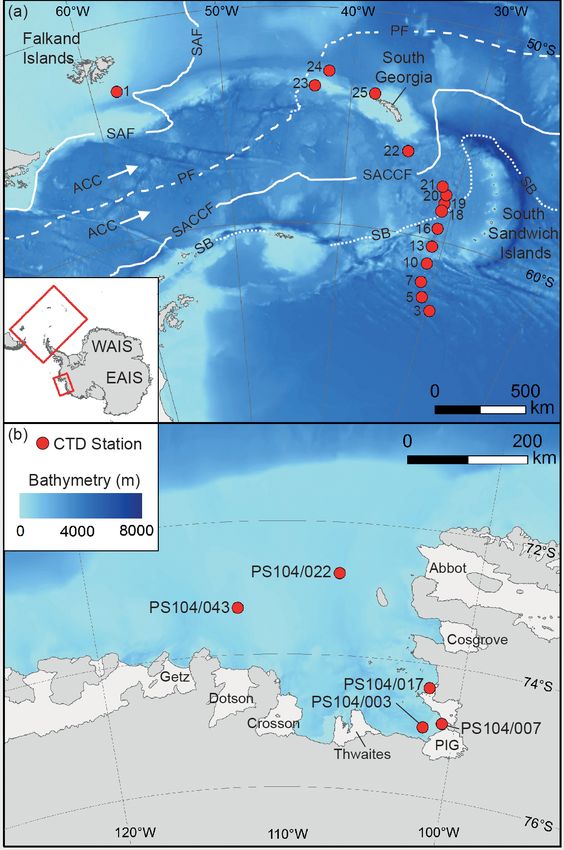
Figure 1. Map showing studied CTD sampling stations (red dots) and CH2 Cl2 : CH3 OH both at a ratio of 1 : 1 for elution of
in the Scotia Sea (a) and Amundsen Sea (b). The main oceanic the polar fraction. The polar fraction was dried under N2 and
fronts are also shown in panel (a): sub-Antarctic front (SAF), po- stored at −20 ◦ C prior to IPL-GDGT analysis. The method
lar front (PF), southern ACC (SACCF), and the southern boundary used for the extraction of the Amundsen Sea samples is
of the ACC (SB) (Sokolov and Rintoul, 2009). The names of the ice not the Bligh–Dyer protocol most commonly used for IPL-
shelves are shown in panel (b). GDGT extraction. Extraction technique has not been found
to significantly affect c-GDGTs recovery (Schouten et al.,
2013b; Weber et al., 2017) but has been found to have a
all stations, a “mixed layer” sample was collected between greater influence on IPL-GDGT recovery due to differences
10–40 m depth, and a “thermocline layer” sample was in polar moieties (Weber et al., 2017). Weber et al. (2017)
collected between approximately 60–110 m depth (Table 1). found extraction procedure to impact the absolute quantifi-
In the Amundsen Sea, the sampling strategy included cation of GDGTs along with the recovery of cren0 (under-
samples from surface, thermocline waters, and CDW. Water quantified) and GDGT-3 (over-quantified). Sample purifica-
samples (approximately 10–30 L) were vacuum filtered tion using silica gel column chromatography has also been
through pre-combusted GF/F filters (Whatman, 0.7 µm pore found to have an impact on IPL-GDGT recovery (Pitcher
size, 50 mm diameter). Glass fibre filters with a nominal et al., 2009; Lengger et al., 2012) with HPH-GDGTs under-
pore size of 0.7 µm are most commonly used for sampling quantified (Lengger et al., 2012). We acknowledge that there
of SPM in ocean and lake waters. However, as microbes can may be some differences in IPL-GDGT recovery between
range in size from 0.2–0.7 µm, these filters may lead to an the Amundsen and Scotia Sea samples due to differences
under-sampling of archaeal cells that are not associated with in extraction and work-up technique. However, we propose
aggregates (Lee et al., 1995; Ingalls et al., 2012). Therefore, that comparison can still be made between the two seas as
IPL-GDGT concentrations reported here represent the we do not report absolute quantities of IPL-GDGTs as the
minimum likely concentrations. methods are semi-quantitative, we do not report the occur-
rence of cren0 , and GDGT-3 was below the detection limit
Biogeosciences, 18, 3485–3504, 2021 https://doi.org/10.5194/bg-18-3485-2021C. L. Spencer-Jones et al.: Archaeal intact polar lipids in polar waters 3489
Table 1. Scotia Sea SPM samples studied and their physical properties including sample depth (m) and sample layer where “M” denotes
mixed layer and “T” denotes thermocline layer, GDGT-0 / cren, and Ring Index.
Latitude Longitude Station Sample Layer Temperature Salinity Fluorescence GDGT-0/ Ring
(◦ N) (◦ E) depth (m) (◦ C) (PSU) (mL m−3 ) cren Index
−53.013 −58.04 CTD 1 15 M 7.31 33.99 0.41 2.6 0.9
−53.013 −58.04 CTD 1 100 T 6.12 34.03 0.13 6.7 0.4
−53.586 −42.835 CTD 23 20 M 4.07 33.72 0.32
−53.586 −42.835 CTD 23 100 T 2.23 33.81 0.08 1.8 0.7
−52.88 −41.787 CTD 24 15 M 3.55 33.72 1.09
−52.88 −41.787 CTD 24 80 T 1.67 33.88 0.09 1.6 0.9
−53.743 −38.155 CTD 25 10 M 3.17 33.62 0.66
−53.743 −38.155 CTD 25 80 T 1.95 33.91 0.05 2.4 0.8
−57.119 −31.815 CTD 22 30 M 1.34 33.82 0.24
−56.167 −34.816 CTD 22 110 T 0.84 34.12 0.09 1.9 0.5
−57.459 −31.327 CTD 21 30 M 1.48 33.85 0.27
−57.459 −31.327 CTD 21 110 T 1.34 34.3 0.03 5.3 0.2
−57.803 −30.83 CTD 20 30 M 1.60 33.92 0.28 2.2 1.0
−57.803 −30.83 CTD 20 110 T 1.01 34.15 0.06 6.8 0.2
−58.213 −30.822 CTD 19 20 M 1.29 33.9 0.27
−58.213 −30.822 CTD 19 80 T 1.16 34.19 0.09 8.0 0.3
−58.624 −30.821 CTD 18 20 M 0.65 33.69 0.17
−58.624 −30.821 CTD 18 90 T −0.83 33.99 0.17 4.1 0.6
−59.436 −30.861 CTD 16 20 M −0.64 33.67 0.17
−59.436 −30.861 CTD 16 70 T −1.32 34.12 0.08 16.8 1.0
−60.319 −30.961 CTD 13 30 M −0.89 33.74 0.11
−60.319 −30.961 CTD 13 65 T −1.16 34.01 0.11 4.6 0.6
−61.171 −31.045 CTD 10 30 M −1.08 33.82 0.15
−61.171 −31.045 CTD 10 80 T −1.08 34.23 0.11 177.6 0.02
−62.084 −31.174 CTD 7 40 M −1.11 33.87 0.4
−62.084 −31.174 CTD 7 75 T −1.54 34.33 0.16 21.7 0.1
−62.784 −30.706 CTD 5 20 M −1.13 33.87 0.28
−62.784 −30.706 CTD 5 70 T −1.49 34.34 0.14 4.3 0.7
−63.346 −29.569 CTD 3 20 M −1.18 33.8 0.22
−63.346 −29.569 CTD 3 60 T −1.58 34.31 0.21 9.9 0.3
of the instrument. An internal standard of 1-O-hexadecyl- rate of 0.2 mL min−1 . Chromatographic separation of IPL-
2-acetyl-sn-glycero-3-phosphocholine was added to both the GDGTs was achieved using the following 70 min program:
Amundsen and Scotia Sea samples. The Bligh–Dyer extract 0 % eluent B from 0–5 min, linear gradient to 34 % eluent B
(Scotia Sea) and polar fraction (Amundsen Sea) were filtered at 25 min, isocratic 25–40 min, linear gradient to 60 % B at
through true regenerated cellulose filters (4 mm, 0.45 µm 55 min, linear gradient to 70 % B at 65 min, followed by a
pore size) using hexane, propan-2-ol, and water at a ratio of re-equilibration time of 20 min between each analysis. Elu-
79 : 20 : 1. Samples were stored at −20 ◦ C prior to analysis. ent A is hexane / propan-2-ol / formic acid / 14.8 M NH3 aq
(79 : 20 : 0.12 : 0.04 [v/v/v/v]), and eluent B is propan-2-
2.4 Intact polar lipid characterisation ol / water / formic acid / 14.8 M NH3 aq (88 : 10 : 0.12 : 0.04
[v/v/v/v]). HESI sheath gas, auxiliary gas, and sweep gas
IPL-GDGTs were analysed using a modification of the N2 pressures were 35, 10, and 10 (arbitrary units) respec-
Sturt et al. (2004) methodology as detailed in Besseling et tively with the auxiliary gas at 50 ◦ C. The spray voltage was
al. (2018) – to summarise, an Agilent 1290 Infinity I UH- 4.0 kV (positive ion ESI), S-lens 70 V, and capillary temper-
PLC, equipped with a thermostated auto-injector and column ature 275 ◦ C. Mass range monitored was between m/z 375
oven, coupled to a Q Exactive Orbitrap MS with Ion Max and 2000 (resolving power of 70 000 ppm at m/z 200) fol-
source with a heated electrospray ionisation (HESI) probe lowed by data-dependent fragmentation of the 10 most abun-
(Thermo Fisher Scientific, Waltham, MA, USA). Separa- dant masses in the mass spectrum (with the exclusion of
tion was achieved using a YMC-Triart Diol-HILIC column isotope peaks) fragmented successively (stepped normalised
(250 × 2.0 mm, 1.9 µm particle size, 12 nm pore size; YMC collision energy 15, 22.5, and 30; isolation window 1.0 m/z).
Co., Ltd., Kyoto, Japan) maintained at 30 ◦ C with a flow
https://doi.org/10.5194/bg-18-3485-2021 Biogeosciences, 18, 3485–3504, 20213490 C. L. Spencer-Jones et al.: Archaeal intact polar lipids in polar waters
Table 2. Amundsen Sea SPM samples studied and their physical properties, GDGT-0 / cren, and Ring Index.
Latitude Longitude Station Sample depth Temperature Salinity Fluorescence GDGT-0/ Ring
(◦ N) (◦ E) (m) (◦ C) (PSU) (mL m−3 ) cren Index
−74.958 −101.829 PS104/003-1 10 −0.72 33.96 0.48 7.3 0.5
−74.958 −101.829 PS104/003-1 120 −1.19 34.13 0.01 4.8 0.5
−74.958 −101.829 PS104/003-1 180 −1.23 34.17 0.01 27.0 0.03
−74.958 −101.829 PS104/003-1 998 1.01 34.67 −0.02 4.8 0.7
−74.866 −100.76 PS104/007-1 20 −0.12 33.52 3.78 8.2 0.4
−74.866 −100.76 PS104/007-1 120 −0.91 34.08 0.01 4.9 0.5
−74.866 −100.76 PS104/007-1 240 −1.33 34.14 −0.01 5.0 0.4
−74.866 −100.76 PS104/007-1 685 0.87 34.63 −0.02 4.2 0.6
−74.359 −101.747 PS104/017-1 10 −0.17 33.42 7.89
−74.359 −101.747 PS104/017-1 150 −1.61 34.16 0.01 5.8 0.3
−74.359 −101.747 PS104/017-1 1375 1.06 34.71 −0.02 2.8 0.9
−72.768 −107.093 PS104/022-1 10 −0.59 33.13 1.09
−72.768 −107.093 PS104/022-1 30 −0.47 33.27 1.71
−72.768 −107.093 PS104/022-1 120 −1.54 34.1 0.07 3.8 0.6
−72.768 −107.093 PS104/022-1 697 0.98 34.71 −0.02 4.2 0.6
−73.297 −112.328 PS104/043-2 10 −1.34 32.82 1.51
−73.297 −112.328 PS104/043-2 120 −1.62 34.18 0.01 3.3 0.5
−73.297 −112.328 PS104/043-2 454 0.15 34.51 −0.02 5.4 0.5
A dynamic exclusion window of 6 s was used as well as an Redundancy analysis (RDA) was performed on the Scotia
inclusion list with a mass tolerance of 3 ppm to target spe- Sea data set in RStudio (version 1.2.1335) using vegan (Ok-
cific compounds (absolute m/z values of IPL-GDGTs can be sanen et al., 2019) and faraway (Faraway, 2016) packages.
found in Supplement A, and structures are found in Supple- RDA was performed using data normalised to the internal
ment B Fig. S1). The Q Exactive Orbitrap MS was calibrated standard and total water volume extracted (scaled). Temper-
within a mass accuracy range of 1 ppm using the Thermo ature, salinity, oxygen concentration, and chlorophyll a fluo-
Scientific Pierce LTQ Velos ESI Positive Ion Calibration rescence (hereafter referred to as fluorescence) were selected
Solution (containing a mixture of caffeine, MRFA, Ultra- as explanatory variables, and IPL-GDGT relative abundances
mark 1621, and N-butylamine in an acetonitrile–methanol– are the response variables. The statistical significance of
acetic-acid solution). Peak areas for each individual IPL RDA, axes, and explanatory variables was determined using
were determined by integrating the combined mass chro- an ANOVA-like test (Legendre et al., 2011).
matograms (within 3 ppm) of the monoisotopic and first iso-
tope peak of all the relevant adducts formed (protonated,
ammoniated, and/or sodiated). IPL-GDGTs were examined 3 Results
in terms of their MS peak area response. Thus, the relative
abundance of the peak area does not necessarily reflect the 3.1 Physicochemical properties of the water column
actual relative abundance of the different IPL-GDGTs; how-
ever, this method allows for the comparison between samples CTD measurements were taken at all five stations in
analysed in this study. The peak areas were determined from the Amundsen Sea: PS104/003, PS104/007, PS104/017,
extracted ion chromatograms of the [M+H]+ , [M+NH4 ]+ , PS104/022, and PS104/043. Temperature–salinity (T –S)
and [M+Na]+ for each individual IPL-GDGT species. C- plots are shown in Fig. 2 and Supplement B Fig. S2. At
GDGT lipids were not analysed. the time of sampling, water masses in the Amundsen Sea
study area were characterised by a temperature range of
2.5 Data analysis −1.7 to +1.1 ◦ C, a salinity range of 32.8 to 34.7 PSU, and
a dissolved oxygen concentration of between 183.9 and
Standards for individual IPL-GDGTs are not available, and 386.2 µmol kg−1 . Three different water masses are detected
therefore concentrations reported here are semi-quantitative. in the Amundsen Sea from the T –S plot: AASW, CDW,
IPL-GDGT peak areas were normalised to the internal stan- and modified CDW (Fig. 2). Fluorescence peaked at the sur-
dard and volume of water filtered and are reported as units face within the uppermost 20 m, followed by a steep decline
L−1 . The Ring Index (RI) was calculated based on Zhang et with depth (Supplement B Fig. S2). High fluorescence val-
al. (2016). ues were observed at PS104/017 with a value of 8 mg m−3
and PS104/007 with a value of 4 mg m−3 , whereas low
Biogeosciences, 18, 3485–3504, 2021 https://doi.org/10.5194/bg-18-3485-2021C. L. Spencer-Jones et al.: Archaeal intact polar lipids in polar waters 3491
fluorescence values were observed at stations PS104/003, but were often below detection within the mixed layer (Ta-
PS104/022, and PS104/043 (Supplement B Fig. S2). ble 4 and Fig. 4b). Exceptions to this are CTD 1, 16, 20, and
The Scotia Sea study area encompasses the SAF, PF, 21, where IPL-GDGTs were present in both the mixed and
SACCF, and the SBACC (Fig. 1a) and is characterised by a thermocline layers. Relative abundance (%) of IPL-GDGT
temperature range of −1.6 to +7.3 ◦ C and a salinity range of cores and the degree of cyclicity remains constant along the
33.6–34.7 PSU (Fig. 2). The temperature range of the mixed Scotia Sea transect with IPL-GDGT head groups showing
layer samples was −1.2 to +7.3 ◦ C, and the temperature greater variation along the transect (Table 4). An increase in
range of the thermocline samples was −1.6 to +6.1 ◦ C. A the relative abundance of the HPH head group is observed
clear partition between the sample stations is observed in the within the thermocline samples between CTD 22 (53.5◦ S)
T –S plot (Fig. 2), with consistently higher water tempera- and 5 (63.3◦ S); this is coupled with a decrease in the rela-
tures found at stations north of CTD 19 and on average lower tive abundance (%) of MH and DH IPL-GDGT head groups
ocean temperatures south of CTD 18. This region broadly (Fig. 4b). Mixed layer CTD 20 and 21 are dominated by MH,
marks the location of the SBACC at ∼ 58.6◦ S (Fig. 1a). CTD 16 is dominated by HPH, and the CTD 1 mixed layer
contains a mixture of all three IPL-GDGT head groups. The
3.2 Amundsen Sea depth profiles GDGT-0 / cren ratio generally ranges from 1.6–9.9, but CTD
7 (21.7), 10 (177.6), and 16 (16.8), located at the thermo-
Archaeal IPLs were identified in the water column at all cline, exceed this range due to low cren concentrations (Ta-
Amundsen Sea stations (Table 3, Fig. 3). The relative abun- ble 1). In preparation for RDA on the thermocline samples,
dance of the regular GDGT core (i.e. non-hydroxylated) biomarkers that were identified in fewer than three samples
varied with depth ranging from 20 %–100 % of total IPL- were designated “rare species” and were excluded from the
GDGTs (excluding depths where no IPL-GDGTs were iden- analysis (GDGT-DH-0, GDGT-DH-1, and OH-GDGT-HPH-
tified; Table 3). PS104/003 and PS104/007 were found to 0 excluded). This is because outliers can violate the linear-
have IPL-GDGTs in the uppermost surface sample (10 and ity of the relationship between the response and explanatory
20 m depths respectively). The surface sample at PS104/003 variables (Legendre and Legendre, 2012). Samples CTD 1
(10 m) was dominated by non-hydroxylated GDGTs (94.3 % and 25 were also excluded from the analysis. CTD 1 is lo-
of total IPLs) with a lower relative abundance of OH-GDGT cated offshore of the Falkland Islands and is the only sample
core type (5.7 % of total IPLs). Further to this, HPH-GDGT- from north of the SAF, thus representing the only data point
0 was the most abundant IPL-GDGT at this station (81.8 % for the subantarctic zone of the Southern Ocean that is un-
of total IPLs), with HPH-cren contributing a smaller fraction likely to be representative for the polar environment. CTD
of the total IPL-GDGTs (11.1 %). Low relative abundance of 25, located close to South Georgia, was excluded due to high
MH-GDGT-0 (< 1 %), MH-cren (< 1 %), MH-OH-GDGT-0 biomarker abundances (Fig. 4a) which could be due to ex-
(< 1 %), DH-OH-GDGT-0 (5.1 %), and MH-diOH-GDGT-0 ceptionally high productivity in this area (e.g. Atkinson et
(< 1 %) was also observed at PS104/003 10 m. This contrasts al., 2001). Variance inflation factors (VIFs) for the response
with the surface sample at PS104/007 (20 m) where no OH- variables were between 3.5 (fluorescence) and 11.4 (oxygen
GDGT-IPLs were detected and where the IPL-GDGT suite is concentration) (Supplement C Table S1). The VIF for oxy-
split between MH-GDGT-0 (89.1 %) and MH-cren (10.9 %). gen concentration is slightly higher than is typically accept-
IPL-GDGTs were not identified within the surface sample at able for RDA. This is due to correlation between oxygen
PS104/017 (10 m) and the two mid-shelf stations, PS104/022 concentration and fluorescence (R = 0.63); however, as the
(10 and 30 m) and PS104/043 (10 m). DH-GDGT-0 and DH- R is below 0.7, this is unlikely to violate the assumptions of
cren are minor components of the IPL-GDGT suite with the RDA (Legendre and Legendre, 2012) (Supplement C Ta-
maximum relative abundance observed in the deepest sam- ble S2). RDA shows 64 % constrained variation, with RDA 1
ples for all Amundsen Sea stations. The relative abundance of and 2 accounting for 63 % of the cumulative variation (Sup-
IPL-GDGTs with a MH head group peaks in the mid-depths plement C Tables S3–S5). The RDA is statistically signif-
between 120 and 240 m (with the exception of the surface icant (p = < 0.05, f = 3.5); furthermore, RDA 1 is found
20 m at PS104/007). The ratio of GDGT-0 / cren is variable to be statistically significant (p = < 0.05, f = 11.48); how-
throughout the Amundsen Sea stations, ranging from 2.8–8.2 ever, RDA 2 is not significant (p = 0.42, f = 2.35) (Sup-
(excluding samples with no GDGTs). The sample taken from plement C Tables S10–S12). Species scores show HPH-
180 m water depth at PS104/003 exceeded this range with a GDGT-0 and HPH-cren to load positive on RDA 1, with
GDGT-0 / cren ratio of 27.0 (Table 2). MH-GDGT-0, MH-cren, MH-OH-GDGT-MH-0, DH-OH-
GDGT-0, and MH-MH-diOH-GDGT-0 loading highly neg-
3.3 Scotia Sea transect atively on RDA 1 (Fig. 5). Of the explanatory variables
tested, temperature is statistically significant at the < 0.05
Archaeal IPLs were detected within all 15 Scotia Sea sta- level (f = 8.56) and with salinity (p = 0.07, f = 2.61) and
tions. A clear depth trend in IPL-GDGTs can be observed oxygen concentration (p = 0.09, f = 2.58) approaching sig-
where IPL-GDGTs were detected in the thermocline samples nificance (Supplement C Table 12). The site scores show
https://doi.org/10.5194/bg-18-3485-2021 Biogeosciences, 18, 3485–3504, 20213492 C. L. Spencer-Jones et al.: Archaeal intact polar lipids in polar waters
Figure 2. The temperature and salinity profiles (T –S plot) for the Amundsen Sea (a) showing Antarctic Surface Water (AASW), Circumpolar
Deep Water (CDW), and modified CDW (mCDW), and Scotia Sea (b). Coloured circles indicate the water column temperature of the water
masses with the grey triangles indicating the water column sampling depths.
Figure 3. Relative abundance (%) of IPL-GDGTs at approximate sample depths in the Amundsen Sea. Bars reflect IPL-GDGT head group,
with black representing MH head groups, white representing DH, and grey representing HPH. Contour lines show approximate ocean
temperature ranges using CTD data taken at each sample station with Ocean Data View DIVA gridding.
CTD 20, 21, 22, 23, and 24 to be negatively loaded on RDA 1 lated IPL-GDGTs are not commonly reported in previous
and CTD 3, 5, 7, 10, 13, 16, 18 and 19 to be positively loaded SPM studies (e.g. Kim et al., 2016; Kang et al., 2017; Hur-
on RDA 1, suggesting that these stations are contrasted along ley et al., 2018). However, these compounds have been re-
this axis (Fig. 5). ported as c-GDGTs in marine and lacustrine sediments, with
hydroxylated GDGTs found to contribute approximately 8 %
in marine sediments from temperate and tropical sites (Liu
4 Discussion et al., 2012; Lu et al., 2015). These compounds have been
reported in much higher abundance in polar environments,
4.1 Hydroxylated GDGTs in polar environments including up to 20 % in SPM and up to 16 % in surface sed-
iments from the Nordic Seas (Fietz et al., 2013) and up to
In this study, two hydroxylated GDGTs (OH-GDGT-0 and 20 % in surface sediments from the Southern Ocean (Huguet
diOH-GDGT-0) were detected. Hydroxylated GDGTs have et al., 2013).
been reported as potential biomarkers for reconstructing Exceptionally high hydroxylated GDGT relative abun-
ocean temperature change in cold waters (Fietz et al., 2013, dances of greater than 20 % could be due to differences in
2016) and in this study contribute up to 49.8 % (OH-GDGT) methodologies compared to the previous studies which mea-
and 30.1 % (diOH-GDGT) of total IPL-GDGTs. Hydroxy- sured core GDGTs by atmospheric pressure chemical ion-
Biogeosciences, 18, 3485–3504, 2021 https://doi.org/10.5194/bg-18-3485-2021C. L. Spencer-Jones et al.: Archaeal intact polar lipids in polar waters 3493
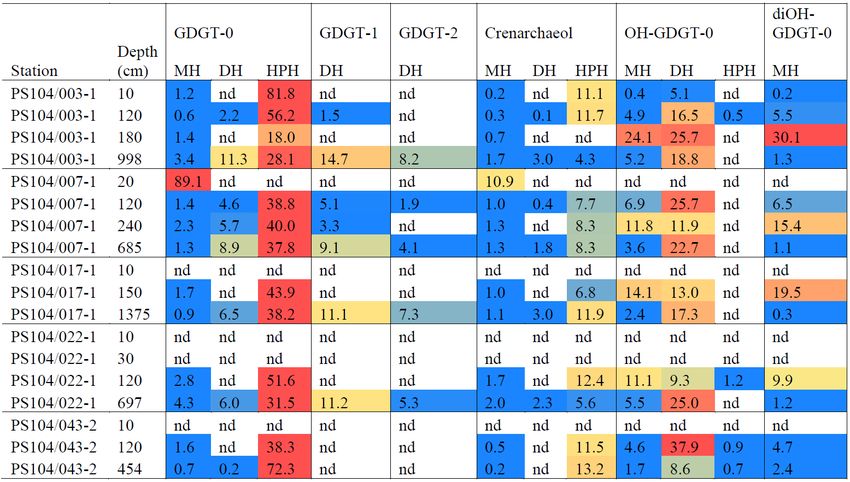
Table 3. Relative abundances (%) and heat map of IPLs identified in Amundsen Sea. Relative abundances > 30 % indicated in red, low
relative abundances < 10 % indicated in yellow, and low relative abundances < 5 % indicated in blue. “nd” means not detected.
lated IPL-GDGT relative abundances of 22 % (± 19 %) with
a range of 0 %–51 % in SPM from the euxinic Black Sea;
however, similar analyses from the Arabian Sea (Besseling
et al., 2018), the eastern tropical South Pacific (Sollai et al.,
2019b), and the Mediterranean Sea did not detect hydrox-
ylated IPL-GDGTs. Molecular dynamics simulations have
shown that the addition of hydroxyl moieties in the tetraether
structure increases the fluidity of the cell membrane and aids
transmembrane transport in cold environments (Huguet et al.,
2017). The exceptionally high amount of hydroxylated IPL-
GDGT for the Amundsen and Scotia seas may therefore be
due to elevated synthesis of these biomarkers in cold envi-
ronments.
4.2 IPL-GDGT distributions as an indicator of
archaeal populations
In both the Amundsen and Scotia Sea samples, low diver-
sity of cyclic GDGTs is observed (RI ranging from 0.02–
Figure 4. Total IPL-GDGT concentration (Log10 , 1 for the Scotia Sea and 0.03–0.9 for the Amundsen Sea;
units L−1 ) (a) and relative abundance (%) of IPL-GDGT head
Tables 1 and 2). This is particularly low compared with the
groups, monohexose (MH, black), dihexose (DH, white), and
hexose-phosphohexose (HPH, grey) (b) in Scotia Sea thermocline
RI of the global core top calibration, which includes a range
samples (mixed layer samples excluded from plots). of Southern Ocean samples, reporting an RI range of 1.25–
3 (excluding the Red Sea samples; Kim et al., 2010; Ho et
al., 2011, 2014; Zhang et al., 2016). Previous SPM studies
spanning a range of marine habitats have reported the pres-
isation (APCI; Liu et al., 2012; Fietz et al., 2013; Huguet ence of hydroxylated GDGT-1, 2, and 3 as well as a wider
et al., 2013; Lu et al., 2015), while this study examined range of non-hydroxylated GDGTs, such as GDGT-3 and 4
IPL-GDGTs using electrospray ionisation (ESI). Using the (Kim et al., 2016; Besseling et al., 2018; Hurley et al., 2018;
same liquid chromatography–mass spectrometry (LC-MS) Sollai et al., 2019a, b). As this study used the same ana-
methodology, Sollai et al. (2019a) report average hydroxy- lytical methodology as Besseling et al. (2018) and Sollai et
https://doi.org/10.5194/bg-18-3485-2021 Biogeosciences, 18, 3485–3504, 20213494 C. L. Spencer-Jones et al.: Archaeal intact polar lipids in polar waters Table 4. Relative abundances (%) and heat map of IPLs identified in Scotia Sea. Relative abundances > 30 % indicated in red, low relative abundances < 10 % indicated in yellow, and low relative abundances < 5 % indicated in blue. “nd” means not detected. al. (2019a, b), these differences cannot be attributed to an- Nitrososphaerales (Bale et al., 2019). IPL-GDGTs analysed alytical methodologies. Low cyclic diversity of GDGTs in in this study cluster within the Nitrosopumilales group due the Amundsen and Scotia seas could be due to differences in to the high relative abundances of GDGT-0 and low relative the synthesis of these lipids by the source Thaumarchaeota. abundances of all other GDGTs. Due to the polar locations The relationship between ocean temperature and the cyclic- of the Amundsen and Scotia Sea samples, Nitrosopumilales ity of GDGTs has been firmly established, with increasing are likely to be the key AOA in these environments. Previ- ocean temperatures correlated with increasing relative abun- ous microbial analysis of the spatial variation in prokary- dance of GDGTs with two or more cyclopentane moieties otes of the Amundsen Sea polynya indicated that the most (Schouten et al., 2002, 2007; Kim et al., 2008, 2010). How- abundant Thaumarchaeota marine group I (MGI) sequence ever, Kim et al. (2010) note some differences between sub- belonged to the cluster affiliated with “Candidatus Nitrosop- tropical and subpolar oceans, with cren playing a more im- umilus maritimus” (Kim et al., 2014). In similar studies portant role in temperature reconstructions in the subtropics within the wider Southern Ocean region phylogenetic analy- than in polar oceans, suggesting that there may be differ- sis reveals high abundances of sequences clustering with Ni- ences in membrane adaptation strategies of Thaumarchaeota. trosopumilus. Hernandez et al. (2015) analysed surface wa- Principal component analysis of IPL-GDGT distributions of ter samples from Potter Cove (King George Island, west- a moderately thermophilic Thaumarchaeota along with pre- ern Antarctica Peninsula), which revealed that the majority viously published data identifies two distinct clusters with a of sequences fell into the clade containing “Candidatus Ni- clear partition between the orders of Nitrosopumilales and trosopumilus maritimus” and other environmental sequences Biogeosciences, 18, 3485–3504, 2021 https://doi.org/10.5194/bg-18-3485-2021
C. L. Spencer-Jones et al.: Archaeal intact polar lipids in polar waters                                                             3495

Figure 5. Redundancy analysis triplot for Scotia Sea sample set showing samples with depths, biomarker response variables (grey lines), and
explanatory variables (black with dashed lines indicating statistical significance).

containing Thaumarchaeota. Signori et al. (2018) studied mi-            up to 92.9 % and up to 100 % of total IPL-GDGTs in the
crobial spatial and temporal variability at 10 stations off the         Amundsen Sea and Scotia Sea respectively. The dominance
Antarctic Peninsula, revealing spring to be characterised by            of HPH in the lipid profiles of the Amundsen and Scotia seas
SAR11 and microbial communities remaining from winter,                  aligns with previous culture analysis (Schouten et al., 2008;
including Thaumarchaeota (Nitrosopumilus), Euryarchaeota,               Pitcher et al., 2011; Sinninghe Damsté et al., 2012; Elling et
and SAR324, with a shift in microbial populations during the            al., 2017).
summer and autumn.
   Three polar head groups were detected in this study, i.e.            4.3   Distribution of IPL-GDGTs in surface waters of
MH, DH, and HPH. All three head groups have previously                        Southern Ocean
been identified in culture (Schouten et al., 2008; Pitcher et
al., 2011; Sinninghe Damsté et al., 2012; Elling et al., 2017)          In this study, we observed a number of consistent trends in
and environmental studies (e.g. Zhu et al., 2016; Besseling             the water column IPL-GDGT distributions between the dif-
et al., 2018) and have widely been associated with Thau-                ferent Amundsen Sea and Scotia Sea sampling stations. In
marchaeota. It has been postulated that specific IPL-GDGTs              the surface samples, collected within the euphotic zone of
may be associated with particular thaumarchaeotal groups                the Amundsen Sea at PS104/017 (10 m), PS104/022 (10 and
or habitats (Sinninghe Damsté et al., 2012; Elling et al.,              30 m), PS104/043 (10 m), and the Scotia Sea (15–40 m depth
2017; Bale et al., 2019). Previously the HPH head group has             at CTD stations 3, 5, 7, 10, 13, 18, 19, 22, 23, 24, and 25),
been associated with the Nitrosopumilales order (group I.1a)            no IPL-GDGTs were identified. Previous studies from the
and the DH head group with the Nitrososphaerales order                  Southern Ocean have shown water column archaeal distri-
(group I.1b) (Sinninghe Damsté et al., 2012). More re-                  butions to be highly variable on both a temporal and spa-
cent studies have shown that environmental niche or habi-               tial scale. Broadly, archaea (as measured by cell counts or
tat may be the main driver of GDGT head group composi-                  rRNA) are often absent or found in relatively low abundance
tion rather than phylogeny (Elling et al., 2017; Bale et al.,           in the surface waters during the austral spring algal bloom
2019). Relevant to this study, Elling et al. (2017) analysed the        and during austral summer (Massana et al., 1998; Church
lipidome of 10 thaumarchaeotal cultures and identified DH-              et al., 2003; Kalanetra et al., 2009; Besseling et al., 2020).
GDGTs and DH-OH-GDGTs as key membrane components                        The absence of archaea in the surface waters of the Southern
of the marine mesophiles compared with the terrestrial ther-            Ocean contrasts with the high abundance of bacteria and is
mophilic and soil mesophilic Thaumarchaeota. In the present             part of a larger seasonal cycle in archaeal population dynam-
study, high abundances of HPH were detected, contributing               ics (Church et al., 2003). Temporal distributions of archaea

https://doi.org/10.5194/bg-18-3485-2021                                                         Biogeosciences, 18, 3485–3504, 2021
3496                                                C. L. Spencer-Jones et al.: Archaeal intact polar lipids in polar waters

are then shown to become more evenly distributed by depth,       the influx of iron released from the rapidly melting Thwaites
with an increase in the population within the surface waters     and Pine Island glaciers (Alderkamp et al., 2012; Gerringa
throughout austral autumn–winter (Church et al., 2003). The      et al., 2012; Thuroczy et al., 2012; St-Laurent et al., 2017).
Amundsen Sea samples were collected during austral sum-          Results from another cruise in the region identified that pro-
mer. Two previous studies in the Antarctic Peninsula have        ductivity is limited not only by nutrient and iron availability
shown an increase in group I archaeal populations in surface     but also by light; productivity is 30 %–50 % lower in the Pine
waters during austral summer and winter (Massana et al.,         Island polynya compared to the Amundsen polynya, with
1998; Murray et al., 1998). However, Kalanetra et al. (2009)     this difference attributed to the significant difference in so-
did not observe any archaea in surface waters west of the        lar irradiance levels between the two polynyas throughout
Antarctic Peninsula during austral summer. The mechanism         the summer season (Park et al., 2017). Similarly, CTD 1 is
for this temporal heterogeneity is likely mediated by a com-     located close to the Falkland Islands in the subantarctic zone
bination of physical and biological factors, including water     north of the SAF and is potentially subject to additional ter-
mass properties and concentrations of dissolved and partic-      restrial inputs and coastal dynamics. Kalanetra et al. (2009)
ulate organic carbon (Murray et al., 1998). Furthermore, the     suggests that a combination of both light and nutrient dif-
absence of AOA in the surface waters during austral spring,      ferences between Arctic and Antarctic Ocean settings could
when primary productivity is highest, could be due to com-       cause the differences in archaeal populations in the surface
petition with bacteria and algae that bloom during the same      ocean, where low light and nutrient levels in the surface allow
time period and/or a subsequent nutrient limitation (Massana     archaeal populations to flourish, with further studies suggest-
et al., 1998; Church et al., 2003; Kalanetra et al., 2009). As   ing photoinhibition of Thaumarchaeota (Church et al., 2003;
the current study was only performed at one time point dur-      Mincer et al., 2007; Hu et al., 2011; Merbt et al., 2012; Luo
ing austral summer, a larger sampling campaign would be          et al., 2014).
required to fully characterise microbial and IPL-GDGT sea-
sonality in the Amundsen Sea.                                    4.4   Influence of Circumpolar Deep Water on IPL
   In contrast with the other stations, the surface water sam-         distributions: Amundsen Sea
ples from PS104/003 and PS104/007 (10 and 20 m respec-
tively) and CTD 1, 16, 20, and 21 were found to contain IPLs.    IPL-GDGT diversity increased downwards in the water col-
The samples from PS104/007 (10 m), CTD 20, and 21 only           umn through the thermocline and the CDW layer in the
contained the MH head group. It should be noted that while       Amundsen Sea (Table 3). DH-cren and HPH-cren may be
the MH head group is known to be synthesised by archaea          widely applied as biomarkers for recently active Thaumar-
(e.g. Sinninghe Damsté et al., 2012), this IPL is recalcitrant   chaeota populations having been identified as key cell mem-
and can be formed as a degradation product of other IPL-         brane lipids (Pitcher et al., 2010; Sinninghe Damsté et al.,
GDGTs (e.g. Lengger et al., 2013, 2014). In contrast, HPH is     2012; Elling et al., 2017). HPH-cren was identified con-
more labile and less readily preserved in sediments follow-      sistently throughout the thermocline and CDW layer at all
ing cell death and is hence considered to be a biomarker for     Amundsen Sea stations (Table 3). Our results, therefore, sug-
recently active archaea and, in particular, Thaumarchaeota       gest recently active AOA at the thermocline and within the
(Pitcher et al., 2010; Sinninghe Damsté et al., 2012). HPH-      CDW. Tolar et al. (2016) shows ammonia oxidation (AO)
cren can vary between phylogenetic subgroups (Elling et al.,     to occur throughout the water column, with similar rates of
2017), and while the DH head group is not as labile as HPH       AO in CDW during both winter and summer seasons and
due to its glycosidic structure (Lengger et al., 2013), DH-      increased AO in surface waters during the late winter in
GDGTs have been identified with consistent relative abun-        sites west of the Antarctic Peninsula. These patterns in AO
dances across the Nitrosopumilales order (group I.1a), sug-      are consistent with molecular microbiology studies from the
gesting DH-cren as an additional biomarker for AOA activ-        Amundsen Sea and Antarctic Peninsula region that identi-
ity (Elling et al., 2017). Hence, the dominance of the MH        fied Thaumarchaeota throughout the water column, but with
head group at these stations may indicate an inactive/relic      a seasonal trend where these archaea are often absent in the
archaeal population at this depth. Higher IPL-GDGT diver-        surface waters during spring and summer and present in the
sity was detected at PS104/003 and CTD 1 and 16, includ-         CDW throughout the year (Massana et al., 1998; Alonso-
ing HPH and DH head groups indicating a recently active          Saez et al., 2011). HPH-cren, however, may not be the most
archaeal population (Sinninghe Damsté et al., 2012; Elling       suitable proxy for tracking the complete AOA population
et al., 2017). PS104/003 is located in an area of active up-     as the relative abundance of this IPL can vary significantly
welling of nutrient-rich waters largely composed of CDW          between phylogenetic subgroups (Elling et al., 2017). DH-
(Pine Island Bay polynya) (Mankoff et al., 2012). Together       GDGTs have been identified with consistent relative abun-
with the Amundsen polynya located north of Dotson and            dances across the Nitrosopumilales order (group I.1a), sug-
westernmost Getz ice shelves (Fig. 1), it is one of the most     gesting DH-cren as an additional biomarker for AOA activity
productive regions (per unit area) of the Southern Ocean (Ar-    (Elling et al., 2017). In this study we detect DH-cren consis-
rigo and van Dijken, 2003). Productivity is further aided by     tently in the CDW layer and with low relative abundance in

Biogeosciences, 18, 3485–3504, 2021                                                https://doi.org/10.5194/bg-18-3485-2021
C. L. Spencer-Jones et al.: Archaeal intact polar lipids in polar waters                                                   3497

the thermocline of PS104/003 and PS104/007 and absence in        tervals (i.e. below 400 m), while HPH-cren was present at
the thermocline waters at PS104/017 and PS104/022. Thau-         both the thermocline and CDW depths.
marchaeota are thought to partition between shallow wa-             The Scotia Sea samples were collected along clear
ter (0–130 m) and deep water (500–4000 m) marine clades          temperature (−1.6 to +7.3 ◦ C), salinity (33.6–34.3 PSU),
(Francis et al., 2005; Hallam et al., 2006). Therefore, the      oxygen (218.3–332.7 µmol kg−1 ), and fluorescence (0.03–
depth trend of HPH-cren throughout the thermocline and           1.1 mL m−3 ) gradients associated with ocean fronts, which
CDW and DH-cren restricted to CDW depths could reflect           are known to impact bacterioplankton population diversity
differences in Thaumarchaeota populations in the Amundsen        (Wilkins et al., 2013; Baltar et al., 2016; Raes et al., 2018).
Sea. While the data presented here provide only a snapshot of    Figure 5 shows that higher-latitude samples with cooler
the Amundsen Sea IPL-GDGT distributions, this small con-         ocean temperatures cluster positively on RDA axis 1 and
trast in HPH and DH-cren distributions may represent a sig-      have higher relative abundances of HPH-GDGT-0 and HPH-
nificant partition between Thaumarchaeota populations and        cren (samples 3, 5, 7, 10, 13, 16, 18, 19), whilst samples
warrants further analysis. Thaumarchaeota are not homoge-        from warmer ocean waters and lower latitudes cluster neg-
neously distributed throughout the water column. Molecu-         atively on RDA axis 1 and have higher relative abundances
lar microbiology has identified Thaumarchaeota to be virtu-      of MH and DH IPL-GDGTs (samples 20–24). The contrast
ally absent from Antarctic Summer Surface Waters (0–45 m         in IPL head group distributions between CTD stations 3–
depth) and present in Winter Water (45–105 m depth) and          19 and 20–24 suggests that RDA 1 represents the transition
Circumpolar Deep Water (105–3500 m depth) (e.g. Kalanetra        across the SBACC. Temperature was found to be a statis-
et al., 2009). Our observation of active IPL-GDGT synthesis      tically significant explanatory variable in the RDA, which
within the CDW has implications for the use of c-GDGT-           is consistent with previous research that has identified clear
based biomarker proxies in the Amundsen Sea and poten-           links between core GDGT relative abundances and environ-
tially more broadly within the Southern Ocean. Indeed, tem-      mental variables such as temperature (Schouten et al., 2007;
perature reconstructions based on GDGTs are suggested to         Kim et al., 2008, 2010). Specifically, we observe a shift in the
represent the 45–200 m range (Kim et al., 2012), acknowl-        GDGT head group between the warmer and cooler waters
edging the absence of Thaumarchaeota from the surface wa-        of the ACC fronts. Temperature, along with other physic-
ters during the summer months in Antarctica. The influence       ochemical properties (e.g. nutrient and oxygen concentra-
of CDW on reconstructed TEX86 palaeotemperatures has             tions), varies across the ACC (e.g. Rubin, 2003; Freeman et
been hypothesised in Adélie Land (East Antarctica), with         al., 2019). These shifts in physicochemical properties across
Kim et al. (2012) suggesting warmer reconstructed temper-        permanent oceanic boundaries influence and control bacte-
atures were likely due to the upwelling of CDW onto the          rial and archaeal species richness, creating ecological bound-
piston core site. In our study we specifically observe IPL-      aries or niches (e.g. Raes et al., 2018). Variability in IPL-
GDGTs of recently living archaea in the CDW (over 500 m          GDGT head group composition observed across the Scotia
water depth). Furthermore, we observe a shift in head group      Sea transect could reflect the transition across an environ-
composition at CDW depths in the Amundsen Sea, repre-            mental niche (e.g. Elling et al., 2017; Bale et al., 2019). As
senting a shift in the IPL-GDGT-producing community. We          this study is limited by the number of chemical properties
hypothesise that the contribution of GDGTs synthesised at        analysed, it would be speculative to infer the relative im-
CDW depths where physical parameters (e.g. temperature)          portance of specific nutrient concentrations across the Sco-
can be strikingly different to the 45–200 m water depth may      tia Sea transect. Alternatively, the shift in IPL-GDGT head
have a significant impact on reconstructed TEX86 temper-         group could also be influenced by the presence of the Wed-
atures, not only the Amundsen Sea but potentially more           dell Gyre, which is located south of 55–60◦ S and between
broadly within the Southern Ocean.                               60◦ W and 30◦ E (Vernet et al., 2019). The Weddell Gyre is a
                                                                 region of enhanced productivity, with austral summer chloro-
4.5   Influences on the GDGT-IPL distribution along the          phyll a concentrations ranging from 1.5–10 mg m−3 (Bath-
      Scotia Sea transect                                        mann et al., 1997; Cape et al., 2014) due to high concentra-
                                                                 tions of nutrients upwelled and circulated through the gyre
IPL-GDGTs were found to be present within the thermo-            (Vernet et al., 2019, and references therein).
cline (60–110 m) and contain a high proportion of MH head
group IPL-GDGTs, suggesting a high proportion of relic
IPL-GDGTs in the Scotia Sea that could relate to the sea-        5   Conclusions
sonality of archaeal populations. Further to this, DH-cren
was found to be absent from the thermocline with HPH-cren        A range of archaeal IPLs was detected in both the Amund-
intermittently present. This pattern in DH-cren and HPH-         sen Sea and the Scotia Sea. High relative abundances of OH-
cren in the Scotia Sea is consistent with our results from the   GDGT core type were observed, which could reflect the po-
Amundsen Sea, where DH-cren was mostly absent from the           lar environmental setting of these samples. Low cyclicity was
120–240 m depth intervals but present in the CDW depth in-       detected in both the Amundsen and Scotia seas for both the

https://doi.org/10.5194/bg-18-3485-2021                                                 Biogeosciences, 18, 3485–3504, 2021
You can also read