The Andaman day gecko paradox: an ancient endemic without pronounced phylogeographic structure - Nature
←
→
Page content transcription
If your browser does not render page correctly, please read the page content below
www.nature.com/scientificreports
OPEN The Andaman day gecko
paradox: an ancient endemic
without pronounced
phylogeographic structure
1,2*
Ashwini V. Mohan , Pablo Orozco‑terWengel3, Kartik Shanker2 & Miguel Vences 1
The Andaman day gecko (Phelsuma andamanensis) is endemic to the Andaman Archipelago,
located ~ 6000 km away from Madagascar where the genus Phelsuma likely evolved. We
complemented existing phylogenetic data with additional markers to show that this species
consistently branches off early in the evolution of the genus Phelsuma, and this early origin led
us to hypothesize that island populations within the Andaman Archipelago could have further
diversified. We sampled the Andaman day gecko from all major islands in the Andamans, developed
new microsatellite markers and amplified mitochondrial markers to study population diversification.
We detected high allelic diversity in microsatellites, but surprisingly poor geographical structuring.
This study demonstrates that the Andaman day gecko has a panmictic population (K = 1), but with
weak signals for two clusters that we name ‘North’ (North Andaman, Middle Andaman, Interview,
Baratang, Neil, and Long Islands) and ‘South’ (Havelock, South Andaman, Little Andaman Islands).
The mitochondrial COI gene uncovered wide haplotype sharing across islands with the presence
of several private haplotypes (except for the Little Andaman Island, which only had an exclusive
private haplotype) signalling ongoing admixture. This species differs from two other Andaman
endemic geckos for which we provide comparative mitochondrial data, where haplotypes show a
distinct phylogeographic structure. Testing population history scenarios for the Andaman day gecko
using Approximate Bayesian Computation (ABC) supports two possible scenarios but fails to tease
apart whether admixture or divergence produced the two weak clusters. Both scenarios agree that
admixture and/or divergence prior to the onset of the last glacial maximum shaped the genetic
diversity and structure detected in this study. ABC supports population expansion, possibly explained
by anthropogenic food subsidies via plantations of cash crops, potentially coupled with human
mediated dispersal resulting in the observed panmictic population. The Andaman day gecko may thus
be a rare example of an island endemic reptile benefiting from habitat modification and increased
movement in its native range.
Populations evolve as a result of changing demographic characteristics influenced by habitat components and
structure, seasonal availability of resources, individual interactions, and other species-specific variables. While
vicariance biogeography posits stable species communities on islands over long periods, island biogeography
theory predicts high species turnover as a result of colonization and extinctions, but most empirical studies fall
in the intermediate zone with varying levels of geneflow and dispersal across neighbouring islands1. The resultant
complex demographic histories leave signatures in the genetic makeup of o rganisms2, where the genome func-
tions as an evolutionary memory of populations. Phylogeographic studies, especially on different co-distributed
species, can provide insights into historical and contemporary dispersal patterns and gene flow.
Continental islands are islands that share their geological history with a nearby continent and are of several
types based on their distance from the mainland and other associated features3. Species communities on con-
tinental islands are often similar to those on the adjacent mainland, yet differ greatly in genetic diversity and
1
Department of Evolutionary Biology, Zoological Institute, Braunschweig University of Technology,
38106 Braunschweig, Germany. 2Centre for Ecological Sciences, Indian Institute of Science, Bangalore 560012,
India. 3School of Biosciences, Cardiff University, Cardiff, Wales CF10 3AX, UK. *email: ashwinivm30@gmail.com
Scientific Reports | (2020) 10:11745 | https://doi.org/10.1038/s41598-020-68402-7 1
Vol.:(0123456789)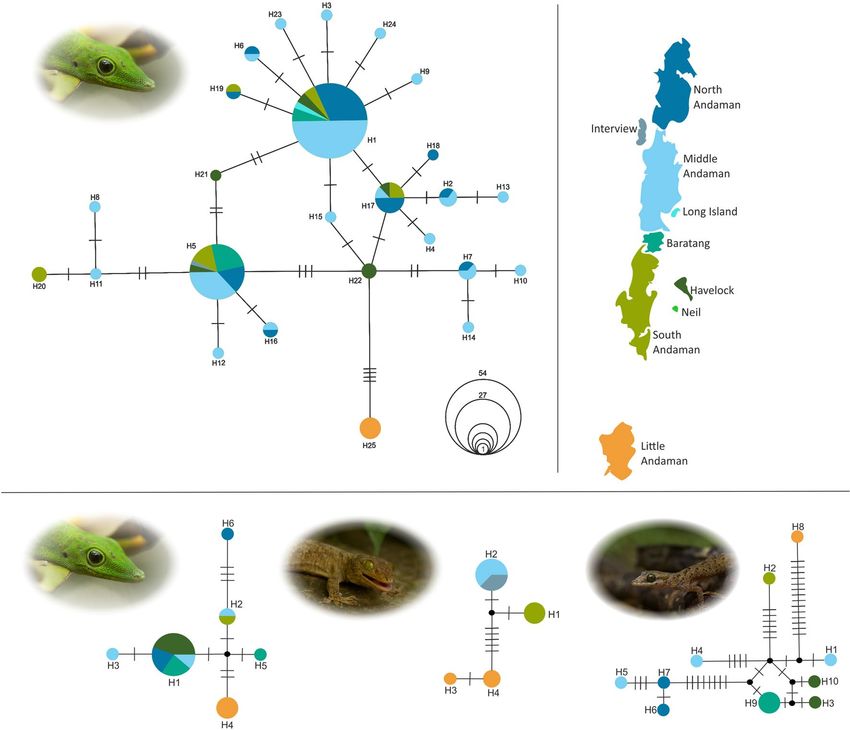
www.nature.com/scientificreports/
distribution, depending on the time of their separation, geographical proximity to mainland and island size, e.g.
Madagascar4 versus the Andaman and Nicobar I slands5. Madagascar is an isolated large continental island that
has been separated by larger sea distances and longer geological t imes3; the Andaman and Nicobar Islands are
continental outer arc i slands6 that have repeatedly been connected to mainland South East Asia during periods
of low sea level.
The Andaman and Nicobar Islands are rifted arc-raft continental islands7 and part of the Indo-Burma and
Sundaland biodiversity hotspots, respectively. These islands are part of a mountain chain extending from Cape
Negrais in Burma to Aceh, the northern tip of S umatra5,8,9. The Andaman Islands are separated from each other
by shallow sea of no more than 200 m depth10, and hence have been repeatedly connected during drops of sea
level, most recently in the Late Pleistocene5. This archipelago encompasses ~ 300 islands divided into two main
groups: the Greater Andamans to the north and Little Andaman to the south, separated by a shallow sea strait
named Duncan passage. Most islands in the Andamans share their species assemblages suggesting that the ter-
restrial species’ populations on different islands have regularly come in contact (see references [5] and [11] for
species distributions on different Andaman Islands). Although there have been repeated fluctuations in sea levels,
some of which could have connected the Andaman Islands to mainland South-East Asia, these islands still host
several endemic lineages, especially in their amphibian and reptile fauna5,9,11. The presence of a high proportion
of endemic taxa in these islands indicates that terrestrial lineages were separated long enough from their main-
land counterparts to have undergone speciation. There are just a handful of studies attempting to understand
the effects of relatively recent island separation on populations of endemic terrestrial fauna in the Andaman
Islands. Phylogeographic studies on four bat s pecies12 and the Andaman keelback snake (Fowlea tytleri (Blyth,
1863))13 showed substantial levels of genetic diversity, structure and varying degrees of inter-island population
differentiation in mitochondrial DNA.
The Andaman day gecko (Phelsuma andamanensis Blyth, 1861) is an exception to the biogeographical origins
of endemic lineages in the Andaman Islands. This species, endemic to the Andaman Islands, belongs to a genus
that likely evolved in Madagascar, ~ 6,000 km westwards across the Indian O cean14. Among the Western Indian
Ocean islands colonized by Phelsuma, the Seychelles are the closest to the Andamans in distance, yet the two line-
ages from the two archipelagos are not closely related in the Phelsuma phylogeny14, but phylogenetic relationships
between the deeper Phelsuma clades remain largely u nresolved14. The partial DNA sequences from a few genes
that have so far been used have rendered insufficient information to reliably reconstruct the evolutionary history
of the genus, possibly due to rapid radiation not providing enough time for accumulation of genetic mutations
and/or extinctions of key links between the main clades. However, studies have consistently found that the Anda-
man day gecko represents one of the oldest lineages in the genus Phelsuma14–17, i.e., it splits from one of the most
basal nodes in the phylogeny without any closely related sister species. Some of these studies had extensive taxon
sampling, representing almost all known species in the genus Phelsuma17 and therefore are unlikely to result
from unresolved relationships as a result of missing taxa. In this study, we aim to resolve deep clade relationships
within the genus Phelsuma by amplifying additional nuclear and mitochondrial markers. This is important as a
species’ biogeographic origin has a key role in its phylogeographic and population genetic processes.
Phelsuma day geckos have diversified in all the archipelagos they have r eached17–20, but it is not known
whether the Andaman lineage diversified after colonizing these islands. In contrast, the Mascarene Islands’
Phelsuma geckos provide a good example of diversification after colonization with one common ancestral lineage
giving rise to nine endemic species, two of which are now extinct15,19.
The Andaman day gecko inhabits tropical forests as well as human made banana (Musa sp.), coconut (Cocos
nucifera) and betel nut (Areca catechu) plantations21. Such diversity of habitat and colonization of human modi-
fied areas is also known from Phelsuma species on other islands18,22. In fact, coconut plantations host the highest
observed population densities of P. andamanensis as these areas are rich in food resources such as insects that are
attracted to the flower nectar21. Densities were observed to be lower in forests dominated by hardwood species,
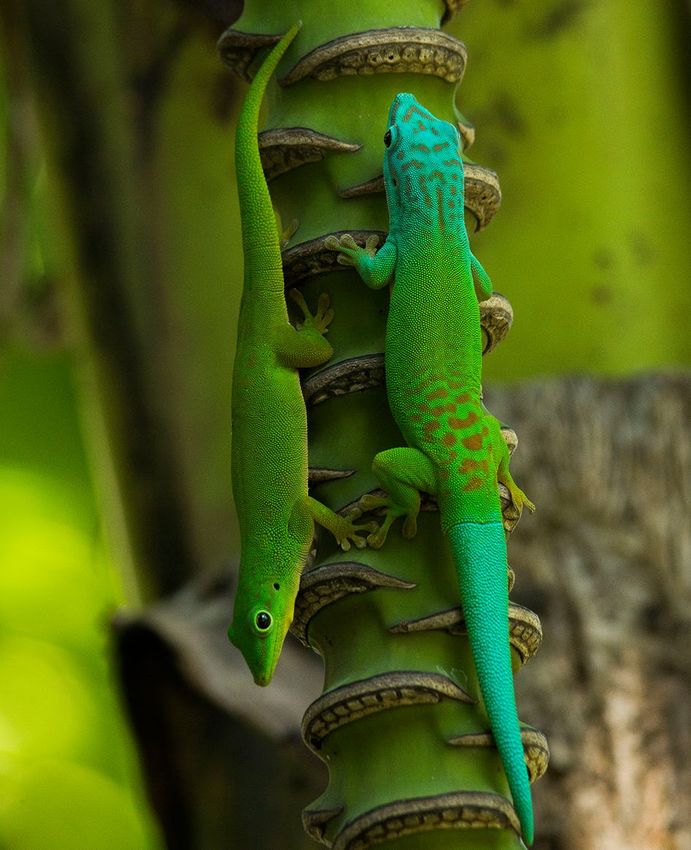
but this might be due to observation b ias21. This species is diurnal and sexually dimorphic; males are larger in
size with a bluish-turquoise tail and females smaller and are evenly green in c olour21 (Fig. 1).
While several species of Phelsuma have been studied in terms of diversification at the level of species and
populations23–25, the Andaman day gecko remains poorly studied. Considering the adaptability and higher densi-
ties of the Andaman day gecko in plantations, we hypothesize that these plantations could have facilitated popu-
lation expansion in larger, human-inhabited islands of the Andamans. We aim to assess genetic diversity within
the Andaman day gecko lineage and test various scenarios of population division, admixture and to calculate
population demographics. Considering the genetic diversity observed in similar spatial scales on the Seychelles,
we hypothesize that the Andaman day gecko has genetically structured populations across the Andaman Islands.
In order to address this question, we explore both mitochondrial DNA sequences and nuclear microsatellite
markers that were specifically developed for this study. Besides classical descriptive phylogeography a nalyses26,
we also apply more recent methods of statistical phylogeography which allow testing of explicit models of popu-
lation history using population demographic parameters, with Bayesian Markov Chain Monte Carlo (MCMC)
approaches27. Specifically, we apply Approximate Bayesian Computation (ABC) analysis jointly on microsatellite
markers and mitochondrial DNA sequences to elucidate the demographic history of the Andaman day gecko.
Comparative phylogeography has been key to understanding how lineages of different taxa respond to com-
mon geographical and geological events. Ancestrally co-distributed biota, which have undergone similar vicariant
events are expected to show similar spatial structuring of populations28. Other Gekkonidae in the Andaman
Islands include endemic species from South-East Asian genera like Cyrtodactylus and Gekko; and introduced
gecko species with largely oceanic distributions like the common house gecko (Hemidactylus frenatus Dum é ril
and Bibron, 1836) and the four-clawed gecko (Gehyra mutilata (Wiegmann, 1834))5. The endemic gecko species
almost always occur in similar natural and human-modified habitats as the Andaman day gecko, but differ in
microhabitat use and time of activity. The Andaman day gecko is an arboreal, diurnal species; the Andaman Giant
Scientific Reports | (2020) 10:11745 | https://doi.org/10.1038/s41598-020-68402-7 2
Vol:.(1234567890)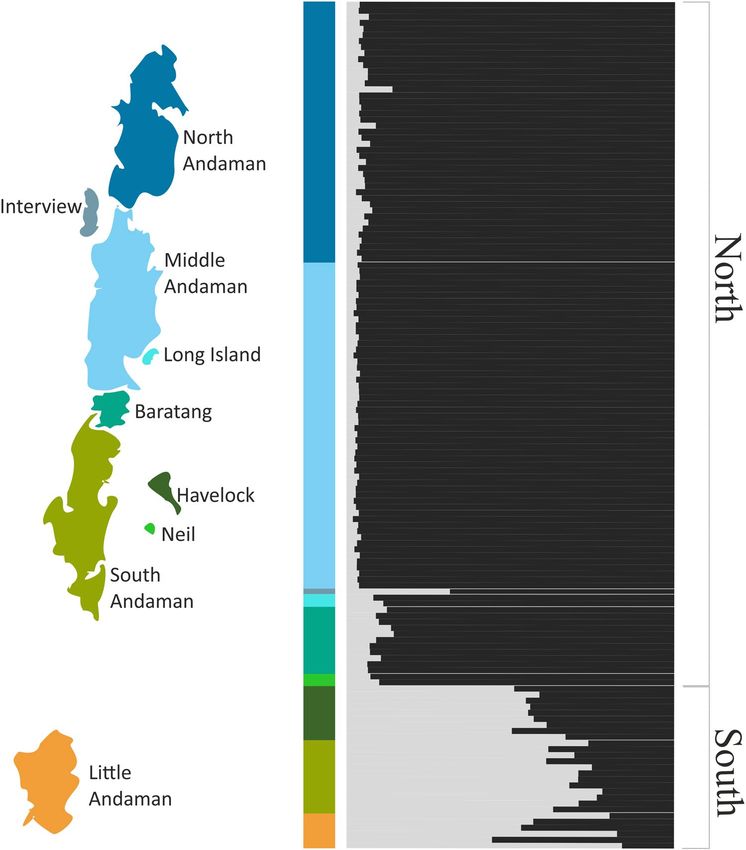
www.nature.com/scientificreports/
Figure 1. Female (evenly green) and male (turquoise head and tail) individuals of the Andaman day gecko
(Phelsuma andamanensis) from the North Andaman Island. Image from Sanjay Prasad used with permission.
gecko (Gekko verreauxi Tytler, 1865) is arboreal but nocturnal; and the Andaman bent-toed gecko (Cyrtodactylus
rubidus (Blyth, 1861)) is a ground dwelling species, often found in lower parts of thick trunks of native trees and
vespertine in activity. Extending our main focus on the Andaman day gecko, we also compare the mitochondrial
phylogeographies of these three gecko species, to understand whether the patterns observed in P. andamanensis
are singular for this species, or common to Andaman endemic squamates similarly influenced by geographical,
geological and anthropogenic factors.
Results
Phylogenetic position of the Andaman day gecko. A molecular phylogeny reconstructed using four
mitochondrial and nine nuclear genes from 15 species including the Namaqua day gecko [Rhoptropella ocellata
(Boulenger, 1885)] and Bradfield’s Dwarf Gecko (Lygodactylus bradfieldi Hewitt, 1932) as outgroups confirms
that the Andaman day gecko has an isolated phylogenetic position (Fig. 2). It splits from one of the most basal
nodes in the phylogeny as shown in previously published phylogenies of the genus Phelsuma14–17. However, we
find that this phylogeny is sensitive to change in calculation parameters which reflects the lack of support in
establishing deeper relationships in the genus Phelsuma. While a thorough time calibration of the Phelsuma tree
is beyond the scope of the present paper, previous studies (e.g.,29) placed the Phelsuma crown age at around 30
million years (MYA), and the TimeTree database (timetree.org; accessed 19 May 2020) estimated the divergence
between the Andaman day gecko and the Madagascar day gecko (Phelsuma madagascariensis Gray, 1831) at ~ 27
MYA30, suggesting that the Andaman day gecko is an ancient lineage.
Population genetics of the Andaman day gecko. From a newly developed microsatellite library for
the Andaman day gecko, we obtained data from 140 samples and 13 markers to analyse population genetic
diversity and structure. Fisher’s pairwise comparison of microsatellite markers to test linkage disequilibrium or
genotyping association within island populations showed no significant linkage between any pairs of markers
(FDRBenjamin-Yekutieli threshold p = − 0.010121; see Supplementary S2, Table 1). Genetic diversity was high, with an
average allele number of 23.7 and a mean expected heterozygosity of 0.92 (Table 1) and 7.4% of data from all 13
loci was missing/not usable.
The number of microsatellite alleles detected from each sampled island was correlated with sample size (see
Supplementary S2, Fig. 1 online), indicating that increased sampling efforts could detect a greater number of
alleles. Missing data was on average 9% per locus varying in the range between 0 and 60% with the highest per-
centage shown in the marker Pand9. Three of the 13 tested markers deviated significantly from Hardy Weinberg
Equilibrium (FDRBenjamin-Yekutieli threshold p = 0.015723; Supplementary S2; Table 2 online). Apart from the global
Hardy Weinberg test of markers, each marker was also tested for Hardy–Weinberg Equilibrium in every island
population (see Supplementary S2, Table 3 online). This test showed that only the Middle and North Andaman
Scientific Reports | (2020) 10:11745 | https://doi.org/10.1038/s41598-020-68402-7 3
Vol.:(0123456789)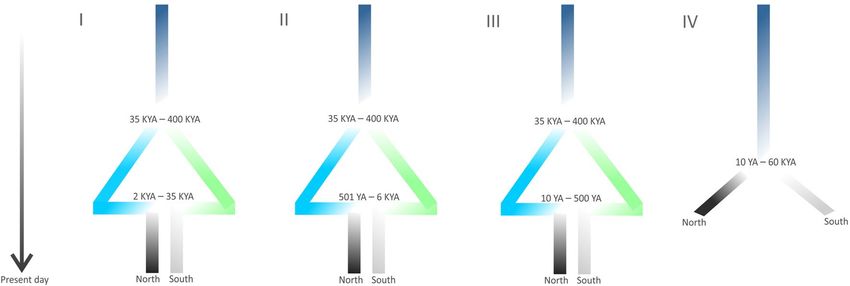
www.nature.com/scientificreports/
Figure 2. Maximum likelihood analysis of a concatenated alignment of 9,278 bp from 4 mitochondrial and
9 nuclear genes run 10 times, with 10,000 bootstrap replicates each. Black dotted nodes represent Maximum
Likelihood (ML) supported nodes with a support above 70% (other nodes received less support). Numbers
at the first two nodes are pairwise divergence time estimates (confidence intervals) obtained from Timetree.
org, shown as general indication of the likely time frame of Phelsuma diversification. Figure labelled using
CorelDraw Home & Student, X7 (https://www.coreldraw.com).
Observed range of PCR product
Marker name Forward primer Reverse primer Motif Expected PCR product size size
Pand_micro2 TTTGAGCAGGCAAGACAGAC AAGGTGCTAGACTAGATGGACC (AAAG)13 193 175–288
Pand_micro6 GCTCTATGAGAACCGCTATCAG TGGTGGAGGCTAATGAGGTATG (AATC)11 197 217–273
Pand_micro8 GAGGGAGACAACCAAGGAATAC GCTTTCTCTCTGCCTCATATGG (AAAG)11 242 244–350
Pand_micro10 GCATGAAGATGAGGTTAGAGGG CAGTTGATCCAGAGCTGTGTTC (AAAG)11 225 247–346
Pand_micro12 TCTTAGGCCCTATAACTCCTCC CAGCCCGTTGTCTTAGAGTATC (AAAG)14 250 279–383
Pand_micro13 CTCTTTGGACTCTGGACTCATG CCCATCCAAATACTAACCAGGG (ACAT)10 192 211–263
Pand_micro15 CAAGGTCTCCATGCATGTGTAC TATTCTAGGGAGGACAGGAACC (ATCC)12 222 226–338
Pand_micro16 CCTTCTCCTTTGGTGTACGATG CAACCAATGACTGCTAGGGAAG (AAAC)11 153 157–204
Pand_micro17 GTGAAAGTCCATCTACTGTGGC GTAGTGGTTAAGAGTGGCAGTC (ACAG)15 182 170–383
Pand_micro19 CGGATGTCTACAGTCTGAAGTG GGGCTCAGTAGTATAAGACCTG (AAAG)14 241 230–293
Pand_micro23 GTCAGACAATGTGAGGATCTCC CTCCTCCAAGTCATCTCCAAAC (AATC)13 172 177–272
Pand_micro4 TACCCACCATAGCTCCTTAG AGGAGTCCTTTGGTACCTTG (AAAG)13 155 165–248
Pand_micro9 CTGCCTTAATCTAGAAGCCCTC TAAGAGGGTAGGGTGGGTATTG (ATCC)15 215 207–274
Table 1. New Andaman day geckos (Phelsuma andamanensis) microsatellite primers Forward primer and
reserve primer columns provide the primer sequence and Motif shows the 4 bp repeat motif of each locus. PCR
product size is the expected value from the primer design procedure.
populations have one and two microsatellite markers significantly deviating from HWE (FDRBenjamin-Yekutieli thresh-
old p = 0.009357; see Supplementary S3, Table 3), respectively. Null alleles were detected in one marker (see
Supplementary S2, Table 5 online), Pand9, which was also one of the markers with high levels of missing data
and therefore inferences about presence of null alleles need to be carefully interpreted.
Overall, pairwise divergence between populations based on the microsatellite data was low ( FST = 0.009923,
p = 0.0001) but statistically significant, indicating island populations show a certain degree of differentiation.
Population pairwise F ST suggested the levels of differentiation are low, with 0.04 being the highest, between South
Andaman and Long Island, Interview Island (Table 3). The low Fixation index ( FST) value could be due to high
allele diversity in the microsatellite markers as this metric was designed for bi-allelic d ata31.
Cluster analysis with the program Structure32 using (1) all 13 microsatellite markers, (2) removing the marker
Pand9 (as it showed presence of null alleles and has high levels of missing data; see Supplementary S2, Fig. 3
online), consistently resulted in one cluster (K = 1) having the highest likelihood of explaining the data (see
Scientific Reports | (2020) 10:11745 | https://doi.org/10.1038/s41598-020-68402-7 4
Vol:.(1234567890)www.nature.com/scientificreports/
North Middle South Little
Andaman Andaman Havelock Baratang Andaman Andaman
Whole dataset (n = 47) (n = 50) (n = 9) (n = 11) (n = 12) (n = 6)
Locus NA He Ho He FIS He FIS He FIS He FIS He FIS He FIS
Pand2 27.00 0.92 0.75 0.93 0.12 0.91 0.22 0.78 0.29 0.93 0.00 0.92 0.36 0.95 − 0.10
Pand6 16.00 0.88 0.79 0.86 0.08 0.90 0.07 0.85 0.20 0.86 0.03 0.85 0.10 0.89 0.43
Pand8 25.00 0.94 0.84 0.94 0.03 0.93 0.14 0.95 0.04 0.93 0.10 0.92 0.17 0.92 0.06
Pand10 26.00 0.95 0.88 0.94 − 0.03 0.95 0.13 0.92 0.00 0.95 − 0.08 0.94 0.28 0.95 − 0.10
Pand12 29.00 0.95 0.82 0.93 0.20 0.94 0.09 0.91 − 0.01 0.91 − 0.02 0.93 0.00 0.88 0.42
Pand13 17.00 0.91 0.81 0.89 0.13 0.92 0.13 0.90 − 0.02 0.91 − 0.02 0.90 − 0.04 0.73 − 0.21
Pand15 26.00 0.94 0.80 0.94 0.15 0.93 0.16 0.93 0.01 0.91 − 0.02 0.91 0.16 0.94 0.27
Pand16 14.00 0.84 0.74 0.83 0.07 0.86 0.13 0.80 0.44 0.82 − 0.02 0.78 − 0.09 0.56 0.39
Pand17 49.00 0.96 0.88 0.97 0.06 0.96 0.13 0.97 0.18 0.94 − 0.09 0.97 0.12 0.98 − 0.06
Pand19 17.00 0.93 0.87 0.93 0.09 0.93 0.02 0.91 0.25 0.94 0.01 0.95 0.02 0.88 0.01
Pand23 20.00 0.91 0.83 0.92 0.16 0.90 0.05 0.85 − 0.08 0.93 0.00 0.89 0.24 0.92 − 0.14
Pand4 23.00 0.93 0.79 0.92 0.11 0.93 0.10 0.84 0.33 0.93 0.20 0.90 0.16 0.88 0.01
Pand9 19.00 0.84 0.53 0.83 0.53 0.90 0.18 0.68 0.33 0.86 0.25 0.31 0.45 0.73 0.53
Overall 23.69 0.92 0.79 0.91 0.13 0.92 0.12 0.87 0.15 0.91 0.03 0.86 0.15 0.86 0.12
Table 2. Genetic variation summary statistics Summary statistics of the genetic variation across markers
for island populations with more than two samples. NA = Number of Alleles, He = Expected heterozygosity,
Ho = Observed heterozygosity, FIS = Inbreeding Coefficient. Values in bold are statistically significant, inferred
using FDR correct p value (p = 0.009356887)
NorA 0.02 − 0.02 − 0.01 0.01 0.03 0.24 0.01 0.03
MA 0.00 0.06 − 0.02 0.03 0.03 0.09 0.02 0.08
Int 0.00 − 0.01 0.11 0.06 0.16 1.00 0.08 0.08
Long 0.00 − 0.01 0.00 − 0.06 − 0.01 0.11 − 0.04 0.08
BA 0.00 0.01 0.03 0.01 0.04 0.26 0.01 0.08
HA 0.01 0.02 0.02 0.03 0.01 0.16 − 0.01 0.11
Neil − 0.03 − 0.02 0.02 0.01 − 0.03 0.01 0.20 0.49
SA 0.02 0.03 0.04 0.04 0.02 0.02 − 0.02 0.07
LA 0.02 0.03 0.02 0.03 0.02 0.01 0.01 0.02
Table 3. Population pairwise FST calculated using microsatellite and mitochondrial (COI + 16S) data FST
values between populations estimated from the microsatellite data are shown in the lower left half of the
table, while GST values estimated from the mitochondrial DNA are shown on the upper right side. Samples
are grouped based on the island of origin and abbreviated as NorA: North Andaman, MA: Middle Andaman,
Int: Interview, Long: Long Island, HA: Havelock, BA: Baratang, Neil: Neil Island SA, South Andaman and LA:
Little Andaman. Values highlighted in the table correspond to significant divergences after FDR correction
(FDR corrected p = 0.01198).
Supplementary S2, Fig. 4 online). This result was also supported by re-running another clustering algorithm using
both admixture and no-admixture models implemented in r maverick33 (see Supplementary S2, Fig. 4 online).
Therefore, both Structure and rmaverick identified the best possible K as 1. However, at K = 2 using a location
prior model in S tructure34, individuals sorted into two geographically meaningful clusters with a posterior prob-
ability of > 0.50 showing that K = 2 is the second-best scenario to explain the contemporary population structure.
In other words, K = 2 shows that at the highest hierarchical level, the Andaman day gecko has a weak structure
of two populations occurring in the northern and the southern islands, hereon referred to as ‘North’ and ‘South’
clusters. The North cluster contains all islands except Havelock, South Andaman and Little Andaman (Fig. 3).
We subjected the dataset to clustering at higher values of K, i.e. K > 2 to determine how individuals segregate
with progressively larger values of the number of clusters (see Supplementary S2, Fig. 5), but they showed no
clustering. Microsatellite markers evolve at a faster rate than mitochondrial markers and hence they may not be
able to detect more ancient historical population structure, even if traces of such structure may still be recogniz-
able in the distribution of mitochondrial haplotypes.
Testing best fit population demographic models through Approximate Bayesian Computa‑
tions (ABC). The molecular analyses of the Andaman day gecko described above suggested (1) absence of
strong phylogeographic structure both from mitochondrial DNA and microsatellites, (2) limited divergence
Scientific Reports | (2020) 10:11745 | https://doi.org/10.1038/s41598-020-68402-7 5
Vol.:(0123456789)www.nature.com/scientificreports/
Figure 3. Population clusters identified using microsatellite alleles of the Andaman day gecko (Phelsuma
andamanensis) (K = 2). Individuals are colour coded based on the island of their origin. North and South
clusters are identified on the right. Composite figure produced in CorelDraw Home & Student, X7 (https://www.
coreldraw.com), map created for graphical representation only and is not to be scaled.
among mitochondrial haplotypes, and (3) a signal for two weakly defined and possibly geographically admixed
genetic clusters (North and South). Informed by these analyses, we defined four evolutionary and demographic
scenarios (Fig. 4) and tested these using ABC models by incorporating both microsatellite and mitochondrial
sequence data. Microsatellite data included 13 microsatellite markers, sequenced from 140 individuals of the
Andaman day gecko, whereas the mitochondrial data comprised COI sequences from 123 individuals. These
four alternative demographic scenarios were compared to determine the most likely ancestral demographic his-
tory explaining the weak signal of a partition into two clusters.
Among the four scenarios tested, scenarios II and III received support of less than 2%, indicating that these
two weak clusters were a result of older events. Scenarios I and IV had a similar statistical support [~ 47.7% (95%
CI 4.8–50.7%) and 51% (95% CI 48.2–53.8%), respectively] using the logistic regression approach implemented
in DIY-ABC. However, the Direct Approach (a count of the occurrences of each model across the most similar
simulations to the observed data) indicates that scenario I is slightly more likely. On the other hand, the prob-
abilities, and 95% CIs of scenarios I and IV are largely overlapping [52% (95% CI 9–96.6%) and 35.6% (95% CI
0–77.6%), respectively]. While this implies that scenario II and III are not likely to describe the genetic variation
observed in this study, there is no clear evidence to distinguish between the scenarios I and IV (Fig. 4, Table 3).
The main difference between scenarios I and IV was the presence of admixture in scenario I that does not feature
in scenario IV. Overall, the parameter estimations for both scenarios are quite similar (Table 3) with the North
cluster having a larger effective population size than the South cluster. In both the scenarios, the North and
South clusters have a larger effective population size than that of their ancestral populations indicating a popu-
lation expansion post their divergence. In fact, the time of admixture inferred from scenario I (~ 27,400 years
Scientific Reports | (2020) 10:11745 | https://doi.org/10.1038/s41598-020-68402-7 6
Vol:.(1234567890)www.nature.com/scientificreports/
Figure 4. Schematic of the four demographic models tested to explain the North and South clusters identified
with the nuclear markers. Time is measured from the past (top) towards the present (bottom). Scenario I, II and
III consist of an ancestral population (dark blue) that splits into two derived populations sometime between
35,000 years ago and 400,000 years ago giving rise to the precursors of the northern and southern genetic
clusters. The difference between these three scenarios is the time at which an admixture event, with equal
contributions of both populations, occurred between the two ancestral precursor clusters and which resulted
in the current North and South clusters. Scenario IV consisted of an ancestral population splitting into two
forming the North and the South cluster sometime between 10 YA and 60 KYA. KYA: time of divergence in
thousands (kilo) years ago. YA: years ago. Figure produced in CorelDraw Home & Student, X7 (https://www.
coreldraw.com).
ago—95%CI 884–34,400 years ago) is largely overlapping with the estimated time of divergence of the simpler
model in scenario IV (~ 23,600 years ago (95%CI 711–55,900 years ago). Consequently, it is likely that the statis-
tical power to infer evolutionary history further in the past, i.e., beyond the most recent divergence/admixture
event affecting the North and South genetic clusters is small with this dataset.
Comparative phylogeography of Andaman endemic Gekkonidae. The 314 bp mitochondrial
DNA sequences of the cytochrome oxidase subunit I gene (COI) from 123 Andaman day gecko (P. andamanen-
sis) individuals detected 25 haplotypes with an overall nucleotide diversity (Pi) of 0.0071 and haplotype diversity
(Hd) of 0.756. Maximum uncorrected p distance among COI sequences was 1.6% between individuals sampled
on Baratang and Little Andaman. We found 28 polymorphic sites and a total of 29 different mutations. Among
the 25 recognized COI haplotypes, 19 were detected in individuals from the Middle Andaman and among these,
12 were private alleles (Fig. 5). All individuals from the Little Andaman showed a single haplotype, private to
that island (Fig. 5). The North Andaman and South Andaman island populations had one private allele each, in
addition to common haplotypes that were detected in other island populations. From individuals on Havelock,
we detected two private alleles and five haplotypes in total. Among the individuals sampled in the islands of
Baratang, Long and Interview, we only detected common haplotypes on Middle Andaman and other islands.
To allow direct comparability with other geckos for which only sequences of the mitochondrial 16S rRNA
gene were available, we sequenced a 463 bp segment of this gene for 17 individuals of the Andaman day gecko. We
detected six different 16S haplotypes (Fig. 5), four of which were private alleles from isolated human settlements
in the northern part of the North Andaman, Little Andaman, Middle Andaman and Baratang, respectively. H1
was the most frequent haplotype detected from four islands and the maximum uncorrected p distance was 0.9%
(see Supplementary S2, Table 4 online). Although this may seem a low number of haplotypes when compared
to COI, the probability of observing 6 haplotypes in a sample of 17 COI sequences is ~ 40%, indicating that both
markers harbour similar levels of diversity (see Supplementary S2, Fig. 2 online).
Contrastingly, from 13 individuals of the Andaman bent-toed gecko (Cyrtodactylus rubidus) we detected 10
haplotypes in a 480 bp segment of the 16S rRNA gene, none of which were widespread, and all sampled islands
showed private alleles (Fig. 5). The maximum pairwise uncorrected p distance calculated from this taxon’s 16S
sequences was 1.83% (see Supplementary S2, Table 4 online). Not only did the islands all have unique haplotypes,
but they were all more genetically distinct from each other than the haplotypes of the Andaman day gecko; for
instance, the haplotype detected on Little Andaman Island had 14 bp differences from the closest median vector
(Fig. 5) compared to 2 bp difference in the Andaman day gecko (Fig. 5).
From 12 individuals of the Andaman giant gecko (Gekko verreauxi) sequenced for 516 bp of the 16S rRNA
gene, we found four haplotypes with a maximum uncorrected p distance of 1.16% (see Supplementary S2, Table 4
online). Three of these haplotypes were private, two of them being from Little Andaman Island (Fig. 5).
The visualization of genetic structure obtained from mitochondrial markers and microsatellite markers across
different island populations resulted in non-concordant results (see Supplementary S2, Fig. 7 online). This is
expected considering differences in their inheritance pattern and rate of evolution. While the COI dataset sug-
gested an area of population differentiation between the the Greater Andamans and Little Andaman, the pairwise
comparison values in the microsatellite allele sharing matrix suggests geographically non-structured allele sharing
(see Supplementary S2, Fig. 7 online) concordant with a panmictic population. In other words, mitochondrial
DNA suggests that the population on the Little Andaman Island shows the highest difference from the rest of the
Scientific Reports | (2020) 10:11745 | https://doi.org/10.1038/s41598-020-68402-7 7
Vol.:(0123456789)www.nature.com/scientificreports/
Figure 5. Top: Haplotype network from DNA sequences of 314 bp of the mitochondrial COI gene for 123
individuals of the Andaman day gecko (Phelsuma andamanensis) sampled across the Andaman Islands.
Haplotypes are colour coded based on the island on which an individual was sampled; the size of the circles in
the haplotype network corresponds to haplotype frequencies whose scale is provided in uncoloured circles; each
cross bar in the network represents a mutation and black points correspond to median vectors generated during
the construction of the Median-Joining haplotype network. Bottom: Haplotype networks from DNA sequences
of the mitochondrial 16SrRNA from three species of gecko endemic to the Andaman Islands. left: the Andaman
day gecko (Phelsuma andamanensis); centre: the Andaman bent toed gecko (Cyrtodactylus rubidus); right: the
Andaman giant gecko (Gekko verreauxi). Composite figure produced in CorelDraw Home & Student, X7 (https
://www.coreldraw.com), map created for graphical representation only and is not to be scaled.
island populations in the Andamans. On the other hand, the microsatellite markers suggests that populations
are quite admixed with comparable sequence divergences across all the Andaman Islands.
Discussion
The updated molecular phylogeny of the genus Phelsuma presented herein confirms that the Andaman day gecko
is one of the oldest lineages in this genus (Fig. 2). Our molecular phylogeny even suggests that it is sister to all
other clades of Phelsuma spp., However, a full taxon sampling and more genetic data are necessary to resolve
these deep relationships with more confidence. We do note that the isolated position of P. andamanensis is also
supported by an ongoing phylogenomic study (A. Mohan, M. Vences, unpubl. data). This indicates that the
ancestors of this species may have originated in Madagascar, as is likely for other major clades of this genus16,24.
Nevertheless we do not draw biogeographical inferences from our phylogenetic tree, rather use it to illustrate
that the Andaman day gecko is an old lineage whose divergence approximates the crown age of Phelsuma diver-
sification, which in previous studies was estimated between 43–35 MYA(Fig. 2).
The sheer number and variation of mitochondrial haplotypes detected in the Andaman day gecko refutes
the possibility of a non-Andamanese origin and human mediated introduction of this lineage to the Andaman
Islands (from an as of yet unknown, or extinct, source population elsewhere). The early humans of the Anda-
man Islands arrived via Southeast Asia less than 26,000 years a go35,36. Despite the uncertainties in the human
colonization history of the Andaman Islands (via South Asia or South-East Asia), we see no possibility for
Scientific Reports | (2020) 10:11745 | https://doi.org/10.1038/s41598-020-68402-7 8
Vol:.(1234567890)www.nature.com/scientificreports/
Scenario 1 Scenario 4
Parameter Mode q025 q975 Mode q025 q975
N1 2.42e6 1.14e6 7.81e6 3.74e6 1.60e+006 7.85e+006
N2 3.34e5 1.33e5 9.45e5 4.19e5 1.52e+005 9.51e+005
N3 1.16e4 3.91e3 3.37e5
N4 2.16e4 6.75e3 3.42e5
t-admix 2.76e4 8.84e3 3.44e4
t-div 1.53e5 4.84e4 3.84e5 2.36e4 7.11e+003 5.59e+004
NA 1.63e4 9.28e3 8.03e5 2.14e4 2.14e+004 4.65e+005
useq_1 1.78e−8 1.2e−8 1.54e−7 1.11e−008 1.09e−008 3.51e−008
k1seq_1 6.41e0 1.54e0 2.87e1 5.28e+000 1.14e+000 2.79e+001
µmic_1 1.00e−4 1.00e−4 2.4e−4 1.00e−004 1.00e−004 2.17e−004
pmic_1 1.00e−1 1.00e−1 2.72–1 1.00e−001 1.00e−001 2.67e−001
snimic_1 1.00e−8 1.00e−8 2.31–6 1.00e−008 1.02e−008 8.85e−007
Table 4. Posterior probabilities for each of the demographic parameters of the scenarios one and four 95%
confidence interval range are shown as lower boundary q025 (2.5%) and upper boundary q0975 (97.5%). N1
is the North population effective population size and N2 is that of the South population. N3 is the precursor
population of the North population (before admixture) and N4 is the precursor population of the South
population (before admixture). t-admix is the time of admixture and t-div is the time of divergence between
the north and south lineages. NA is the ancestral effective population size. useq is the mitochondrial sequence
mutation rate, k1seq is the number of haplotypes, µmic is the microsatellite mutation rate, and pmic and snimc
are the larger than one step proportion of mutations and the non-standard mutation rate (e.g. indels).
human-mediated introduction of this species to the Andaman Islands. Therefore, our study strongly suggests
that the genus Phelsuma colonized the Andaman Islands naturally, without the aid of humans.
Microsatellite markers developed in this study are a valuable resource to study and monitor the genetic
variation in the Andaman day gecko due to the high polymorphism and largely independent segregation of
these markers. We interpret the observed high polymorphism as reflecting population demographic processes
rather than linkage in the genome. Among microsatellite markers, markers with null alleles are known to be
potentially informative in analysing number of clusters and population s tructure37. In our study, the inclusion
of the one marker that may include null alleles did not affect the results (see Fig. 3 vs. Supplementary S2, Fig. 3
online). Testing island populations for HWE indicated that only North and Middle Andaman populations had
one and two markers that deviated from HWE. Even though results of allele distribution and richness could
change with sampling in the Jarawa Tribal Reserve (northern parts of the South Andaman), they will not reduce
the recognized levels of diversity and differentiation in this study.
Microsatellite markers suggest that the Andaman day gecko currently has a single panmictic population on
the Andaman Islands, as indicated by a high likelihood value for K = 1 in Structure (see Supplementary S2, Figs. 4,
5 online). Model comparison between admixture and no-admixture models in rmaverick did not provide clear
support to either of the models indicating that there is neither clear admixture nor complete lack of admixture
between island populations. This could also reflect a complex population demographic scenario such as repeated
admixture and vicariance in the past. The second-best partition (K = 2) detected two poorly differentiated, yet
geographically meaningful clusters in Structure (Fig. 3). The ’South’ cluster consists of individuals sampled on
South Andaman, Little Andaman, and Havelock; the ‘North’ cluster consists of individuals sampled on North
Andaman, Middle Andaman, Interview, Long, Neil and Baratang islands. This potentially indicates that popu-
lation structure could have existed prior to the admixture detected, which we believe is a result of very recent
processes fuelled by inter-island trade of food, coconut and banana saplings. Therefore, we considered the ‘North’
and ‘South’ clusters (Fig. 2) to test population divergence and admixture events at different points of time in the
history of the Andaman day gecko populations.
Modelling the evolutionary history of the two clusters of the Andaman day gecko using ABC excluded a
recent admixture between the North and South clusters resulting in a panmictic population across the sampled
Andaman Islands (K = 1). The two supported models agree with respect to the time period in which the current
pattern of weakly defined North and South clusters was formed. Scenario I (Fig. 5) supports a divergence time
in the previous interglacial period (~ 153,000 years ago), followed by admixture prior to the onset of the last
glacial maximum (~ 27,600 years ago). Contrastingly, scenario IV supports a divergence estimate also prior to the
onset of the last glacial maximum (~ 23,600 years ago). However, it was not possible to statistically differentiate
between the admixture model or the vicariance model giving rise to the North and South clusters (see scenario
I and IV, Fig. 5). One possible explanation for not being able to tease the two scenarios apart could be that the
Andaman day gecko populations have a complex divergence and admixture history due to repeated rise and fall
in sea levels. The current population genetic composition showing signs of weak North and South clusters would
be a result of the last vicariant divergence/admixture event, and earlier patterns of genetic diversity or structure,
in this hypothesis, could have been partly or completely overridden by this event. The last admixture/vicariant
event detected in this study is estimated to have occurred prior to the onset of the rise in sea level38 in the Late
Scientific Reports | (2020) 10:11745 | https://doi.org/10.1038/s41598-020-68402-7 9
Vol.:(0123456789)www.nature.com/scientificreports/
Pleistocene. Considering the putative complexity of repeated vicariance and admixture events in the Pleistocene
glacial cycles, even comprehensive genomic data may fail to reconstruct these demographic processes in detail.
Mitochondrial DNA revealed substantial divergence among haplotypes that is likely indicative of earlier
diversification processes, and this is also supported by the rather early divergence event estimated in scenario
I of the ABC models (Fig. 4). The presence of an exclusive haplotype on the Little Andaman with a distance of
5 bp from all other haplotypes provides a clear indication for a geographic component in these earlier processes
(Fig. 5). A comparison with two other endemic gecko species revealed that the amount of mitochondrial variation
across the Andaman Islands is similar for the Andaman day gecko and the Andaman giant gecko, but phylogeo-
graphic structure is more obvious in the latter. The Andaman bent-toed gecko has a much larger mitochondrial
variation, but an equally strong phylogeographic structure as observed by the distribution of haplotypes detected
and number of mutational steps between haplotypes (Fig. 5). Considering these results, we hypothesize that the
phylogeographic patterns in populations of the Andaman day gecko also arose by vicariance, but recent events
have subsequently blurred this original phylogeographic signal. This may include repeated vicariance/admixture
during glacial cycles as discussed, but also anthropogenic influences.
In comparison with the Andaman day gecko, the other two species included in this study show haplotype
networks that are more typical of geographically structured populations with limited gene flow and longer iso-
lation (Fig. 5), even in the Greater Andaman Islands. A study on the Andaman Keelback (Fowlea tytleri) also
detected structured populations through mitochondrial p hylogeography13. However, all four species, includ-
ing the Andaman Keelback, show unique haplotypes on Little Andaman, reflecting more restricted gene flow
between Little Andaman and other islands (Fig. 5). A study on bats of the Andaman Islands also found unique
mitochondrial haplotypes on Little Andaman Island in three s pecies12. However, considering the microsatellite
allelic diversity and distribution in island populations of the Andaman day gecko, we speculate that haplotypes
from other islands could be present in Little Andaman and could be detected through more extensive sampling.
But the mitochondrial haplotype network does not reflect complete admixture similar to the microsatellite mark-
ers, it rather reflects ongoing admixture as several private haplotypes still persist in island populations (Fig. 5).
Further, the lack of median joining vectors in the COI network also confirms extensive sampling and that all
ancestral haplotypes linking island populations have been detected.
Although mitochondrial allelic diversity is high in the populations of the Andaman day gecko, their geo-
graphic distribution is poorly structured compared to other reptile species included in this study (Fig. 5). We
hypothesize that the differences in population structure of the three species of geckos are caused by a combina-
tion of differences in their ecological traits and susceptibility to human-mediated dispersal. The Andaman day
gecko is active by day and is primarily found in high densities in banana, coconut, and areca nut plantations. On
the other hand, the Andaman bent-toed gecko is vespertine and is mostly ground dwelling, only climbing tree
trunks up to 1–2 m. The Andaman giant gecko can be found inhabiting the canopy of tall, evergreen trees and
inside human constructed structures on high walls or tiled ceilings. Due to the direct association of the Anda-
man day gecko with plants, reproductive parts of plants (banana inflorescences and fruit clusters) and trees in
plantations, individuals of this species and their eggs could be dispersed more easily through sapling or food
trade between islands.
Differences in ecological traits between the Andaman day gecko and the other species support the hypothesis
that early human settlers of the Andamans could have facilitated dispersal of the Andaman day gecko, especially
within the Greater Andaman Islands. The Jarawa tribe for example, are known for their extensive use of plants
including forest p alms39 which could be used by the Andaman day gecko. The Little Andaman tribe, the Onge
people however were restricted to the Little Andaman and surrounding i slands36. Therefore, the larger expanse
of ocean, higher geographical distance, and lack of movement in early human settlers could have all influenced
the mitochondrial distinctness of the Little Andaman Island populations.
Notably, our study shows the possible role of modern human colonizers in the observed genetic diversity and
distribution of the Andaman day gecko due to the introduction of plantations and increased movement between
islands. This is supported both by the expanding population demographics estimated by ABC models (Table 3)
and a completely admixed population detected as the most probable cluster using microsatellite markers (K = 1)
(see Supplementary S2, Figs. 4, 5 online). A recent study also reported the Andaman day gecko in the Nicobar
Islands for the very first t ime40. Production of food for human consumption, such as banana and cash crops like
betel nut and coconut have certainly provided an easy access to alternative high energy food sources that facili-
tated the existence of high densities of Andaman day gecko in plantations ( see21). Such alternative food sources
for animals, which are a result of human induced changes can be considered as anthropogenic food subsidies,
and may have altered food chains and e cosystems41. Individuals of the Andaman day gecko have been spotted
among saplings in boats and s hips21 and some individuals/eggs could get transported along with banana fruits
to the local markets. Such high densities of Phelsuma geckos are not seen in only the Andaman Islands; a study
in Madagascar on other species of Phelsuma has shown that the encounter rate for three species was higher in
fragmented and agricultural lands than in forests22. This study concluded that adaptive generalist day gecko spe-
cies may benefit from anthropogenic disturbances while specialized species experience negative impacts of habitat
fragmentation. The Andaman day gecko qualifies as a generalist species adapting to different habitats and micro-
habitats despite anthropogenic stress. The impacts of anthropogenic food subsidies on the Andaman day gecko
remains to be explored; however, our ABC models do suggest that the population sizes have expanded (Table 3).
The Andaman Islands present a system of continental islands that are proximate to mainland Southeast Asia,
yet harbour high levels of e ndemism5. In this study, we show that the only Malagasy component of the Andaman
Islands is one of the oldest species of the genus Phelsuma (Fig. 2). The Andaman day gecko is characterized by
high levels of allelic diversity both at mitochondrial and nuclear microsatellite markers, but a distinctly lower
phylogeographic structure than that of other co-occurring geckos. Our results agree with Heaney’s1 assump-
tion that the amount of gene flow and dispersal varies between superficially similar, co-distributed taxa and that
Scientific Reports | (2020) 10:11745 | https://doi.org/10.1038/s41598-020-68402-7 10
Vol:.(1234567890)www.nature.com/scientificreports/
Figure 6. Sampling map of the Andaman day gecko (Phelsuma andamanensis) on the Andaman Islands. White
points are the localities sampled for this study. Map produced in GeoMapApp (https://www.geomapapp.org/)
and labelled using CorelDraw Home & Student, X7 (https://www.coreldraw.com).
the differences in their ecology can create substantial differences in gene flow between neighbouring islands. ABC
models favour change in sea levels having strongly influenced the admixture or vicariance events in the past. But
a single expanding panmictic population of the Andaman day gecko detected in this study could be a result of
more recent anthropogenic changes to their habitats and human mediated dispersal across different islands of
the Andaman Archipelago. These factors have not only resulted in demographic expansion but have also poten-
tially blurred signals of a putative geographical differentiation that may have arisen through earlier processes.
Methods
Study area and sampling. The Andaman Islands are located between 13.66oN, 93.00oE and 10.54oN,
92.46oE and receive an annual rainfall of 3,000–3,500 mm42. The topography is flat with low elevation hills,
except the Mount Harriet National Park (383 m) in South Andaman Island and the Saddle Peak National Park
(732 m) on North Andaman Island.
We sampled the Andaman day gecko (Phelsuma andamanensis), Andaman bent-toed gecko (Cyrtodactylus
rubidus) and the Andaman giant gecko (Gekko verreauxi) from 10 islands of this archipelago, including two non-
human inhabited islands (Fig. 6). Study permits to work on these islands and to sample geckos were issued by the
Department of Environment and Forests, Andaman and Nicobar Islands (Permit No.: CWLW/WL/134(A)/517),
and this permit included all aspects of field work and sample collection. Field sampling was conducted between
October 2016 and May 2017 which spans the North-east monsoon period (October–December) and the summer
season (Feb–April) in the Andaman Islands. Sampling for the Andaman day gecko was primarily carried out in
betel nut, coconut and banana plantations as the forests generally encompassed tall evergreen species and this
species occurs at much lower densities in forests21. The sampling sites were distributed throughout the major
Scientific Reports | (2020) 10:11745 | https://doi.org/10.1038/s41598-020-68402-7 11
Vol.:(0123456789)www.nature.com/scientificreports/
islands excluding the Jarawa tribal reserve. The reserve, home to the Jarawa tribe, spans just over 1,000 sq. km
including areas in South and Middle Andaman Islands43 and access is prohibited. The elevation in sampled
points ranged from ca. 1 to 75 m above sea level. A team of two to four personnel conducted opportunistic visual
encounter surveys between 8:00 and 11:00 h and 14:00 to 16:00 h. Upon locating and capturing the Andaman
day gecko, we recorded the geographical location (using a Garmin GPSMAP 64) with an accuracy of 2–5 m.
We used a bamboo stick or other wooden equipment to tap the lizards as a result of which they would drop
(autotomize) parts of their tails. We collected their tails and stored them in 99.99% laboratory grade ethanol.
We noted the sex of individuals without capture as this species is sexually dichromatic with males showing a
turquoise blue tail (Fig. 1). Therefore, we avoided capturing individuals ensuring minimal stress to the animal. In
the few cases where individual capture was necessary, we used sterilized surgical steel scissors to cut the tail tip
(up to 15 mm from the tip). After collecting the tissue, we sterilized the open wound and allowed the individual
to settle for a few minutes before releasing them at the capture site. The time taken in handling individuals did
not exceed 3–5 min. Note that as in most lizards, the autotomized/cut tail tips will naturally regenerate. The
tissue samples were deposited at the Centre for Ecological Sciences, Indian Institute of Science, Bangalore. This
handling protocol was approved by the Department of Environment and Forest, Andaman and Nicobar Islands
Research Advisory Committee and adheres to international Animal Care and Use guidelines. All the collected
samples, with field labels and GPS location of collection are tabulated. (see Supplementary S1, sheet 1 online).
Phylogenetic position of the Andaman day gecko. Previously published molecular marker datasets
were downloaded from NCBI (see Supplementary S1, sheet 2 online) and new markers were added by amplifi-
cation through PCR and sequencing carried out specifically for this study. As our aim was to show the relative
position of the Andaman day gecko in the genus, we only selected one representative species from each of the
previously recognized Phelsuma clades14. In addition to the published data, we amplified portions of the genes
for KIAA1239 (a long stretch of DNA coding for proteins involved in several cellular processes) with the primers
KIAA1239-F1, KIAA1239-R1, KIAA1239-NF1 and KIAA1239-NR1; Spastic Ataxia Of Charlevoix-Saguenay or
Sacsin (SACS) using primers SACS-F1, SACS-R1, SACS-NF1 and SACS-NR1, and Titin (TTN) with the primers
TTN-F1, TTN-R1, TTN-NF1 and TTN-NR144. All the three additional markers were amplified using a two-
step, nested PCR44. Additional sequences of portions of the genes for Phosducin (PDC), Brain Derived Neu-
rotrophic Factor (BDNF), Acetylcholinergic receptor M4 (ACM4) and Cytochrome c oxidase subunit I (COI)
were amplified for species to fill gaps in the dataset available online (see Supplementary S1, sheet 2 online). We
utilized the primers PHOF2 and PHOR145 to amplify a portion of the PDC gene, BDNF-F2 and BDNF-R246
for BDNF, tg-F and tg-R p rimers47 for ACM4 and the afore mentioned primers for COI. A dataset contain-
ing 15 taxa, including outgroups and a concatenated sequence totalling 9,278 bp was used to reconstruct the
phylogenetic relationships presented in this study. The phylogenetic relationships among the selected taxa were
reconstructed using a GTR model of sequence evolution, with the thorough bootstrap algorithm of 10 runs and
10,000 iterations in RaxML48.
Population genetics of the Andaman day gecko based on microsatellite markers. We
sequenced 15 microsatellite markers from 141 individuals of this species sampled across 10 islands of the Anda-
man Archipelago. A tail clip sample of one individual of the Andaman day gecko was used for the development
of species-specific microsatellite markers. This process was carried out in the Sequencing Genotyping Facility
at the Cornell Life Sciences Core Laboratory Centre (CLC), U.S.A. (commercial facility). To summarize the
protocol, genomic DNA was extracted from the tail tip tissue and restriction enzymes were used to digest the
DNA and Illumina TruSeq adapters were ligated to the digested DNA. Through magnetic capture and hybridiza-
tion of biotinylated repeat probes (representing two unique dimers, five unique trimers, seven unique tetramers
and two unique pentamers), the fragments were enriched for microsatellites. The DNA fragments were then
amplified and barcoded by Polymerase Chain Reaction (PCR), then sequenced in the Illumina MiSeq sequencer
(2 X 250 bp paired reads). The library consisted of minimum consecutive perfect repeat lengths of at least six
(12 bp) for dimers and at least five for trimers, tetramers, pentamers and PCR products whose size was between
150–500 bp. The full library generated using the above method is given (see Supplementary S3 online), but the
microsatellite markers used in this study were further shortlisted based on the following categories: (1) tetra-
meric, (2) repeat motif between 10 and 15, (3) less than 1,000 reads, as deep coverage could indicate multiple
copies and (4) GC content of 50 (Table 4)49. The microsatellite marker amplification was done using the nested
protocol with the following steps: 900 s of initial denaturation at 94 °C, 30 cycles of 94 °C (30 s), 60 °C (45 s),
72 °C (45 s), followed by 8 cycles of 94 °C (30 s), 53 °C (45 s), 72 °C (45 s), and a final elongation step of 600 s
at 72 °C50. 25 markers were shortlisted after the filtering steps (see Supplementary S3 online) and among the 25
markers, 15 markers resulted in reliable bands on the Agarose gel electrophoresis step. These 15 markers were
further used to amplify microsatellite alleles from all samples of the Andaman day gecko available for this study.
Total genomic DNA was extracted from the tissue samples using proteinase K digestion (10 mg/ml concen-
tration) followed by a standard salt-extraction p rotocol51. We amplified all microsatellite markers following the
nested protocol of Schuelke (2000), but instead of using the M13 sequence we linked the Illumina sequencing
primer sequence FAM (ACACTCT TTCCCTACACGACGCTCT TCCGATCT) to all forward primers. This is a
modified M13 approach. We diluted the PCR product with 15 μl of RNase-free water and pipetted 1 μl diluted
product to a genotyping plate. We then added 15 μl of Genescan 500–ROX size standard (Applied Biosystems)
and analysed fragments in ABI 3130xl Genetic Analyzer. Microsatellite data were scored by creating custom-
ized data panels in the program Gene marker v1.95 (https://softgenetics.com/GeneMarker.php). For a subset of
samples ~ 50, we repeated the PCR 3 times and they were carried out by 3 different persons to check and compare
the peaks to ensure repetition gave consistent peaks. Data panels were created by observing concordant peaks at
Scientific Reports | (2020) 10:11745 | https://doi.org/10.1038/s41598-020-68402-7 12
Vol:.(1234567890)You can also read