A hexokinase isoenzyme switch in human liver cancer cells promotes lipogenesis and enhances innate immunity - Nature
←
→
Page content transcription
If your browser does not render page correctly, please read the page content below
ARTICLE
                   https://doi.org/10.1038/s42003-021-01749-3                OPEN

                  A hexokinase isoenzyme switch in human liver
                  cancer cells promotes lipogenesis and enhances
                  innate immunity
                  Laure Perrin-Cocon 1,9, Pierre-Olivier Vidalain 1,9, Clémence Jacquemin1, Anne Aublin-Gex 1,
                  Keedrian Olmstead2, Baptiste Panthu1,3, Gilles Jeans Philippe Rautureau 4, Patrice André1, Piotr Nyczka                                                  5,

                  Marc-Thorsten Hütt5, Nivea Amoedo 6, Rodrigue Rossignol6,7, Fabian Volker Filipp 2,8,
                  Vincent Lotteau 1,10 ✉ & Olivier Diaz 1,10 ✉
1234567890():,;

                  During the cancerous transformation of normal hepatocytes into hepatocellular carcinoma
                  (HCC), the enzyme catalyzing the first rate-limiting step of glycolysis, namely the glucokinase
                  (GCK), is replaced by the higher affinity isoenzyme, hexokinase 2 (HK2). Here, we show that
                  in HCC tumors the highest expression level of HK2 is inversely correlated to GCK expression,
                  and is associated to poor prognosis for patient survival. To further explore functional con-
                  sequences of the GCK-to-HK2 isoenzyme switch occurring during carcinogenesis, HK2
                  was knocked-out in the HCC cell line Huh7 and replaced by GCK, to generate the Huh7-
                  GCK+/HK2− cell line. HK2 knockdown and GCK expression rewired central carbon meta-
                  bolism, stimulated mitochondrial respiration and restored essential metabolic functions of
                  normal hepatocytes such as lipogenesis, VLDL secretion, glycogen storage. It also reactivated
                  innate immune responses and sensitivity to natural killer cells, showing that consequences of
                  the HK switch extend beyond metabolic reprogramming.

                  1 CIRI,Centre International de Recherche en Infectiologie, Univ Lyon, Inserm, U1111, Université Claude Bernard Lyon 1, CNRS, UMR5308, ENS de Lyon, 21 Avenue
                  Tony Garnier, Lyon F-69007, France. 2 Cancer Systems Biology, Institute for Diabetes and Cancer, Helmholtz Zentrum München, Ingolstädter Landstraße 1,
                  München D-85764, Germany. 3 Univ Lyon, CarMeN Laboratory, Inserm, INRA, INSA Lyon, Université Claude Bernard Lyon 1, Hôpital Lyon Sud, Bâtiment CENS
                  ELI-2D, 165 Chemin du grand Revoyet, Pierre-Bénite F-69310, France. 4 Université de Lyon, CNRS, Université Claude Bernard Lyon 1, ENS de Lyon, Centre de
                  RMN à Très Hauts Champs (CRMN), FRE 2034, 5 rue de la Doua, Villeurbanne F-69100, France. 5 Department of Life Sciences and Chemistry, Jacobs University,
                  Campus Ring 1, Bremen D-28759, Germany. 6 CELLOMET, Centre de Génomique Fonctionnelle de Bordeaux, 146 Rue Léo Saignat, Bordeaux F-33000, France.
                  7 Univ. Bordeaux, Inserm U1211, MRGM, Centre hospitalier universitaire Pellegrin, place Amélie Raba Léon, Bordeaux F-33076, France. 8 School of Life Sciences

                  Weihenstephan, Technical University München, Maximus-von-Imhof-Forum 3, Freising D-85354, Germany. 9These authors contributed equally: Laure Perrin-
                  Cocon, Pierre-Olivier Vidalain. 10These authors jointly supervised: Vincent Lotteau, Olivier Diaz. ✉email: vincent.lotteau@inserm.fr; olivier.diaz@inserm.fr

                  COMMUNICATIONS BIOLOGY | (2021)4:217 | https://doi.org/10.1038/s42003-021-01749-3 | www.nature.com/commsbio                                                   1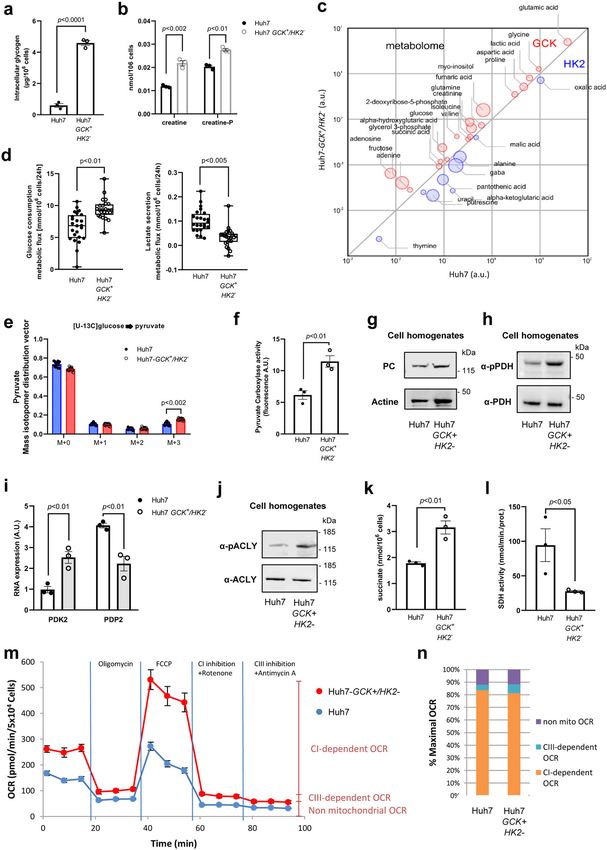
ARTICLE COMMUNICATIONS BIOLOGY | https://doi.org/10.1038/s42003-021-01749-3
H
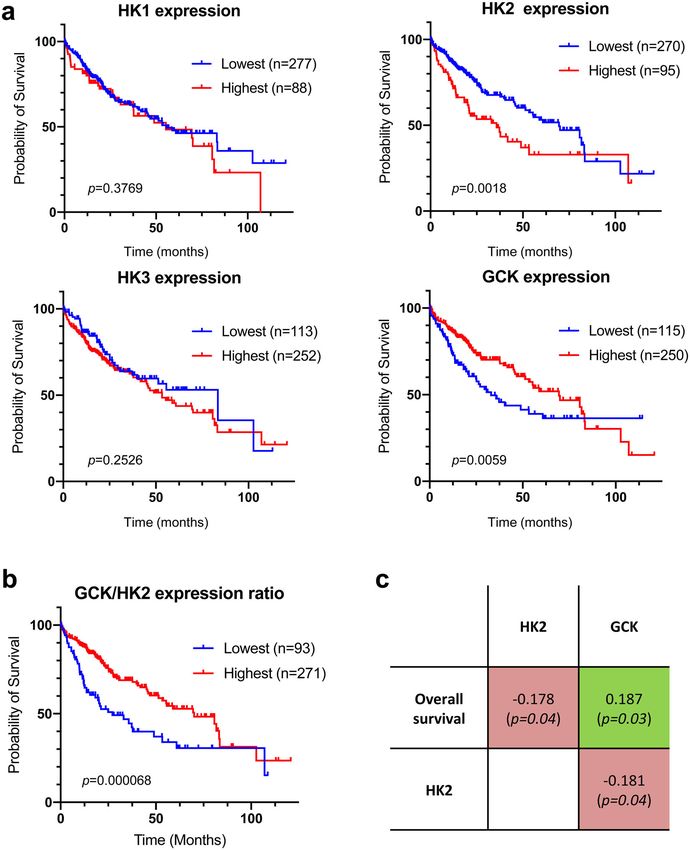
epatocellular carcinoma (HCC) is the most common liver patient survival rate (Fig. 1a), highest expression levels of HK2 as
cancer and the fourth leading cause of cancer-related previously described19 and lowest expression levels of GCK in the
death1. HCC is closely linked to chronic liver inflamma- tumors were associated with a lower survival rate. We thus
tion, chronic viral hepatitis, exposure to toxins, and metabolic stratified patients based on the GCK/HK2 expression ratio to
dysfunction such as non-alcoholic steatohepatitis (NASH). HCC combine these two markers (Fig. 1b). When patients were stra-
is of poor prognosis, and treatments are essentially based on tified on the basis of HK2 or GCK expression levels, the median
surgical resection, liver transplantation or aggressive chemo and/ survival between the corresponding subgroups differed by 33.8
or radiotherapy. In patients with advanced HCC, broad-spectrum and 36.5 months, respectively (Fig. 1a). This difference reached
kinase inhibitors are approved2 but with limited benefit3. Effec- 42.8 months when the stratification of patients was based on the
tive personalized therapies are needed but their development is GCK/HK2 ratio (Fig. 1b). This demonstrated that the GCK/HK2
impeded by our poor understanding of molecular mechanisms ratio outperforms HK2 or GCK expression alone as predictor of
underlying HCC onset and progression. Efforts to characterize patient survival. Finally, correlation coefficients between patient
the disease on the basis of etiology and outcomes revealed survival in months and HK2 or GCK expression level were
metabolic deregulation as a hallmark of HCC progression4. determined. For this, we only considered the subset of 130
Indeed, metabolic remodeling is critically required for tumor patients for whom the period between diagnosis and death is
growth, since bioenergetic requirements and anabolic demands precisely known (uncensored data), and performed a Spearman’s
drastically increase5–7. For instance, HCC cells have lost their rank correlation test (Fig. 1c). Patient survival was positively
ability to secrete very low-density lipoproteins (VLDL), a highly correlated to GCK expression but inversely correlated to HK2
specialized function of hepatocyte and can only secrete low- expression in line with the Kaplan-Meier analysis. In addition,
density lipoproteins (LDL)-like lipoproteins, indicating a defec- GCK and HK2 expression tends to be inversely correlated in
tive lipogenesis and/or lipoprotein assembly8. tumor samples (Fig. 1c). Therefore, there is a trend for mutual
Metabolic reprogramming in cancer cells involves the mod- exclusion of GCK and HK2 expression in HCC tumors, and this
ulation of several enzymes by oncogenic drivers6. Targeting these profile is associated to clinical outcome.
enzymes is now considered as a therapeutic strategy for several
types of cancers6. Among these enzymes, hexokinase 2 (HK2)
Engineering a cellular model of the hexokinase isoenzyme switch.
stands out because of its elevated or induced expression in
To decipher functional consequences of GCK or HK2 expression in
numerous cancers, including HCC9. Hexokinases control the first
a HCC model, we restored GCK expression by lentiviral transduc-
rate-limiting step of glucose catabolism by phosphorylating glu-
tion in the reference HCC cell line Huh7, and knocked-out the
cose to glucose-6-phosphate (G6P), fueling glycolysis as well as
endogenous HK2 gene by CRISPR/Cas9. The exclusive expression of
glycogen, pentose phosphate and triglyceride synthesis. The
HK2 and GCK in Huh7 and Huh7-GCK+/HK2− cell lines,
human genome contains four genes encoding distinct hexokinase
respectively, was validated, while HK1 and HK3 were not expressed
isoenzymes, named HK1 to HK4 (HK4 is also known as gluco-
(Fig. 2a and Supplementary Fig. 1). The hexokinase activity in the
kinase or GCK), with distinct enzymatic kinetics and tissue dis-
presence of increasing concentration of glucose was determined in
tributions. A fifth putative hexokinase enzyme was recently
protein lysates from the two respective cell lines. Hexokinase activity
discovered but has not been fully characterized yet10. A switch
in Huh7 lysate reached its maximum at low glucose concentration,
from GCK to HK2 isoenzymes is occurring during the transition
presenting a saturation curve according to Michaelis–Menten
from primary to tumor hepatocytes so that HCC cell lines express
kinetics (Fig. 2b). In contrast, the hexokinase activity in Huh7-
HK2 but no longer GCK. HK2 expression level has been corre-
GCK+/HK2− lysates followed a pseudo-allosteric response to glu-
lated with disease progression and dedifferentiation of HCC
cose20,21. Thus, the expected HK2 and GCK activities were observed
cells11. When HK2 is artificially knocked-down in HCC cell lines,
in the Huh7 and Huh7-GCK+/HK2− cells respectively. The cell
glycolysis is repressed, and tumorigenesis is inhibited while cell
proliferation capacity remained identical between the two cell lines
death increases9. In addition, hexokinase function extends
(Supplementary Fig. 2). We then compared the genome edited
beyond metabolism towards autophagy, cell migration, and
Huh7-GCK+/HK2− and the parental Huh7 cell lines at a tran-
immunity, suggesting that the GCK-to-HK2 isoenzyme switch
scriptomic, metabolic and immunological level.
has broader consequences than initially suspected12–15. Here, we
analyzed transcriptomic data of HCC biopsies and correlated
hexokinase isoenzyme expression level with patient survival. This Transcriptomic data revealed extended modifications of
led us to generate a new cellular model of human HCC expressing metabolic connections in Huh7-GCK+/HK2−. Transcriptomic
GCK instead of HK2. A comparative analysis of GCK+ vs HK2+ profiles of Huh7 and Huh7-GCK+/HK2− cells were determined
HCC cell lines provided a unique opportunity to look into HK by next generation sequencing (Supplementary Data 2). Overall,
isoenzyme-dependent metabolic features, lipoprotein production 4.2% of the gene transcripts were reduced and 6.9% were induced
and resistance to immune signals of liver cancer cells. in Huh7-GCK+/HK2− compared to Huh7 (Fig. 2c; | fold-change
(FC) | > 2 and p value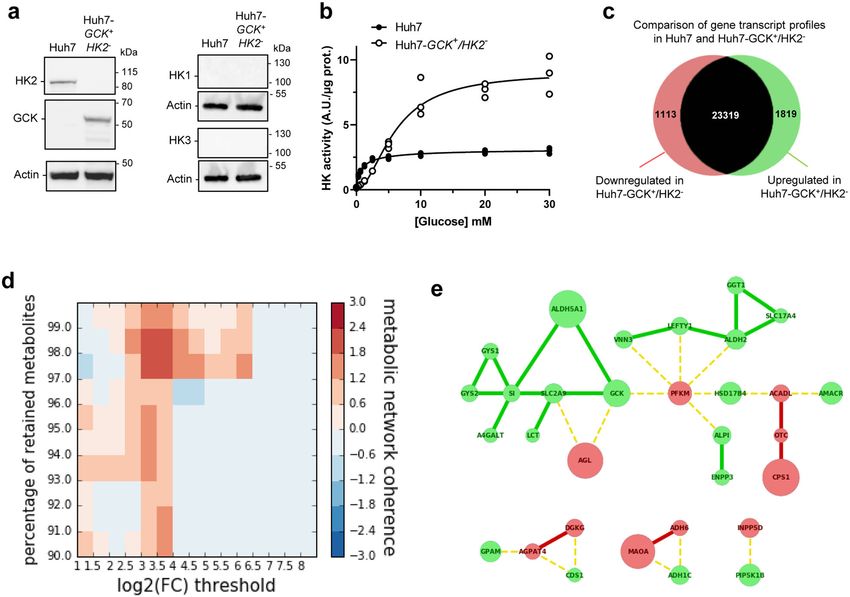
COMMUNICATIONS BIOLOGY | https://doi.org/10.1038/s42003-021-01749-3                                                                   ARTICLE

Fig. 1 Correlation between hexokinase expression levels in HCC tumors and patient survival. a Kaplan–Meier estimates of the survival of HCC patients
depending on the expression of HK1, HK2, HK3 and GCK (HK4) genes in tumor biopsies (n = 365; diploid samples; TCGA expression data retrieved from
cBioPortal; Firehose Legacy)74,75. Duplicate analyses from the same patient were removed as well as patients who died when biopsied (overall
survival=0 months or not specified). Optimal stratification based on highest and lowest gene expression values was determined using Protein Atlas
database18. b Same as above but patients were stratified based on the GCK/HK2 gene expression ratio. The stratification showing the lowest p value when
comparing subgroups of patients with the highest to the lowest GCK/HK2 expression ratio is displayed. Patient TCGA-DD-AAE9 exhibiting undetectable
levels of GCK and HK2 was removed from this analysis as the GCK/HK2 ratio could not be calculated. c Correlations between patient survival, GCK
expression and HK2 expression. Spearman’s rank correlation test on the subset 130 patients for whom the period between diagnosis and death is precisely
known (uncensored data).

to a stringent fold-change threshold for transcriptomic data                   highlights the global impact of the HK isoenzyme switch that
(log2(| FC |) > 3) while removing 2 percent of highest-degree                  spreads beyond glycolysis across distant connected metabolic
currency metabolites. This network shows connected components                  modules.
within glycolysis, but also across distant modules including the                 Enrichment of molecular and cellular functions in differentially
gamma-aminobutyric acid (GABA) shunt (ALDH5A1), urea                           expressed genes was also analyzed using Ingenuity Pathway
cycle (CPS1, OTC), glycogen metabolism (GYS1, GYS2, AGL)                       Analysis (IPA). This revealed that cellular movement and lipid
and lipid synthesis (GPAM, AGPAT4, DGKG, CDS1, A4GALT)                         metabolism were the most affected functions (Table 1 and
or degradation (ACADL, HSD17B4, AMACR). This analysis                          Supplementary Data 3). A closer look at these annotations

COMMUNICATIONS BIOLOGY | (2021)4:217 | https://doi.org/10.1038/s42003-021-01749-3 | www.nature.com/commsbio                                          3
ARTICLE                                                                           COMMUNICATIONS BIOLOGY | https://doi.org/10.1038/s42003-021-01749-3

Fig. 2 Hexokinase isoenzyme switch in Huh7 cells induces extended modifications of metabolic connections. a Western-blot analysis of HK1, HK2, HK3
and GCK expression in Huh7 and Huh7-GCK+/HK2−. b Hexokinase activity in homogenates of Huh7 and Huh7-GCK+/HK2− cells. Means ± SEM are
presented (n = 3). c Number of genes changing their expression pattern in Huh7 and Huh7-GCK+/HK2− cells (see Supplementary Data 2 for details).
d Heatmap showing clustering enrichment scores of the networks obtained when mapping differentially expressed genes to the human metabolic model
Recon2. Clustering enrichment scores from the highest in red to the lowest in blue were calculated for different gene expression thresholds (Log2 | FC | )
and percentages of retained currency metabolites. e Gene network corresponding to the maximal clustering enrichment score (Log2 | FC | > 3; removed
currency metabolites = 2%). The transcription of nodes in green was upregulated and those in red downregulated in Huh7-GCK+/HK2− compared to
Huh7 cells. Plain edges mark co-regulation between nodes and broken edges inverse regulation at the transcriptional level.

 Table 1 Analysis of differentially expressed genes in Huh7 and Huh7-GCK+/HK2− using gene set enrichment analysis (| FC | > 2
 with a p value
COMMUNICATIONS BIOLOGY | https://doi.org/10.1038/s42003-021-01749-3 ARTICLE
Differential lipid metabolism in Huh7 and Huh7-GCK+/HK2−. under the same conditions, the secretion of apolipoprotein B
The intracellular lipid content of the two cell lines was further (ApoB) by Huh7-GCK+/HK2− was reduced compared to Huh7.
analyzed. In Huh7-GCK+/HK2−, an enrichment in phosphati- Since ApoB is a non-exchangeable protein with only one copy in
dylcholine, cholesterol, triglycerides (TG) and free fatty acids was VLDL and LDL particles, an elevated TG/ApoB ratio indicates
observed compared to Huh7 (Fig. 4a). One major function of that ApoB+-lipoproteins secreted by Huh7-GCK+/HK2− cells are
hepatocytes is to secrete triglyceride-rich VLDL and this function enriched in TG compared to those secreted by Huh7 (Fig. 4c).
is altered in HCC cells that secrete smaller lipoproteins with the This was confirmed by the ApoB distribution in density gradient
density of LDL24,25. The secretion of lipids and lipoproteins by fractions. As expected, lipoproteins secreted by Huh7 sediment at
both cell lines was analyzed after a 24h-culture in the absence of the density of LDL, while those secreted by Huh7-GCK+/HK2−
fetal calf serum (FCS) to exclude any participation of exogenous (Fig. 4d) match the density of VLDL found in human plasma or
lipids in the production of lipoproteins. Huh7-GCK+/HK2− secreted by primary human hepatocytes in culture26,27. This
secreted more free fatty acids than Huh7 while secretion of indicates that GCK expression is essential for the VLDL assem-
cholesterol and TG remained unchanged (Fig. 4b). However, bly/secretion pathway and could explain the loss of this crucial
metabolic pathway in hepatoma cells expressing HK2 instead of
GCK28.
Table 2 Top-five ranked IPA-annotations associated to
‘cellular movement’. Differential activity of the tricarboxylic acid cycle (TCA) in
Huh7 and Huh7-GCK+/HK2−. We observed that GCK expres-
Cellular movement functional p value Number of genes sion increased the intracellular content in lipids, resulting in accu-
annotations involved mulation of lipid droplets and secretion of VLDL. A rewiring of
Migration of cells 4.66 × 10⁻²⁵ 585 cellular metabolism towards energy storage in Huh7-GCK+/HK2−
Cell movement 3.48 × 10⁻²⁴ 642 was thus suspected and confirmed by the accumulation of gly-
Cell movement of blood cells 1.52 × 10⁻¹⁸ 276 cogen, creatine and creatine-P (Fig. 5a, b), a feature of functional
Leukocyte migration 1.59 × 10⁻¹⁸ 274
hepatocytes. To further determine the consequences of replacing
Invasion of cells 5.33 × 10⁻¹⁷ 306
HK2 by GCK, we quantified prominent intracellular metabolites
via gas chromatography coupled to triple-quadrupole (QQQ)
mass spectrometry (GC-MS). Figure 5c shows relative intracel-
Table 3 Top-five ranked IPA-annotations associated to ‘lipid lular quantities of metabolites that are significantly different
metabolism’. between Huh7 and Huh7-GCK+/HK2−. Among differentially
represented metabolites, higher levels of glucose, glycerol-3-
phosphate and lactic acid were detected in Huh7-GCK+/HK2−
Lipid metabolism functional p value Number of genes
annotations involved
cells. Several intermediates of the TCA cycle (succinic acid,
fumaric acid, alpha-ketoglutaric acid), and metabolites directly
Concentration of lipid 3.12 × 10⁻¹⁴ 256
connected to it (GABA, glutamic acid, glutamine, aspartic acid)
Synthesis of lipid 2.37 × 10⁻¹⁰ 233
Fatty acid metabolism 4.31 × 10⁻¹⁰ 166
were also differentially present between the two cell lines. This
Quantity of steroid 4.48 × 10−09 138 supports a modulation of central carbon metabolism at both the
Concentration of cholesterol 6.58 × 10−08 94 level of glycolysis and TCA cycle. This led to investigate glucose
catabolism in further details. Glucose consumption and stable
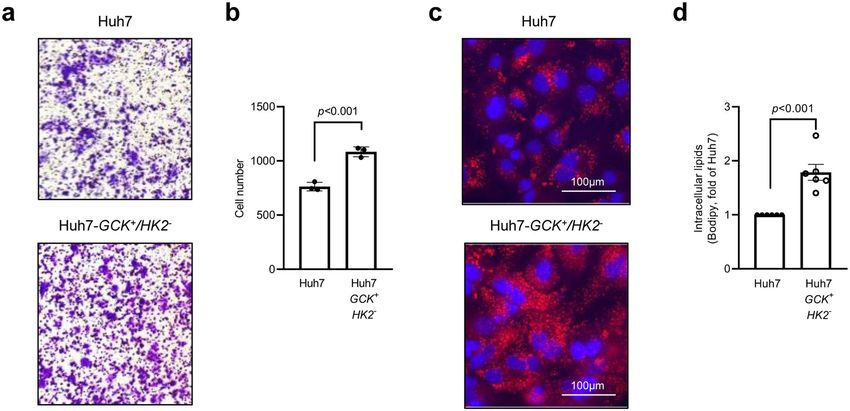
Fig. 3 Huh7-GCK+/HK2− cells have a higher migration capacity and lipid droplets content. a, b Results of transwell-migration tests. a Representative
images and b count of migrating cells (n = 3). c Oil Red-O staining of lipid droplets (red) with nucleus counterstaining (blue). d Quantification of
intracellular lipids by FACS after BODIPY staining (n = 6). Means ± SEM are indicated and p values were determined by Student’s t-test.
COMMUNICATIONS BIOLOGY | (2021)4:217 | https://doi.org/10.1038/s42003-021-01749-3 | www.nature.com/commsbio 5
ARTICLE                                                                 COMMUNICATIONS BIOLOGY | https://doi.org/10.1038/s42003-021-01749-3

Fig. 4 Lipogenesis and very-low-density lipoproteins (VLDL) secretion are restored in Huh7-GCK+/HK2− cells. a Quantification of intracellular lipids in
total cell extracts of Huh7 and Huh7-GCK+/HK2− cells (n = 3). b Lipids and ApoB secretions in supernatants of cells cultured 24 h without FCS (n = 6 for
Cholesterol, n = 3 for FFA and n = 10 for TG and ApoB). c TG/ApoB molar ratio calculated from quantifications determined in b (n = 10). d Supernatants of
Huh7 and Huh7-GCK+/HK2− were analyzed by ultracentrifugation on iodixanol density gradients. ApoB was quantified in each fraction by ELISA (one
representative experiment). Presented data correspond to means ± SEM of indicated number of independent experiments and p values were determined by
Student’s t-test.

isotope incorporation from [U-13C]-glucose into pyruvate were                 pyruvate carboxylase (PC). Acetyl-CoA and OAA are then
both increased in Huh7-GCK+/HK2− compared to Huh7 cells                       combined in the TCA cycle to form citrate. De novo lipogenesis
(Fig. 5d, e). This increased glycolytic flux together with a reduced           requires citrate egress from the TCA cycle to serve as a precursor
lactate secretion (Fig. 5d) is likely to account for the elevation            of cytosolic acetyl-CoA for further synthesis of fatty acids. In
of lactate levels and suggest that the increased pyruvate produc-             Huh7-GCK+/HK2− cells, we observed both an increased activity
tion essentially fuels mitochondrial TCA cycle in Huh7-GCK+/                  of PC (Fig. 5f) without changes in protein expression (Fig. 5g and
HK2−cells.                                                                    Supplementary Fig. 7a) and an increased phosphorylation of
   Pyruvate entering the mitochondria downstream of glycolysis                pyruvate dehydrogenase (PDH), which is indicative of a reduced
can be either oxidized by pyruvate dehydrogenase (PDH),                       activity of this enzyme (Fig. 5h and Supplementary Fig. 7b). This
producing acetyl-CoA, or converted into oxaloacetate (OAA) by                 is consistent with the increased expression of the PDH kinase

6                           COMMUNICATIONS BIOLOGY | (2021)4:217 | https://doi.org/10.1038/s42003-021-01749-3 | www.nature.com/commsbio
COMMUNICATIONS BIOLOGY | https://doi.org/10.1038/s42003-021-01749-3                                                                ARTICLE

PDK2 and the decreased expression of the PDH phosphatase                       (PEP), is overexpressed in Huh7-GCK+/HK2− cells compared to
PDP2 in Huh7-GCK+/HK2− cells that regulate the PDH                             Huh7 (FC = 32).
phosphorylation state (Fig. 5i). A rebalanced usage of pyruvate                   A shift from pyruvate oxidation to carboxylation is observed in
in Huh7-GCK+/HK2− cells maintains a functional TCA cycle                       cancer cells where succinate dehydrogenase (SDH) is inactivated
and supports lipogenesis. In Huh7-GCK+/HK2− cells, we also                     by mutation and OAA can only be generated through PC
observed an increased phosphorylation of ATP citrate lyase                     activity29. SDH inhibition leads to succinate accumulation,
(ACLY), the first enzyme of the fatty acid synthesis pathway,                   especially in activated immune cells30. Interestingly, higher levels
indicating an enhanced activity of this enzyme (Fig. 5j and                    of succinate and a reduced activity of SDH were measured in
Supplementary Fig. 7c). This reaction also regenerates OAA in                  Huh7-GCK+/HK2− compared to Huh7 cells (Fig. 5k, l). Even
the cytosolic compartment. Interestingly, transcriptomic data                  though SDH is also part of the complex II of the mitochondrial
show that PCK1 which converts OAA to phosphoenolpyruvate                       respiratory chain, we observed that the overall oxygen

COMMUNICATIONS BIOLOGY | (2021)4:217 | https://doi.org/10.1038/s42003-021-01749-3 | www.nature.com/commsbio                                      7
ARTICLE                                                                  COMMUNICATIONS BIOLOGY | https://doi.org/10.1038/s42003-021-01749-3

Fig. 5 TCA rewiring after hexokinase isoenzyme switch in Huh7 cells. a Glycogen quantification. b Creatinine and creatinine-P quantification. c This
bubble chart compares intracellular metabolomes of Huh7 and Huh7-GCK+/HK2− cells. Metabolite pool sizes larger in Huh7 are indicated in blue, whereas
the one larger in Huh7-GCK+/HK2− are shown in red. The size of bubbles inversely scales with p values between 5.10−2 and 1.10−17 of differential
metabolomics responses. d Metabolic fluxes for overall glucose consumption and lactate secretion by Huh7 and Huh7-GCK+/HK2− cells. Indicated values
correspond to differences in glucose or lactate concentrations in extracellular culture medium before and after 24 h of culture. e Mass isotopomer
distribution vector of pyruvate in cells cultured with [U-13C]-glucose. Presented data correspond to n = 24 (c, d) or n = 16 (e) acquired spectra from N = 6
and N = 4 independent specimens, respectively. f Pyruvate carboxylase (PC) activity determined in cell homogenates. g Western-blot analysis of PC
expression in Huh7 and Huh7-GCK+/HK2− cells. h Western-blot analysis of pyruvate dehydrogenase (PDH) E1-alpha subunit phosphorylation at Ser293.
i RNA-seq quantification of pyruvate dehydrogenase kinase 2 (PDK2) and pyruvate dehydrogenase phosphatase 2 (PDP2) (BH adjusted p value
COMMUNICATIONS BIOLOGY | https://doi.org/10.1038/s42003-021-01749-3                                                                        ARTICLE

Fig. 6 Innate immune response is enhanced in Huh7-GCK+/HK2− cells. a Sector chart from the transcriptomic study showing genes included in the GO-
term “Type I-IFN signaling pathway”. b List of genes significantly up-regulated in red or down-regulated in purple (| FC | > 2, BH adjusted p value
ARTICLE                                                              COMMUNICATIONS BIOLOGY | https://doi.org/10.1038/s42003-021-01749-3

factors (HIF), peroxisome proliferator-activated receptors                 succinate and aspartate levels are elevated in Huh7-GCK+/HK2−
(PPAR) and phosphatidylinositol-4,5-bisphosphate 3-kinase                  where SDH activity is reduced, suggesting a direct link between
(PI3K) might contribute to HK2 induction in fatty liver disease            PC and SDH activity in hepatocytes. Several mechanisms inhi-
and its evolution towards cirrhosis and carcinogenesis35–37.               biting SDH have been described38. Modification of the expression
Consequently, HK2 induction has been proposed as a risk marker             of SDH subunits is unlikely as no variation was observed at the
of HCC development16. Analyzing TCGA data from human HCC                   transcriptomic level. Itaconate is a weak inhibitor of SDH pro-
tumors, we observed that not only high levels of HK2 but also low          duced from aconitate by Immune-responsive gene 1 protein
levels of GCK are of poor prognosis. In contrast, neither HK1 nor          (IRG1; encoded by ACOD1), but this metabolite was not detected
HK3 expression levels were correlated with survival of HCC                 and IRG1 mRNA was absent from the transcriptome of both cell
patients. GCK expression is very low or not detected in biopsies           lines. Whether fumarate or other metabolites are responsible for
from a majority of patients (65.8% of patients show RSEM values            the reduced SDH activity in GCK-expressing cells remains to be
COMMUNICATIONS BIOLOGY | https://doi.org/10.1038/s42003-021-01749-3 ARTICLE
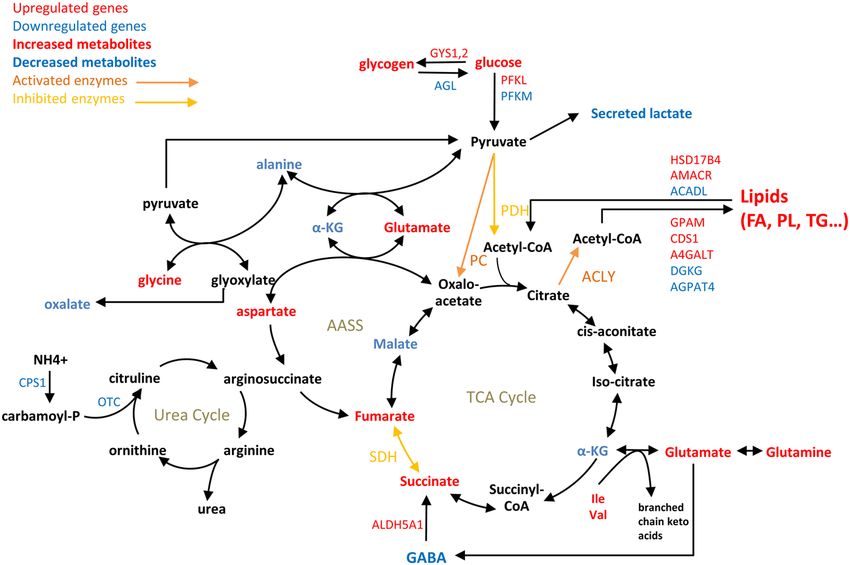
Fig. 7 Simplified scheme of central carbon metabolism and connected pathways showing differences between Huh7-GCK+/HK2− vs Huh7. Highlighted
metabolites, enzymatic activities, and metabolism-associated genes were selected from transcriptomic (Fig. 2e), metabolomic (Fig. 5c) and enzymatic
analyses (Fig. 5f–l).
tissues and low RIG-I expression is correlated with poor survival observed in Huh7-GCK+/HK2−. Since ICAM1 binding to active
of patients, whereas RIG-I expression in HCC cell lines enhanced LFA-1 at the surface of NK cells is essential for granule polar-
IFN response and cancer cell apoptosis34. This suggests an ization and efficient killing of the target cells54, its enhanced
unexpected role of this receptor family in the antitumor response. exposition at the surface of Huh7-GCK+/HK2− cells may con-
Here we show that Huh7 cells expressing GCK instead of HK2 tribute to their higher sensitivity to NK cell-mediated killing.
exhibit a higher sensitivity to RIG-I and MDA5 ligands, and These results suggest that HK2 expression at the expense of GCK
produce higher levels of type I/III IFNs and inflammatory cyto- in HCC tumors decreases immune responsiveness and sensitivity
kines. This immune phenotype occurs in a context of reduced to NK cytotoxicity, thus favoring immune escape.
SDH activity and increased intracellular content in succinate Taken together, our data demonstrate that beyond glycolysis,
(Fig. 5k, l). A pro-inflammatory function of immune cells such as the hexokinase isoenzyme switch in an HCC model rewires
macrophages was previously linked to TCA rewiring, with central carbon metabolism, promotes lipogenesis, enhances
reduced SDH activity resulting in succinate accumulation39,50,51. innate immune functions, and restores sensitivity to natural
Succinate can also be secreted from LPS-activated macrophages killer cells.
and activate its cognate receptor, succinate receptor 1 (SUCNR1,
previously known as GPR91) in an autocrine and paracrine Methods
manner to further enhance production of IL-1β52. Interestingly, Materials. Unless otherwise specified, chemicals were from Merck Sigma-Aldrich.
glucose metabolism promotes RIG-I and MDA5 signaling The RIG-I specific ligand 3p-hpRNA and the MDA5/TLR3 ligand poly(I:C) HMW
through the O-GlcNAcylation of the mitochondrial adaptor (High Molecular Weight) were from Invivogen.
MAVS47. Thus, an intriguing hypothesis is that GCK expression
could facilitate MAVS signaling by increasing UDP-GlcNAc Cell cultures. Cell cultures were tested negative for mycoplasma contamination by
through upregulation of the hexosamine biosynthetic pathway. PCR (mycoplasma check, eurofins). Huh7 cells were authenticated by Eurofins
Medigenomix Forensik GmbH using PCR-single-locus-technology. 21 independent
HK2 binding at the surface of mitochondria may also compete PCR-systems Amelogenin, D3S1358, D1S1656, D6S1043, D13S317, Penta E,
with pyruvate carboxylase, metabolites or mitochondria factors D16S539, D18S51, D2S1338, CSF1PO, Penta D, TH01, vWA, D21S11, D7S820,
known to control MAVS signaling47–49. Here we show that HK2 D5S818, TPOX, D8S1179, D12S391, D19S433 and FGA (Promega, PowerPlex 21
knockdown promotes RIG-I-induced ISRE-dependent transcrip- PCR Kit) were investigated to determine their genetic characteristics. Huh7 cells
and derivatives were grown as previously described55 in DMEM, 10% fetal calf
tion (Fig. 6d). This is consistent with the results obtained by serum (FCS), penicillin/streptomycin, 1 mM pyruvate, 2 mM L-glutamine. Culture
Zhang et al.48, indicating that HK2 interaction with MAVS medium and additives were from Gibco except FCS (Dominique Dutcher).
restrains RIG-I-induced IFN-β secretion. Further investigations
are now required to decipher the molecular links between Cell lines. 15×104 Huh7 cells were transduced for GCK expression at different
metabolism and immune responses. multiplicities of infection (lentiviral transduction using the pLEX-GCK construct).
Beyond the inhibition of RLR signaling, other mechanisms The Huh7-GCK+/HK2+ cells were then cultured for 7 days with puromycin
might contribute to tumor escape from immune surveillance in (1 μg/mL) before amplification. HK2 knock-out was achieved using the CRISPR/
Cas9 system as previously described56 to obtain Huh7-GCK+/HK2− cells. Briefly, a
HCC patients. In advanced-stage HCC patients, NK cells often single guide RNA (sgRNA) pair was designed for double nicking using the CRISPR
exhibit reduced infiltration and impaired functional activities53. Design Tool (http://tools.genome-engineering.org). The guide sequence oligos
We thus compared the sensitivity of Huh7-GCK+/HK2− cells to (sgRNA1(HK2): 5’-CACCGTGACCACATTGCCGAATGCC-3’ and
Huh7, and found that sensitivity to NK cell lysis is restored when sgRNA2(HK2): 5’-CACCGTTACCTCGTCTAGTTTAGTC-3’) were cloned into a
plasmid containing sequences for Cas9 expression and the sgRNA scaffold
HK2 is replaced by GCK. When analyzing cell surface expression (pSpCas9(BB)-2A-GFP, Addgene plasmid #48138). 48 h post-transfection, cells
of the NK cells inhibitors, HLA class I and MICA/B, no sig- were sorted by FACS based on the transient expression of GFP and cloned by
nificant changes were observed between cell lines (Supplementary limiting dilution. Effective deletion of HK2 was assessed by qPCR.
Fig. 13). In contrast, an increased transcription and surface For HK2 knock-down, Huh7-GCK+/HK2+ cells were transduced with lentiviral
vectors expressing HK2-targeting shRNAs, and antibiotic selection was applied
expression of ICAM1 (FC = 2.6; Supplementary Fig. 13) was (hygromycin; 100 µg/ml). The HK2-targeting sequence 5’-
COMMUNICATIONS BIOLOGY | (2021)4:217 | https://doi.org/10.1038/s42003-021-01749-3 | www.nature.com/commsbio 11ARTICLE COMMUNICATIONS BIOLOGY | https://doi.org/10.1038/s42003-021-01749-3
CCGGCCAGAAGACATTAGAGCATCTCTCGAGAGATGCTC- metabolite was calculated for each cell line and treatment condition. A univariate
TAATGTCTTCTGGTTTTTT-3’ was cloned in the pLKO.1 hygro vector (a gift t-test was used to compare treatment conditions for each metabolite and cell line.
from Bob Weinberg; Addgene plasmid #24150). HK2 expression in Huh7-GCK+/
HK2+ and Huh7-GCK+/HK2−Sh was analyzed on cell lysates by western blotting
Transcriptome profiling of Huh7 and Huh7-GCK+/HK2− cell lines. Tran-
(Supplementary Fig. 10).
scriptome profiling was performed by next generation sequencing (ProfileXpert,
Lyon, France). Briefly, Total RNA was extracted and purified from cell pellets using
Enzymatic activity assays. Cells were trypsinized, washed twice, and cell pellets Direct-zol RNA purification kit (Zymo Research). 700 ng of total RNA were
were stored at −80 °C. Protein extractions and assays were performed in specific amplified (NextFlex Rapid Directional mRNA-Seq, PerkinElmer) to generate
buffers for hexokinase and pyruvate carboxylase assays as described below. mRNA-seq libraries. Then, gene expression was analyzed by Next-Generation
Sequencing (NGS) using Illumina NextSeq500. Reads were mapped on the refer-
ence genome Homo sapiens GRCh37/hg19. Raw data were processed using the
Hexokinase activity assay. The method used for monitoring HK activity in cells DESeq2 pipeline64 to identify differentially expressed genes. See Supporting
lysates was adapted from Kuang et al.57–59. Cellular pellets stored at −80 °C were Information and Gene Expression Omnibus database with the accession number
thawed and immediately homogenized (2×10⁶ cells/100 µl) in precooled reaction GSE144214 for entire raw data.
buffer. (0.05 M Tris–HCl, 0.25 M sucrose, 0.005 M EDTA, 0.005 M 2-mercap-
toethanol, pH = 7.4). After 20 min incubation on ice, homogenates were pulse-
sonicated 15 s at half power (EpiShear Probe Sonicator). Homogenates were then Pathway analysis. The list of transcripts differentially expressed in Huh7 and
centrifuged at 500 g for 20 min at 4 °C. Supernatants were immediately used for Huh7-GCK+/HK2− cell lines was analyzed by gene set enrichment analysis (IPA,
determination of HK activity, which was measured spectrophotometrically through Build version: 486617 M, Qiagen) weighted by their corresponding fold change and
NADP+ reduction in the glucose 6-phosphate dehydrogenase–coupled reaction. p value. The fold change cut-off of mean expression for each transcript was set at 2
HK activity was assayed in medium containing 50 mM triethanolamine (pH = 7.6), with an adjusted p valueCOMMUNICATIONS BIOLOGY | https://doi.org/10.1038/s42003-021-01749-3 ARTICLE
architecture (see references68,72 for details). The degree of a node is the number of (Human Anti-Virus Response Panel, BioLegend). Fluorescence was analyzed using
neighbors the node has in the network. The percentage of remaining metabolites is a FACS Canto II (BD Biosciences).
one of the parameters of our analysis. Typical values are 90 to 98 percent (i.e. a
removal of the highest 2 to 10% of metabolites with the highest degree as currency Human NK cell purification. NK cells were isolated from human buffy coats of
metabolites). After recomputing the reaction-centric graph based on the reduced
healthy donors obtained from the Etablissement Français du Sang. Informed
number of metabolites (Supplementary Fig. 3), we can now evaluate the gene-
consent was obtained from donors and experimental procedures were approved by
reaction associations to arrive at a gene-centric metabolic network (Supplementary
the local institutional review committee. PBMCs were isolated by standard density
Fig. 3). Given a set S of differentially expressed genes and the gene-centric meta-
gradient centrifugation on Ficoll-Hypaque (Eurobio). Mononuclear cells were
bolic network G, we can now analyze the subgraph of G spanned by all genes in S.
separated from peripheral blood lymphocytes (PBLs) by centrifugation on a 50%
The average clustering coefficient C in these subgraphs serves as a measure of the
Percoll solution (GE Healthcare). NK cells were purified from PBLs by immuno-
connectivity of this subgraph. The metabolic network coherence MC is the z-score
magnetic depletion using pan-mouse IgG Dynabeads (Thermo Fisher Scientific)
of C computed with respect to a null model of randomly drawn gene sets with the with a cocktail of depleting monoclonal antibodies: anti-CD19 (4G7 hybridoma),
same size as S (Supplementary Fig. 4). In this way, MC has an intuitive inter-
anti-CD3 (OKT3 hybridoma, ATCC, Manassas, VA, USA), anti-CD4, anti-CD14
pretation: The value of MC indicates, how many standard deviations away from
and anti-glycophorin A (all from Beckman Coulter). NK purity was >70% as
randomness the clustering of the subgraph spanned by the observed gene set S
assessed by CD56 labeling.
actually is (Supplementary Fig. 4 and reference73). The genome-scale metabolic
models employed here are the generic human metabolic model Recon 222. In
general, different network measures can be used for evaluation of MC. In the scope NK cell cytotoxicity test. Huh7 or Huh7-GCK+/HK2− were seeded at 1×10⁵ cells
of this study, we have tested several of them, but opted for average clustering per well in a 24-well plate in RPMI-1640 (Gibco) with 10% FCS and 40 µg/ml
coefficient C, as it yielded strongest statistical signal. gentamycin. After 24 h, 3×10⁵ or 3×10⁶ NK cells were added to the culture wells.
The cytotoxicity assay was performed for 4 h at 37 °C, under 5% CO2. Target
hepatoma cells were harvested after trypsination, labeled with propidium iodide
Western-blot analysis. Cell lysates from 106 cells were prepared in lysis buffer (PI) and analyzed by FACS. Cell death was monitored after morphological gating
(1% Triton X-100, 5 mM EDTA in PBS with 1% protease inhibitor cocktail (P8340; on hepatocytes.
Millipore Sigma-Aldrich) and 2 mM orthovanadate). After elimination of insoluble
material, proteins were quantified, separated by SDS-PAGE and analyzed by
western-blot on PVDF membrane. After saturation of the PVDF membrane in Statistics and reproducibility. All the statistical analyses were performed with
PBS-0.1% Tween 20 supplemented with 5% (w/v) non-fat milk powder, blots were GraphPad Prism or Analyse-it software. Details of statistical analyses can be found
incubated 1 h at room temperature with primary antibody in PBS-0.1% Tween 20 in figure legends. Two-sided statistical analyses were performed on experiments
(1:2,000 dilution for all antibodies unless specified otherwise). Incubation with reproduced at least 3 times independently. The exact p values are indicated either
secondary antibody was performed after washing for 1 h at room temperature. directly in the figure or in the legend. The exact sample size (n) is given in the
HRP-labeled anti-goat (Santa Cruz Biotechnology), anti-rabbit (A0545, Millipore legend of each figure. The mean ± standard error of the mean (SEM) is displayed,
Sigma-Aldrich) or anti-mouse (Jackson ImmunoResearch Laboratories) antibodies unless otherwise stated. Confidence interval was set to 95% in all statistical tests.
were diluted 20,000 folds and detected by enhanced chemiluminescence reagents
according to the manufacturer’s instructions (SuperSignal Chemiluminescent Reporting summary. Further information on research design is available in the Nature
Substrate, Thermo Fisher Scientific). Primary antibodies used for immunoblotting Research Reporting Summary linked to this article.
included mouse monoclonal antibody against human GCK (clone G-6, Santa Cruz
Biotechnology), rabbit monoclonal antibody against human HK2 (Clone C64G5,
Cell Signaling Technology), rabbit monoclonal antibody against human HK1 Data availability
(C35C4, Cell Signaling), rabbit polyclonal antibody against human HK3 The data generated or analyzed during this study are included in the article and
(HPA056743, Millipore Sigma-Aldrich), goat polyclonal antibody against human supplementary files. The transcriptomes of the 365 HCC biopsies analyzed in the current
ACLY (SAB2500845, Millipore Sigma-Aldrich), rabbit polyclonal antibody against study were obtained from The Cancer Genome Atlas (TCGA) database and are available
human pACLY (phospho S455, Cell Signaling Technology), rabbit monoclonal in Supplementary Data 1. The RNA-seq data for Huh7 and Huh7-GCK+/HK2− cell lines
antibody against human PDH α1 subunit (C54G1, Cell Signaling Technology), are available in Supplementary Data 2 and at the Gene Expression Omnibus database
rabbit monoclonal antibody against human pPDH E1-alpha subunit (phospho with the accession number GSE144214 for entire raw data. Source data and calculations
S293, Abcam), goat polyclonal antibody against human PC (SAB2500845, Milli- for all experiments can be found in Supplementary Data 4. Uncropped images of western
pore Sigma-Aldrich), rabbit monoclonal antibody against human GAPDH are provided in Supplementary Figs. 1 and 7.
(D16H11, Cell Signaling Technology) and rabbit polyclonal antibody against
human HIF-1α (NB100-134, Novus Biologicals; 1:500 dilution).
Received: 2 May 2020; Accepted: 11 December 2020;
Respiration assay. Twenty-four hours prior measuring respiration in the Extra-
cellular Flux Analyzer (Seahorse Bioscience), cells were seeded in XF 24-wells cell
culture microplates (Seahorse Bioscience) at 5×10⁴ cells/well in 100 µL of DMEM
medium supplemented with 10% FCS, 1 mM pyruvate, 2 mM L-glutamine, peni-
cillin/streptomycin, and then incubated at 37 °C/5% CO2 during 5 h for cell
attachment. Medium volume was adjusted to 250 µL and cells incubated overnight. References
The assay was initiated by removing the growth medium from each well and 1. Villanueva, A. Hepatocellular carcinoma. N. Engl. J. Med. 380, 1450–1462
replacing it with 500 µL of Seahorse assay medium (XF DMEM pH = 7.4 + 10 mM (2019).
Glucose, 2 mM Glutamine and 1 mM sodium pyruvate) prewarmed at 37 °C. Cells 2. Kudo, M. et al. Lenvatinib versus sorafenib in first-line treatment of patients
were incubated at 37 °C for 1 h to allow media temperature and pH to reach with unresectable hepatocellular carcinoma: a randomised phase 3 non-
equilibrium before the first measurement. The oxygen consumption rate (OCR) inferiority trial. Lancet 391, 1163–1173 (2018).
was measured using the following Seahorse running program: injection Port A – 3. Llovet, J. M., Montal, R., Sia, D. & Finn, R. S. Molecular therapies and
1.5 µM Oligomycin; Injection Port B – 0.5 µM FCCP and injection Port C – 0.5 µM precision medicine for hepatocellular carcinoma. Nat. Rev. Clin. Oncol. 15,
Rotenone; injection port D – 0.5 µM Antimycin A. The number of cells was 599–616 (2018).
determined at the end of the run after Hoechst staining and cell counting using 4. De Matteis, S. et al. Aberrant metabolism in hepatocellular carcinoma
Cytation 1 imaging reader (Biotek). provides diagnostic and therapeutic opportunities. Oxid. Med. Cell. Longev.
2018, 1–13 (2018).
5. Filipp, F. V. et al. Glutamine-fueled mitochondrial metabolism is decoupled
RLR stimulation. Cells were seeded in 96-well or 24-well plates. After 24 h, cells
from glycolysis in melanoma. Pigment Cell Melanoma Res. 25, 732–739
were co-transfected with indicated doses of the RIG-I ligand 3p-hpRNA or the
(2012).
MDA5/TLR3 ligand poly(I:C) HMW together with the pISRE-luc (1.25 µg/ml;
Stratagene) and pRL-SV40 (0.125 µg/ml; Promega) reporter plasmids using the 6. Hay, N. Reprogramming glucose metabolism in cancer: can it be exploited for
JetPEI-Hepatocyte reagent (Polyplus Transfection). Manufacturer’s instructions cancer therapy? Nat. Rev. Cancer 16, 635–649 (2016).
were followed. After 48 h, supernatants were collected for cytokine quantification. 7. Vander Heiden, M. G., Cantley, L. C. & Thompson, C. B. Understanding the
Firefly and Renilla luciferase expressions within cells were determined using the Warburg effect: the metabolic requirements of cell proliferation. Science 324,
Dual-Glo luciferase Assay system (Promega) and an Infinite M200 microplate 1029–1033 (2009).
reader (TECAN). 8. Jiang, J., Nilsson-Ehle, P. & Xu, N. Influence of liver cancer on lipid and
lipoprotein metabolism. Lipids Health Dis. 5, 4 (2006).
9. DeWaal, D. et al. Hexokinase-2 depletion inhibits glycolysis and induces
Cytokine assays. Clarified culture supernatants were collected and stored at oxidative phosphorylation in hepatocellular carcinoma and sensitizes to
−20 °C. IL-8 was quantified using the Cytometric Bead Array for human IL-8 (BD metformin. Nat. Commun. 9, 446 (2018).
Biosciences). Other cytokines were assayed using the LEGENDplex multiplex assay
COMMUNICATIONS BIOLOGY | (2021)4:217 | https://doi.org/10.1038/s42003-021-01749-3 | www.nature.com/commsbio 13ARTICLE COMMUNICATIONS BIOLOGY | https://doi.org/10.1038/s42003-021-01749-3
10. Guo, C. et al. Coordinated regulatory variation associated with gestational 42. Yount, E. A. & Harris, R. A. Studies on the inhibition of gluconeogenesis by
hyperglycaemia regulates expression of the novel hexokinase HKDC1. Nat. oxalate. Biochim. Biophys. Acta 633, 122–133 (1980).
Commun. 6, 6069 (2015). 43. O’Neill, I. E. & Bannister, D. W. The effects of oxalate and glucose on
11. Guzman, G. et al. Evidence for heightened hexokinase II immunoexpression lipogenesis by isolated hepatocytes from normal and biotin-deficient chicks
in hepatocyte dysplasia and hepatocellular carcinoma. Dig. Dis. Sci. 60, (Gallus domesticus). Int. J. Biochem. 16, 517–521 (1984).
420–426 (2015). 44. Muto, Y. et al. Overweight and obesity increase the risk for liver cancer in
12. Wolf, A. J. et al. Hexokinase is an innate immune receptor for the detection of patients with liver cirrhosis and long-term oral supplementation with
bacterial peptidoglycan. Cell 166, 624–636 (2016). branched-chain amino acid granules inhibits liver carcinogenesis in heavier
13. Tan, V. P. & Miyamoto, S. HK2/hexokinase-II integrates glycolysis and patients with liver cirrhosis. Hepatol. Res. 35, 204–214 (2006).
autophagy to confer cellular protection. Autophagy 11, 963–964 (2015). 45. Kawaguchi, T. et al. Branched-chain amino acids prevent
14. Roberts, D. J., Tan-Sah, V. P., Ding, E. Y., Smith, J. M. & Miyamoto, S. hepatocarcinogenesis and prolong survival of patients with cirrhosis. Clin.
Hexokinase-II positively regulates glucose starvation-induced autophagy Gastroenterol. Hepatol. 12, 1012–1018.e1 (2014).
through TORC1 inhibition. Mol. Cell 53, 521–533 (2014). 46. Ally, A. et al. Comprehensive and integrative genomic characterization of
15. Kishore, M. et al. Regulatory T cell migration is dependent on glucokinase- hepatocellular carcinoma. Cell 169, 1327–1341.e23 (2017).
mediated glycolysis. Immunity 47, 875–889.e10 (2017). 47. Li, T. et al. O-GlcNAc transferase links glucose metabolism to MAVS-
16. Lee, N. C. W., Carella, M. A., Papa, S. & Bubici, C. High expression of mediated antiviral innate immunity. Cell Host Microbe 24, 791–803.e6 (2018).
glycolytic genes in cirrhosis correlates with the risk of developing liver cancer. 48. Zhang, W. et al. Lactate is a natural suppressor of RLR signaling by targeting
Front Cell Dev. Biol. 6, 138 (2018). MAVS. Cell 178, 176–189.e15 (2019).
17. Uhlén, M. et al. Proteomics. Tissue-based map of the human proteome. 49. Cao, Z. et al. Pyruvate carboxylase activates the RIG-I-like receptor-mediated
Science 347, 1260419 (2015). antiviral immune response by targeting the MAVS signalosome. Sci. Rep. 6,
18. Uhlen, M. et al. A pathology atlas of the human cancer transcriptome. Science 22002 (2016).
357, eaan2507 (2017). 50. O’Neill, L. A. J. A broken Krebs cycle in macrophages. Immunity 42, 393–394
19. Yoo, J.-J. et al. Hexokinase-II inhibition synergistically augments the anti-tumor (2015).
efficacy of sorafenib in hepatocellular carcinoma. Int. J. Mol. Sci. 20, 1292 (2019). 51. Mills, E. L. et al. Succinate dehydrogenase supports metabolic repurposing of
20. Porter, C. M. & Miller, B. G. Cooperativity in monomeric enzymes with single mitochondria to drive inflammatory macrophages. Cell 167, 457–470.e13
ligand-binding sites. Bioorg. Chem. 43, 44–50 (2012). (2016).
21. Larion, M., Salinas, R. K., Bruschweiler-Li, L., Miller, B. G. & Brüschweiler, R. 52. Littlewood-Evans, A. et al. GPR91 senses extracellular succinate released from
Order–disorder transitions govern kinetic cooperativity and allostery of inflammatory macrophages and exacerbates rheumatoid arthritis. J. Exp. Med.
monomeric human glucokinase. PLoS Biol. 10, e1001452 (2012). 213, 1655–1662 (2016).
22. Thiele, I. et al. A community-driven global reconstruction of human 53. Cai, L. et al. Functional impairment in circulating and intrahepatic NK cells
metabolism. Nat. Biotechnol. 31, 419–425 (2013). and relative mechanism in hepatocellular carcinoma patients. Clin. Immunol.
23. Zielinski, D. C. et al. Pharmacogenomic and clinical data link non- 129, 428–437 (2008).
pharmacokinetic metabolic dysregulation to drug side effect pathogenesis. 54. Bryceson, Y. T., March, M. E., Barber, D. F., Ljunggren, H.-G. & Long, E. O.
Nat. Commun. 6, 7101 (2015). Cytolytic granule polarization and degranulation controlled by different
24. Berghe, Gvanden The role of the liver in metabolic homeostasis: Implications receptors in resting NK cells. J. Exp. Med 202, 1001–1012 (2005).
for inborn errors of metabolism. J. Inherit. Metab. Dis. 14, 407–420 (1991). 55. Scholtes, C. et al. Enhancement of genotype 1 hepatitis C virus replication by
25. Berg, J. M., Tymoczko, J. L. & Stryer, L. Each organ has a unique metabolic bile acids through FXR. J. Hepatol. 48, 192–199 (2008).
profile. in Biochemistry 5th edn, Ch. 30.2 (W H Freeman, 2002). 56. Ran, F. A. et al. Genome engineering using the CRISPR-Cas9 system. Nat.
26. Beilstein, F. et al. Lysophosphatidylcholine acyltransferase 1 is downregulated Protoc. 8, 2281–2308 (2013).
by hepatitis C virus: impact on production of lipo-viro-particles. Gut 66, 57. Kuang, Y., Schomisch, S. J., Chandramouli, V. & Lee, Z. Hexokinase and
2160–2169 (2017). glucose-6-phosphatase activity in woodchuck model of hepatitis virus-induced
27. Ginsberg, H. N. Lipoprotein physiology. Endocrinol. Metab. Clin. North Am. hepatocellular carcinoma. Comp. Biochem. Physiol. C. Toxicol. Pharmacol.
27, 503–519 (1998). 143, 225–231 (2006).
28. Meex, S. J. R., Andreo, U., Sparks, J. D. & Fisher, E. A. Huh-7 or HepG2 cells: 58. Ramière, C. et al. Activity of hexokinase is increased by its interaction with
which is the better model for studying human apolipoprotein-B100 assembly hepatitis C virus protein NS5A. J. Virol. 88, 3246–3254 (2014).
and secretion? J. Lipid Res. 52, 152–158 (2011). 59. Perrin-Cocon, L. et al. Toll-like receptor 4-induced glycolytic burst in human
29. Lussey-Lepoutre, C. et al. Loss of succinate dehydrogenase activity results in monocyte-derived dendritic cells results from p38-dependent stabilization of
dependency on pyruvate carboxylation for cellular anabolism. Nat. Commun. HIF-1α and increased hexokinase II expression. J. Immunol. 201, 1510–1521
6, 8784 (2015). (2018).
30. Lampropoulou, V. et al. Itaconate links inhibition of succinate dehydrogenase 60. Payne, J. & Morris, J. G. Pyruvate carboxylase in Rhodopseudomonas
with macrophage metabolic remodeling and regulation of inflammation. Cell spheroides. J. Gen. Microbiol. 59, 97–101 (1969).
Metab. 24, 158–166 (2016). 61. Lanning, N. J. et al. Metabolic profiling of triple-negative breast cancer cells
31. Mansouri, A., Gattolliat, C.-H. & Asselah, T. Mitochondrial dysfunction and reveals metabolic vulnerabilities. Cancer Metab. 5, 6 (2017).
signaling in chronic liver diseases. Gastroenterology 155, 629–647 (2018). 62. Shah, R., Singh, S. J., Eddy, K., Filipp, F. V. & Chen, S. Concurrent targeting of
32. Mills, E. L., Kelly, B. & O’Neill, L. A. J. Mitochondria are the powerhouses of glutaminolysis and metabotropic glutamate receptor 1 (GRM1) reduces
immunity. Nat. Immunol. 18, 488 (2017). glutamate bioavailability in GRM1+ melanoma. Cancer Res. 79, 1799–1809
33. Cheng, M. et al. Stat1 mediates an auto-regulation of hsp90β gene in heat (2019).
shock response. Cell. Signal. 22, 1206–1213 (2010). 63. Filipp, F. V. et al. cycle flux through isocitrate dehydrogenases 1 and 2 is
34. Hou, J. et al. Hepatic RIG-I predicts survival and interferon-α therapeutic required for lipogenesis in hypoxic melanoma cells. Pigment Cell Melanoma
response in hepatocellular carcinoma. Cancer Cell 25, 49–63 (2014). Res. 25, 375–383 (2012).
35. Panasyuk, G. et al. PPARγ contributes to PKM2 and HK2 expression in fatty 64. Love, M. I., Huber, W. & Anders, S. Moderated estimation of fold change and
liver. Nat. Commun. 3, 672 (2012). dispersion for RNA-seq data with DESeq2. Genome Biol. 15, 550 (2014).
36. Mesarwi, O. A. et al. Hepatocyte hypoxia inducible factor-1 mediates the 65. Scholtes, C. et al. High plasma level of nucleocapsid-free envelope glycoprotein-
development of liver fibrosis in a mouse model of nonalcoholic fatty liver positive lipoproteins in hepatitis C patients. Hepatology 56, 39–48 (2012).
disease. PLoS ONE 11, (2016). 66. Icard, V. et al. Secretion of hepatitis C virus envelope glycoproteins depends on
37. Roberts, D. J. & Miyamoto, S. Hexokinase II integrates energy metabolism and assembly of apolipoprotein B positive lipoproteins. PLoS ONE 4, e4233 (2009).
cellular protection: Akting on mitochondria and TORCing to autophagy. Cell 67. Sonnenschein, N., Geertz, M., Muskhelishvili, G. & Hütt, M.-T. Analog
Death Differ. 22, 248–257 (2015). regulation of metabolic demand. BMC Syst. Biol. 5, 40 (2011).
38. Van den Bossche, J., O’Neill, L. A. & Menon, D. Macrophage immunometabolism: 68. Sonnenschein, N. et al. A network perspective on metabolic inconsistency.
where are we (Going)? Trends Immunol. 38, 395–406 (2017). BMC Syst. Biol. 6, 41 (2012).
39. Tannahill, G. M. et al. Succinate is an inflammatory signal that induces IL-1β 69. Knecht, C., Fretter, C., Rosenstiel, P., Krawczak, M. & Hütt, M.-T. Distinct
through HIF-1α. Nature 496, 238–242 (2013). metabolic network states manifest in the gene expression profiles of pediatric
40. Kluckova, K. & Tennant, D. A. Metabolic implications of hypoxia and inflammatory bowel disease patients and controls. Sci. Rep. 6, 32584 (2016).
pseudohypoxia in pheochromocytoma and paraganglioma. Cell Tissue Res. 70. Schlicht, K. et al. The metabolic network coherence of human transcriptomes
372, 367–378 (2018). is associated with genetic variation at the cadherin 18 locus. Hum. Genet. 138,
41. Sun, Y. et al. Loss of alanine-glyoxylate and serine-pyruvate aminotransferase 375–388 (2019).
expression accelerated the progression of hepatocellular carcinoma and 71. Nyczka, P. & Hütt, M.-T. Generative network model of transcriptome patterns in
predicted poor prognosis. J. Transl. Med 17, 390 (2019). disease cohorts with tunable signal strength. Phys. Rev. Res. 2, 033130 (2020).
14 COMMUNICATIONS BIOLOGY | (2021)4:217 | https://doi.org/10.1038/s42003-021-01749-3 | www.nature.com/commsbioCOMMUNICATIONS BIOLOGY | https://doi.org/10.1038/s42003-021-01749-3 ARTICLE
72. Ma, H. & Zeng, A.-P. Reconstruction of metabolic networks from genome Competing interests
data and analysis of their global structure for various organisms. The authors declare no competing interests.
Bioinformatics 19, 270–277 (2003).
73. Hütt, M.-T. Understanding genetic variation - the value of systems biology. Br.
J. Clin. Pharm. 77, 597–605 (2014).
Additional information
Supplementary information The online version contains supplementary material
74. Gao, J. et al. Integrative analysis of complex cancer genomics and clinical
available at https://doi.org/10.1038/s42003-021-01749-3.
profiles using the cBioPortal. Sci. Signal 6, pl1 (2013).
75. Cerami, E. et al. The cBio cancer genomics portal: an open platform for exploring
Correspondence and requests for materials should be addressed to V.L. or O.D.
multidimensional cancer genomics data. Cancer Discov. 2, 401–404 (2012).
Reprints and permission information is available at http://www.nature.com/reprints
Acknowledgements Publisher’s note Springer Nature remains neutral with regard to jurisdictional claims in
We acknowledge the contribution of the Genomics and Microgenomics platform Pro- published maps and institutional affiliations.
fileXpert (University Lyon 1, SFR santé LYON-EST, UCBL-Inserm US 7-CNRS
UMS3453) and SFR Biosciences (UMS3444/CNRS, US8/Inserm, ENS de Lyon, UCBL)
facilities: AniRA-Cytometry, AniRA-ImmOs metabolic phenotyping and LYMIC-
PLATIM microscopy. We gratefully thank Laurence Canaple for technical assistance. Open Access This article is licensed under a Creative Commons
This work was supported by the Fondation pour la Recherche Médicale (FRM), grant Attribution 4.0 International License, which permits use, sharing,
number DEQ20160334893 to VL. F.V.F. is grateful for the support by grants CA154887, adaptation, distribution and reproduction in any medium or format, as long as you give
GM115293, CRN-17-427258, NSF GRFP, and the Science Alliance on Precision Medi- appropriate credit to the original author(s) and the source, provide a link to the Creative
cine and Cancer Prevention by the German Federal Foreign Office, implemented by the Commons license, and indicate if changes were made. The images or other third party
Goethe-Institute, Washington, DC, USA, and supported by the Federation of German material in this article are included in the article’s Creative Commons license, unless
Industries (BDI), Berlin, Germany. indicated otherwise in a credit line to the material. If material is not included in the
article’s Creative Commons license and your intended use is not permitted by statutory
regulation or exceeds the permitted use, you will need to obtain permission directly from
Author contributions the copyright holder. To view a copy of this license, visit http://creativecommons.org/
L.P-C., P-O.V., O.D. and V.L. designed the experiments with critical advices from licenses/by/4.0/.
G.J.P.R., P.A., R.R. and F.V.F.; C.J., A.A-G., K.O., B.P., G.J.P.R., N.A, R.R. and F.V.F.
performed experiments and analyzed the data; P.N. and M-T.H. performed metabolic
network computational analysis; L.P-C., P-O.V., P.A., F.V.F, V.L. and O.D. analyzed the © The Author(s) 2021
data, prepared figures and wrote the manuscript.
COMMUNICATIONS BIOLOGY | (2021)4:217 | https://doi.org/10.1038/s42003-021-01749-3 | www.nature.com/commsbio 15You can also read