Rapid starch degradation in the wood of olive trees under heat and drought is permitted by three stress-specific beta amylases
←
→
Page content transcription
If your browser does not render page correctly, please read the page content below
Research

Rapid starch degradation in the wood of olive trees under heat
and drought is permitted by three stress-specific beta amylases
Mor Tsamir-Rimon1,2, Shifra Ben-Dor3 , Ester Feldmesser3, Yaara Oppenhimer-Shaanan1, Rakefet David-
Schwartz4 , Alon Samach2 and Tamir Klein1
1
Plant & Environmental Sciences Department, Weizmann Institute of Science, Rehovot 76100, Israel; 2The Robert H. Smith Institute of Plant Sciences and Genetics in Agriculture, The Robert
H. Smith Faculty of Agriculture, Food and Environment, The Hebrew University of Jerusalem, Rehovot 76100, Israel; 3Life Science Core Facilities, Weizmann Institute of Science, Rehovot
76100, Israel; 4Institute of Plant Sciences, Agricultural Research Organization, Volcani Center, Rishon LeZion 7505101, Israel

                                                            Summary
Author for correspondence:                                   Carbon reserve use is a major drought response in trees, enabling tree survival in conditions
Tamir Klein                                                 prohibiting photosynthesis. However, regulation of starch metabolism under drought at the
Email: tamir.klein@weizmann.ac.il
                                                            whole-tree scale is still poorly understood.
Received: 10 February 2020                                   To this end, we combined measurements of nonstructural carbohydrates (NSCs), tree physi-
Accepted: 2 June 2020                                       ology and gene expression. The experiment was conducted outside on olive trees in pots
                                                            under 90 d of seasonal spring to summer warming. Half of the trees were also subjected to
New Phytologist (2021) 229: 1398–1414                       limited water conditions for 28 d.
doi: 10.1111/nph.16907                                       Photosynthesis decreased in dehydrating trees from 19 to 0.5 µmol m 2 s 1 during the
                                                            drought period. Starch degradation and mannitol production were a major drought response,
                                                            with mannitol increasing to 71% and 41% out of total NSCs in shoots and roots, respectively.
Key words: carbon source, drought
response, drought tolerance, mannitol, starch
                                                            We identified the gene family members potentially relevant either to long-term or stress-in-
degradation, starch synthesis.                              duced carbon storage. Partitioning of expression patterns among b amylase and starch syn-
                                                            thase family members was observed, with three b amylases possibly facilitating the rapid
                                                            starch degradation under heat and drought.
                                                             Our results suggest a group of stress-related, starch metabolism genes, correlated with NSC
                                                            fluctuations during drought and recovery. The daily starch metabolism gene expression was
                                                            different from the stress-mode starch metabolism pattern, where some genes are uniquely
                                                            expressed during the stress-mode response.

                                                                                                   Mitchell et al., 2013; Klein et al., 2014; Lloret et al., 2018).
Introduction
                                                                                                   Notably, even under stress conditions, trees maintain a mini-
Nonstructural carbohydrates (NSCs), largely starch, are major sub-                                 mum threshold content of NSCs, which may ensure recovery
strates for primary and secondary plant metabolism, including                                      after long dry periods, as proposed by Martınez-Vilalta et al.
functions in energy metabolism, transport and osmoregulation                                       (2016) in a global synthesis. This threshold supports a sur-
(Hartmann & Trumbore, 2016). At a whole plant scale, NSC                                           vival strategy of trees during dry conditions and it suggests
buffers asynchrony of carbon supply and demand, i.e. the temporal                                  NSC as an active sink (Silpi et al., 2007; Bustan et al., 2011;
decoupling between assimilation, respiration and growth. Plants                                    Sala et al. 2012). NSC dynamics also vary on a seasonal
are autotrophic organisms, however their survival must be ensured                                  scale, responding to seasonal changes in soil water content
even in conditions prohibiting photosynthesis, such as deciduous-                                  (SWC) combined with temperature and vapor pressure deficit
ness. For example, in high latitudes, spring leafout in forests is                                 (VPD) and growth phenology, with maintenance of a mini-
largely sponsored by starch degradation in deciduous tree branches                                 mum threshold of NSC content that may ensure recovery
(Keel et al., 2007; Klein et al. 2016). In trees, long-term carbon                                 (Drossopoulos & Niavis, 1988; Bustan et al., 2011; Klein
storage is located in parenchyma woody tissues: branch, stem and                                   et al., 2014). Considering the higher frequency of drought
root (Sauter & van Cleve, 1991; Hartmann & Trumbore, 2016).                                        events recorded in the last decades and their large effects on
When a need for carbon arises, starch and other reserves are                                       tree productivity and survival, NSC metabolism has a sub-
degraded to soluble sugars, which can be mobilized through the                                     stantial role ensuring tree survival under stress (Bustan et al.,
tree in the xylem and inner bark (Bustan et al., 2011).                                            2011; Hartmann & Trumbore, 2016). Though its effect is
   An example for storage depletion following carbon demand                                        potentially critical in understanding tree response to drought,
is under prolonged drought conditions (Chehab et al., 2009;                                        carbon reserve allocation, regulation and effect on tree

1398 New Phytologist (2021) 229: 1398–1414                                                                                                                     Ó 2020 The Authors
          www.newphytologist.com                                                                                                       New Phytologist Ó 2020 New Phytologist Trust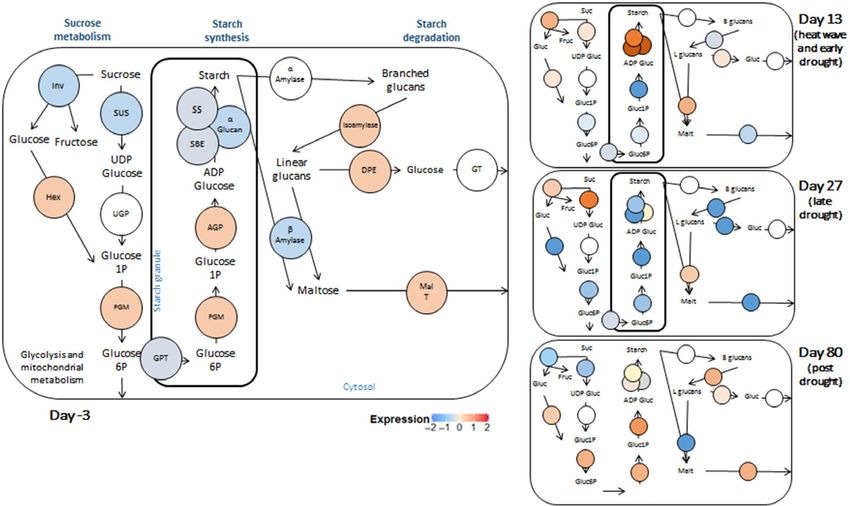
New
Phytologist                                                                                                                          Research 1399

condition are not yet fully known (Mcdowell et al., 2008;              2000). A series of strategies are suggested to assist in the drought
Allen et al., 2010; Klein & Hoch, 2015; Lloret et al., 2018).          resistance of olives, including a strong photosystem repair mecha-
   Unlike Arabidopsis transient leaf starch metabolism, the molec-     nism (Angelopoulos and Dichio, 1996), high regulation of stom-
ular regulation of NSC storage as starch in woody tissues is           atal conductance (Giorio et al., 1999; Nogues & Baker, 2000;
poorly understood. While several steps within starch metabolism        Rodriguez-Dominguez and Brodribb, 2019), osmotic adjust-
in leaves are probably conserved in sink tissues, some steps might     ments (Dichio et al., 2003, 2009; Bustan et al., 2011) and a high
be distinct to heterotrophic organs (Noronha et al., 2018). The        water potential gradient between canopy and root system (Xiloy-
putative pathway in woody tissues begins with carbon transport         annis et al., 1999). Furthermore, the drought resistance of olive is
to sink tissues as sucrose, deriving from source tissues. Sucrose is   expressed by the ability to recover from a very low water potential
converted to glucose-6-phosphate through several stages and then       ( 6 MPa), showing the ability to adsorb up to a soil water metric
transferred by glucose-6-phosphate/phosphate translocator to           of 2.5 MPa. This value is below the standard permanent wilting
starch plastids (Kammerer et al., 1998). In the plastid, it is con-    point of other trees, measured in a meta-analysis study at
verted into glucose-6-phosphate by phosphoglucomutase                    2.3 MPa (Dichio et al., 2003; Bartlett et al., 2016). These
(PGM), then to ADP-glucose by ADP glucose pyrophosphory-               strategies along with maintenance of a significant NSC threshold
lase (AGP) and eventually into starch by starch synthase and           during drought in the olive suggest that starch degradation is also
starch branching enzyme (Fernie et al., 2002; Noronha et al.,          essential as a stress resistance strategy (Chapin et al., 1990; Kobe,
2018). Starch can be modified by a glucan (Zhou et al., 2017).         1997; Bustan et al., 2011). Elucidating the mechanisms allowing
When carbon shortage occurs, there are potentially multiple            olives to bear prolonged droughts can facilitate our understand-
pathways by which starch may be degraded to soluble sugars, for        ing of tree drought resistance in general. The olive tree is native
example by a amylases, b amylases and other enzymes (Witt &            to both orchards and forests in the Mediterranean, where it sur-
Sauter, 1994; Smith, 2007; Zeeman et al., 2010). Starch pathway        vives in naturally occurring dry conditions, and is hence a good
studies in sink tissues have shown expression of enzymes involved      model. Despite its relevance, the molecular regulation of NSC in
in starch synthesis, as sucrose synthase (SUS), AGP and branch-        olive in response to water shortage was not yet been investigated.
ing enzymes, and in starch degradation, such as starch phospho-           In this study, the water stress effect on NSC and starch regula-
rylase, disproportionating enzymes (DPE), de-branching                 tion gene expression were tested in olive trees. During soil drying,
enzymes, a and b amylases, maltose translocators and glucose           photosynthesis gradually declines. During heat waves, VPD
translocators (Smith et al., 2005; Geisler-lee et al., 2006; Regier    spikes and stomatal closure is enforced, regardless of soil condi-
et al., 2009; Silva et al., 2017; Noronha et al., 2018). Addition-     tions, and photosynthesis might shut down. In either separate or
ally, the expression of starch degradation enzymes is higher in        combined stresses, sink tissues such as branches and roots face
sink tissues following abiotic stress (Geisler-lee et al., 2006;       contrasting needs both to store more carbon, while using existing
Regier et al., 2009).                                                  reserves. During recovery from drought, carbon allocation to
   A combination between a molecular approach and physiologi-          storage is often prioritized over growth (Wiley et al., 2017), indi-
cal methods has been done mainly in Arabidopsis thaliana               cating storage importance in plant survival. Our research ques-
research (Sulpice et al., 2009; Hummel et al., 2010), however, it      tions were: which genes involved in consumption of NSCs are
has been rarely done in tree’s woody tissues, which constitutes        differentially expressed (1) during an intensive abrupt heat wave?
the long-term storage tissues in long-lived plants. A few studies      (2) during gradual soil drying? And (3) during recovery from soil
that have been concerned with a blend of starch-related gene           drought? To address these questions, young olive trees grown
expression with NSC content have been done focusing on several         outside in 25-l pots were exposed to limited water conditions and
genes only, using reverse-transcription quantitative polymerase        were monitored during drought and recovery. Confining study
chain reaction (RT-qPCR) (Regier et al., 2009; Pagliarani et al.,      trees to pots allowed us to more fully regulate access to soil water
2019). Despite the enduring interest in the molecular regulation       than would have been possible with field-grown trees. The mea-
of NSC metabolism in storage organs, knowledge is still limited        surements included tissue concentrations of starch and soluble
about the genes involved in NSC synthesis and degradation fol-         sugars, RNA expression levels of genes encoding enzymes
lowing drought, and more so within large gene families. Our aim        involved in starch synthesis and degradation, leaf gas exchange
is to broaden current knowledge of starch metabolism in woody          and water potential. By analyzing these parameters simultane-
tissues and its relation to tree drought resistance mechanisms.        ously, we pointed to novel potential genes involved in this major
   Olive (Olea europaea L.) is an evergreen broadleaf tree species,    metabolic pathway in olive trees, a drought-resistant species.
which is traditionally cultivated in rain-fed orchards in the
Mediterranean basin (Loumou & Giourga, 2003). The preva-
                                                                       Materials and Methods
lence of olives grown in arid and semi-arid areas, where plants are
frequently subjected to high temperatures and droughts, indicates
                                                                       Plant material and climate
olives high resistance to water deficiency. This resistance also
enables high metabolic activity in summer (as in fruit produc-         A group of 12 3-yr-old olive trees (Olea europaea L. cv Souri) was
tion). Even among other Mediterranean species, such as                 purchased from a local nursery and transplanted into 25-l pots in
Rosmarinus officinalis L. and Lavandula stoechas L., olive responds    the Weizmann Institute in November 2017. The large pots were
better to soil drought across many indexes (Nogues & Baker,           chosen to support root growth and overall plant development.

Ó 2020 The Authors                                                                                        New Phytologist (2021) 229: 1398–1414
New Phytologist Ó 2020 New Phytologist Trust                                                                        www.newphytologist.com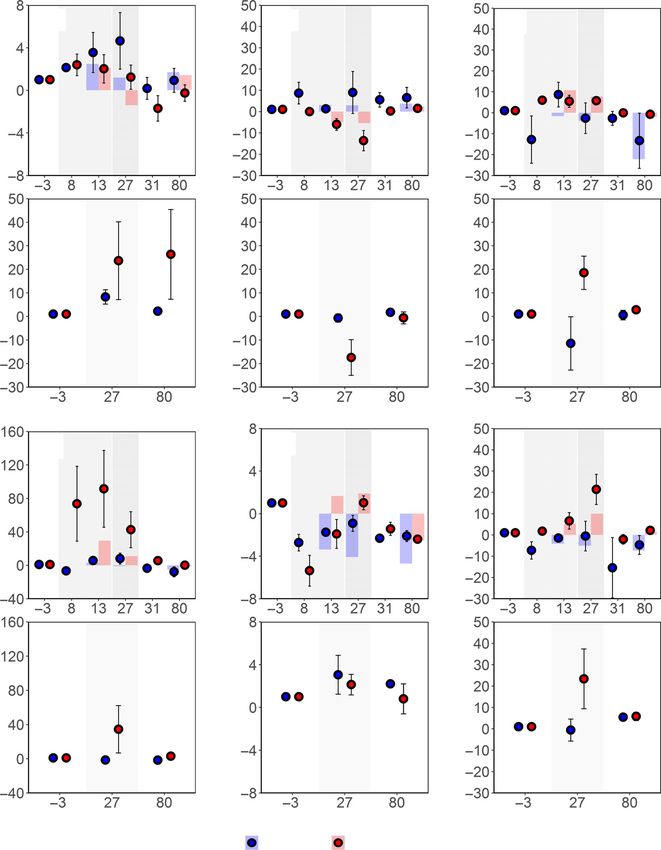
New
1400 Research                                                                                                                           Phytologist

     Planting soil was peat and tuff (50 : 50) and tree height was             1000 µmol m 1 s 1 at ambient air temperature and humidity.
     1.6 m  0.1. Trees were kept outside under optimal irrigation of          Carbon dioxide (CO2) was set to 400 ppm, matching ambient
     1.2 l d 1 for a 5-month acclimation period. The experiment was            CO2 levels. Gas exchange rates were further calibrated to the leaf
     conducted during May–July 2018. In April, before the experi-              actual area by scanning measured leaves and estimating projected
     ment began, flowers were removed manually from trees to avoid             leaf area. Gas exchange measurements were accompanied by leaf
     fruit set and minimize variance between branches. Climate dur-            water potential (Ψl) using the pressure chamber technique
     ing the experiment was hot and dry with heat waves in May and             (Scholander et al., 1965). Woody branches of 5–7 cm long (after
     a gradual increase in temperature during June (Fig. 1). Extreme           leaf and green shoot removal) were cut from three trees of each
     temperatures (daily means of 30.5 to 32.7°C) were documented              treatment (the trees that were used for gas exchange measure-
     on days 8 and 12 of the water deficiency period, on the dates             ment) and put in a Scholander pressure chamber after the leaves
     May 18 and 22, respectively. In these heat wave episodes, VPD             were covered for 15 min (PMS Instrument, Albany, OR, USA)
     increased to > 3 kPa. During the whole period, mean tempera-              fed by a nitrogen gas cylinder. Gas pressure within the chamber
     ture varied between 20.9 and 32.7°C (Fig. 1). Two rain events,            was gradually increased (c. 1 MPa min 1) until water emerged
     of 4.8 mm each, took place during the experiment (in May). In             from the protruding cut branch surface, and the negative value of
     the water deficiency period, the tree pots were covered to avoid          the pressure was recorded as the water potential (Ψl) in megapas-
     water input from rain.                                                    cals (MPa).

     Experimental design                                                       Nonstructural carbohydrate (NSC) analysis
     Six trees out of 12 were exposed to limited water conditions for          The collected branch and root samples were powdered in liquid
     28 d. In the first 2 wk, dried trees were irrigated with 1 l wk 1 to      nitrogen with mortar and pestle, then lyophilized (Gamma 2-16
     enable gradual acclimation to the drought. From day 14 of the             LSCplus; Christ, Osterode am Harz, Germany) for 48 h and
     experiment, there was no irrigation for the dried trees for another       ground again, using a Retsch Mixer Mill (MM301; Retsch
     14 d. The timing of measurement days and re-irrigation was                GmbH, Haan, Germany), to a fine powder. Soluble sugar extrac-
     determined according to the tree’s physiological conditions, con-         tion was done by an adjusted protocol Quentin et al., 2015.
     sidering their pre-drought levels of photosynthesis, stomatal con-        Sugars were separated in an analytical high-performance liquid
     ductance and water potential. The six watered trees were irrigated        chromatography (HPLC) system (Intelligent System; Jasco,
     continuously with 1.2 l d 1. Measurements were conducted on               Tokyo, Japan) fitted with a Sugar-Pak I column (6.5 mm
     six campaign days: (1) 3 d before drought treatment (day 3, 7             9 300 mm; Waters, Milford, MA, USA) using a refractive-index
     May); (2)–(4) once a week following irrigation cessation (days 8,         detector (Kontron Instruments, Zurich, Switzerland). Starch was
     13 and 27, on 07:00–09:00 h 18, 23 May and 6 June, respec-                quantified according to Landh€ausser et al., 2018 by an enzymatic
     tively); (5) 3 d after re-irrigation (day 31, 10 June); and (6) at full   reaction involving hexokinase. An enzyme blend of glucose assay
     recovery (day 80, 29 July), 52 days after re-irrigation. On each          reagent (cat no. G3293-50ML; Sigma Aldrich, St Louis, MO,
     sampling day, material was collected and physiological measure-           USA) was added to the final solution that was quantitatively ana-
     ments were performed at 07:00–09:00 h. Woody branches c.                  lyzed using spectrophotometry by evaluating the accumulation of
     15 cm long were collected after leaf and green shoot removal on           NADPH.
     all sampling days. Roots were collected on days 3, 27 and 80
     only, in order to minimize disturbance to the soil and root sys-
                                                                               RNA extraction, library construction and RNA sequencing
     tem. Collected roots were c. 15 cm long. After collection, the tis-
     sues were ground, and aliquots from the same branches and roots           Twenty-four branch samples were selected for transcriptome
     were taken for the various assays (NSC and RNA measurements).             analysis: three trees each from each treatment group (watered
     The samples of branches and roots that were used constituted c.           trees: Oe3, Oe9 and Oe11, and dried trees: Oe4, Oe8 and Oe12)
     0.1% of the tissue biomass, calculated by allometric equations            from four time points. The four time-points were day 3 (base-
     based on tree height and diameter (Ruiz-Peinado et al., 2012).            line), day 13 (heat wave and early drought), day 27 (late drought)
     Volumetric soil water content was measured on each measure-               and day 80 (post-drought). On days 13 and 27, the dried trees’
     ment day with moisture sensors (EC-10; Decagon Devices,                   assimilation was c. 15% and c. 0% out of pre-drought assimila-
     Washington, DC, USA).                                                     tion, respectively. RNA samples (branch and root) from the
                                                                               remaining trees and the sequenced trees were used for RT-qPCR
                                                                               measurements. Collected samples for RNA extraction were stored
     Leaf gas exchange and water potential
                                                                               at 80°C and powdered with mortar and pestle in liquid nitro-
     During the experiment, leaf gas exchange, (i.e. transpiration and         gen. Extraction was conducted according to Gambino et al.
     net assimilation) and water potential were measured once a week           (2008), using cetyltrimethylammonium bromide (CTAB) (Gam-
     on 3–5 trees from each treatment to monitor the tree’s physiolog-         bino et al., 2008). To adjust the extraction to the specific experi-
     ical responses. Measurements were made with a Walz GFS-3000               ment and tissue (wood samples), a few modifications were made:
     photosynthesis system (Heinz Walz GmbH, Effeltrich, Ger-                  samples were incubated at 65°C with CTAB for 25 min and satu-
     many), equipped with a lamp, set to a light intensity of                  rated with lithium chloride (LiCl) overnight. RNA quantity was

     New Phytologist (2021) 229: 1398–1414                                                                                         Ó 2020 The Authors
     www.newphytologist.com                                                                                New Phytologist Ó 2020 New Phytologist Trust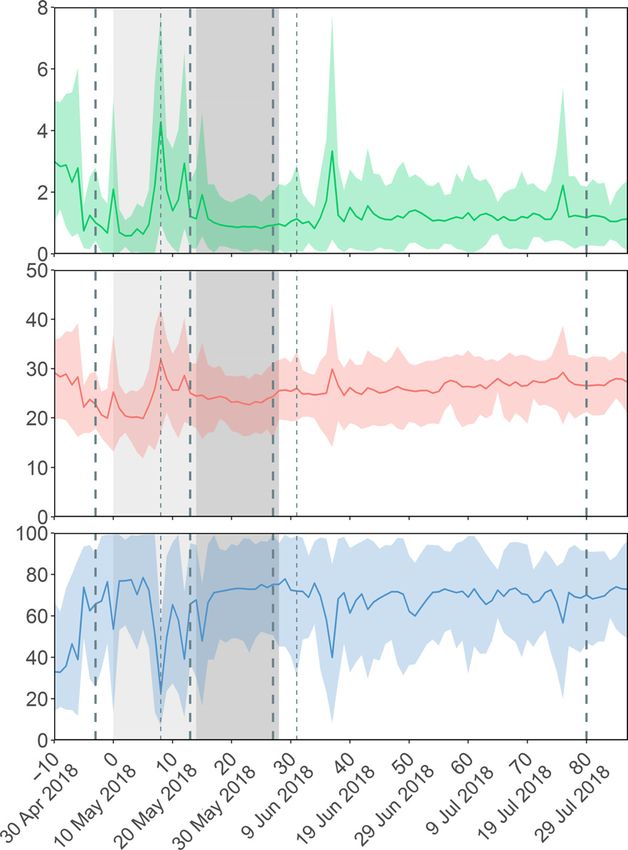
New
Phytologist                                                                                                                       Research 1401

                                                                                         Fig. 1 Site meteorological conditions during
                                                                                         the experiment: daily mean vapor pressure
                                                                                         deficit (VPD; top); daily mean temperature
                                                                                         (middle; including a seasonal trend line); daily
                                                                                         mean relative humidity (bottom). Colored
                                                                                         areas represent the range between daily
                                                                                         maximum and minimum values. Gray shaded
                                                                                         area represents water limitation period, with
                                                                                         light gray (days 0–14) indicating drought
                                                                                         acclimation and dark gray (days 14–28)
                                                                                         indicating drought. Dashed vertical lines
                                                                                         indicate time points of carbohydrate and
                                                                                         gene expression measurements, with thick
                                                                                         lines indicating RNA-seq measurements and
                                                                                         thin lines indicating RT-qPCR measurements.

determined using a NanoDrop 1000 spectrophotometer
                                                                    Manual sequence curation, transcriptome assembly, and
(NanoDrop, Wilmington, DE, USA) and RNA quality was ana-
                                                                    enrichment analysis
lyzed using the 2200 TapeStation System (Agilent Technologies,
Santa Clara, CA, USA) according to the manufacturer’s protocol.     A full description of the applied bioinformatic methods is
All RNA samples presented 260/280 and 260/230 purity and an         included in the Supporting Information (Methods S1). Briefly,
RNA Integrity Number (RIN) > 5. Library preparation and             19 enzyme families involved in sucrose metabolism, starch
sequencing was done by the Genomics Unit at the Grand Israel        metabolism and starch degradation were selected (Fernie et al.,
National Center for Personalized Medicine (G-INCPM) at the          2002; Smith, 2007; Noronha et al., 2018). Known sequences of
Weizmann Institute of Science (Rehovot, Israel). Libraries were     the selected enzymes were found in the Kyoto Encyclopedia of
constructed with barcodes to allow multiplexing of all 24 samples   Genes and Genomes (KEGG) pathway database. All protein
in one lane, including three branch samples from each treatment     sequences were compared to genomes from olive and other tree
(watered and dried) from four time points. Two lanes with all       species, and to an unpublished genome of Olea europaea L. cv
samples were sequenced. Between 10 and 20 million single-end        Souri, created by Dr Ben-Ari (ARO). The final DNA sequences
60-bp reads were sequenced per sample using an Illumina HiSeq       are included in Table S1, and the number of members in each
2500 V4 instrument.                                                 family are presented in Table 1. A new gene set was built

Ó 2020 The Authors                                                                                   New Phytologist (2021) 229: 1398–1414
New Phytologist Ó 2020 New Phytologist Trust                                                                   www.newphytologist.com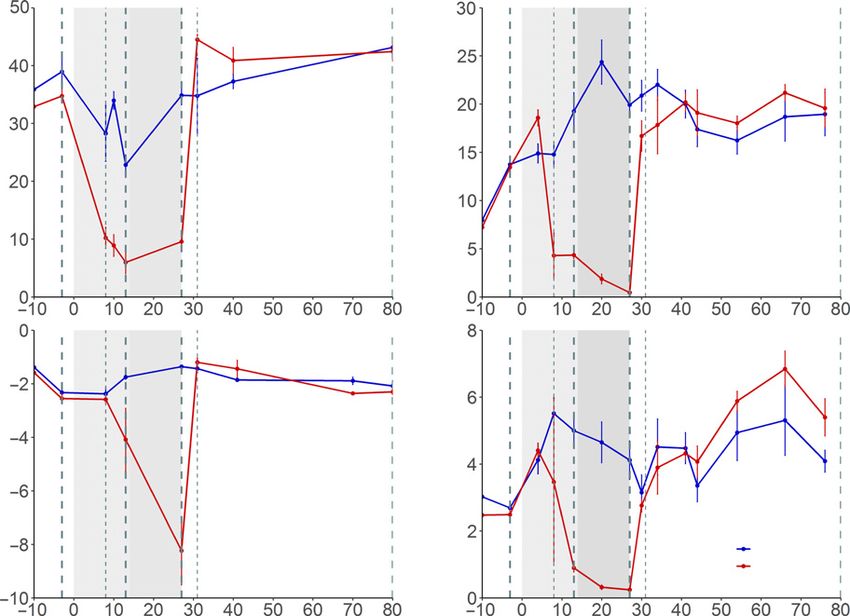
New
1402 Research                                                                                                                                 Phytologist

     integrating the manually curated genes with the automated anno-                 with Bonferroni adjustment, comparing samples from different
     tation. Differentially expressed (DE) genes from baseline values                days of the same tissue and treatment. These tests were conducted
     (unless specified differently), were identified by applying the                 with the software R (v.3.1; the R Foundation for Statistical Com-
     DESeq2 program (Love et al., 2014). The final DESeq2 analysis                   puting, Vienna, Austria), using the packages AGRICOLAE (v.1.3-0,
     is available as Table S2. Gene ontology (GO; Table S3) and                      2019) for the Kruskal–Wallis test and R STATS core package for
     KEGG orthology (KO) annotations were obtained from the Joint                    the Mann–Whitney test. Principle component analysis (PCA)
     Genome Institute (JGI) portal. Finally, a phylogenetic tree was                 was performed with R STATS core package, including missing data
     constructed with related genes from a wide variety of plant                     correction by the package MISSMDA (v.1.13, 2020) based on
     species (Methods S1). Details of the sequences used in this phylo-              Dray & Josse (2015). Statistical tests for the gene expression
     genetic tree are included in Table S4.                                          levels are detailed in the respective sections earlier.

     cDNA synthesis and gene expression analysis by qPCR                             Results
     From each time point 8–12 RNA samples, including not
                                                                                     Physiological response to water limitation
     sequenced samples, were treated with RQ1 RNase-free DNase
     (Promega, Madison, WI, USA) according to the manufacturer’s                     Dried trees showed a sharp decrease in leaf gas exchange along
     instructions. Complementary DNA (cDNA) was synthesized                          with a decline in leaf water potential, in correspondence with
     with the qScript cDNA synthesis kit (Quanta Biosciences,                        SWC decrease. Watered trees SWC fluctuated slightly through-
     Gaithersberg, MD, USA). Reactions were conducted using                          out the experiment due to heatwaves, yet still differed from dried
     Fast SYBR® Green master mix (Applied Biosystems, Foster City,                   trees, where SWC decreased sharply during drought (Fig. 2a).
     CA, USA) on QuantStudio 5 Real-Time PCR System, 384-well                        Water potential of dried trees became more negative in drought,
     (Applied Biosystems) in triplicates. To determine DCT, samples                  in correspondence to SWC, two-fold and six-fold less than
     were normalized to the housekeeping gene ATPase (ATPase, V0/                    watered trees in days 13 and 27, respectively. Three days after re-
     A0 complex, subunit C/D), the most stable gene in RNAseq                        irrigation, water potential increased from 8.23 MPa at day 27
     results. DDCT was determined by subtracting DCT of day 3                        to 1.19 MPa (Fig. 2b). Among leaf gas exchange results, assimi-
     out of DCT of the current measurement day for each tree.                        lation of watered trees showed a rather stable trend, increasing
                                                                                     from 14.7 µmol m 2 s 1 at day 8 to 24.3 µmol m 2 s 1 at day
                                                                                     20. In dried trees, assimilation decreased from
     Statistical analysis
                                                                                     13.4 µmol m 2 s 1 on day 3 to 0.5 µmol m 2 s 1 on day 27
     Data of leaf gas exchange, water potential, NSC and RT-qPCR                     (the last day of water limitation) (Fig. 2c). These differences
     were statistically analyzed using the nonparametric Mann–Whit-                  mean that the assimilation rate in dried trees was 29%, 8% and
     ney test with Bonferroni correction, to determine significant dif-              2% of the assimilation of watered trees on days 7, 20 and 27,
     ferences between dried and watered trees in each measuring day.                 respectively. Three days after re-irrigation, the assimilation rate
     NSC measurements were also analyzed by Kruskal–Wallis test                      of dried trees matched that of watered trees. The changes in

     Table 1 Number of genes within each of the 19 manually curated gene families.

     Process                                 Gene name                                              Number                        Catabolism/anabolism

     Sucrose metabolism                      Invertase                                              11                            Catabolism
                                             Hexokinase                                              9                            Anabolism
                                             Sucrose synthase                                       12                            Catabolism
                                             UDP-glucose pyrophosphorylase                           2                            Anabolism
                                             Phosphoglucomutase                                      4                            Anabolism
                                             Glucose-phosphate translocator                          5                            Catabolism and anabolism
     Starch synthesis                        ADP-glucose pyrophosphorylase                           8                            Anabolism
                                             Starch synthase                                         9                            Anabolism
                                             Starch branching enzyme                                 5                            Anabolism
     Starch degradation                      Isoamylase                                              3                            Catabolism
                                             a-Glucan                                                2                            Anabolism
                                             a-Amylase                                               5                            Catabolism
                                             b-Amylase                                              13                            Catabolism
                                             Disproprtionating enzyme                                2                            Catabolism
                                             Starch phophorylase                                     4                            Catabolism
                                             Maltose transporter                                     3                            Catabolism and anabolism
                                             Glucose transporter                                     1                            Catabolism and anabolism
     Polyol metabolism                       Polyol transporter                                      3                            Catabolism and anabolism
                                             Mannose-6-phosphate reductase                           2                            Anabolism

     New Phytologist (2021) 229: 1398–1414                                                                                               Ó 2020 The Authors
     www.newphytologist.com                                                                                      New Phytologist Ó 2020 New Phytologist Trust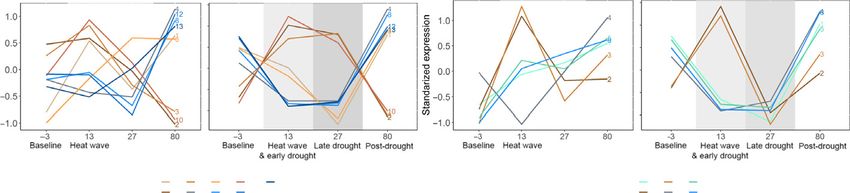
New
Phytologist                                                                                                                                     Research 1403

transpiration rate demonstrated the same patterns, albeit with                 showed a decreasing trend through the drought period, although
increased transpiration in the last part of the experiment, and                not significantly different from watered trees on the same day. To
more so in re-irrigated trees (Fig. 2d).                                       summarize the overall effects of all of the various factors (physio-
                                                                               logical conditions, weather, etc.) PCA was performed on all of
                                                                               the conditions together, and revealed that physiological and
NSCs in branches and roots
                                                                               weather conditions had a strong influence of VPD on NSCs and
The largest drought responses amongst stored NSCs were the                     leaf gas exchange on day 8, while other measurement days were
increase in mannitol and decrease in starch in branches of the                 mostly influenced by SWC (Fig. S1).
dried trees. Total NSCs in branches was similar across dried and
watered trees, in that it had a decrease on day 8 and an increase
                                                                               Transcriptional changes in branches following water
in summer. However, NSC component partitioning differed
                                                                               limitation
between watered and dried trees (Fig. 3). The watered trees sol-
uble sugar concentration was steady, while starch fluctuations                 To study the dynamics of the molecular changes under drought
contributed the most to the seasonal changes. In dried trees,                  stress and during recovery, DE genes were grouped into three
starch percent dropped to 0% dry matter (DM) at days 8 and 27,                 clusters based on their expression trend along the course of the
with a minor increase in day 13 to 0.3% DM. On day 8, there                    experiment (Fig. 4a). Cluster 1, with 5477 genes, displayed genes
was no significant difference between watered and dried trees.                 with persistent downregulation during drought and upregulated
Mannitol was the main NSC component through all treatment                      in recovery; cluster 2 (1397 genes) displayed genes downregu-
days, up to 71% of total NSCs on day 27. Likewise, sucrose                     lated increasingly throughout drought days and upregulated in
showed the same pattern as mannitol with a lower peak. By con-                 recovery; and cluster 3 (5250 genes) displayed genes with higher
trast, glucose and fructose in dried trees resembled watered trees             expression during drought. GO enrichment analysis was per-
in all time points except day 31 (3 d after re-irrigation), when               formed on DE genes in all three clusters (Fig. 4b; for full data see
they increased, though not significantly, by a factor of two and               Table S3). Among the enriched biological functions with a highly
seven, respectively, compared to watered trees on the same day.                significant P-value (P < 0.01), which were assigned to clusters 1
NSC patterns in roots showed a smaller effect of the drought and               and 2, we identified numerous processes related to starch
re-irrigation than in branches. Starch in the dried tree roots                 metabolism. These included starch catabolic process,

                                                                      (a)                                                (c)

                                                                      (b)                                                (d)

Fig. 2 Changes in soil water content (n = 6 except for day 38, n = 2) (a), water potential (n = 3–4) (b), rate of assimilation (n = 3–5) (c), and rate of
transpiration (n = 3–5) (d) of dried and watered Olea europaea trees. Each value represents a mean of number of trees, represented by a number next to
the point. Between one and two leaves were collected from each tree. The x-axis represents the number of days from the beginning of treatment. Gray
shaded area represents water limitation period, light gray (days 0–14) indicates drought acclimation and dark gray (days 14–28) indicates drought. Dashed
vertical lines indicate time points of carbohydrate and gene expression measurements, where thick lines in gene expression measurements indicate RNA-
seq measurements and thin lines indicate RT-qPCR measurements. Error bars indicate SE.

Ó 2020 The Authors                                                                                                   New Phytologist (2021) 229: 1398–1414
New Phytologist Ó 2020 New Phytologist Trust                                                                                   www.newphytologist.com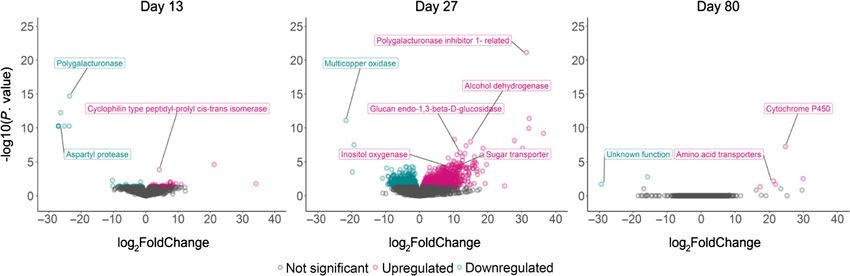
New
1404 Research                                                                                                                                               Phytologist

               (a)                                                                        (c)

               (b)                                                                        (d)

     Fig. 3 The effect of water limitation period on nonstructural carbohydrate (NSC) content (in percent of dry matter; DM) in branches ((a), (c); n = 4–6) and
     roots ((b), (d); n = 5–6) of Olea europaea. Bars indicate NSC content (glucose, fructose, sucrose, mannitol and starch). Gray shaded areas represent water
     limitation period, where light gray indicates drought acclimation and dark gray indicates drought. Results of Kruskal–Wallis test, which compared between
     the days of each treatment and tissue, are shown above each bar. Different lowercase letters are significantly different (P < 0.05). Error bars represent SE.

         (a)                                                                                                 (b)
                                                                                                                Group Process name
                                                                                                                      posive regulaon of response to external smulus
                                                                                                                      response to water deprivaon
                                                                                                                      carbohydrate metabolic process
                                                                                                                      energy reserve metabolic process
                                                                                                                 CM
                                                                                                                      starch biosynthec process
                                                                                                                      starch catabolic process
                                                                                                            1         amylopecn biosynthec process
                                                                                                                      glucose metabolic process
                                                                                                                  PH photosynthesis, light harvesng
                                                                                                                      protein ubiqunaon
                                                                                                                      cellulose biosynthec process
                                                                                                                  CR
                                                                                                                      microtubule- based process
                                                                                                                      transmembrane
                                                                                                                      starch metabolic process
                                                                                                                 CM
                                                                                                            2
                                                                                                                      hexose metabolic process
                                                                                                                  PH chlorophyll biosynthec process
                                                                                                                  CR NADP biosynthec process
                                                                                                                 CM inositol catabolic process
                                                                                                                      transmembrane transport
                                                                                                                      carbon fixaon
                                                                                                                  PH photosynthec electron transport in photosystem II
                                                                                                            3         celluar respiraon
                                                                                                                      coenzyme metabolic process
                                                                                                                      organonitrogen compound catabolic process
                                                                                                                 CM ribonucleoside bisphosphate metabolic process
                                                                                                                      purine nucleoside bisphosphate metabolic process

     Fig. 4 (a) Heatmap based on clustering of 12 124 differentially expressed genes in dried and watered Olea europaea branches. Orange and blue bars
     represent positive and negative changes, respectively, and the intensity of the color represents the normalized log2 expression level at each stage (days 3,
     13, 27 and 80) for the mean of three sequenced trees in each treatment. Each gene was normalized to itself. (b) Significantly enriched biological functions
     (P < 0.01; partial list) related to clusters as displayed in (a). Colors indicate clusters as in (a). For a full list of enriched biological pathways in each cluster,
     see Supporting Information. Functions were divided into groups as following: carbohydrates metabolism (CM), photosynthesis (PH) and cellular regulation
     (CR).

     New Phytologist (2021) 229: 1398–1414                                                                                                           Ó 2020 The Authors
     www.newphytologist.com                                                                                                  New Phytologist Ó 2020 New Phytologist Trust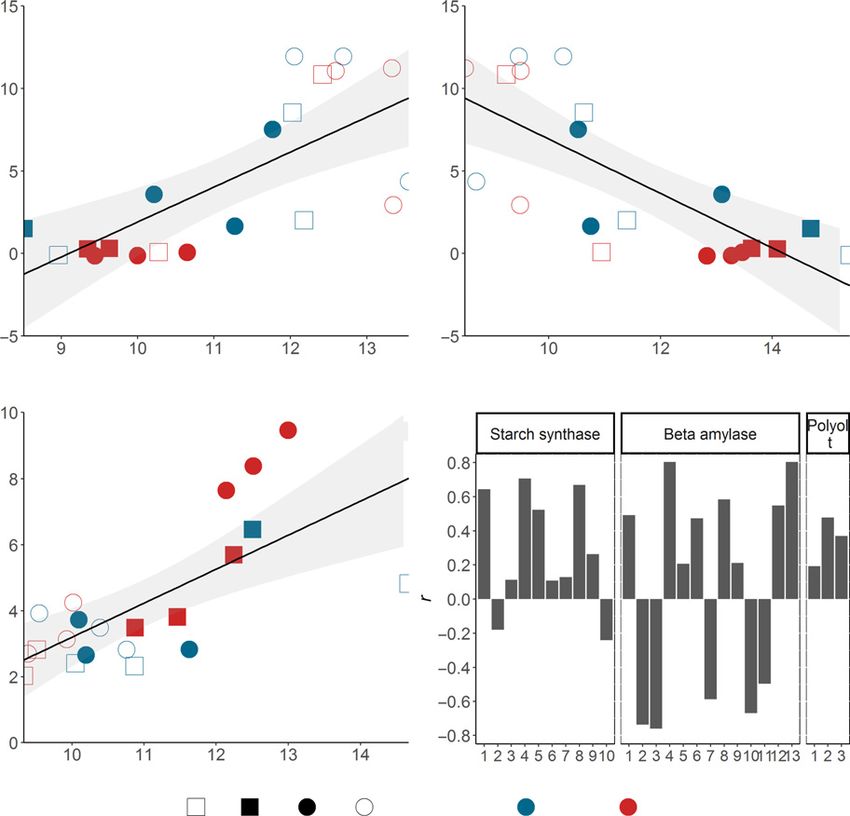
New
Phytologist                                                                                                                                      Research 1405

amylopectin biosynthesis and glucose metabolic process. Cluster                 (shown in Table 1). Among these, 59 were DE within at least
3 contained, among others, processes involved in inositol                       one comparison out of the DESeq2 comparisons between all
metabolism and in cellular respiration.                                         measurement days and treatments (Fig. 6). We identified the car-
                                                                                bon storage process gene family members relevant to drought
                                                                                stress conditions. Among genes related to the starch synthesis
Differentially expressed genes under soil drought
                                                                                process, four genes were significantly upregulated in dried trees
Volcano plots of DE genes in dried trees compared to watered                    on day 13 (heat wave and early drought) as compared to day 3
trees were drawn according to the DESeq2 results, where DE                      (baseline): starch synthases 2, 3, 4 and a glucan 2 (FDR < 0.05).
genes had a false discovery rate (FDR) lower than 0.05 (Fig. 5;                 Starch branching enzyme (SBE) was also upregulated in dried
for full data see Table S2). On day 13 (heat wave and early                     trees in day 13 (early drought), compared to day 27 (late
drought) following water cessation, 72 DE genes were upregu-                    drought). In addition, starch synthase 3 expression was signifi-
lated and 42 were downregulated, e.g. genes related to cell wall                cantly induced on day 13 (heat wave and early drought) in
synthesis (polygalacturonase) and protein degradation (aspartyl                 watered trees, along with a significant downregulation of AGP 2
protease), in dried trees compared to watered trees. On day 27                  (Fig. 6) (day 13, heat wave, compared to day 3, baseline, in
(late drought), by contrast, 1348 DE genes were upregulated and                 watered trees, FDR < 0.05). Other starch synthases, such as
1195 DE genes were downregulated (dried vs watered trees).                      starch synthase 1 and 8, were significantly downregulated
Among the upregulated genes were genes related to cell wall syn-                throughout water limitation and were upregulated only at the
thesis (polygalacturonase inhibitor 1-related and chitinase), alco-             end of recovery. Additional drought-induced downregulated
hol degradation (alcohol dehydrogenase), sugar transport                        starch synthesis genes were AGP 1, 2, 5 and 6.
(sucrose transporter SWEET15), ethylene biosynthesis (methion-                     The starch degradation drought-induced genes were upregu-
ine adenosyltransferase and aminocyclopropanecarboxylate oxi-                   lated throughout the drought period, (days 13 and 27 compared
dase), ABA synthesis (b glucosidase) and stress related proteins                to baseline values), with downregulation in recovery. This group
(dehydrins). On day 80 (post-drought), only seven genes were                    includes b amylases 2 and 10 (Fig. 7), along with Polyol trans-
DE, 5 and 2 upregulated and downregulated, respectively. Four                   porter 2. By contrast, other family members of b amylase, such as
of the genes had unknown function, while genes such as amino                    b amylase 12, were downregulated in drought, followed by
acids transporters and cytochrome P450 were upregulated. In                     upregulation in recovery. In order to compare the olive b amylase
summary, the largest number of DE genes were found on day 27,                   genes to others with known functions from other plant species, a
while on days 13 and 80 the number of DE genes was 22-fold                      phylogenetic tree was constructed (Fig. S2). O. europaea’s b amy-
and 363-fold less than on day 27, respectively.                                 lases 2 and 10 are homologs of A. thaliana b amylase 9, in clade
                                                                                V (Thalmann et al., 2019). Another essential phase in starch
                                                                                metabolism includes sucrose-related genes that are involved with
Expression patterns of starch regulation genes
                                                                                sucrose metabolism before glucose-6-phosphate enters the amylo-
RNA-seq results regarding starch regulation genes generated                     plast. Sucrose-related genes are expressed in different patterns.
some interesting results in terms of DE genes and their expression              The first was drying-induced upregulation, which persisted
trends along the drought period. Eighty-nine genes were                         throughout the drought period in invertase 11, along with a sig-
expressed in branch tissue out of 103 manually curated genes                    nificant upregulation in day 27 (compared to well-watered trees)

 (a)                                             (b)                                                (c)

Fig. 5 Summary of changes in gene expression in response to drought as measured by RNA-seq analysis of Olea europaea branches. Volcano plots with
gene expression ratios (log2 fold change) plotted against the negative log10-transformed P-values from a t-test calculation. Fold changes were calculated
by the DESeq2 program. Gene expression ratios are shown between dried and watered trees on day 13 (a, heat wave and early drought), day 27 (b, late
drought) and day 80 (c, post-drought). Significantly upregulated genes with false discovery rate (FDR) < 0.05 are shown as pink spots, downregulated
genes are shown as blue spots and nonsignificant genes are shown as gray spots.

Ó 2020 The Authors                                                                                                    New Phytologist (2021) 229: 1398–1414
New Phytologist Ó 2020 New Phytologist Trust                                                                                    www.newphytologist.com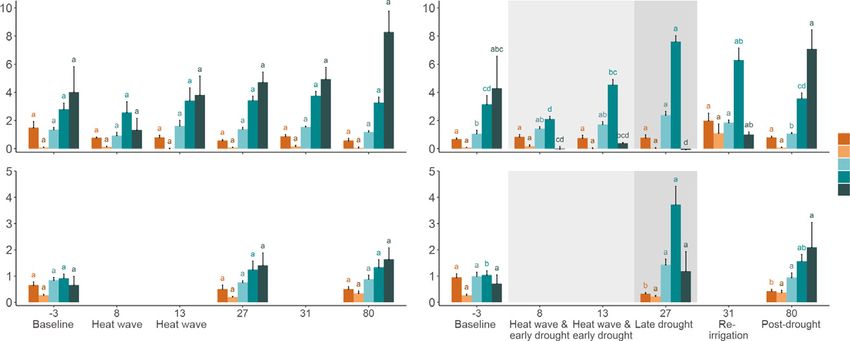
New
1406 Research Phytologist
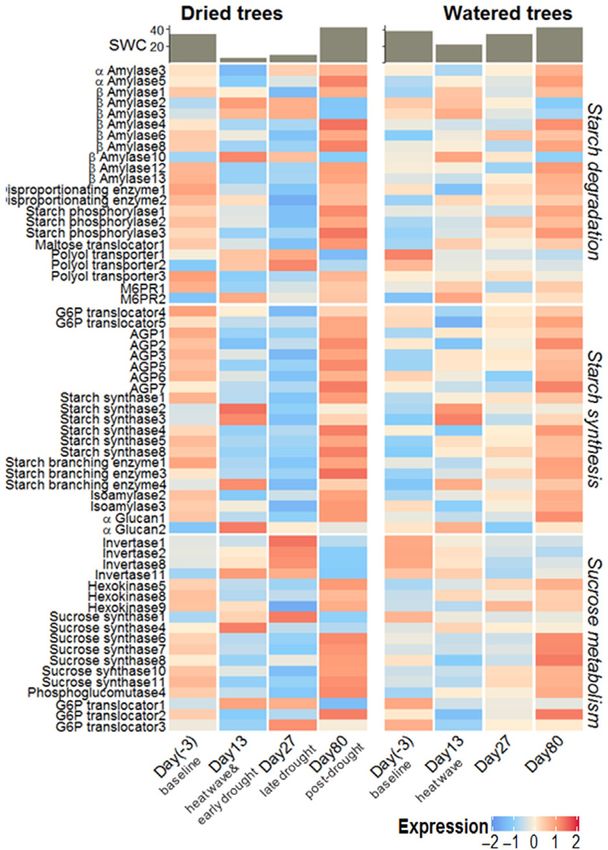
Fig. 6 Heatmap diagram showing the
seasonal and drought-related dynamics of
differentially expressed starch regulation
genes in branches of watered and dried trees.
Differentially expressed genes in at least one
DESeq2 comparison were included. Red and
blue represent positive and negative
changes, respectively. Intensity of the color
represents the normalized log2 expression
level at each stage (days 3, pre-drought;
day 13, heat wave; day 27, late drought; day
80, post-drought) for the mean of three
sequenced samples in each treatment. Bars
on top represent soil water content (SWC) on
each day for the mean of three sequenced
trees in each treatment.
(a) (b) (c) (d)
Fig. 7 Profile of normalized expression of b amylases of watered (a) and dried trees (b), and starch synthases of watered (c) and dried trees (d) in Olea
europaea branches. Each line represents mean normalized log2 expression level of three trees across experiment days. Gray shaded areas represents the
drought period, where light gray indicates drought acclimation and dark gray drought. Colors indicate different members in the gene family.
New Phytologist (2021) 229: 1398–1414 Ó 2020 The Authors
www.newphytologist.com New Phytologist Ó 2020 New Phytologist Trust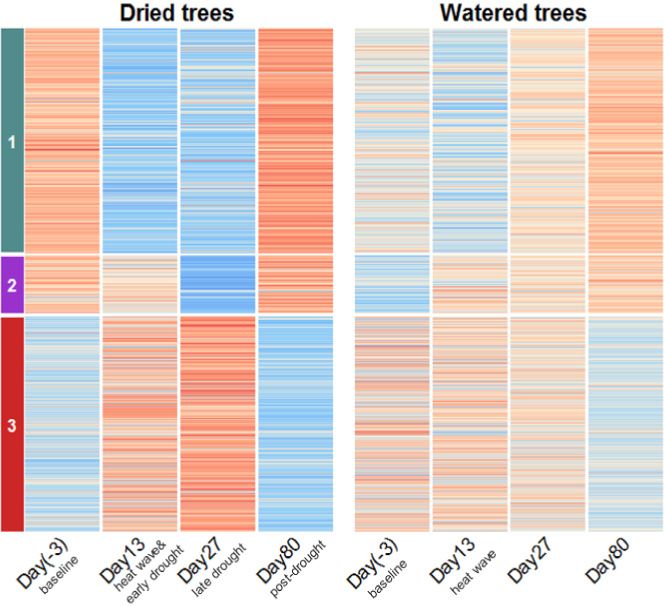
New
Phytologist                                                                                                                        Research 1407

in invertases 1, 2, 8 and SUS 1. Another pattern exhibited was        O. europaea. The relationships between molecular and biochemi-
downregulation of SUSs 6, 7, 10 and 11 as compared to baseline        cal responses, supported by physiological responses, sharpen our
values.                                                               knowledge about the role of starch metabolism in olive’s survival
   Recovery of dried trees was clearly demonstrated at the molec-     strategies under drought. We show that the day-to-day gene
ular level, with 49 differentially expressed genes, 38 of them        expression of the starch metabolism machinery is distinct from
upregulated. In watered trees, no significant changes in gene         stress-mode, with specific genes being uniquely expressed due to
expression were observed between day 80 and day 27. Among             the stress-mode response in olive storage tissue. The identifica-
recovered trees, genes that were significantly upregulated were       tion of stress-specific genes within the manually built gene fami-
related to starch synthesis (starch synthases 1, 4, 5, 8 and AGPs     lies indicate that these genes are good candidates for further
1, 2 and 5) as well as starch degradation genes (starch phosphory-    study, which can contribute to the effort of finding or even
lases 1, 2 and b amylases 1, 4, 6, 8 and 12). To summarize the        designing drought protected forest trees, or, alternatively, faster
expression patterns of starch regulation genes, partitioning          growing fruit trees (by decreasing the activity of starch synthesis
among gene families was observed, where some members of the           genes in favor of growth). Pinpointing the specific enzymes
families of starch synthase, b amylase and polyol transporter were    responsible for carbon reserve management under heat, drought,
upregulated following drought (while other members were               and recovery, is also critical to deciphering tree mortality mecha-
showed the opposite). Upregulation during drought was followed        nisms (McDowell et al., 2008; Mitchell et al., 2013). A discus-
by downregulation in recovery (which families?).                      sion of transcriptomic changes in other carbon metabolism
   Quantitative PCR (qPCR) was used to validate treatment-            genes, other than starch, in olive under drought is included in the
specific expression patterns in six differentially expressed genes    Notes S1.
with the addition of root gene expression measurements (Fig. 8).
All tested genes exhibited expression patterns that were consistent
                                                                      Identification of the gene family members related to starch
across the two platforms. However, there were slight differences:
                                                                      synthesis and degradation processes under stress based on
b amylase 10 expression in watered trees was higher in RT-qPCR
                                                                      their expression
than RNA-seq. In addition, polyol transporter 1 expression
increased on day 27 in qPCR, and not on day 13, as seen in            Our results distinguish gene family expression patterns between
RNA-seq.                                                              irrigated and drought conditions. On day 13 (heat wave and early
                                                                      drought), an upregulation in dried trees was observed among sev-
                                                                      eral starch synthesis genes as starch synthases 2, 3, 4, a glucan 2
Correlations between expression of starch metabolism
                                                                      and SBE 4. Starch synthase 3 expression was also significantly
genes and their substrates
                                                                      induced by heat alone, i.e. in watered trees. In examination of the
To integrate metabolites and gene expression in response to           starch metabolism from a whole process perspective, based on
drought, correlation between expression of starch metabolism          available literature (Fernie et al., 2002; Smith et al., 2005;
genes and their putative substrates or products were examined. A      Noronha et al., 2015), the genes mentioned earlier are assigned
positive correlation was demonstrated between the starch syn-         to families involved in the final stages of starch synthesis and
thase family genes to starch amount. The highest R2 was assigned      modifications (starch synthases, a-glucans and SBEs; Fig. 10).
to starch synthase 4 (0.499; P = 0.0005), followed by starch syn-     This upregulation, followed by downregulation on day 27, might
thases 8 and 1. Starch synthases 2 and 3 had low coefficients,        be the response to a heat wave of three different gene families
though also positive, compared to the other genes in their family     involved in the same process of starch synthesis. As for the starch
(Fig. 9a,d). Five out of 13 b amylases had negative correlations      synthase family specifically, so far it was shown to be differen-
with starch amount, similar to their coefficients (Fig. 9b,d). Fur-   tially expressed following cold stress in O. europaea leaves (Guerra
ther, there was a correlation with three polyol transporters, puta-   et al., 2015; without information on specific genes) and after leaf
tive transporters of mannitol, the highest sugar in olive drought     removal in grapevine canes (Silva et al., 2017). Our results
response. All three of them showed positive correlation with          provide an answer to the first research question, regarding gene
mannitol amount. The highest R2 among these correlations was          expression following heat wave, demonstrating divergent expres-
0.478, for polyol transporter 2, indicating that it probably has      sion trends and further differentiating between the response to
the main role in mannitol transport to the olive branches.            soil drought and heat in a long-term storage tissue. Upregulated
(Fig. 9c,d). In conclusion, correlation between gene expression       starch synthases on day 13 (heat wave) of watered trees had the
and their substrate or product was shown in three genes, includ-      same pattern as dried trees but with a lower peak. This gap
ing starch synthase 4, b amylase 2 and polyol transporter 2, sug-     between the treatments reflects the regulation difference between
gesting their role in olive’s starch metabolism under drought.        early drought and VPD effects, when both effects induced higher
                                                                      expression of several starch synthases.
                                                                         The question of low starch content simultaneously with upreg-
Discussion
                                                                      ulation of some starch synthesis genes needs further investigation.
In this research, we present a novel combination of physiological,    One explanation might be the mild increase in starch amount,
biochemical and molecular approaches to study carbon manage-          from 0% on day 8 to 0.3% on day 13 (Fig. 3). High expression
ment under water deficiency in trees, and specifically in             of starch synthases accompanied by high expression levels of

Ó 2020 The Authors                                                                                      New Phytologist (2021) 229: 1398–1414
New Phytologist Ó 2020 New Phytologist Trust                                                                      www.newphytologist.com
New
1408 Research Phytologist
(a) (b) (c)
(d) (e) (f)
(g) (h) (i)
(j) (k) (l)
Fig. 8 Gene expression of selected genes along six and three measuring days in (a–c, g–i) branches and (d–f, j–l) roots, respectively. Bars indicate
expression measured in RNA-seq and points indicate expression measured in RT-qPCR. All RT-qPCR values are the mean of three to six samples, relative to
day 3. Gray shaded areas represents the drought period; light gray indicates drought acclimation and dark gray drought. In (d -f, j -l), the gray area
represents drought only. Blue and red represent watered and dried trees, respectively. Error bars indicates SE of RT-qPCR.
New Phytologist (2021) 229: 1398–1414 Ó 2020 The Authors
www.newphytologist.com New Phytologist Ó 2020 New Phytologist TrustNew
Phytologist Research 1409
(a) (b)
(c) (d)
Fig. 9 Correlations between enzyme gene
expression level and substrate concentration
in wood of Olea europaea. Data points are
for individual trees on specific days; shapes
indicate the day. The P values are corrected
with ‘Bonferroni’ depending on gene family’s
size. (a) Starch content as a function of starch
synthase 4 expression. (b) Starch content as
function of b amylase 3 expression. (c)
Mannitol content as function of Polyol
transporter 2 expression. (d) Levels of
coefficients of correlation (r) of gene
expression levels with the enzyme substrate
or product in the three gene families.
starch degradation enzymes is a possible reason for the mild decrease (Fig. 9); these genes homolog (b amylase 9) is predicted
increase. The increase in a futile cycle is also suggested, supported to be catalytically inactive, and had no defined functions in other
by expression of both anabolic and catabolic genes. Furthermore, studies, although it is close to a branch of another inactive
NSC location within the wood reflects NSC age, where younger enzyme, b amylase 4, which is proposed to have a regulatory role
NSC is mixed inwards while older NSC is used (Trumbore et al., (Fulton et al., 2008; Thalmann et al., 2019). Arabidopsis thaliana
2015; Hartmann & Trumbore, 2016; Furze et al., 2018). Hence, lacking b amylases 3 and 9 was shown to accumulate more starch
simultaneous expression of the opposite processes might appear than plants lacking b amylase 3 alone, suggesting b amylase 9 has
within different wood areas, where starch degradation takes place a role in starch metabolism in Arabidopsis (Monroe & Storm,
in the center of the stem and starch synthesis occurs in the 2018). A mild upregulation of PtBMY3, which belongs to class
peripheral area. In addition, the branch is composed of multiple V (BAM9) as well, was shown in poplar branches (Pagliarani
cell types, including xylem, parenchyma, phloem, etc., which et al., 2019). Another increase of b amylase isoforms in O.
were not separated in this experiment. Differentiating between europaea’s leaves was shown following cold stress (Guerra et al.,
specific tissues and cells type might affect gene expression along 2015). Though b amylase 1 in poplar storage tissues was highly
with NSC content, and hence should be considered in future differentially expressed (Geisler-lee et al., 2006; Pagliarani et al.,
research. Another alternative is that unmeasured post-transcrip- 2019), its homolog in our experiment has shown no changes dur-
tional processes were involved in these mechanisms, as differences ing drought (b amylase 11). This difference might be due to the
between the RNA and enzyme level or activity do exist, as was variance between the species. In our study, all upregulated b amy-
shown in yeast (Gygi et al., 1999). However, the high correlation lases were significantly downregulated in recovery, while other
presented here between the expression of specific genes and their family members followed the opposite trend of upregulation
substrate or product supports their role in affecting the substrate through recovery. Furthermore, changes in gene expression of O.
or product abundance. europaea b-amylases highly correlated to its substrate quantity, as
In response to our second research question, change in genes was demonstrated previously in A. thaliana leaves (Kaplan &
expression in response to drought, persistent responses to drought Guy, 2004). Other starch degradation genes were mostly down-
took place among different starch metabolism processes. regulated, as shown in Fig. 10 (e.g. isoamylase 3, DPE 3 and mal-
Drought-induced upregulation included starch degradation genes tose translocator 1). The exceptional upregulation of some b
in wood, being the major tree carbon reserve. Upregulation of b amylases among all starch degradation genes indicates their major
amylases 2 and 10 during drought matched the observed starch contribution during drought response.
Ó 2020 The Authors New Phytologist (2021) 229: 1398–1414
New Phytologist Ó 2020 New Phytologist Trust www.newphytologist.comNew
1410 Research Phytologist
Fig. 10 Literature-based hypothesis of starch metabolism in wood, with observed enzyme expression dynamics under heat and drought. Circles denote
enzymes. Colors represent upregulation/downregulation under specific scenarios. Suc, sucrose; Gluc, glucose; Fruc, fructose; Gluc1P, glucose-1-
phosphate; Gluc6P, glucose-6-phosphate; B glucans, branched glucans; L glucans, linear glucans; Mal, maltose; SUS, sucrose synthase; UGP, UDP glucose
pyrophosphorylase; PGM, phosphoglucomutase; AGP, ADP glucose pyrophosphorylase; SS, starch synthase; SBE, starch branching enzyme; DPE,
disproportionating enzyme; Gluct, glucose transporter; Malt, maltose transporter.
The recovery response of dried trees, included induction of throughout drought in this experiment, as a mannitol trans-
genes involved with starch synthesis (starch synthases 1, 4, 5, 8 porter, regulated by plant environmental conditions.
and AGPs 1, 2 and 5) and degradation (starch phosphorylases 1, Sucrose-related genes, converting sucrose to its components,
2 and b amylases 1, 4, 6, 8 and 12). As mentioned, this response potentially initiate many cellular functions, such as cell wall syn-
was not seen in watered trees. These genes are potentially related thesis, mitochondrial metabolism and starch accumulation
to the molecular management of the recovery process from (Amor et al., 1995; Fernie et al., 2002). SUS and invertase, both
drought, as presented in our third research question. catabolism genes involved in sucrose breakdown, are reported to
be expressed in woody tissues of trees (Geisler-lee et al., 2006;
Lorenz et al., 2011) and were highly expressed following abiotic
Identification of the gene family members related to
stress in various species (Dejardinet al., 1999; Kleines et al., 1999;
mannitol and sucrose metabolism
Dubos & Plomion, 2003; Lorenz et al., 2011; Guerra et al.,
Sucrose and mannitol concentrations increased during drought, a 2015; K€onigshofer & L€oppert, 2015; Fox et al., 2018). Here,
response particularly strong for mannitol. Polyol transporter SUS and invertase genes have shown different expression patterns
genes were associated with mannitol fluctuations during drought. in drought, including upregulation throughout the drought
Out of three polyol transporters in this family, two were signifi- period (SUS 1, invertases 2, 8 and 11) and some show downregu-
cantly upregulated while one was downregulated following lation in drought (SUSs 6, 7 and 11) (Fig. 6). Other sucrose-re-
drought, one of them highly correlated with mannitol content lated genes were downregulated across the entire drought period
(Fig. 9). Polyol, mannitol, cinnamyl and 8-hydroxygeraniol (phosphoglucomutase 4) or in the end of drought (hexokinase 9)
transporters cannot be differentiated based on their amino acid (Fig. 10). Therefore, there was an upregulation of genes involved
sequence. A mannitol-specific transporter was studied in O. with sucrose breakdown along with downregulation of genes
europaea cultured cells (Conde et al., 2007, 2011), yet further involved with sucrose breakdown products. Together, these
evaluation is needed to define all mannitol transporters existing expression patterns were expected to cause an accumulation of
in the olive genome. Here we suggest Polyol transporter 2 (gene sucrose breakdown products, glucose and fructose. This accumu-
id: Oeu033162.1), which was upregulated significantly lation was not exhibited during drought. This discrepancy
New Phytologist (2021) 229: 1398–1414 Ó 2020 The Authors
www.newphytologist.com New Phytologist Ó 2020 New Phytologist TrustNew
Phytologist Research 1411
suggests the use of the degradation products in other pathways, stresses, such as drought and salinity (Tattini et al., 1996; Probert
such as mitochondrial metabolism. An additional explanation is et al., 1998; Sofo et al., 2007; Dichio et al., 2009). Mannitol is
the difference within branch tissues, which were not separated in synthesized from fructose as a precursor (Stoop et al., 1996), while
this experiment and might host various processes, or unmeasured in this study fructose amounts were not high enough to explain
changes in enzymes level or activity. mannitol accretion in branches. A possible explanation for manni-
Overall, the expression of starch metabolism enzymes, includ- tol accumulation is starch degradation into soluble sugars while
ing sucrose metabolism, starch synthesis and degradation, and fructose was rapidly used for mannitol. However, mannitol
specific gene expression, imply elements of a complex mechanism amounts presented in other publications of O. europaea leaves are
containing various responses of transcripts, in turn related to consistent with mannitol accumulation demonstrated in this
heterogeneity in functions of each gene family. experiment. Hence, we assume mannitol was translocated from
leaves and not produced in branches, as demonstrated in Apium
graveolens (Davis & Loescher, 1990). In addition, the expression
Carbohydrate dynamics in woody tissues
of the mannitol synthesis enzyme mannose 6-phosphate reduc-
Under drought, NSCs buffered the asynchrony between carbon tase, responsible for the exclusive stage in mannitol biosynthesis
supply, which decreased by 90%, and carbon demand, which had (Loescher et al., 1992), was unchanged during drought (data not
to maintain a minimum level for maintenance respiration. Olea shown) while two polyol transporters were significantly highly
europaea grows in the dry conditions of summer in the Mediter- expressed during water limitation (Fig. 8 in Conde et al., 2011),
ranean, when photosynthesis is limited, and hence must partly suggesting translocation from other tissues.
rely on stored NSCs. In our experiment, photosynthesis declined NSCs and gene expression dynamics were measured from the
to c. 0 µmol m 2 s 1, as shown in other studies (Perez-Martin same tissue, to ensure a valid comparison of results. However,
et al., 2014). The measured water potential was lower than previ- closure of the carbon cycle within the trees, including their differ-
ously reported for olives ( 6 MPa; Dichio et al., 2009; Perez- ent tissues, was not performed in this study. Photosynthesis was
Martin et al., 2014), possibly reflecting the longer exposure to measured in leaves while other measurements were conducted in
drought (28 d vs 13–15 d). In agreement with previous studies, branches and roots. Carbon allocation between the source tissue
starch, mannitol and sucrose were the most abundant components and the measured sink tissues was not evaluated. Another limita-
of NSCs in olive woody tissues (Drossopoulos & Niavis, 1988; tion was the use of a complex tissue, branches, while not separat-
Gomez-Gonzalez et al., 2010; Bustan et al., 2011) while glucose ing it into its components (i.e. parenchyma, phloem, etc.). In
and fructose were the lowest (Bustan et al., 2011). The heat wave, order to better interpret some of our results, this separation is
which occurred during the first week, might have caused depletion needed. In addition, studies in additional tree species will show
in branch starch of all trees, with a stronger response in dried trees the extent to which our results are generalizable. Nevertheless, we
(starch percent in day 8 relative to baseline was 32% and 0% in show that our integrated, though not exhaustive, approach is
watered and dried trees, respectively). Though starch reduction viable and opens the gate to future discoveries. The gene expres-
following soil drought alone (Mitchell et al., 2013) and soil sion data from our experiment offers information on many addi-
drought with high VPD (Drossopoulos & Niavis, 1988; Bustan tional pathways critical for tree drought and recovery
et al., 2011; Klein et al., 2014) were previously shown, the separa- adjustments, and is open for further exploration.
tion between soil drought and VPD can indicate the proportional Our results demonstrate starch depletion following drought in
effect, perhaps via other processes such as photosynthesis, of these branches prior to roots, while root NSCs of two trees out of six
components to starch metabolism regulation. Starch depletion were high in the last day of drought (Fig. 3). Nondegradation of
under water limitation, as a result of depleted photosynthesis, was root starch at the same time as starch depletion in branches was
also shown across species and tissues (Regier et al., 2009; Mitchell previously shown in Robinia pseudoacacia (Zhang et al., 2015). A
et al., 2013; Klein et al., 2014; Lloret et al., 2018). In addition, prioritized degradation of starch in branches is proposed; suggest-
other storage compounds, that were reported in other trees ing two out of the six dried trees responded better to drought and
species, might be used in olives such as lipids (Hoch et al., 2003) did not exhaust their starch reserves yet. Taken together, our
and hemicellulose (Hoch, 2007). Mannitol increased in branches analysis proposes the first full starch metabolism pathway in
and roots together, making up 34% and 71% of total NSCs in woody tissues of trees during drought and recovery. This pathway
branches on day 27 in watered and dried trees, respectively. Man- should be further examined, to facilitate understanding of tree
nitol production may confer several potential advantages includ- processes in a future of longer, hotter, droughts.
ing a more efficient carbon use pathway, resistance to oxidative
stress and use as an osmoprotectant (Stoop et al., 1996; Jennings
Acknowledgements
et al., 1998). It is known as a significant soluble sugar of O.
europaea in various tissues including leaves, fruits, branches and The authors are grateful to S. Wolf and N. Glanz (Hebrew
roots and a main photosynthetic product (Drossopoulos & University), for the HPLC analysis; to G. Ben-Ari (ARO Volcani
Niavis, 1988; Stoop et al., 1996; Dichio et al., 2003; Gomez- Center) for sharing the database of the olive genome and for
Gonzalez et al., 2010; Lo Bianco & Scalisi, 2017). Leaves serve as commenting on an earlier version of the manuscript, together
a source and a storage tissue for mannitol (Flora & Madore, 1993; with J. Gruenzweig (Hebrew University); and to the members of
Conde et al., 2008), and it tends to accumulate under abiotic the Klein laboratory (Weizmann TreeLab) for helpful discussions
Ó 2020 The Authors New Phytologist (2021) 229: 1398–1414
New Phytologist Ó 2020 New Phytologist Trust www.newphytologist.comYou can also read