Regulation of RNA editing by intracellular acidification
←
→
Page content transcription
If your browser does not render page correctly, please read the page content below
4020–4036 Nucleic Acids Research, 2021, Vol. 49, No. 7                                                                Published online 15 March 2021
doi: 10.1093/nar/gkab157

Regulation of RNA editing by intracellular acidification
Turnee N. Malik1 , Erin E. Doherty2 , Vandana M. Gaded2 , Theodore M. Hill3 , Peter A. Beal                                                                2

and Ronald B. Emeson 1,3,*
1
 Training Program in Neuroscience, Vanderbilt University, Nashville, TN 37232, USA, 2 Department of Chemistry,
University of California, Davis, Davis, CA 95616, USA and 3 Department of Pharmacology, Vanderbilt University
School of Medicine, Nashville, TN 37232, USA

Received November 19, 2020; Revised February 03, 2021; Editorial Decision February 24, 2021; Accepted February 25, 2021

                                                                                                                                                                  Downloaded from https://academic.oup.com/nar/article/49/7/4020/6171293 by guest on 08 November 2021
ABSTRACT                                                                          INTRODUCTION
The hydrolytic deamination of adenosine-to-                                       Dynamic and rapidly coordinated gene expression relies
inosine (A-to-I) by RNA editing is a widespread                                   upon various post-transcriptional mechanisms that mod-
post-transcriptional modification catalyzed by the                                ify RNA sequence, structure, and stability (1). Prevalent
adenosine deaminase acting on RNA (ADAR) family                                   among more than one hundred RNA processing events that
                                                                                  shape the transcriptional landscape is the conversion of
of proteins. ADAR-mediated RNA editing modulates
                                                                                  adenosine to inosine (A-to-I) by RNA editing (2,3). It has
cellular pathways involved in innate immunity, RNA
                                                                                  been predicted that the human transcriptome contains as
splicing, RNA interference, and protein recoding,                                 many as one-hundred million A-to-I editing sites, compris-
and has been investigated as a strategy for ther-                                 ing selectively edited adenosines in protein-coding regions
apeutic intervention of genetic disorders. Despite                                as well as hyper-edited adenosine clusters in non-coding,
advances in basic and translational research, the                                 repetitive sequences such as short interspersed nuclear ele-
mechanisms regulating RNA editing are poorly                                      ments (SINEs) (2,4,5). A-to-I editing is generally identified
understood. Though several trans-acting regulators                                as adenosine to guanosine (A-to-G) discrepancies during
of editing have been shown to modulate ADAR                                       comparisons of genomic and cDNA sequences due to the
protein expression, previous studies have not iden-                               base-pairing of cytidine to inosine (like guanosine) during
tified factors that modulate ADAR catalytic activity.                             reverse transcriptase-mediated first-strand cDNA synthesis.
                                                                                  Many cellular machines also recognize inosine as guano-
Here, we show that RNA editing increases upon
                                                                                  sine, indicating that A-to-I editing constitutes functional
intracellular acidification, and that these effects are
                                                                                  A-to-G substitutions that can modulate diverse pathways
predominantly explained by both enhanced ADAR                                     involved in innate immunity, RNA splicing, RNA interfer-
base-flipping and deamination rate at acidic pH. We                               ence, and protein recoding (6,7).
also show that the extent of RNA editing increases                                   The specificity and frequency of A-to-I editing are dic-
with the reduction in pH associated with conditions                               tated by both cis- and trans-acting regulatory elements. Cis-
of cellular hypoxia.                                                              acting factors such as RNA sequence context influence the
                                                                                  extent of site-specific A-to-I conversion, but the formation
                                                                                  of an extended region of double-stranded RNA (dsRNA)
GRAPHICAL ABSTRACT
                                                                                  by intramolecular base-pairing is paramount for editing (8–
                                                                                  10). The major trans-regulatory factors are the editing en-
                                                                                  zymes themselves, referred to as adenosine deaminases act-
                                                                                  ing on RNA (ADARs), which catalyze the deamination of
                                                                                  adenosine residues within dsRNA substrates (7). Two ac-
                                                                                  tive members of the vertebrate ADAR family, ADAR1 and
                                                                                  ADAR2, each contain multiple copies of a dsRNA binding
                                                                                  domain (dsRBD) and a carboxyl-terminal adenosine deam-
                                                                                  inase domain (11). The RNA editing reaction involves three
                                                                                  main steps: (i) ADAR binding to the dsRNA substrate, (ii)
                                                                                  flipping the targeted adenosine out of the RNA duplex into
                                                                                  the enzyme active site and (iii) hydrolytic deamination at
                                                                                  position 6 of the purine ring (12).

* To   whom correspondence should be addressed. Tel: +1 615 936 1688; Email: ron.emeson@vanderbilt.edu

C The Author(s) 2021. Published by Oxford University Press on behalf of Nucleic Acids Research.
This is an Open Access article distributed under the terms of the Creative Commons Attribution-NonCommercial License
(http://creativecommons.org/licenses/by-nc/4.0/), which permits non-commercial re-use, distribution, and reproduction in any medium, provided the original work
is properly cited. For commercial re-use, please contact journals.permissions@oup.com
Nucleic Acids Research, 2021, Vol. 49, No. 7 4021
Expression of ADAR1 and ADAR2 is ubiquitous, but dogenous RNA targets in response to acidic or more phys-
enriched in the brain, along with inosine-containing mR- iologically normal pH conditions. We also have performed
NAs (13,14). Interestingly, many editing-dependent recod- in vitro studies to examine both editing kinetics and ADAR
ing events in mRNAs occur within transcripts critical base-flipping in response to changes in pH. Finally, we have
for nervous system function. The extent of editing for investigated how such changes in pH that occur in a cell
these RNAs varies spatiotemporally and carries functional culture model of hypoxia might affect the extent of site-
consequences for encoded proteins including changes in selective A-to-I conversion. Our results show that RNA
calcium permeability through GluA2 subunit-containing editing increases upon acidification, and that these effects
AMPA receptors, alterations in inactivation dynamics for are predominantly explained by enhanced base-flipping and
the Kv1.1-subtype of voltage-gated potassium channel, and deamination rate of ADARs at decreased pH.
modulation of G-protein coupling efficacy and constitutive
activity for the 2C-subtype of serotonin receptor (5HT2C ) MATERIALS AND METHODS
(5,15–17). Furthermore, alterations in ADAR1 or ADAR2
Downloaded from https://academic.oup.com/nar/article/49/7/4020/6171293 by guest on 08 November 2021
expression have been shown to result in neurobehavioral Plasmids for transfection
phenotypes, as well as embryonic or early postnatal lethal- cDNAs encoding mouse ADAR1 (p110) or rat ADAR2
ity, in animal models (18–22). Dysregulation of RNA edit- were subcloned into mammalian expression vectors as pre-
ing in humans has been implicated in disorders of innate viously described (17). To generate ADAR-Q mutants,
immunity and nervous system function including Aicardi- E1008Q and E488Q mutations were respectively intro-
Goutières syndrome, epilepsy, suicide, amyotrophic lateral duced into wild-type ADAR1 and ADAR2 plasmids using
sclerosis and schizophrenia (23–27). Taken together, these the QuikChange II Site-Directed Mutagenesis kit (Agilent
data not only demonstrate an important role for A-to-I edit- Technologies), where the polymerase chain reaction (PCR)
ing in numerous physiological systems, but also suggest that reactions were supplemented with 4% DMSO. Plasmids
editing may be regulated to produce transcriptional plastic- encoding human 5HT2C , mouse GluA2, and human Gli1
ity that can endow biological systems with adaptive capac- minigenes, containing the minimum sequences required
ities in the face of changing environmental or physiologic for editing, were subcloned into either the pRC-CMV or
conditions (28,29). pcDNA3 mammalian expression vectors (Thermo-Fisher)
In mammals, several proteins regulate ADAR stability (17,39,40).
and subsequent RNA editing. The coordinate action of a
positive regulator, Pin1, and a negative regulator, WWP2,
Cell culture
modulate ADAR2 expression through post-translational
interactions (30). AIMP2 also inhibits editing by decreasing HEK293T and HeLa cells were maintained in high-glucose
ADAR protein levels (5). Although these trans-acting regu- Dulbecco’s modified Eagle’s medium (DMEM, Gibco) sup-
lators provide a mechanism for editing regulation by mod- plemented with 10% heat inactivated fetal bovine serum
ulating ADAR stability, studies spanning the past decade (Gibco) and 1% 10,000 g/ml penicillin–streptomycin
have consistently concluded that changes in ADAR protein (Gibco) and incubated in a humidified chamber at 37◦ C and
expression do not fully account for differences in the extent 5% CO2 . Twenty-four hours prior to HEK293T cell trans-
of A-to-I conversion (5,31–36). Accordingly, it is likely that fection, cells were seeded in six-well plates (for RNA anal-
other factors modulate ADAR activity, rather than protein ysis) or 100 mm dishes (for protein analysis). HEK293T
expression, to alter the extent of editing for ADAR sub- cells in six-well plates were transiently co-transfected with
strates. 1 g ADAR1, ADAR1-E1008Q (ADAR1-Q), ADAR2 or
Recent studies of the structural basis for ADAR base- ADAR2-E488Q (ADAR2-Q) as well as 1 g of one of
flipping have revealed the importance of a highly conserved the substrate minigene-expressing plasmids (as described
glutamate (E1008 in ADAR1 and E488 in ADAR2) resid- above) using Fugene 6 (Promega) according to manufac-
ing in the deaminase domains of each enzyme (37). This turer’s instructions. HEK293T cells in 100 mm dishes were
residue stabilizes the flipped-out conformation of the RNA transiently co-transfected with 3 g of ADAR1 or ADAR2
duplex, presumably by occupying the space vacated by expression plasmids, as well as 3 g of the 5HT2C minigene-
the flipped-out adenosine and hydrogen bonding with the containing plasmid using Fugene 6 according to manufac-
complementary-strand orphaned base. Consistent with the turer’s instructions. Twenty-four hours after transfecting
idea that this glutamate requires protonation to stabilize HEK293T cells or seeding HeLa cells, they were washed
the altered nucleic acid conformation, an enhancement in with 1× Dulbecco’s phosphate-buffered saline (DPBS) and
base-flipping and deamination rate is observed when this incubated with high-glucose DMEM containing 3.7 mg/ml
glutamate is mutated to a glutamine (E1008Q and E488Q NaHCO3 (for control samples) or high-glucose DMEM
in ADAR1 and ADAR2, respectively), which is fully proto- containing a reduced concentration of NaHCO3 (either 2,
nated at physiologically relevant pH (12,38). These findings 1.5, 1, 0.5, 0.17 or 0 mg/ml NaHCO3 for experimental sam-
indicate that protonation of this glutamate may be critical ples) for an additional 1, 3, 6, 12 or 24 h at 37◦ C and
for optimal catalytic activity and may alter the overall rate 5% CO2 . Following this 24-h incubation, a pH meter was
of ADAR catalysis during pH shifts in the cell. used to measure the pH of the cell culture medium imme-
To determine if editing is regulated by such changes in diately after removing dishes from the tissue culture incu-
pH, we have employed cell culture model systems in which bator. The establishment of acidic culture medium via re-
we analyzed either ADAR1 or ADAR2-mediated editing duced NaHCO3 concentration is similar to that previously
of transfected minigene-derived RNAs or the editing of en- reported by Kondo and colleagues (41,42).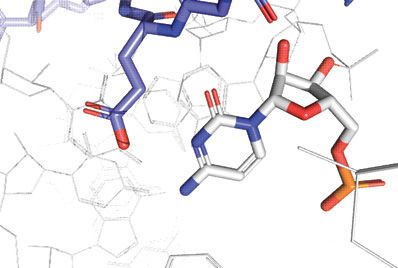
4022 Nucleic Acids Research, 2021, Vol. 49, No. 7
Niclosamide treatment and extraction buffer. 20 g of each sample was resolved
by electrophoresis on a 4–20% gradient SDS-PAGE gel
HEK293T and HeLa cells were seeded separately into
and then transferred to a nitrocellulose membrane using
6-well plates. HEK293T cells were co-transfected with
a Trans-Blot® SD semi-dry transfer cell (Bio-Rad). After
ADAR1 or ADAR2 and 5HT2C expression vectors as
blocking the membrane with Intercept PBS blocking buffer
described above. Twenty-four hours after transfecting
(LI-COR) for 1 h, the membrane was probed using either
HEK293T cells or seeding HeLa cells, cells were washed
a mouse ADAR1 monoclonal antibody (sc-73408, Santa
with 1× DPBS and incubated with high-glucose DMEM
Cruz; 1:1000 dilution) or an affinity-purified rat ADAR2
containing 3.7 g/l NaHCO3 and treated for 6 h with ei-
antiserum (Exalpha Biologicals; 1:375 dilution), as well as
ther 5 M niclosamide (diluted from a freshly prepared 10
a polyclonal affinity-purified -actin antibody (sc-1616-R,
mM stock solution in DMSO) or an equivalent volume of
Santa Cruz; 1:1000 dilution). ADAR1 and -actin signals
DMSO. Total RNA was extracted from cells immediately
were detected using IRDye secondary antibodies (LI-COR;
after this 6-h incubation to quantify RNA editing.
1:20,000 dilution), and ADAR2 signals were detected using
Downloaded from https://academic.oup.com/nar/article/49/7/4020/6171293 by guest on 08 November 2021
Alexa Fluor® 790 light-chain specific anti-sheep IgG sec-
Cell culture hypoxia ondary antibody (Jackson ImmunoResearch; 1:50,000). All
HEK293T were seeded into six-well plates and co- blots were imaged using an Odyssey CLx infrared imaging
transfected with ADAR1 or ADAR2 and 5HT2C expression system (LI-COR) and quantified using Image Studio Lite
vectors as described above. Twenty-four hours after trans- (LI-COR).
fecting HEK293T cells or seeding HeLa cells, cells were
washed with 1× DPBS and incubated with high-glucose
DMEM containing 3.7 g/l NaHCO3 . Cells exposed to nor- Quantitative RT-PCR analysis
moxic conditions were placed in the tissue culture chamber cDNA generated from HeLa cells was used to prepare reac-
at 37◦ C and 5% CO2 for 24 h. Induction of hypoxia was tions for duplex TaqMan® Gene Expression Assays (Ap-
achieved by subjecting cells to a 1% O2 /5% CO2 /94% N2 plied Biosystems) according to manufacturer’s instructions.
environment within a modular incubator chamber (STEM- Eef2k (Hs00179434 m1), Blcap (Hs00705669 s1), Cog3
CELL Technologies) placed inside the tissue culture cham- (Hs00230134 m1) and Adar2 (Hs00953723 m1) expres-
ber for 24 h, as described previously (43). The pH of the cell sion were assessed using 20× FAM dye-labeled TaqMan®
culture medium was measured immediately following nor- probes, and -actin (Hs03023943 g1) expression was as-
moxic or hypoxic treatment. sessed using 20× VIC dye/MGB-labeled and a primer lim-
ited TaqMan® endogenous control. Expression of each tar-
Analysis of RNA editing from cultured cells get gene was assayed using three biological replicates, and
each sample was run in technical triplicate. Relative changes
Total RNA was extracted from HEK293T and HeLa cells in gene expression were determined using the Ct method
using 1 mL Trizol Reagent (Invitrogen) according to manu- (45).
facturer’s instructions. DNA was removed from RNA sam-
ples using the Turbo™ DNase kit (Invitrogen), and follow-
ing the rigorous DNase treatment procedure, cDNA was pHrodo intracellular pH assessment
prepared from 1 g of DNase-treated RNA sample using
the High-Capacity cDNA Reverse Transcription kit (Ap- HEK293T and HeLa cells were seeded separately on poly-
plied Biosystems). When preparing cDNA, a control re- L-lysine- and laminin-coated 35-mm glass bottom dishes
action lacking reverse transcriptase (–RT) was prepared in (MatTek Life Sciences). Twenty-four hours later, cells were
parallel for each RNA sample to ensure the absence of ge- washed with Live Cell Imaging Solution (LCIS) and incu-
nomic DNA contamination. PCR amplicons were gener- bated for 30 min with 2 l of pHrodo Red AM Intracel-
ated using the target-specific primers listed in Table 1 and lular pH Indicator (Invitrogen) diluted in 20 l of Power-
then sequenced. RNA editing in HEK293T cells was quan- Load concentrate and added to 2 ml of pre-warmed LCIS.
tified using a high-throughput sequencing-based strategy, as Cells were then washed in DPBS and incubated for 6 h at
described previously (32). RNA editing levels in HeLa cells 37◦ C and 5% CO2 with high-glucose DMEM lacking phe-
were determined by quantifying the relative peak heights at nol red and containing either 0 or 3.7 g/l NaHCO3 . For
edited positions in Sanger sequencing-derived electrophero- niclosamide experiments, cells were incubated with high-
grams (44). glucose DMEM containing 3.7 g/l NaHCO3 and treated
for 6 h with either 5 M niclosamide or an equivalent vol-
ume of DMSO. Plates were then removed from the cell
Western blotting
culture incubator and 2 l of BioTracker™ 488 Nuclear
HEK293T and HeLa cells were seeded separately into Dye (Sigma-Aldrich) were added directly to the cell cul-
100 mm plates. HEK293T cells were co-transfected with ture medium and incubated at 37◦ C for 10 min. Immediately
ADAR1 or ADAR2 and 5HT2C expression vectors as following this incubation, z-stack images were captured us-
described above. Twenty-four hours after transfecting ing a Zeiss LSM 510 META Inverted confocal microscope.
HEK293T cells or seeding HeLa cells, cells were washed pHrodo Red and BioTracker™ 488 were excited at 543 and
with 1× DPBS and incubated with high-glucose DMEM 488 nm, respectively. The average pHrodo Red fluorescence
containing 3.7 or 0 g/l NaHCO3 for 24 h. HEK293T and intensity per cell was quantified using Fiji image processing
HeLa whole cell lysates were prepared using RIPA lysis software.Nucleic Acids Research, 2021, Vol. 49, No. 7 4023
Table 1. Target-specific primers for quantitative analysis of RNA editing in cultured cells
Sense or
Transcript antisense Primer sequence
5HT2C Sense 5 -ATT AAC CCT CAC TAA AGG GAC GCT GGA TCG GTA TGT AGC
A-3
Antisense 5 -TAA TAC GAC TCA CTA TAG GGC GTC TGT ACG TTG TTC ACA
GTA C-3
GluA2 (Q/R, +3, +4, +60 and Sense 5 -ATT AAC CCT CAC TAA AGG GAA TAG TCT CTG GTT TTC CTT
+88 sites) GGG-3
Antisense 5 -TAA TAC GAC TCA CTA TAG GGA GCT GGT GAC ATC TTT ATG
GTG-3
GluA2 (sites +241 through Sense 5 -ATT AAC CCT CAC TAA AGG GAG TTG ATC AGG TGT TTC CCT
+271) GGT-3
Antisense 5 -TAA TAC GAC TCA CTA TAG GGC GAT CTA AAA TCG CCC ATT
TTC CC-3
Downloaded from https://academic.oup.com/nar/article/49/7/4020/6171293 by guest on 08 November 2021
Gli1 Sense 5 -ATT AAC CCT CAC TAA AGG GAG GAC AGA ACT TTG ATC CTT
ACC TCC-3
Antisense 5 -TAA TAC GAC TCA CTA TAG GGC ATA TAG GGG TTC AGA CCA
CTG-3
Cog3 Sense 5 -ATT AAC CCT CAC TAA AGG GAC AGT CCT TAC TTG GAG CGT
CA-3
Antisense 5 -TAA TAC GAC TCA CTA TAG GGC TGA ATA AAC TGC TCA CAG
GCC-3
Eef2k Sense 5 -ATT AAC CCT CAC TAA AGG GAG TAA TTT ACA GCA GGA CGC
TTT CA-3
Antisense 5 -TAA TAC GAC TCA CTA TAG GGG TAG AGA CAG GGT CTC GC-3
Blcap (Y/C site) Sense 5 -GAC AGC CAG AGA GCA CAG-3
Antisense 5 -TGA GCA GGT AGA AGC CCA T-3
General biochemical procedures In vitro transcription and preparation of editing target RNA
Unless otherwise stated, all regents were purchased from Target RNA was transcribed from a DNA template with the
commercial sources (Fisher Scientific or Sigma Aldrich) MEGAScript T7 Kit (ThermoFisher). DNA digestion was
and were used without further purification. Reagents for performed using RQ1 RNase-free DNase (Promega). The
in vitro transcription, in vitro editing, and PCR amplifi- DNase-treated RNA product was purified by 4% PAGE as
cation were purchased from: Promega: Access RT-PCR described above. Purified 5HT2c target RNA (180 nM) was
kit, RQ1 DNase free RNase; Qiagen: Gel Extraction kit; added to 1× TE buffer and 100 mM NaCl, heated to 95◦ C
Zymo Research: DNA Clean & Concentrator kit; Syd for 5 min, and slowly cooled to room temperature.
Labs: Spin columns for PCR product clean up; New Eng-
land BioLabs: Molecular-biology-grade bovine serum al-
bumin (BSA), and RNase inhibitor. SDS-polyacrylamide Protein overexpression and purification of ADAR2 constructs
gels were visualized with a Molecular Dynamics 9400 Ty-
Human ADAR2 deaminase domain (ADAR2d), human
phoon phosphorimager. Data were analyzed with Molecu-
ADAR2d-E488Q, wild-type human ADAR2, and human
lar Dynamics ImageQuant 5.2 software. All MALDI anal-
ADAR2-E488Q were expressed and purified as previously
yses were performed at the University of California, Davis
described (46). Purification was carried out by lysing cells
Mass Spectrometry Facilities using a Bruker ultrafleXtreme
in buffer containing 20 mM Tris–HCl, pH 8.0, 5% glyc-
MALDI TOF/TOF mass spectrometer. Oligonucleotide
erol, 1 mM 2-mercaptoethanol, 750 mM NaCl, 35 mM
masses were determined with Mongo Oligo Calculator
imidazole, and 0.01% Nonidet P-40 using a French press.
v2.08. Unless otherwise noted, oligonucleotides were pur-
Cell lysate was clarified by centrifugation (39 000 × g for 1
chased from either Dharmacon or Integrated DNA Tech-
h). Lysate was passed over a 3 ml Ni-NTA column, which
nologies.
was then washed in 3 steps with 20 mL lysis buffer, wash
I buffer (20 mM Tris–HCl, pH 8.0, 5% glycerol, 1 mM 2-
mercaptoethanol, 750 mM NaCl, 35 mM imidazole, 0.01%
Purification of oligonucleotides
Nonidet P-40), wash II buffer (20 mM Tris–HCl, pH 8.0,
All oligonucleotides for biochemical experiments were pu- 5% glycerol, 1 mM 2-mercaptoethanol, 35 mM imidazole,
rified by denaturing polyacrylamide gel electrophoresis 500 mM NaCl), and eluted with 20 mM Tris–HCl, pH 8.0,
(PAGE) and visualized by UV shadowing. Oligonucleotides 5% glycerol, 1 mM 2-mercaptoethanol, 400 mM imidazole,
extracted from the gel using the crush and soak method for 100 mM NaCl. Fractions containing the target protein were
16 h at 4◦ C into 0.5 M NH4 OAc and 1 mM EDTA. Poly- pooled and concentrated to 30–80 M for use in biochemi-
acrylamide fragments were removed using a 0.2 m pore cal assays. Purified wild-type ADAR2 was stored in 20 mM
size cellulose acetate membrane filter (Corning). Oligonu- Tris–HCl pH 8.0, 100 mM NaCl, 20% glycerol and 1 mM
cleotides were precipitated from 75% ethanol containing 75 2-mercaptoethanol at –70◦ C. Protein concentrations were
mM NaOAc at –70◦ C for 2 h. The resulting pellet was dried determined using BSA standards visualized by SYPRO or-
under vacuum and resuspended in nuclease free water. ange staining of SDS-polyacrylamide gels.4024 Nucleic Acids Research, 2021, Vol. 49, No. 7
Protein overexpression and purification of ADAR1 p110 Table 2. Target-specific primers for quantitative analysis of in vitro RNA
editing
MBP-tagged human ADAR1 p110 construct was cloned
into a pSc vector using standard PCR techniques (47). The Sense or
Transcript antisense Primer sequence
generated construct (yeast codon optimized) consisted of
an N-terminal MBP-tag, a tobacco etch virus (TEV) pro- 5HT2C Sense 5 -TGG GTA CGA ATT CCC ACT TAC
tease cleavage site followed by the human ADAR1 p110 GTA CAA GCT T-3
Antisense 5 -AGA ACC CGA TCA AAC GCA AAT
gene. The construct was transformed in Saccharomyces GTT AC- 3
cerevisiae BCY123 cells and overexpressed as described pre- Gli1 Sense 5 -CAG AAC TTT GAT CCT TAC CTC
viously (46). Purification was carried out by lysing cells C-3
in lysis/binding buffer containing 50 mM Tris–HCl, pH Antisense 5 -CAT ATA GGG GTT CAG ACC ACT
8.0, 5% glycerol, 5 mM 2-mercaptoethanol, 1000 mM KCl, G-3
0.05% NP-40 and 50 M ZnCl2 using a microfluidizer. Cell
lysate was clarified by centrifugation (39 000 × g for 50
Downloaded from https://academic.oup.com/nar/article/49/7/4020/6171293 by guest on 08 November 2021
the following modifications: The final reaction solution for
min). Lysate was passed over a 2 ml NEB amylose col-
ADAR1 p110 contained 15 mM Tris–HCl (pH 7.0 to 8.5) or
umn (pre-equilibrated with binding buffer), which was then
15 mM Bis–Tris–HCl (pH 6.0 to 7.0), 4% glycerol, 26 mM
washed in 2 steps with 50 ml binding buffer followed by 100
KCl, 40 mM potassium glutamate, 1.5 mM EDTA, 0.003%
mL wash buffer (50 mM Tris–HCl, pH 8.0, 5% glycerol, 5
Nonidet P-40, 160 U/ml RNAsin, 1.0 g/ml yeast tRNA
mM 2-mercaptoethanol, 500 mM KCl, 0.01% NP-40 and 50
and 10 nM RNA, and 150 nM ADAR1 p110.
M ZnCl2 ) and eluted with buffer containing 50 mM Tris–
HCl, pH 8.0, 10% glycerol, 5 mM 2-mercaptoethanol, 500
mM KCl, 0.01% NP-40, 50 M ZnCl2 and 20 mM maltose. ThermoFluor melting temperature analysis of recombinant
Fractions containing the target protein were pooled and ADAR2, ADAR2d or ADAR2d-E488Q protein
dialyzed against a storage buffer containing 50 mM Tris– Spectra were obtained using a Bio-Rad CFX Connect Real-
HCI, pH 8.0, 400 mM KCI, 0.5 mM EDTA, 0.01% NP- Time PCR Detection System. Solutions contained 15 mM
40, 10% glycerol and 1 mM tris(2-carboxyethyl)phosphine. Tris–HCl (pH 7.0 to 8.5) or 15 mM Bis–Tris–HCl (pH 6.0
Dialyzed protein was concentrated to 2–50 M and stored to 7.0), 3% glycerol, 60 mM KCl, 1.5 mM EDTA, 0.003%
as aliquots at –70◦ C until further use in biochemical as- Nonidet P-40, 3 mM MgCl2 and 2X SYPRO orange dye,
says. Protein concentrations were determined using BSA with or without protein. Samples containing protein in-
standards visualized by SYPRO orange staining of SDS- cluded 3 M wild-type ADAR2, or 4 M of either deam-
polyacrylamide gels. inase domain protein (ADAR2d or ADAR2d E488Q). To
a 96-well clear bottom PCR plate was added 20 l of each
Deamination assay with ADAR2d, ADAR2d-E488Q, solution. Wells were sealed with PCR plate sealing film. Flu-
ADAR2 and ADAR1 p110 orescence was measured as the solutions were heated from
Deamination assays were performed under single-turnover 5◦ C to 90◦ C at a rate of 2◦ C/min. The derivative of fluores-
conditions in 15 mM Tris–HCl (pH 7.0 to 8.5) or 15 mM cence signal as a function of temperature (–dF/dT) was ex-
Bis–Tris–HCl (pH 6.0 to 7.0), 3% glycerol, 60 mM KCl, ported, and the background values of the buffered solution
1.5 mM EDTA, 0.003% Nonidet P-40, 3 mM MgCl2 , 160 without protein was subtracted from each sample. Melting
U/ml RNAsin, 1.0 g/ml yeast tRNA, 10 nM RNA, and temperature was determined as the temperature where the
75 nM ADAR2d, ADAR2d-E488Q, or wild-type ADAR2. derivative of fluorescence signal was at a minimum. Mea-
Each reaction solution was incubated at 30◦ C for 30 min surements were performed in triplicate. Melting tempera-
before the addition of enzyme. Reactions were then incu- ture values reported are the average of each replicate ± stan-
bated at 30◦ C for varying times prior to quenching with dard deviation (SD). Statistical significance between groups
190 l 95◦ C water and heating at 95◦ C for 5 min. Reac- was determined by one-way ANOVA using Prism software
tion products were used to generate cDNA using RT-PCR (Graph Pad).
(Promega Access RT-PCR System). The target-specific
primers used to generate these PCR amplicons are pre- Preparation of duplex substrates for base-flipping analysis
sented in Table 2. DNA was purified using a DNA Clean Oligonucleotides previously described for use in ADAR2
& Concentrator kit (Zymo) and subjected to Sanger Se- base-flipping analyses were purchased from Dharmacon
quencing using an ABI Prism 3730 Genetic Analyzer at (12). RNAs were purified by 18% PAGE as previously de-
the UC Davis DNA Sequencing Facility. The sequenc- scribed. PAGE purified top and bottom strands were an-
ing peak heights were quantified in 4Peaks v1.8. Data nealed for a final concentration of 30 M edited strand, 45
were fit to the equation [P]t = 0.9[1 − e−kobs ∗t ] [P]t = M guide strand, 30 mM Tris–HCl, 6% glycerol, 120 mM
0.9[1 − e−kobs ∗t ] for ADAR2 and [P]t = 0.6[1 − e−kobs ∗t ] for KCl, 3 mM EDTA, 0.006% NP-40 and 0.6mM DTT. The
ADAR1 p110 where [P]t is percent edited at time t, and kobs mixture was heated to 95◦ C for 5 min, and slowly cooled to
is the observed rate constant. Each experiment was carried room temperature.
out in triplicate where the kobs reported is the average of each
replicate ± standard deviation (SD). Statistical significance
Base-flipping assay using a fluorescent RNA substrate
between groups was determined by one-way ANOVA us-
ing Prism software (GraphPad). For the ADAR1 p110 en- Fluorescence measurements were performed using a
zyme, deamination reactions were performed as above with CLARIOstar microplate reader and a Nunc MaxiSorpNucleic Acids Research, 2021, Vol. 49, No. 7 4025
384-well black bottom plate. Excitation was at 320 nm and further examine these effects using a more complex RNA
fluorescence emission was scanned from 340 to 430 nm target, we used a high-throughput sequencing-based strat-
with 0.2 nm resolution. Spectra were obtained for solutions egy to quantify the 32 RNA permutations arising from com-
containing 2.5 M RNA, with or without 10 M ADAR2, binatorial editing at up to five sites within 5HT2C transcripts
in 36 mM Tris–HCl (pH 7.0 to 8.5) or Bis–Tris–HCl (pH (sites A, B, E, C and D). Results from this analysis showed
6.0 to 7.0), 7% glycerol, 142 mM KCl, 3.6 mM EDTA, that acidification significantly increased the expression of
0.007% NP-40 and 0.7 mM DTT at room temperature (48). several more highly edited 5HT2C RNA isoforms at the ex-
The background fluorescence of the enzyme buffered at pense of less edited RNA species (Supplementary Figure
each pH was subtracted from the spectrum of the complex, S2).
and the background fluorescence of the buffer alone at To verify that changing the bicarbonate concentration to
each pH was subtracted from the RNA. Each spectrum manipulate the extracellular pH concomitantly produced
is an average of three independent measurements that changes in intracellular pH, we used a fluorescent pH indi-
were LOWESS fit using Graphpad Prism software. The cator, pHrodo Red, whose fluorescence intensity is inversely
Downloaded from https://academic.oup.com/nar/article/49/7/4020/6171293 by guest on 08 November 2021
fluorescence intensity values at max were used to determine correlated with intracellular pH. pHrodo fluorescence sig-
the fluorescence enhancement by ADAR in the formula nificantly increased upon incubation with the acidic cell cul-
FE = (FIADAR-RNA – FIRNA )/FIRNA where FE is fluores- ture medium (pH 6.7) (Figure 2A). This highly fluorescent
cence enhancement, and FI values are the fluorescence pHrodo Red signal colocalized with a vital nuclear dye (Bio-
intensity of samples containing either RNA or RNA in the Tracker 488), indicating acidification of the nucleus, which
presence of ADAR2. Fluorescence enhancement values has been shown to be the major site of ADAR localization
were normalized so that the value of FIADAR-RNA at pH 7.5 and RNA editing (50,51).
corresponds to 1. To examine pH-dependent increases in RNA editing as
a function of time, we quantified A-to-I modification of
5HT2C transcripts by ADAR1 or ADAR2 over a time
RESULTS course from 1 to 24 h (Figure 2B and Supplementary Fig-
ure S3). We chose 5HT2C RNA for these studies because it
Intracellular acidification increases RNA editing
contains multiple editing sites that are recognized by both
Kinetic analyses of ADAR activity in which a conserved ADARs, though previous studies have shown that ADAR1
glutamate in the deaminase domain was mutated to a glu- preferentially edits the A- and B-sites, and ADAR2 pref-
tamine, which is fully protonated under normal conditions, erentially edits the D-site (17). The extent of editing for
revealed enzyme hyperactivity (12,37,38). These observa- all five 5HT2C sites was increased significantly under acidic
tions suggested that editing activity by wild-type ADARs conditions for most time points. For several sites, a sig-
could be enhanced when the intracellular proton concen- nificant increase in editing at pH 6.7 (acidic) compared
tration is increased beyond that normally observed under to pH 7.4 (control) could be observed in as little as 1
control conditions. To determine the effects of cellular acid- h and continued to increase over control levels over the
ification on RNA editing, minigene constructs encoding entire 24-h time period. Interestingly, ADAR1 editing of
the minimum essential RNA duplexes required for editing the A-site as well as ADAR2 editing of several sites ap-
of 5HT2C , GluA2 and Gli1 transcripts (Figure 1A) were peared to increase logarithmically under acidic conditions,
transiently co-expressed with either ADAR1 or ADAR2 whereas the time-dependent increases in editing under con-
in a human embryonic kidney (HEK293T) cell line, fol- trol conditions appeared more linear. We also examined
lowed by quantitative analysis of site-selective A-to-I con- pH-dependent alterations in Gli1 editing at two timepoints,
version (17,39,40). For these studies, the pH of the cell cul- 6 and 24 h (Figure 1C and Supplementary Figure S4, re-
ture medium was adjusted to either pH 7.4 (control) or pH spectively). Acidification-induced increases in editing at the
6.7 (acidic) by manipulation of the bicarbonate concentra- R/G site were observed only at the earlier timepoint. In-
tion, which affects the buffering capacity of the media in the terestingly, the absence of increased R/G site editing at re-
5% CO2 incubator environment. Acidification significantly duced pH after 24 h was concurrent with increased edit-
increased ADAR1 and ADAR2-mediated editing of numer- ing of additional adenosine residues within the Gli1 tran-
ous sites within the examined transcripts (Figure 1B–D), al- script, many of which exhibited increased editing upon acid-
though the magnitude of the effect was both site-dependent ification. These results indicate that editing of the R/G site
and dependent upon the specific ADAR acting upon it. No- reached its endpoint by 24 h and further suggest that the
tably, sites preferentially recognized by a specific ADAR rate of catalysis for this site is more rapid than for other
underwent robust increases in editing under acidic condi- Gli1 sites.
tions (up to ∼40%) when acted upon by that ADAR. For To further examine how RNA editing is affected by al-
example, ADAR2-mediated editing of the GluA2 +262 site terations in pH, we analyzed ADAR1 or ADAR2-mediated
increased from 29.4% ± 0.02 to 68.3% ± 0.8 under acidic editing of 5HT2C transcripts over a pH range from 6.7 to 7.4
conditions. Such large changes in editing levels are compa- that was established by varying the concentration of bicar-
rable to the largest changes in editing that have been ob- bonate in the cell culture medium between 0 and 3.7 mg/ml
served, such as in response to ADAR1 induction by inter- NaHCO3 (Supplementary Figure S5A). ADAR1 editing at
feron treatment (49). However, the effect of acidification the A-, B- and C-sites, as well as ADAR2 editing at all five
on editing appeared less pronounced on several 5HT2C and sites, showed incremental increases in editing with decreas-
GluA2 sites that are not preferentially targeted by a partic- ing pH (Figure 2C; statistical analysis of Figure 2C shown
ular ADAR (Figure 1D and Supplementary Figure S1). To in Supplementary Figure S5B; and Supplementary Figure4026 Nucleic Acids Research, 2021, Vol. 49, No. 7
Downloaded from https://academic.oup.com/nar/article/49/7/4020/6171293 by guest on 08 November 2021
Figure 1. Effects of acidification on A-to-I editing in transfected cells. (A) The predicted secondary structures of GluA2, Gli1 and 5HT2C minigene-derived
RNA transcripts is presented; editing sites are indicated in inverse lettering; nt = nucleotides. (B–D) Quantification of site-selective ADAR1 or ADAR2-
mediated editing in minigene-derived RNAs from HEK293T cells incubated with control media (pH 7.4) or under acidic conditions (pH 6.7). Results for
24-h editing assays for GluA2 and 5HT2C , and 6-h editing assays for Gli1 are shown. Plotted values represent the means of three biological replicates
() ± SD. Statistical significance between groups for each site in GluA2 and 5HT2C transcripts was determined using the Holm–Sidak t-test for multiple
comparisons; statistical significance between groups for the Gli1 R/G site was determined using an unpaired t-test with Welch’s correction; *P ≤ 0.05; **P
≤ 0.01; ***P ≤ 0.001; ****P ≤ 0.0001; ns, not significant.Nucleic Acids Research, 2021, Vol. 49, No. 7 4027
Downloaded from https://academic.oup.com/nar/article/49/7/4020/6171293 by guest on 08 November 2021
Figure 2. Time- and pH-dependent effects of intracellular acidification on the site-specific editing of 5HT2C transcripts. (A) Representative 20× confocal
images of live HEK293T cells incubated with control media (pH 7.4; top) or acidic media (pH 6.7; bottom) and double labelled with pHrodo Red AM
Intracellular pH Indicator and BioTracker 488 Green Nuclear Dye (left); normalized mean pHrodo Red fluorescence intensity per cell is presented (right);
means ± SD (n = 115 control cells from three independent experiments and n = 106 acidic cells from three independent experiments) were compared by
using the unpaired t-test with Welch’s correction; ****P < 0.0001. (B) A comparison of the extent of ADAR1 or ADAR2-mediated editing for 5HT2C
transcripts at control (pH 7.4, ––•––) or acidic pH (pH 6.7, ––––) after 1, 3, 6, 12 or 24 h is presented. Plotted values represent the means of three
biological replicates ± SD. Statistical significance between groups at a given time point was determined using Sidak’s multiple comparisons test; *P ≤ 0.05;
**P ≤ 0.01; ***P ≤ 0.001; ****P ≤ 0.0001. (C) Quantification of ADAR1 or ADAR2-mediated 5HT2C editing across a pH range from 6.7 to 7.4. Plotted
values are the means of three biological replicates () ± SD.
S6). The largest stepwise increase in pH-dependent ADAR1 ing affected ADAR protein levels in transfected cells,
editing was observed between pH 7.4 and 7.3, whereas the ADAR expression from HEK293T cells co-transfected with
largest stepwise increase in pH-dependent ADAR2 editing ADAR1 or ADAR2 and the 5HT2C minigene were quanti-
was observed between pH 6.9 and 6.8. fied after a 24-h incubation with cell culture medium under
Although numerous studies have concluded that differ- control (pH 7.4) or acidic (pH 6.7) conditions. Quantita-
ences in steady-state ADAR protein levels do not fully ac- tive western blotting analyses revealed significant increases
count for differences in the cell- and region-specific RNA in both ADAR1 and ADAR2 protein expression upon cel-
editing profiles, previous studies in cell culture model sys- lular acidification (Figure 3), suggesting that pH-dependent
tems have shown a correlation between editing and ADAR increases in ADAR protein in this model system could be
expression (5,31–36,52,53). To determine whether the re- responsible for the increases in editing observed at reduced
ductions in extracellular pH that promoted increased edit- pH.4028 Nucleic Acids Research, 2021, Vol. 49, No. 7
A B cation increases the extent of editing regardless of whether
or not substrate levels change (Figure 4D). Taken together,
these data indicate that acidification-induced increases in
endogenous RNA editing cannot be explained by accom-
panying changes in the expression levels of ADARs or their
RNA substrates in HeLa cells.
To verify that the observed increases in RNA editing
resulted from decreased pH rather than cellular mecha-
nisms associated with altered extracellular bicarbonate lev-
els, we employed an alternative method to induce intra-
cellular acidification by treating cells with niclosamide, a
protonophore which has previously been shown to trig-
ger intracellular acidification in the absence of extracellu-
Downloaded from https://academic.oup.com/nar/article/49/7/4020/6171293 by guest on 08 November 2021
lar acidification (58). Using pHrodo Red, we confirmed
that niclosamide treatment induced intracellular acidifica-
Figure 3. ADAR protein expression in response to acidification in tion in HeLa and HEK293T cells, although the extent of in-
HEK293T cells. (A) Representative Western blots for ADAR1 (110 kDa) crease in pHrodo fluorescence after niclosamide treatment
and ADAR2 (80 kDa) protein expression from HEK293T cells incubated was less than that observed after incubation with acidic
with control (pH 7.4) or acidic media (pH 6.7); -actin (43 kDA) was used medium (Figure 4E, Supplementary Figure S9, and Supple-
as a loading control. (B) Quantification of ADAR1 and ADAR2 protein
expression normalized to the -actin loading control is presented. Plotted
mentary Figure S10A and B). Accordingly, smaller but sig-
values represent the means of three biological replicates () ± SD. Statis- nificant increases in editing were observed upon 6-h treat-
tical significance between groups was determined using the unpaired t-test ment with 5 M niclosamide compared to vehicle-treated
with Welch’s correction; *P ≤ 0.05. controls (Figure 4F and Supplementary Figure S10C
and D).
Because HEK293 cell lines are largely devoid of en-
The RNA editing reaction is intrinsically pH-sensitive
dogenous editing activity, they are well-suited to study the
isolated, site-specific activities of recombinant ADAR1 or While increases in RNA editing produced by acidification
ADAR2 on various substrates via transient transfection in HEK293T cells could result from increased ADAR pro-
(35). However, ADAR expression and RNA editing in a het- tein expression, such a mechanism cannot account for the
erologous expression system may be subject to different reg- acidification-induced increases in editing in HeLa cells. As
ulatory mechanisms than those present in cell lines exhibit- such, the observed increases in RNA editing at reduced pH
ing endogenous editing activity. To address this possibil- also could be explained by other molecular mechanisms in-
ity, we investigated the effect of acidification on RNA edit- cluding activation of various pH-regulated signaling path-
ing in HeLa cells, which show appreciable levels of endoge- ways or the effects of pH on RNA structure and the intrin-
nous editing (35). Relative to HeLa cells incubated with sic pH sensitivity of ADAR activity. To directly examine
control medium, HeLa cells incubated with acidic culture this last possibility, in vitro editing assays were performed
medium displayed increased pHrodo fluorescence, demon- to quantify deamination rate constants (kobs ) at varying pH
strating that this manipulation also produced intracellular (from pH 6.0 to pH 8.5) using purified, recombinant ADAR
acidification in this cell line (Figure 4A and Supplemen- protein and an in vitro transcribed 5HT2C substrate. For
tary Figure S7). We then assessed the editing of three tran- most sites examined, an inverse correlation between deam-
scripts endogenously expressed in HeLa cells: Eef2k, Blcap ination rate and pH between pH 6.5 and 8.5 was observed.
and Cog3. Eef2k and Blcap previously were shown to be For example, ADAR1 deamination of the A-site was most
preferentially edited by ADAR1, while Cog3 was shown to efficient at pH 6.5 (Figure 5A). Similarly, ADAR2 deamina-
be preferentially edited by ADAR2 (54–57). Acidification tion of the A-, B- and C-sites also was most efficient at pH
significantly increased editing of these transcripts without 6.5 and pH 7.0 (Figure 5B). The rate of editing for these sites
concomitant changes in endogenous ADAR1 protein ex- is about 1.5-fold less efficient at pH 7.5 than at either pH
pression (Figure 4B and C). Even though Cog3 editing was 7.0 or pH 6.5. To assess whether the observed differences in
significantly increased at reduced pH, ADAR2 protein ex- catalytic rate resulted from changes in pH-dependent stabil-
pression was not detectable under control or acidic condi- ity of ADAR proteins, the melting temperature of recombi-
tions, though quantitative RT-PCR (qRT-PCR) analyses re- nant ADAR2 protein was quantified using SYPRO Orange,
vealed a significant decrease in ADAR2 mRNA expression a dye that increases in fluorescence intensity upon thermal
at reduced pH (Supplementary Figure S8). To determine denaturation of the protein (59). Results from this Ther-
whether changes in the expression levels of the RNA editing moFluor analysis revealed that ADAR2 was relatively sta-
substrates could account for pH-dependent effects on edit- ble from pH 6.5 to pH 8.5, with a melting temperature of
ing, we also used qRT-PCR to examine the expression of ∼53◦ C across this range (Figure 5C). At pH 6.0 however,
each of the three editing substrates under control and acidic the melting temperature of the ADAR2 protein was signifi-
conditions. Blcap expression remained unchanged between cantly decreased, an instability that paralleled the observed
conditions, while Eef2k and Cog3 expression decreased and reduction in catalytic rate for the 5HT2C editing sites (Fig-
increased at acidic pH, respectively, suggesting that acidifi- ure 5A–C).Nucleic Acids Research, 2021, Vol. 49, No. 7 4029
Downloaded from https://academic.oup.com/nar/article/49/7/4020/6171293 by guest on 08 November 2021
Figure 4. Effects of cellular acidification on endogenous A-to-I editing in HeLa cells. (A) Quantification of normalized mean pHrodo Red fluorescence
intensity per cell from HeLa cells incubated with control media (pH 7.4) or acidic media (pH 6.7) is presented; means ± SD (n = 124 control cells from three
independent experiments and n = 115 acidic cells from three independent experiments) were compared using the unpaired t-test with Welch’s correction;
****P < 0.0001. (B) Representative electropherogram traces from Sanger sequencing of Cog3, Eef2k or Blcap RT-PCR amplicons generated from HeLa
cells incubated with control media (pH 7.4; top) or acidic media (pH 6.7; bottom). The edited position within each trace is highlighted in yellow (left);
quantification of editing is presented (right) after 24 h of incubation with control (pH 7.4) or acidic (pH 6.7) media. Plotted values represent the means
of three biological replicates () ± SD. Statistical significance between groups was determined using the unpaired t-test with Welch’s correction; **P ≤
0.01; ***P ≤ 0.001; ****P < 0.0001. (C) Representative Western blot for ADAR1 protein expression from HeLa cells incubated with control (pH 7.4)
or acidic media (pH 6.7); -actin (43 kDA) was used as a loading control (left). Quantification of ADAR1 protein expression normalized to the -actin
loading control is presented (right). Plotted values represent the means of three biological replicates () ± SD. Statistical significance between groups
was determined using the unpaired t-test with Welch’s correction; ns, not significant. (D) Quantification of relative mRNA expression for Cog3, Eef2k
and Blcap from HeLa cells incubated with control (pH 7.4) or acidic media (pH 6.7). Plotted values represent the means of three biological replicates
() ± SD. Statistical significance between groups was determined using unpaired t-test; *P ≤ 0.05; **P ≤ 0.01; ns, not significant. (E) Quantification of
normalized mean pHrodo Red fluorescence intensity per cell from HeLa cells treated with DMSO or 5 M niclosamide is presented; means ± SD (n =
69 DMSO-treated cells from three independent experiments and n = 70 niclosamide-treated cells from three independent experiments) were compared
using unpaired t-test with Welch’s correction; ****P < 0.0001. (F) Representative electropherogram traces from Sanger sequencing of Cog3, Eef2k or
Blcap RT-PCR amplicons generated from HeLa cells treated with DMSO (top) or 5 M niclosamide (bottom). The edited position within each trace
is highlighted in yellow (left); quantification of editing is presented (right). Plotted values represent the means of three biological replicates () ± SD.
Statistical significance between groups was determined using unpaired t-test with Welch’s correction; *P ≤ 0.05; **P ≤ 0.01.4030 Nucleic Acids Research, 2021, Vol. 49, No. 7
Downloaded from https://academic.oup.com/nar/article/49/7/4020/6171293 by guest on 08 November 2021
Figure 5. Effect of varying pH on in vitro A-to-I editing. (A) Rate of in vitro ADAR1- or (B) ADAR2-mediated 5HT2C editing at half-pH intervals from
6.0 to 8.5. Plotted values represent the means of three technical replicates () ± SD. Statistical significance between groups was determined using one-
way ANOVA with Tukey’s multiple comparisons test; *P ≤ 0.05; **P ≤ 0.01; ***P ≤ 0.001; ****P ≤ 0.0001. (C) Quantification of ADAR2 melting
temperature across the pH range used for in vitro editing experiments. Plotted values represent the means of three technical replicates () ± SD. Statistical
significance between groups was determined using one-way ANOVA with Tukey’s multiple comparisons test; **P ≤ 0.01; ns, not significant. (D) Rate of in
vitro ADAR2d-mediated Gli1 R/G site editing. Plotted values represent the means of three technical replicates () ± SD. Statistical significance between
groups was determined using one-way ANOVA with Tukey’s multiple comparisons test; **P ≤ 0.01; ****P ≤ 0.0001.
Taken together, these in vitro analyses demonstrate that Protonation of a conserved glutamate residue in the ADAR
the RNA editing reaction is intrinsically pH-sensitive, base-flipping loop partially accounts for increases in RNA
a property that may arise through changes in ADAR- editing at acidic pH
substrate binding or catalysis at reduced pH, but not
A recent investigation of the structural basis for base-
by changes in ADAR protein expression. To exclude the
flipping by ADAR2 revealed the importance of a highly
possibility that the observed increase in editing rates re-
conserved glutamate, E488 (corresponding to E1008 in
sulted from enhanced ADAR2-substrate binding via the
ADAR1), residing in the deaminase domain of the enzyme
double-stranded RNA binding domains (dsRBDs), the pH-
(37). This residue stabilizes the flipped-out conformation
sensitivity of the ADAR catalytic domain alone was as-
of the RNA duplex, presumably by occupying the space
sessed by taking advantage of the efficient editing of Gli1
vacated by the flipped-out adenosine and hydrogen bond-
by the ADAR2 deaminase domain (ADAR2d) lacking
ing with the complementary-strand orphaned base (Figure
dsRBDs (39). ADAR2d deamination of the Gli1 R/G site
6A and B and Supplementary Figure S11). Mutant ADAR
was 40- to 130-fold more efficient under acidic conditions
proteins bearing a glutamate-to-glutamine substitution at
than at pH 7.5, with kobs = 3.1 min–1 ± 0.2 at pH 6.5 and kobs
this residue (ADAR1-Q and ADAR2-Q) exhibit increased
= 0.023 min–1 ± 0.006 at pH 7.5 (Figure 5D). These data
catalytic activity via enhanced base-flipping (12,31,32). As
indicate that RNA editing can be facilitated under acidic
this glutamine is fully protonated under normal physiologic
conditions independently of substrate interactions with the
conditions at pH 7.4, these observations are consistent with
ADAR dsRBDs.
the idea that the corresponding glutamate residue in wild-Nucleic Acids Research, 2021, Vol. 49, No. 7 4031
Downloaded from https://academic.oup.com/nar/article/49/7/4020/6171293 by guest on 08 November 2021
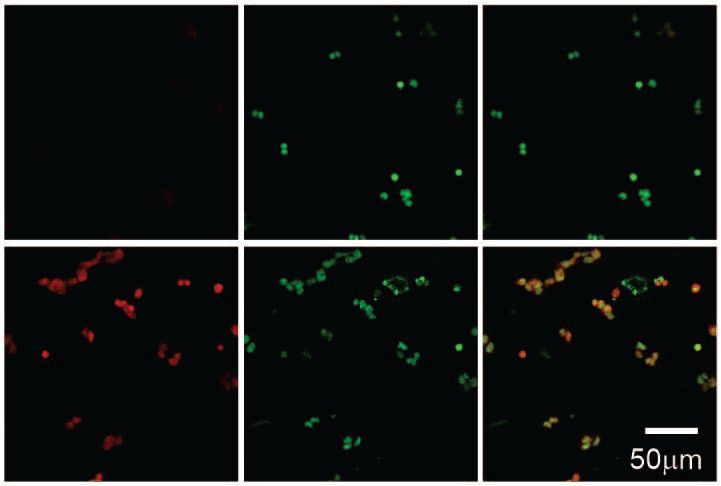
Figure 6. Effects of a glutamate-to-glutamine substitution on the pH-dependence of ADAR base-flipping and editing. (A) The crystal structure of ADAR2d
bound to dsRNA (PDB ID: 5HP3 & 5ED1) shows the base-flipped conformation stabilized by contacts between residue 488 and the orphan base. (B)
An illustration of the hydrogen bonding contact between ADAR2 and the orphan base showing protonation-dependent hydrogen bonding for wild-
type ADAR2. (C) Normalized fluorescence enhancement from a dsRNA substrate containing 2-aminopurine in the edited position, corresponding to
base-flipping by the ADAR2 enzyme. Plotted values represent the means of three technical replicates ± SD. Statistical significance between groups was
determined using one-way ANOVA with Tukey’s multiple comparisons test; **P ≤ 0.01; ***P ≤ 0.001; ****P ≤ 0.0001; ns, not significant. (D) Rates
of in vitro ADAR2d- and ADAR2d-Q mediated Gli1 (+23 site) editing. Plotted values represent the means of three technical replicates () ± SD. Sta-
tistical significance between groups was determined using the Holm-Sidak t-test for multiple comparisons; *P ≤ 0.05; **P ≤ 0.01; ****P ≤ 0.0001. (E)
Quantification of ADAR2d and ADAR2d-Q melting temperatures across the pH range used for in vitro editing experiments. Plotted values represent the
means of three technical replicates () ± SD. (F) Quantification of the extent of acidification-induced increases in 5HT2C editing mediated by wild-type
ADARs or ADAR-Q mutants ( % editing = % site-selective editing at pH 6.7 - % site-selective editing at pH 7.4). Plotted values represent the means of
three biological replicates () ± SD. Statistical significance between groups for each 5HT2C site was determined using the Holm–Sidak t-test for multiple
comparisons; **P ≤ 0.01; ***P ≤ 0.001; ****P ≤ 0.0001.4032 Nucleic Acids Research, 2021, Vol. 49, No. 7
type ADARs requires protonation to support RNA stabi- of RNA editing by ADAR1 and ADAR2, we used a cell
lization during the base-flipping step in catalysis (Figure culture model of hypoxia (43). Transfected HEK293T cells
6A and B). To further examine how base-flipping is mod- were incubated for 24 h under hypoxic (1% O2 ) or normoxic
ulated by ADAR protonation, we compared base-flipping (20% O2 ) conditions, followed by quantification of 5HT2C
for ADAR2 and ADAR2-Q proteins as a function of pH us- editing profiles, determinations of the pH of the cell culture
ing a 2-aminopurine (2-AP)-modified GluA2 transcript to media, as well as quantification of ADAR protein expres-
measure 2-AP fluorescence intensity, which has been shown sion. Results from these studies showed that hypoxia signif-
previously to correlate with base-flipping (12,48). The flu- icantly increased ADAR1 and ADAR2-mediated editing of
orescence intensity observed with the ADAR2-Q mutant all five 5HT2C sites and concomitantly decreased the pH of
was greater than that exhibited with the wild-type ADAR2 the cell culture medium by 0.6 ± 0.01 pH units relative to
protein at each pH, confirming that ADAR2-Q has en- normoxic conditions (Figure 7A–C). Furthermore, no sig-
hanced base-flipping abilities (Figure 6C). However, a dif- nificant differences in ADAR1 or ADAR2 protein expres-
ferential pH dependence between wild-type ADAR2 and sion were detected between hypoxic and normoxic condi-
Downloaded from https://academic.oup.com/nar/article/49/7/4020/6171293 by guest on 08 November 2021
the ADAR2-Q mutant enzyme was observed where the flu- tions, indicating that the increased RNA editing produced
orescence intensity with the wild-type enzyme increased by hypoxia cannot be explained by concomitant changes in
with decreasing pH, whereas fluorescence intensity with the ADAR expression (Figure 7D and E). Similar effects of hy-
ADAR2-Q mutant was maximal at pH 7.0, but dropped off poxia on endogenous RNA editing and ADAR expression
significantly with increasing or decreasing pH (Figure 6C). were observed in HeLa cells (Supplementary Figure S12),
These data indicate that ADAR base-flipping is intrinsically indicating that that the extent of RNA editing is inversely
pH-dependent and that base-flipping by the ADAR-Q mu- correlated with pH changes produced by a physiologically
tant enzyme is less affected by acidification than the wild- relevant cell culture model of metabolic stress.
type ADAR2 protein.
To further compare the relative pH sensitivity of wild-
DISCUSSION
type and mutant (ADAR-Q) proteins, we measured the rate
of Gli1 deamination (+23 site) by ADAR2d and ADAR2d- The mechanisms underlying changes in RNA editing pro-
Q enzymes from pH 6.5-8.0. Interestingly, the deamination files in response to physiologic signals are not well-defined.
rates for the wild-type and mutant deaminase domains are Most of the known trans-acting regulators of editing mod-
similar at pH 6.5, with kobs = 0.91 min–1 ± 0.2 and kobs ulate ADAR protein levels, yet steady-state ADAR protein
= 1.3 min–1 ± 0.09, respectively. However, the efficiency expression fails to fully account for the observed spatiotem-
of wild-type ADAR2d deamination decreased over 450- poral variations in A-to-I conversion (5,31–36). Though dy-
fold with increasing pH, while the efficiency of ADAR2d-Q namic regulation of ADAR activity––rather than ADAR
deamination only decreased between 2.5- and 5-fold with expression––could explain significant changes in RNA edit-
increasing pH (Figure 6D). Moreover, ADAR2d-Q deam- ing, the mechanisms regulating such activity remain elusive.
inated Gli1 more efficiently than ADAR2d at each pH de- Previous structural and biochemical characterization of
spite decreased stability of the mutant protein across the en- ADARs and ADAR mutants has suggested a pH-sensitive
tire pH range (Figure 6E). These results show that the pH- deamination mediated by these enzymes (12,37,38). There-
dependence of deamination is much greater for wild-type fore, our studies have focused on how changes in pH regu-
ADAR2d than for ADAR2d-Q. Finally, the site-specific late RNA editing. Analysis of numerous editing sites from
editing of 5HT2C transcripts was assessed using wild-type various RNA substrates in HEK293T and HeLa cells, as
and ADAR-Q mutant enzymes in transfected HEK293T well as in vitro biochemical systems, revealed significant
cells incubated under control (pH 7.4) or acidic (pH 6.7) increases in ADAR1 and ADAR2-mediated editing un-
conditions. Results from this analysis showed that while the der acidic conditions relative to editing at a physiologic
extent of editing was increased for both ADAR1-Q and pH of ∼7.4 (Figures 1–2 and Figures 4–5). These multi-
ADAR2-Q mutants under acidic conditions, acidification- ple lines of evidence from different model systems indicate
induced increases in editing by ADAR1-Q and ADAR2-Q that the results presented here are robust and reproducible.
were attenuated relative to those exhibited by their wild- Moreover, several sites, including the A-, B- and E-sites of
type ADAR counterparts (Figure 6F). Taken together, 5HT2C RNAs, as well as various adenosines within Gli1
these data suggest that protonation of ADAR1 at E1008 transcripts, are virtually unrecognized or edited at very low
or ADAR2 at E488 partially accounts for the increases in levels by one or both ADARs at pH 7.4, but undergo ro-
RNA editing observed at acidic pH. bust editing as a result of acidification (Figure 1 and Sup-
plementary Figure S4). Although these increases in edit-
ing were accompanied by increases in intracellular ADAR
RNA editing increases during hypoxia
protein levels in HEK293T cells, results from experiments
Various physiologic and pathophysiologic conditions have using HeLa cells and in vitro studies using recombinant
been shown to induce changes in intracellular or extra- ADARs indicated that increased ADAR expression is not
cellular pH such as hypoxia, inflammatory signaling, tu- required to observe acidification-mediated increases in edit-
morigenesis, and metabolic acidosis (60,61). Previous stud- ing (Figures 4–5). Indeed, these in vitro data demonstrate
ies have shown that acid-base disturbances that occur dur- an intrinsic and robust pH-sensitivity of ADAR cataly-
ing hypoxia induce both intra- and extracellular acidifica- sis (Figure 5). While acidification could alter the rate of
tion (62). To determine whether physiologic manipulation editing by affecting ADAR binding and/or catalytic effi-
of the cell culture environment could modulate the extent ciency, pH-sensitive editing of Gli1 by ADAR2d (lackingYou can also read