Recent Advances in Real-Time Pluvial Flash Flood Forecasting - MDPI
←
→
Page content transcription
If your browser does not render page correctly, please read the page content below
water
Review
Recent Advances in Real-Time Pluvial Flash
Flood Forecasting
Andre D. L. Zanchetta 1, *         and Paulin Coulibaly 1,2,3
 1   Department of Civil Engineering, McMaster University, 1280 Main Street West, Hamilton, ON L8S 4L7,
     Canada; couliba@mcmaster.ca
 2   School of Geography and Earth Sciences, McMaster University, 1280 Main Street West, Hamilton,
     ON L8S 4L7, Canada
 3   United Nations University Institute for Water, Environment, and Health, Hamilton, ON L8P 0A1, Canada
 *   Correspondence: dellalia@mcmaster.ca

 Received: 29 January 2020; Accepted: 15 February 2020; Published: 19 February 2020

 Abstract: Recent years have witnessed considerable developments in multiple fields with the potential
 to enhance our capability of forecasting pluvial flash floods, one of the most costly environmental
 hazards in terms of both property damage and loss of life. This work provides a summary and
 description of recent advances related to insights on atmospheric conditions that precede extreme
 rainfall events, to the development of monitoring systems of relevant hydrometeorological parameters,
 and to the operational adoption of weather and hydrological models towards the prediction of flash
 floods. With the exponential increase of available data and computational power, most of the
 efforts are being directed towards the improvement of multi-source data blending and assimilation
 techniques, as well as assembling approaches for uncertainty estimation. For urban environments,
 in which the need for high-resolution simulations demands computationally expensive systems,
 query-based approaches have been explored for the timely retrieval of pre-simulated flood inundation
 forecasts. Within the concept of the Internet of Things, the extensive deployment of low-cost sensors
 opens opportunities from the perspective of denser monitoring capabilities. However, different
 environmental conditions and uneven distribution of data and resources usually leads to the adoption
 of site-specific solutions for flash flood forecasting in the context of early warning systems.

 Keywords: flash flood; flood forecast; flood prediction; rainfall prediction; precipitation forecast;
 early warning systems; flood inundation forecast

1. Introduction
     Flash floods (FFs) are among the most damaging types of weather-related disasters faced nowadays.
They may be caused either by extreme precipitation, by the failure of human-made structures, such as
dams, or by complex water-snow interactions. The fast development of FFs imposes additional
challenges for early prediction when compared to riverine floods. Structural measures adopted to
reduce the impact of these events include the construction of physical components aimed to enhance
the overall resilience of drainage systems, such as levees and detention ponds. Nonstructural solutions
include the adoption of regulations for land use/occupation, personal training for responsive actions,
and the implementation of operational flash flood early warning systems (FFEWSs).
     A core feature of FFEWSs is the capability to perform timely and accurate FF forecasts. Methods
for FF forecasting demand continuous improvement, mainly in the current context of progressive
changes in urbanization and climate patterns that lead to an increased susceptibility to FFs observed in
different locations worldwide [1–3]. The work developed by Hapuarachchi et al. in 2011 [4] brings
comprehensive state-of-the-art for its time in the topics of input data, modeling approaches and

Water 2020, 12, 570; doi:10.3390/w12020570                                       www.mdpi.com/journal/water
Water 2020, 12, 570 2 of 29
estimation of uncertainties related to FF forecasting. Since then, several advances were observed in
multiple related fields driven by an expansion of monitoring capabilities, consolidation of extensive
datasets, and the establishment of higher resolution models due to increasing computational power.
The objective of this review paper is to provide a centralized summary of recent developments
associated with FF forecasting with a focus on existing or potential real-time operational applications
and to discuss the latest insights on promising opportunities for their enhancement. The main
contribution of this paper relies on answering the questions, “How has flash flood forecasting evolved
in the last decade?” and “Which are the current major gaps and trends in this field?”.
As such, a non-structured literature review was performed over a selected number of papers
published in renowned peer-reviewed journals, official technical reports, and conference abstracts
considered relevant for topics related to the enhancement of operational FF forecasting.
Scope, Definitions, and Work Structure
Flash floods are defined by the United States’ (US) National Weather Service as “A rapid and
extreme flow of high water into a normally dry area, or a rapid water level rise in a stream or creek
above a predetermined flood level, beginning within six hours of the causative event (e.g., intense
rainfall, dam failure, ice jam)” [5]. From an operational perspective, priority is usually given to the
capability of predicting their occurrence, while for riverine floods primary importance is given to the
prediction of their magnitudes [6].
Various terminologies can be applied for specific activities associated with prediction systems.
In this work, “anticipation” is used to qualitatively describe the expected occurrence/non-occurrence
of an event in the near future, with no (or very few) details about the upcoming scenario. The term
“forecast” is used for the activities that generate quantitative information in time and space. Specifically,
the terms “short-term forecast” and “nowcast” are used for forecast windows of up to 6 h [7,8],
and “long-term forecast” is applied when the forecast window is longer.
This work considers only events driven by extreme precipitation due to their significantly higher
occurrence when compared to the ones triggered by other circumstances. Pluvial FFs can be caused by
deep and local convective precipitation, orographic effects, storm surges, and cyclones. As cyclones
are usually associated with synoptic-scale patterns and have their specific and extensive research field,
they are not explicitly discussed in this work. From this perspective, FF forecasting is highly related to
the challenging meteorological problem of predicting extreme local rainfall events [9].
Multiple approaches were proposed and implemented for FF prediction as environments with
different configurations and available datasets are prone to such types of hazards, usually leading to the
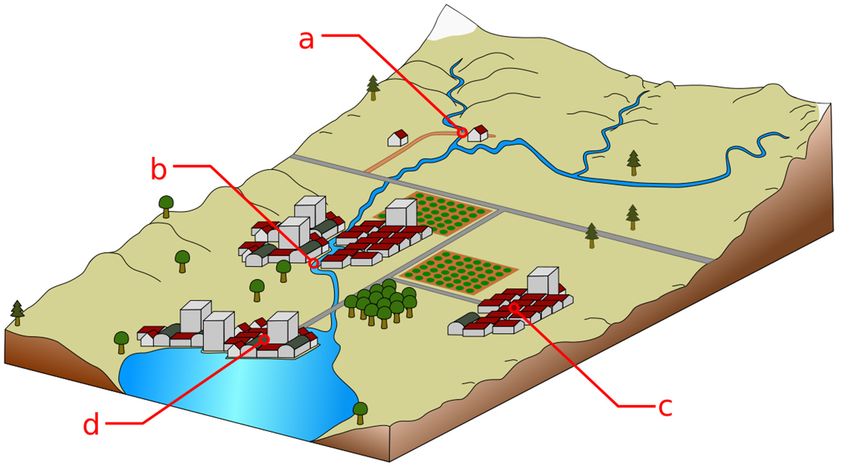
adoption of customized solutions. FF prone areas include non-urban steep catchments [10], urban or
semi-urban catchments [2], urban neighborhoods served [11] (or not [12]) by a central drainage channel,
and coastal urban zones [13], as illustrated in Figure 1. In this work, we use the expression “catchment”
(and “sub-catchment”) for areas in which runoff is directed to a single outlet point (and an inlet point
is present). When the boundaries of the study area take into consideration non-geomorphological
delineations (as administrative borders), the term “neighborhood” is used. When both boundary
definitions are acceptable, the expressions “zone” or “environment” are interchangeably used.
As this type of hazard is mainly characterized by occurring with short development time and on
small catchments, advances towards: (1) increase in the spatiotemporal resolution and precision of
input and output data, (2) increase of overall lead time and awareness, and (3) reduction of the total
computational expenses for the generation of relevant products are assumed to be of interest to the
problem and are explored in this work.
The discussion is presented as follows. In Section 2, the different approaches usually adopted to
determine whether a FF is expected or not are described. In Section 3, we comment on results from
a selected number of recently published exploratory analyses on atmospheric contributing factors
for extreme precipitation events. In Section 4, recent advances and developments on remote sensing
techniques relevant to the subject are commented on. Precipitation prediction and hydrodynamicWater2020,
Water 2020,12,
12,570
x FOR PEER REVIEW of29
3 of 30
techniques relevant to the subject are commented on. Precipitation prediction and hydrodynamic
models
modelsinvolved
involvedininforecasting
forecastingchains
chainsare
arepresented
presentedininSections
Sections55and
and6,6,respectively.
respectively.The
Thework
workisis
concluded with a summarizing discussion of the key findings from the presented literature review
concluded with a summarizing discussion of the key findings from the presented literature review and
recommendations of future
and recommendations work work
of future in thein
field.
the field.
.
Figure1.1.Different
Figure Differenttypes ofof
types flash flood-prone
flash environments
flood-prone environmentsinclude (a) non-urban
include steepsteep
(a) non-urban catchments and
catchments
(b) urban neighborhoods served or (c) not by a central drainage channel, and (d) coastal urban
and (b) urban neighborhoods served or (c) not by a central drainage channel, and (d) coastal urban zones.
zones.
2. Criteria for Deciding Flash Flood Occurrence
At the operational
2. Criteria for Decidingtime, the Flood
Flash resolution of whether or not a FF event is expected to happen in the near
Occurrence
future at a given location can be determined through different approaches and it is usually responsible
At the operational time, the resolution of whether or not a FF event is expected to happen in the
for triggering (or not) the first responsive actions to the upcoming hazard. The choice of which method
near future at a given location can be determined through different approaches and it is usually
to adopt depends on multiple factors, including resource availability, previous experience acquired,
responsible for triggering (or not) the first responsive actions to the upcoming hazard. The choice of
and even personal preferences of the operational team. The different approaches are presented in four
which method to adopt depends on multiple factors, including resource availability, previous
classes (Section 2.1 to 2.4), sorted by an increasing level of complexity. Such division is derived from
experience acquired, and even personal preferences of the operational team. The different approaches
the classification adopted by Hapuarachchi et al. [4], with the difference that two families of rainfall
are presented in four classes (Sections 2.1 to 2.4), sorted by an increasing level of complexity. Such
comparison methods are defined, taking into consideration whether surface conditions are considered
division is derived from the classification adopted by Hapuarachchi et al. [4], with the difference that
or not in the representation of the rainfall-runoff process. A simplified diagram of the different families
two families of rainfall comparison methods are defined, taking into consideration whether surface
of approaches is presented in Figure 2.
conditions are considered or not in the representation of the rainfall-runoff process. A simplified
diagram of the different families of approaches is presented in Figure 2.Water 2020, 12, 570 4 of 29
Water 2020, 12, x FOR PEER REVIEW 4 of 30
Figure
Figure 2. Overall
2. Overall workflows
workflows adopted
adopted by by
thethe different
different decision
decision approaches
approaches usually
usually present
present in flash
in flash flood
flood
early early systems
warning warning(FFEWS).
systems (FFEWS). FFSA,
FFSA, flash floodflash flood susceptibility
susceptibility assessment; assessment; RC-SN,
RC-SN, rainfall rainfall
comparison
comparison
with with surface
surface conditions conditions
neglected; neglected;
RC-SC, rainfallRC-SC, rainfallwith
comparisons comparisons with surface
surface conditions conditionsFC,
considered;
considered; FC, flow comparison; QPF, quantitative precipitation forecast; QPE, quantitative
flow comparison; QPF, quantitative precipitation forecast; QPE, quantitative precipitation estimations.
precipitation estimations.
2.1. Flash Flood Susceptibility Assessment (FFSA)
2.1. Flash Flood Susceptibility Assessment (FFSA)
One relatively simple approach that can be used as a first step for anticipating FF events is
based on One relatively
the simple
assessment ofapproach
multiplethat can be used as a firstconditions
hydrometeorological step for anticipating
known to FFprecede
events isextreme
based
on the assessment of multiple hydrometeorological conditions known to precede
precipitation scenarios. It can be performed through ingredients-based [14], checklists [15], or scoring extreme
precipitation
techniques [16].scenarios. It can be performed through ingredients-based [14], checklists [15], or scoring
techniques [16].
Quantitative precipitation forecast (QPF) products are frequently considered to be part of the data
Quantitative precipitation forecast (QPF) products are frequently considered to be part of the
available for FF forecasters. However, when they are missing or considered not reliable, a core objective
data available for FF forecasters. However, when they are missing or considered not reliable, a core
becomes the prediction of extreme rainfall events itself. Meteorological parameters traditionally
objective becomes the prediction of extreme rainfall events itself. Meteorological parameters
explored for such include precipitable water (PW), relative humidity (RH), dew point temperature
traditionally explored for such include precipitable water (PW), relative humidity (RH), dew point
(Td ), convective available potential energy (CAPE), and the so-called K-index, which describes the
temperature (Td), convective available potential energy (CAPE), and the so-called K-index, which
local potential
describes thefor thunderstorms
local [17]. When antecedent
potential for thunderstorms [17]. Whensurface conditions,
antecedent such as surface
surface conditions, such as soil
moisture
surface(SSM), are part(SSM),
soil moisture of the are
predictors, they
part of the are accounted
predictors, for through
they are accounted simplified
for through means, such as
simplified
themeans,
integration
such as the integration of recently observed precipitation. Due to its meteorological-driven of
of recently observed precipitation. Due to its meteorological-driven basis, this family
monitoring
basis, thisactivities
family isof usually performed
monitoring by weather
activities is usuallyservice teams (i.e.,
performed meteorologists)
by weather instead(i.e.,
service teams of by
river forecast centers
meteorologists) (i.e., of
instead hydrologists).
by river forecast centers (i.e., hydrologists).
Research
Researchareas ofof
areas benefit
benefitforforthe
theflash
flashflood
floodsusceptibility assessment(FFSA)
susceptibility assessment (FFSA)include
includethe the search
search
forfor
optimal
optimal meteorological
meteorologicalFF FFpredictors,
predictors, thethe application
application of of data
data provided
providedby bynewly
newlyavailable
available
meteorological
meteorological monitoring
monitoring systems
systems by operational
by operational teams, teams,
and the and the of
proposal proposal
strategies of tostrategies
communicate to
communicate
uncertainties uncertainties
associated with associated
the eventual with the eventual unavailability
unavailability of part
of part of the data of the
used data used [18].
[18].Water 2020, 12, 570 5 of 29
2.2. Rainfall Comparison with Surface Conditions Neglected (RC-SN)
When QPF products are available, the decision of whether a FF is expected to happen on a
catchment can be made based solely on a threshold-exceedance assessment of the predicted peak
precipitation accumulation value [19].
Rainfall frequency analysis approaches can be used for establishing the raw static thresholds.
Rainfall return periods are usually adopted on FFEWS designed for large areas covering multiple
low-urbanized catchments, since such locations are usually poorly monitored and the dataset needed
for empirical definitions is thus unavailable. QPF intensity values are translated to their respective
estimated return periods based on reforecast analysis (e.g., European Precipitation Index based on
simulated Climatology (EPIC) [20,21]) or on intensity duration frequency (IDF) curves retrieved either
from radar (e.g., Guadalhorce basin Flood Warning System (GFWS) [22], European Rainfall-InduCed
Hazard Assessment system (ERICHA) [23]) or rain gauge [24] observations. When the monitored
catchments are assumed to share similar rainfall-runoff response behavior, a common return period
value is usually applied as the threshold for all gauges covered by the system, which favors a fast
interpretation of the data.
For urban environments, in which rainfall-runoff response can be highly heterogeneous in space,
rainfall thresholds can be defined at neighborhood level if past FF events were properly documented.
Under such circumstances, recent works have obtained acceptable results by simply performing
graphical analysis of historical events [25] or by updating first-guess thresholds established from
simplified hydrodynamic simulations on a hit-and-miss fashion [26]. These works illustrate the
importance and applicability of high-quality disaster datasets for FF forecasting.
Since the QPF was the sole input considered by this approach, advances in precipitation forecast
capabilities are considered of special benefit for rainfall comparison with surface conditions neglected
(RC-SN) approaches.
2.3. Rainfall Comparison with Surface Conditions Considered (RC-SC)
The family of approaches based on rainfall comparisons with surface conditions considered
(RC-SC) evaluates the raw rainfall forecasted taking into consideration the respective effective rainfall
to be generated. For each location, a static flood-initiating runoff threshold (Thresh-R) value is defined.
In real-time, catchment states (e.g., SSM and channel storage) are continually updated taking into
consideration remotely sensed data. To consider such transient conditions, FF-generating rainfall
thresholds are also dynamically updated and then compared against QPF peak values (backward
comparison). The additional component, usually a hydrologic model, in the prediction chain used for
tracking the estimated surface parameters increases the overall complexity of such systems. At gauged
locations in which a reliable rating curve is available bank full water level values can be used as the
Thresh-R [27]. For ungauged sites, Thresh-R values can be estimated from the flow frequency analysis
of simulation datasets [28].
The flash flood guidance (FFG) is probably the most prominent framework of this approach. It was
adopted by river forecast centers in the US in the 1970s and has been recently implemented operationally
in different countries [6]. It is based on the recurrent estimation of the total raw precipitation needed to
occur during specific time intervals (usually 1, 3, and 6 h) to cause flood scenarios, and the rainfall-runoff
transformation is usually performed by a continuous hydrological model, be it spatially lumped flash
flood guidance (LFFG) or gridded flash flood guidance (GFFG) [29,30]. Regardless of the discretization
used to represent the terrain in the hydrological model, rainfall is finally represented as uniformly
distributed so that a single precipitation value can be used as a threshold. The uncertainty estimation
for these methods should account for both the rainfall data aggregation step [31] and the uncertainties
of the own input data used [32]. Recent efforts applied to enhance the representativeness of the
uncertainty associated to FFG values include the consideration of the spatial rainfall features defined
through statistical analysis [33] and the adoption of Bayesian probabilistic approaches to consider the
fact that the same amount of accumulated rainfall may or may not trigger floods [34].Water 2020, 12, 570 6 of 29
To simplify the operational forecasting chains, promising probabilistic approaches based on
Bayesian utility [35] and risk entropy [36] paradigms were presented. The probabilistic functions used
to dynamically update the critical rainfall values were fitted using extensive offline hydrological model
simulations assuming simplified antecedent SSM conditions.
2.4. Flow Comparison (FC)
Flow comparison (FC) approaches use QPF products as input to real-time running hydrological
models so that the simulated output surface flow (expressed as surface runoff or channel discharge) is
directly compared against static Thresh-R values (forward comparison). Such a direct comparison has
the advantage of also providing information related to the magnitude of the upcoming event.
To enhance communication among stakeholders, Thresh-R values are usually presented in terms
of the return period. Flow duration curves can be derived from grid-based statistical analysis of
multiple historical simulations [37,38] or from flow quantile regionalization of gauged data [39,40].
2.5. Performance Comparison and Multi-Approach Tools
The increasing number of proposed and implemented FF forecasting systems motivated recent
works based on comparative analysis to identify the most accurate approaches adopted. The critical
success index (CSI) is a common metric used for assessing the efficiency of an operational system on
detecting the occurrence of real FF events (hits) in studies developed over areas where a considerable
number of FFs are registered. CSI also takes into consideration the observed events that were not
detected (misses) and false alarms issued by:
hits
CSI = (1)
hits + misses + false alarms
in which a CSI value of 1.0 means a perfect performance, while a value of 0.0 means a total lack of skill.
A set of selected operational FFEWS is presented with their core features in Table 1. The results
summarized in Table 2 from recently published comparison works illustrate how the best criterion for
detecting FF scenarios depends on the target domain. Overall, the increase in complexity associated
with the transition from a RC to a FC approach is justified by a significant gain in performance for
systems covering large domains [38,41]. Such results motivate the inclusion of hydrological models
into forecasting chains of FFEWSs under implementation [42]. However, the same pattern was not
observed in studies developed over more restricted scopes [22,43]. One explanation can be that systems
covering large domains may include several catchments that, despite being small, are not urbanized
and present smooth relief. Such catchments are more prone to floods originated from the runoff
concentration downstream of the rainfall location and are better represented by hydrologic models
due to their capability to identify floods not occurring at the exact same location as the causative
rainfall cell. Specific-domain systems, on the other hand, are usually implemented to cover regions
known to be extremely “flashy”, be it due to the presence of urban areas and/or mountains, and
the almost instantaneous process of rainfall-runoff transformation significantly reduces the role of
hydrological models in the forecasting chain. However, most of the comparative works do not take
into consideration RC methods based on empirical and probabilistic approaches, despite their potential
to perform FF forecasts [36]. Besides the performance, another critical element to be considered is the
usual lead time for FF detection associated with each approach. As reported by Lincoln [44], despite the
potential for less accurately representing the actual reports of FFs, a RC-SN system using uncorrected
radar rainfall estimates as the input was considered more helpful for river forecast centers operators
than its FC-based counterpart fed with gauge-corrected quantitative precipitation estimations (QPE)
due to the fact that the update time of the former was much shorter than the latter, thus increasing the
response time of decision-makers for responsive actions.Water 2020, 12, 570 7 of 29
Table 1. Summary of selected reported operational FFEWS systems sorted by criteria.
Reference Criteria Method System Coverage QPE Source QPF Source Resolution Forecast Window
[20,21,45] RC-SN EPIC-EFAS 1 Continental Europe N/A NWP 2 6 h/7 km 5 days
[23,46] RC-SN ERICHA-EFAS Continental Europe N/A Radar extrapolation 15 min/1 km 6h
[47] RC-SC FFG-BSMEFFG 3 Multinational Middle East Satellite, radars CP-NWP 4 1 h/50 km2 6h
[48] RC-SC FFG-HDRFFGS 5 Haiti, Dominican Republic Satellite CP-NWP 3 1 h/70 km2 36 h
[38] FC ERIC-EFAS Continental Europe N/A 6 NWP 2 6 h/1 km 5 days
[37,49] FC DHM-TF-FFMP 7 Single large basin (US) Radar mosaic Radar extrapolation 1 h/4 km 1h
[39,40,50] FC AIGA 8 -Vigicrues Flash National (France) Radar mosaic N/A 15 min/1 km 6h
[51] FC Flood-PROOFS 9 Regional (Liguria, Italy) Satellite Stat. down. NWP 10 30 min/1 km 3 days
1 The European Precipitation Index based on Climatology (EPIC) was replaced operationally by the European Runoff Index based on Climatology (ERIC) in the context of the European
Flood Awareness System (EFAS). 2 Numerical weather prediction (NWP). 3 Black Sea and Middle East FFG system (BSMEFFG). 4 Convection-permitting NWP (CP-NWP). 5 Haiti and
Dominican Republic FFG (HDRFFGS). 6 Soil moisture of ERIC is updated daily with NWP estimations. 7 Distributed Hydrologic Model-Threshold Frequency (DHM-TF) in the context of
the Flash Flood Monitoring and Prediction (FFMP) program. 8 Geographic information adaptation for flood warning (in French: Adaptation d’Information géographique pourl’Alerte en
crue—AIGA). 9 Flood-PRObabilistic Operational Forecasting System (Flood-PROOFS). 10 Statistical downscaling of an NWP product.
Table 2. Summary of results from selected comparative works of systems based on different flash flood identification criteria.
Reference Criteria Description Best CSI * Resolution Coverage Conclusion/Highlights
RC-SN Empirical rainfall thresholds 0.29–0.45
Simple empirically-based thresholds presented the best
RC-SC Online model simulation 0.20–0.57 Three non-urban
[52] 30 min/Lumped performance for catchments with limited datasets.
RC-SC Bayesian utility function 0.14–0.56 catchments, Italy
Others outperformed depending on available data.
RS-SC Risk entropy function 0.14–0.68
RC-SC LFFG 0.19–0.34
Large monitored rural Clean overperformance of the FC approach when
[41] RC-SC GFFG 0.20–0.22 1 h/4 km
basin, US (70 stations) compared to RC-SC (FFG) methods.
FC DHM-TF 0.32–0.47
RC-SN EPIC 0.34
[38] 6 h/1 km Continental Europe The cost-benefit of the FC approach was positive.
FC ERIC 0.49
RC-SN ERICHA Mountainous periurban No significant differences found in performance between
[43] N/A 10 min/1 km
FC Flood-PROOFS region, Italy the two systems.
RC-SN Rainfall IDF curves Large poorly gauged Both approaches were efficient for FF forecasting, but FC
[22] N/A 10 min/1 km
FC Online model simulation periurban basin, Spain is also efficient for non-FF forecasts.
* CSI values are presented in ranges when studies considered multiple scenarios. The best CSI value is underlined.Water 2020, 12, 570 8 of 29
With that perspective, interactive toolsets were proposed and implemented operationally to
communicate multiple metrics concurrently on clear graphic user interfaces to support decision-makers
(e.g., Hydrometeorological Risks in Mediterranean and Mountainous Areas (in French: Risques
Hydrométéorologiques en Territoires Montagnards et Méditerranéens—RHYTMME) [53], Flooded
Locations and Simulated Hydrographs (FLASH) [54]).
3. Insights into Meteorological Contributors to Flash Floods
The problem of identifying and explaining meteorological contributing conditions to FFs causing
extreme precipitation has long been explored. Extensive analysis of overall synoptic and mesoscale
atmospheric patterns [9], together with the consolidation of observed and modeled datasets, motivated
the development of studies focused on quantitatively identifying effective antecedent FF atmospheric
descriptors to support decision-makers and response teams (the FFSA approach).
Despite overall agreement that descriptors associated to air moisture (e.g., RH, PW, Td ) and
atmospheric stability (e.g., K-index, CAPE) have the high predictive potential for extreme rainfall
events, and thus to pluvial FFs, there is still not a “silver bullet” combination of parameters that are
widely applicable. Rather, this seems to be a problem to which solutions are either scope-, resolution-
or data source-dependent. Recent works exploring observed rawinsonde data [55], atmospheric model
forecasts [56,57], and reanalysis [15,58] outputs reached different optimal sets of best descriptors.
These results make the use of techniques such as sensitivity analysis for feature selection (e.g., [56,57]),
which is almost a mandatory step for each activity related to FF forecasting due to the increasing volume
of data and candidates. However, metrics associated with PW, such as absolute [56], anomaly [55],
or spatial inhomogeneity [59] values, are consistently considered powerful predictors. These findings
highlight the importance of developing and enhancing methods to take into consideration such
meteorological factors into forecasting chains.
4. Remote Sensing Techniques
4.1. Precipitable Water (PW)
A monitoring approach of special interest for FF forecasting due to its short update time (around
15 min) is through the analysis of the travel time delays of communication signals from dense Global
Navigation Satellite System (GNSS) networks, such as the Global Positioning System (GPS).
This concept has long been explored [60] and has led to the implementation of near real-time
national monitoring systems by different countries, including the US, Germany, and China [61–63].
Those systems make use of their respective national networks to complement the existing international
positioning stations managed as part of the International GNSS Service. A remarkable active
research field targets the development of methods to integrate additional constellations of GNSS
satellites (e.g., GLONASS, BeiDou and Galileo) towards the improvement of data resolution and error
reduction [64,65]. However, it has to be clarified as to how the enhancements obtained from such
integration can be reflected as enhancements towards the early identification of local convective systems.
Recent lines of research explore the gains and prediction power of GPS-based PW monitoring
approaches for anticipating extreme precipitation through the proposal of threshold-based techniques
for issuing FF warnings [59,66] and through the use of trend analysis as a complement to radiosonde
observations [67]. Despite promising results that suggest that similar experiments should be developed
for further locations, there is a consensus that PW-related values alone are not sufficient to act as a
pluvial FF predictor [68].
4.2. Quantitative Precipitation Estimation (QPE)
Due to the high spatiotemporal variability of precipitation events usually associated with FFs,
several limitations emerge for the use of rain gauge data alone, mainly due to the low density of sensors
deployed at most of the sites [69]. In this context, the use of weather radar and satellite products haveWater 2020, 12, 570 9 of 29
been recognized for the purpose of performing FF forecasts due to their capability to describe rainfall
fields of large areas.
Recent years have witnessed the consolidation of weather radar networks with national coverage
in different countries [70–73]. Those systems are totally or partially based on C- or S-band with Doppler
and dual-polarization technologies, usually generating observation products with temporal resolution
in the order of 5 to 10 min and spatial discretization of 0.25 to 1 km. Many operational FFEWSs with
extensive coverage of ungauged basins rely on mosaic QPE products derived from those radar systems,
such as the multi-sensor precipitation estimate (MPE), the high-resolution precipitation estimator
(HPE) [74,75], and the precipitation composites from the Operational Program on the Exchange of
Weather Radar Information (OPERA) [73]. However, some studies [76,77] indicate that radar products
should present a temporal resolution of 1 min to be considered suitable for urban modeling. From that
perspective, the increasing popularization of X-Band weather stations, with resolutions of up to
0.1 km/1 min, appears as the most promising advance for urban FF forecasting in the context of
monitoring systems over the upcoming years [78–80]. Recently presented study cases have assessed the
accuracy and positive impact of using dual-polarized X-band radar data as complements to the regional
large scale networks, mainly for dense urban areas [81–83], despite the known issues associated with
the high noise and susceptibility to signal attenuation that demands careful attention.
Continuous research activities have been developed to estimate the propagation of weather
radar-originated uncertainties, which are considered high for both mountainous [84] and urban
environments [85], on the issuing of FF warnings [32,86]. The process of merging rain gauge and
radar data in real-time is a continuously researched topic, and the choice of the approach used
operationally may be influenced by multiple environmental factors, such as rain gauge density, rainfall
event features, proximity to the radar station and temporal resolution of the products [87], and by
the level of complexity of the techniques [88]. Methods proven to enhance radar data operationally
at the hourly or sub-hourly scales required for FF forecasting include mean field bias (MFB) [89],
kriging with external drift (KED) [90], and Bayesian combination (BAY) [91]. However, as suggested
by Ochoa-Rodriguez et al. [88], due to the ever-growing volume of heterogeneous available data,
the research field would benefit from more studies exploring data-driven methods and integration of
multi-source, multi-resolution datasets.
Satellite-based observations can also be considered valuable for near real-time QPE due to their
usual global coverage. Rainfall rate estimations based on passive microwave (PMW) data tend to be
more accurate than their infrared (IR) -based counterparts but are generated with longer latency [92] and
thus may provide limited support for FF forecasting. With the continuous increase of data-availability,
multi-sourced products have emerged and been improved. The Global Hydro-Estimator (GHE) from
the National Oceanic and Atmospheric Administration (NOAA) is an example of a multi-constellation,
IR-based operational QPE product with 15–20 min latency time and spatial resolution in the order
of 4 km [93]. It is used as the input for the FFG systems installed on poorly monitored countries [6].
The deployment of new satellites equipped with sensors capable to detect a wider range of IR
spectral bands, such as the undergoing replacement of the Geostationary Operational Environmental
Satellites (GOES) by GOES-R series, have the potential to increase the spatial discretization of the
precipitation products by up to 2 km [94]. The precipitation estimation from remotely sensed
information using artificial neural networks with a cloud classification system (PERSIANN-CCS)
algorithm uses a multilayer feed-forward neural network to generate QPE from IR data [95]. It was
recently implemented operationally, producing rainfall products with 1 h/0.04◦ (~4 km) resolution and
1 h latency using PMW calibrations [96]. Despite evidencing the potential for using neural network
systems towards the generation of QPE products, recent evaluation works found that such products
can contain considerable underestimation of precipitation estimates and suggestion caution on their
current applicability for FF forecasting [97,98].Water 2020, 12, 570 10 of 29
4.3. Surface Soil Moisture (SSM)
When SSM is estimated taking into consideration precipitation as the sole water input,
the neglection of other potentially relevant processes such as irrigation may result in a decreased
performance of FF forecasting systems [99] into forecasting chains. This motivated the search for
approaches to assimilate SSM observations [100] and to assess their gains [101] towards runoff
predictions. Non-urban headwater catchments, where SSM plays a most significant role in the
generation of surface runoff, are usually insufficiently equipped with in situ soil monitoring equipment
capable of the needed real-time transmission. An alternative is the use of satellite data, which usually
have global coverage of the top layers of soil (up to 10 cm depth) and are made freely available by their
respective spatial agencies. Passive microwave-based remote sensing products have been developed
and assessed during the last decades with a proper agreement with local observations [102].
The last decade witnessed the launching of a considerable number of new satellite missions
capable of performing near-surface soil moisture measurements (e.g., Soil Moisture Ocean Salinity
(SMOS), Soil Moisture Active Passive (SMAP), Sentinel-1). Most of the currently active products
from independent satellite constellations are provided either with coarse spatial resolutions and short
revisiting time (in the order of 10 km/1 day) [103–105] or the opposite (e.g., 500 m/12-days [106]),
depending on the swath width of the respective sensor. For FF forecasting systems based on
hydrologic models, a shorter update time was found to play a more relevant role than finer
spatial discretization [107]; however, daily updates can still be considered a significant operational
constraint [101,108]. In this perspective, products based on the data blending of multiple satellites
missions, such as the Soil Moisture Operational Product System (SMOPS) [109], offer interesting
opportunities to improve the accuracy of FF forecasts, with their potential to provide sub-daily
resolution data, and their applicability for such purpose deserves to be assessed.
4.4. Drainage Network Monitoring and Controlling Systems
The data assimilation of the flow discharge observed in monitored drainage networks has the
potential of reducing the uncertainties of FF forecasting systems [110,111]. Due to the potential to
transport damaging objects at high velocity during extreme events, the use of non-intrusive ultrasonic
or radar sensors is preferred for flash flood-prone streams over their submersible counterparts [112].
Traditionally, only the higher magnitude channels are gauged by official agencies due to the high costs
associated with the acquisition and maintenance of precise equipment. Such sparse observations may
not provide valuable information for small-sized neighborhoods not served by a central discharge link
or for headwaters catchments prone to FFs.
Recent technological advances have led to the development of low-cost electronic systems capable
of transmitting significant volumes of information through the internet making use of now widely
available Wi-Fi connections, which made the deployment of several flow monitoring sensors more
feasible even for channels of lower magnitude. In this perspective, the emerging concept of the
Internet of Things (IoT) can be seen as an alternative to traditional supervisory control and data
acquisition (SCADA) systems due to the fact that representatives of the latter tend to be isolated
platforms characterized by lower levels of interoperability and scalability, while the former usually
makes use of the expanding wireless availability and open communication protocols to achieve higher
levels of flexibility. The IoT has been explored for the proposal and development of integrated systems
capable of supporting multiple flood-related sensed data sources, with case studies presented mainly
in the context of urban floods [113–115], some of them with the potential of performing autonomous
decisions towards the optimization of flood-mitigating structures [115,116] in real-time.
The increased popularization of densely monitored drainage networks can thus enhance the
efficiency of FF forecasting systems through the early identification of channels in overbank conditions
and of sewer systems operating above their capacity, but the migration of currently implemented
prototypes to effectively operational systems is yet to be assessed.Water 2020, 12, 570 11 of 29
Water 2020, 12, x FOR PEER REVIEW 12 of 30
5. Precipitation Modeling and Prediction
5. Precipitation Modeling and Prediction
In most cases, QPF products are the main inputs for FF forecasting chains. Methods for obtaining
In most cases, QPF products are the main inputs for FF forecasting chains. Methods for obtaining
products with the high resolution required for FF forecasting are usually based on the downscaling
products with the high resolution required for FF forecasting are usually based on the downscaling
of coarser numerical weather prediction (NWP) models outputs, on the temporal extrapolation of
of coarser numerical weather prediction (NWP) models outputs, on the temporal extrapolation of
distributed remote sense observations (Figure 3), or on the integration of both approaches.
distributed remote sense observations (Figure 3), or on the integration of both approaches.
Figure
Figure 3. 3.Schematic
Schematicrepresentation
representation of
of downscaling
downscaling (D)
(D)and
anddata
dataextrapolation
extrapolation(E) processes
(E) to to
processes obtain
obtain
high-resolution precipitation products. The “Added Information” can be either sub-grid
high-resolution precipitation products. The “Added Information” can be either sub-grid physics physics or or
statistical relationships.
statistical relationships.
5.1.5.1. DynamicalDownscaling
Dynamical Downscaling
TheThe first
first operational
operational meteorological
meteorological systems
systems werewere limited
limited to simulate
to simulate synoptic-scale
synoptic-scale flows
flows through
through hydrostatic
hydrostatic primitive equations,
primitive equations, in which convective
in which sub-grid sub-grid convective
phenomenaphenomena are represented
are represented indirectly
indirectly
using using
specific sets specific sets of parameters.
of parameters. Recentofincreases
Recent increases of overall computational
overall computational power, data power, data
availability,
availability, and understanding of physical atmospheric processes allowed the
and understanding of physical atmospheric processes allowed the consolidation of the so-called consolidation of the
so-called convection-permitting NWP (CP-NWP) models, which are based
convection-permitting NWP (CP-NWP) models, which are based on hydrodynamic processes with a on hydrodynamic
processes with a spatial resolution of approximately 4 km or higher, enabling the explicit
spatial resolution of approximately 4 km or higher, enabling the explicit representation of mesoscale
representation of mesoscale events and local convection [117–120]. An illustrative selection of
events and local convection [117–120]. An illustrative selection of currently CP-NWP models in
currently CP-NWP models in operation is summarized in Table 3.
operation is summarized in Table 3.
With the experience gained with operational CP-NWP systems, multiple works were developed
With the experience gained with operational CP-NWP systems, multiple works were developed
to assess their advantages. It has been observed that, despite increasing the overall performance when
to assess their advantages. It has been observed that, despite increasing the overall performance when
compared to their background model products, some considerations need to be taken and addressed:
compared to their
(1) The finer background
spatial model products,
scale of CP-NWP some in
models results considerations need toatbethe
higher uncertainties taken and addressed:
grid-scale due to
(1)spatial
The finer spatial scale of CP-NWP models results in higher uncertainties
noise, which demands the use of ensemble systems and assessment procedures that at the grid-scale
go beyond due
to the
spatial noise, which
pixel-to-pixel demands
comparison the use (2)
[121,122]; of ensemble systems tend
CP-NWP products and assessment procedures
to be positively that go
biased when
beyond the pixel-to-pixel comparison [121,122]; (2) CP-NWP products tend
compared to products from synoptic-scale models, overestimating the magnitude of extreme to be positively biased
when compared to products from synoptic-scale models, overestimating the magnitude
precipitation events [123–125], thus demanding data assimilation procedures; and (3) large-scale of extreme
precipitation eventsmay
convective events [123–125],
be betterthus demanding
represented data assimilation
by synoptic-scale modelsprocedures;
than by CP-NWP and (3) large-scale
[124].
convective events may be better represented by synoptic-scale models than by CP-NWP [124].Water 2020, 12, 570 12 of 29
The potential of overestimating extreme rainfall events was, unsurprisingly, reflected as an increase
in false alarms when the products of those models were applied to FF forecasting without intermediate
processing [126,127], which reasserts the need of bias correcting these products when hydrologic models
are involved in the FFEWS (RC-RC or FC approaches). Due to the complex physical basis of these
methods, uncertainties are usually expected to be quantified by ensemble products [128]. However,
the high computational cost demanded by the higher resolution models leads to a usually reduced
number of realizations being available. The work developed by Corazza et al. [129] illustrates how the
Poor Man’s Ensemble (PME) approach can be used to address this issue by considering ensembles
composed by deterministic products originated from multiple agencies and models. The authors
obtained estimated probabilities that were well correlated to observations, but a certain level of
underestimation detected was associated with the fact that members of both hydrostatic and CP-NWP
models were included in the ensemble. The assessment of applying the PME approach using only
CP-NWP model products is promising and yet to be developed.
Table 3. Selected CP-NWP operational quantitative precipitation forecast (QPF) products sorted by
spatial resolution.
Reference Model (Product) Agency Coverage Resolution Update Cycle
[117] WRF (HRRR) NOAA US 1 h/3 km 1h
[118] AROME (France) Météo, France France 1 h/1.3 km 1h
[120] COSMO (DE) DWD 1 Germany 15 min/2.8 km 3h
[119] HRDPS MSC 2 Canada 1 h/2.5 km 1h
[48] WRF CIMH 3 Hispaniola 1 h/4 km 6h
[130] ALARO (Turkey) MGM 4 Turkey 1 h/4.5 km 6h
1German Weather Service (DWD); 2 Meteorological Services of Canada (MSC); 3 Caribbean Institute for Meteorology
and Hydrology (CIMH; 4 Turkish State Meteorological Service (MGM).
5.2. Statistical Downscaling
One of the main advantages of using a statistical downscaling approach is the extremely
low computational cost at the operational time when compared to dynamical downscaling.
Statistical downscaling approaches are based on performing regression analysis between coinciding
NWP-generated aerial estimations and gauge point observations. Methods successfully explored for
obtaining precipitation time series with hourly temporal resolution include filtered autoregression [131],
neural networks [132], and adaptable random forests [133].
Due to their statistical nature, the outputs obtained from such methods are usually directly
associated with the estimation of uncertainty of physically-based models [134,135]. Flood-PRObabilistic
Operational Forecasting System (Flood-PROOFS) [51] is an example of a flood forecast system that
includes the downscaling model RainFARM (acronym for Rainfall Filtered Autoregressive Model)to
obtain ensemble QPF of 30 min/1 km resolution from a deterministic NWP model of 7 km/3 h.
The estimated uncertainties were shown to acceptably represent the errors associated with the original
QPE product and illustrate the potential gains of applying statistical downscaling approaches to
perform FF forecasts. However, a remarkable drawback is the recurrent need for performing statistical
reanalysis every time a component of the source large-scale NWP system is changed, which limits their
adoption on operational forecasting chains.
5.3. Distributed Remote Sense Data Extrapolation
Extrapolating weather radar observations of precipitation in time is similar to the computer-vision
problem of predicting the next frames of a recorded video. It can be performed by extrapolating the
reflectivity values observed, which has output values that later need to be converted into precipitation
(radar echo extrapolation (REE)) or by directly producing QPF as output values out of the observed
reflectivity, thus implicitly embedding the so-called Z–R relationship.Water 2020, 12, 570 13 of 29
Motion tracking functions based on optical flow techniques have long been explored for REE.
Examples of operating systems include the use of variational echo tracking [136,137] and combinations
of the traditional Horn and Schunck approach with the Lucas–Kanade method [138].
The consolidation of extensive weather radar datasets allowed the development of data-driven
techniques based on analog-based approaches, with promising results being obtained for locations
with high orographic influence in the formation of precipitation [7,139]. Methods based on deep
learning, mainly exploring the capabilities of convolutional neural networks (CNNs), have started
to be explored in the last 5 years [140] and were proposed as benchmarks for precipitation nowcast
methods [141]. The integration of long short-term memory (LSTM) neural network approaches with
the satellite-based precipitation estimation algorithm PERSIANN-CCS was also shown to outperform
optical flow-based and NWP models, mainly for capturing the patterns of convective precipitation
systems [8]. However, as this is a still-emerging field, some relatively basic issues associated with the
implementation of deep learning algorithms for the task of frame prediction, such as which assessment
metric is the best to be used [142], are still under discussion in the community.
5.4. Multi-Model
The assessment that data extrapolation methods tend to overperform NWP models for lead times
of up to 2 or 3 h (and that NWP models are more reliable for longer horizons) [143,144] motivated the
exploration techniques for integrating both types of precipitation prediction products.
In the United Kingdom (UK), a dual-system approach has been adopted. By default,
the stratiform-focused Nimrod [145], based on Lagrangian persistence extrapolation of radar data,
is continuously executed and evaluated. When convective patterns are identified, the Generating
Advanced Nowcasts for Deployment in Operational Land-based Flood forecasts (GANDOLF) [146]
system, which is based on object tracking considering NWM estimated advection, is activated. Such a
strategy is justified by the best individual scenario-specific performances of each model [147,148].
Recently proposed approaches with an operational adoption include Integrated Nowcasting
through Comprehensive Analysis (INCA) [149–151], in which the weighting between two deterministic
nowcast/forecast models is constant and dependent on the lead time. In INCA, only radar extrapolation
is considered from 0 to 2 h lead time; from 3 to 6 h, both the radar extrapolation and the NWP-based
products are considered, with linearly increasing of importance (weighting) of the latter with respect
to the former; for 7 h onwards, only the NWP-based product is considered.
The Short-Term Ensemble Prediction System (STEPS) [152] is a probabilistic blending approach,
in which uncertainties from multiple scales and sources are considered in a fractal cascade for the
generation of a dynamically weighted ensemble product. The uncertainty level of each component is
calculated taking into consideration the climatological analysis of the forecasted value. The method
was adopted operationally in the UK and Australia in 2008 [153] and was successfully assessed for
urban hydrology [154,155].
Works exploring new blending techniques are undergoing, with the proposition of approaches
based on volume-correction [156] and harmony search adaptive weighting [157], for example. However,
the applicability of such methods for operational FF forecasting systems requires further assessment.
6. Hydrologic-Hydraulic Modeling and Forecasting
6.1. Runoff Simulation
Mostly for non-urban, ungauged and/or data-scarce catchments, lumped models were the first
to be explored and adopted operationally due to their simplicity, low level of data requirement and
computational demand. Sacramento soil moisture accounting (SAC-SMA), for example, was widely
used in the early versions of FFG systems in the US and is still used as part of large-domain systems
with online simulations [48,54].Water 2020, 12, 570 14 of 29
In the last decade, distributed rainfall-runoff and routing models were adopted operationally.
Multiple river forecasting centers in the US replaced their SAC-SMA-based models with Hydrology
Laboratory Research Distributed Hydrologic Model (HL-RDHM)-based counterparts. In Europe,
the LISFLOOD model is used in the operational FC-based approach ERIC, which is adopted as
part of EFAS [158]. Those systems operate on spatial scales in the order of 1 km to match the QPE
and QPF forcings involved in the forecasting chains. However, the high number of parameters
demanded by a physically-based approach may become a constraint due to the need for extensive,
often unavailable, descriptive datasets or challenging calibration procedures that may result in
high levels of uncertainty [159]. HL-RDHM, for example, is reported to require the calibration of
15 parameters per grid cell [160].
New models have been proposed using more hybrid conceptual-physical-based approaches
to obtain more parsimonious representations of the hydrological processes. Such models intensely
rely on topographic features to reduce the number of parameters used to describe the runoff and
routing processes [161] and have shown to be also suitable for sub-kilometer simulations of flash flood
events [162]. Operationally applied examples include the Continuum [163] and the Coupled Routing
and Excess Storage (CREST) [164] models, part of the Flood-PROOFS [43] and FLASH [54] systems
that require the calibration of 6 and 10 parameters per grid cell, respectively.
Arid and semi-arid regions are characterized by having more dynamic rainfall-runoff responses
due to the lack of vegetation coverage and organic matter, which makes the runoff generation more
dependent on the varying SSM conditions. In such regions, data assimilation of SSM can be particularly
beneficial when compared to humid environments [165]. The performance of the recently presented
hybrid conceptual-physical models over these specific conditions of parameter variability is yet to
be assessed.
In urban areas, floods are usually initiated when the drainage systems operate above their capacity.
Hydrological models can be coupled with hydraulic models so that the runoff estimated as the output
by the former is used as the input flow by the latter [166]. The Storm Water Management Model
(SWMM) [167], MIKE URBAN [168] and Infoworks CS are examples of established frameworks with
one-dimensional (1D) components for representing hydraulic systems such as sewer networks and
the presence of low-impact-development (LID) structures. The use of 1D drainage models alone
are considered not suitable for representing the overflow phenomenon, but they can be used to
estimate the locations of their occurrence through the identification of manholes in the overflow state,
for example [169].
Hydraulic sewer models can operate at spatiotemporal resolutions in the order of centimeters/
sub-minutes, which results in the need for high data availability and computational resources for online
simulations. Few locations have proper and available documentation of the installed sub-surface
drainage systems for an accurate model development, and the use of synthetic sewer networks derived
from digital elevation models (DEMs) and structural analysis have been proposed [170] and were able
to acceptably estimate the location of the underground pipes, but proper dimensioning of the diameters
of the conduits is still a challenging question that may limit the applicability of such approaches for
modeling extreme precipitation events [171].
Regardless of the purpose, the quantification of uncertainty associated with the model output
is exceptionally being valued, which is usually achieved through the use of ensemble forecasting
chains. In the context of FF forecasting, attention has been given to assess the uncertainty related
to the use of precipitation nowcasts [172,173] and to scenario-specific error patterns associated with
seasonality [174].
Due to the assumption that floods happen after water accumulates in the serving drainage
channel, channel discharge flow modeling may not properly represent complex scenarios in which local
surface ponding is observed, and flooding conditions are not necessarily associated with a channel state.
Additionally, the absence of associated inundation mapping data of systems based on flow-communication
only may limit the responsive steps that succeed in the forecasting phase of FFEWSs.You can also read