Methodological Approaches to Study Extracellular Vesicle miRNAs in Epstein-Barr Virus-Associated Cancers - MDPI
←
→
Page content transcription
If your browser does not render page correctly, please read the page content below
International Journal of
           Molecular Sciences

Review
Methodological Approaches to Study Extracellular
Vesicle miRNAs in Epstein–Barr
Virus-Associated Cancers
Li Sun and David G. Meckes, Jr. *
 Department of Biomedical Sciences, Florida State University College of Medicine, Tallahassee, FL 32306, USA;
 li.sun@med.fsu.edu
 * Correspondence: david.meckes@med.fsu.edu; Tel.: +1-850-645-2330

 Received: 22 August 2018; Accepted: 14 September 2018; Published: 18 September 2018

 Abstract: Epstein Barr-virus (EBV) was the first virus identified to be associated with human cancer
 in 1964 and is found ubiquitously throughout the world’s population. It is now established that
 EBV contributes to the development and progression of multiple human cancers of both lymphoid
 and epithelial cell origins. EBV encoded miRNAs play an important role in tumor proliferation,
 angiogenesis, immune escape, tissue invasion, and metastasis. Recently, EBV miRNAs have been
 found to be released from infected cancer cells in extracellular vesicles (EVs) and regulate gene
 expression in neighboring uninfected cells present in the tumor microenvironment and possibly at
 distal sites. As EVs are abundant in many biological fluids, the viral and cellular miRNAs present
 within EBV-modified EVs may serve as noninvasion markers for cancer diagnosis and prognosis.
 In this review, we discuss recent advances in EV isolation and miRNA detection, and provide
 a complete workflow for EV purification from plasma and deep-sequencing for biomarker discovery.

 Keywords: exosomes; oncosomes; microvesicles; microRNA; extracellular vesicle; herpesvirus

1. Introduction
      MicroRNAs (miRNAs) are small noncoding RNAs with a length of 20 to 25 nucleic acid base-pairs.
miRNAs are key regulators of gene expression mainly through mRNA degradation or translation
inhibition. In addition to the profound effects of miRNAs within cells, miRNAs are also released into the
extracellular space in complex with proteins or encased within extracellular vesicles (EVs) [1]. EVs are
a diverse collection of membrane-bound sacs that typically range in size from 40 to 500 nm and are further
classified based on the site of subcellular formation [2]. Exosomes are small EVs ranging in size from 30 to
150 nm in size that are produced at internal, endosomal-derived membranes of the multivesicular bodies.
Microvesicles are generally larger EVs greater than 100 nm in size and formed following budding and
fusion events at the plasma membrane [3]. With current methods and technology, it is nearly impossible
to separate the two types, as the vesicle populations have overlapping sizes, densities, and contain similar
markers [4]. For this reason, we will use the term EVs when describing results presented throughout the
literature. One of the most important biological properties of EVs regardless of the subcellular origin is
their ability to transfer specific profiles of proteins, lipids, RNAs, and even DNA fragments between cells
to mediate intracellular communication events [1,5,6].
      Cell-to-cell communication within the tumor microenvironment plays a critical role in
cancer development and progression. Cancer cells must communicate with surrounding cells in
order to proliferate, induce angiogenesis, evade the immune system, invade surrounding tissue,
and metastasize to other sites in the body [7]. Many of these processes are regulated by miRNAs
within cancer cells [8–12]. Moreover, miRNAs are also released from primary tumor tissues into the

Int. J. Mol. Sci. 2018, 19, 2810; doi:10.3390/ijms19092810                         www.mdpi.com/journal/ijms
Int. J. Mol. Sci. 2018, 19, 2810 2 of 26
bloodstream and can be found in a wide variety of biological fluids [13]. Thus, miRNAs represent
a new class of circulating cancer biomarkers that participate in EV communication events [14–16]. It is
clear from many studies that miRNAs have specialized functions and play important roles in inter-
and intracellular signaling [17,18]. Therefore, the study of miRNAs in cancer is likely to shed light
on the mechanisms driving cancer progression and result in novel biomarkers for disease. In general,
the correlation between miRNAs and a specific type of cancer is based on the up- or down-regulation
of miRNA and miRNA expression patterns. For example, one of the most studied miRNAs, miR-21,
is found in human serum samples from patients with different solid tumors (breast, colon, and lung)
and promotes tumor growth [11,19].
Traditionally, cancer detection and diagnosis are obtained following a conventional tissue biopsy,
which involves the removal of small portion of tissues from the primary tumor growth site via
a surgical resection followed by histopathological examination and cancer staging. In some cancers,
specific tissue biomarkers have been described that may result in earlier diagnosis, staging, and patient
survivability. Compared with conventional diagnostic methods, the use of EVs as biomarkers has
several advantages. First, EVs are abundant in nearly every biological fluid analyzed. For example,
there are more than 1012 EVs in 1 mL of blood compared to fewer than 10 circulating tumor cells
(CTCs) [20–22]. Second, EVs contain specific molecular profiles representing the cell of origin and
have been found to participate in many aspects of cancer development and progression [23–27].
Also, a recent paper demonstrating that the miRNA profiles are similar in plasma and EVs for healthy
samples, but significantly higher in EVs than plasma from lung cancer patients [28]. These data provide
evidence that EVs are enriched in tumor biomarkers. Third, miRNAs and other molecules are well
protected by a lipid membrane and more stable under RNase treatment or other storage conditions [29].
These properties make the detection results more reliable. EVs have become one of the ideal candidates
for non- or minimally-invasive liquid biopsies for multiple human disease states.
2. EBV miRNAs in EBV-Associated Cancers
Epstein–Barr virus (EBV) was the first virus identified to be associated with human cancer. In 1964,
Epstein and colleagues discovered a virus in suspended cultured African Burkitt’s lymphoma (BL)
cells using electron microscopy [30]. EBV produces a latent and persistent infection within circulating
lymphocytes and is found ubiquitously throughout the world’s population [31,32]. Although most
infections remain benign and asymptomatic, EBV is also associated with multiple human cancers
of both lymphoid and epithelial cell origins, including lymphomas (BL, Hodgkin’s lymphoma
(HL), and post-transplant) and carcinomas (gastric and nasopharyngeal) [31]. The prognosis and
survivability of human cancers caused by EBV and other DNA viruses that encode miRNAs may
greatly benefit for the development of EV-based diagnostic platforms.
According to the Sanger miRBase (Release: 22 March 2018), a total of 25 EBV miRNA precursors
with 44 mature miRNAs are mapped to the Bam HI fragment H rightward open reading frame 1
(BHRF1, four miRNAs) and Bam HI A rightward transcripts (BART, 40 miRNAs) regions of the EBV
genome [33]. The BHRF1 cluster is from a transcript that encodes the BHRF1 protein. However,
the BART miRNAs are transcribed from a large transcript (about 22 kb) which has two alternative
promoters [34]. An early paper reported only two BART miRNAs because the B95.8 strain of EBV
has an 11 kb deletion in the BART transcript [35]. The missing region includes all of BART cluster 2
(13 miRNAs) and part of cluster 1 (four miRNAs). Therefore, it is evident that the BART miRNAs in
the deleted region are not required for EBV immortalization of resting B cells in vitro.
EBV encoded miRNAs have been implicated in regulating both viral and host targets for inhibiting
apoptosis, promoting cell growth, and controlling latent EBV infection [36–46]. Using ∆miR EBV
strains, Tagawa et al. found secretion of IL-12 from infected B cell is significantly increased compared
with wt/B95-8 virus [47]. Further experiments show that EBV BART1, BART2, and BHRF1-2 target
the IL12B gene to prevent Th1 differentiation of naive CD4+ T cells. Moreover, these viral miRNAs
could also affect antigen presenting processes by targeting molecular MHC I/II, lysosomal enzymes,Int. J. Mol. Sci. 2018, 19, 2810 3 of 26
and the transport protein TAP1/2 of antigenic peptides into the ER lumen [47,48]. Viral proteins like
EBNA1 [48] and latent membrane proteins like LMP1 [40] or LMP2A [42] could also be downregulated
by EBV miRNAs to escape immune surveillance and maintain persistent infection. BART2 was found
to bind to the 30 UTR of EBV DNA polymerase BALF5, which could maintain EBV latency [35,41].
Additional evidence supports the hypothesis that EBV miRNAs help infected cells to survive by
inhibiting apoptosis and increasing cell cycle progression and proliferation [36,49–51].
2.1. Nasopharyngeal Carcinoma (NPC)
Analysis of EBV positive cell lines and clinical NPC tissues revealed that only lytic infection or cells
with type III latency expression profiles express BHRF miRNAs. Four independent research groups
showed that no miRNAs are expressed from BHRF1 cluster in NPC samples, which is consistent with
a type II latency expression profile [33,38,52,53]. However, all other EBV-infected cell lines with other
latency patterns have a detectable level of all BART cluster miRNAs [52,54]. Among these expressed
miRNAs, BART7 always shows the highest expression level regardless of cell or latency type [54].
Two different groups have used deep sequencing technology to characterize the EBV miRNA
transcriptome in NPC tissues [33,53]. Zhu et al. found EBV miRNAs make-up 3.8% and 18.2%
of total miRNAs in NPC tissues [53]. Chen et al. identified all 44 EBV BART miRNAs, including
four new mature miRNAs derived from previously identified BART miRNA precursor hairpins [33].
About 23.2% of the total miRNAs were EBV miRNAs in their samples. Several EBV miRNAs were
expressed, some at levels similar to highly abundant human miRNAs.
The main challenge in the successful treatment of nasopharyngeal carcinoma is the difficulty of
early detection and accurate prognosis of the disease. A large proportion of NPC patients (∼70%)
are diagnosed at later stages of the disease [55–57]. Once metastasis occurs, the disease progresses
rapidly with poor clinical outcomes. This is partly a result of inadequate understanding of molecular
and cellular pathogenesis of NPC. In addition, we lack biomarkers for effective early diagnosis and
patients exhibit a modest response to current therapies. The expression profiles of miRNAs in the
circulation may represent a reliable biomarker for NPC diagnostic and prognostic purposes. Moreover,
miRNAs have even shown therapeutic potentials in some kind of cancers [58–60].
EBV miRNAs have been proposed to serve as diagnostic markers in patients with NPC [61],
for the level of serum miRNAs is positively correlated with the copy numbers of host miRNAs in
tumor biopsies [38,62]. For example, Liu et al. reported five plasma miRNAs that in combination
(upregulation of miR-16, miR-21, miR-24, and miR-155 and downregulation of miR-378) could be used
as a diagnostic standard for NPC, providing 87.7% sensitivity and 82.0% specificity [63].
In addition to NPC, other cancers caused by EBV would benefit from the ability to be quickly
diagnosed from a minimally invasive procedure. Below details what is currently known about the
viral miRNA expression patterns in other EBV-associated cancers.
2.2. Diffuse Large B-Cell Lymphoma (DLBCL) and Natural Killer/T-Cell Lymphoma (NKTL)
Imig and colleagues compared EBV-positive versus EBV-negative DLBCL clinical samples by
deep-sequencing to profile miRNAs expressed by EBV and host cells [64]. The virus-encoded miRNAs
represented approximately 2% of the overall miRNA count and all known EBV miRNAs with the
exception of the BHRF1 cluster as well as BART15 and BART20 were present. The highest expression
was found for BART7, BART22, and BART10. A similar approach was used later on NKTL samples [65]
by the same group. All BART miRNAs were detected and about 2.2% total miRNAs were from EBV.
2.3. BL and Lymphoblastoid Cells (LCL)
Many studies have described EBV miRNAs expression profile in lymphocytes using EBV-infected
cell lines. In 2004, Pfeffer et al. [35] found five EBV encoded miRNAs in B95.8-transformed cells.
Later in 2006, Cai et al. found BHRF miRNAs express only in latency III, but BART miRNAs are
expressed at high levels in latently infected epithelial cells and at lower levels in B cells [66]. At theInt. J. Mol. Sci. 2018, 19, 2810 4 of 26
same time in 2006, 18 miRNAs were first predicted by computational method and then confirmed by
microarray [67].
2.4. Gastric Carcinoma (GC)
BART1, 3, 5, 7, 10, and 12 were detected by northern blot analyses in an EBV-infected gastric
cancer cell line and animal model sample of the disease [44]. Marquitz et al. demonstrated that
an EBV-infected GC cell line shows limited viral protein expression, whereas BART miRNAs are
abundantly expressed and produced transformed phenotypes when compared to noninfected GC
cells [68]. The first comprehensive study of all 44 EBV miRNAs in GC clinical samples was finished
by Aya Shinozaki-Ushiku et al. on 2015 [69]. As seen in NPC and other EBV related cancer samples,
BART7 shows the highest expression level [54,64]. They also proved that BART4-5p inhibit apoptosis
by downregulating Bid protein. Another systemic profiling of EBV miRNAs expressed in GC patients
was done by Tsai and colleagues in 2017 [70]. The most abundant EBV miRNAs of GC were BART4,
followed by BART11, BART2, BART6, BART9, and BART18. Kim et al. isolated and characterized a new
EBV-infected GC cell line (YCCEL1) that was established from a Korean patient with EBV-associated
GC [71]. YCCEL1 cells expressed BART miRNAs at high level but did not express BHRF1 miRNAs,
which is consistent with other data from GC samples and cell lines.
2.5. Comprehensive Studies
Two comprehensive studies comparing EBV miRNA expression profiles in distinct cell lines were
published in 2011 [72,73]. Qiu et al. compared a variety of EBV related tumor and neoplasias by using
clinical biopsies, primary cell, and established cell lines [72]. They found that miRNAs have distinct
expression levels in EBV-related epithelial cancers when compared with lymphoid malignancies. Their data
also provides evidence that there are specific expression patterns of viral miRNAs for each latency program.
BHRF1 cluster miRNAs are only expressed in latency III but not in type I and type II latency. These patterns
are disrupted in EBV associated tumors, implicating EBV miRNAs in viral persistence and oncogenesis.
EBV miRNA expression patterns could be used to distinguish EBV tumor types, but there was no subset of
miRNAs that was uniquely responsible for discriminating the types of tumors.
Another study by Amoroso et al. also used a massive collection of EBV-infected cell lines with
different latency types and tumor origins to study miRNAs expression profiling [73]. During the
latency phase, BART miRNAs could be detected in all forms of infection but expression level of
different miRNAs may vary up to 50-fold. BHRF1 miRNAs were only seen in cells with detectable Cp-
and/or Wp initiated EBNA transcripts. When entering into lytic phase, BHRF1-2 and BHRF1-3 were
expressed within BHRF transcripts while BART miRNAs level remains stable.
Taken together, the EBV miRNA expression profiles are complex and tumor- and latency-type
specific. EBV encoded miRNAs expression in the various cancers are summarized in Table 1.
Table 1. EBV encoded miRNA expression in associated cancers.
Tumor Latency BHRF1 BART BART
Sample BART-2 Method Ref.
Type Type Cluster Cluster 1 Cluster 2
MUTUI/
I/ −/
OUS/
II/ +/ 1 + Northern blot [35]
BL41/95, Marm.
III +
B95.8
BC-1/
I/ −/ 1, 3, 5/ 7, 10, 12/
Jijoye/
III/ 1-2/ 1, 3, 5/ 7, 10, 12/
BL Raji/
III/ 1-1, 1-2/ −/ −/ Northern blot [66]
BL41/95/
III/ 1-1, 1-2/ 1, 3/ −/
MUTU III,
III 1-1, 1-2/ 1, 3, 5/ 7, 10, 12/
Namalwa
7, 8, 9, 10,
3, 4, 5, 6, Northern blot,
Jijoye III 11, 12, 13, [67]
15, 17 microarray
14, 19, 20Int. J. Mol. Sci. 2018, 19, 2810 5 of 26
Table 1. Cont.
Tumor Latency BHRF1 BART BART
Sample BART-2 Method Ref.
Type Type Cluster Cluster 1 Cluster 2
BL-5, Savl, KemI,
Akata, Dante,
I/ −/ 3, 4, 1-5p, 7, 10, 12,
Daudi/ qPCR [54]
III + 15 20-5p
OkuI, GG68,
Raji, MutuIII
BL 2A8.1, RaeI + qPCR [52]
B95.8-transformed
I/ 15/ −/
cells/
I/ 15, 16/ 22/ qPCR [33]
Daudi/
III 16 22
Namalwa B
HL RPMI6666 II + 1 + Northern blot [35]
3, 4, 1-5p, 7, 10, 12,
C666-1 II − qPCR [54]
15 20-5p
C666 II − 1, 3, 5 7, 10, 12 Northern blot [66]
1-1, 1-2,
C666-1 II + + + qPCR [52]
1-3
C666-1 II + + + qPCR [70]
C-15 − 1, 3, 5 7, 10, 12 Northern blot [66]
NPC clinical tissue;
1-3p, 5, 7, 8, 9,
C666; Microarray,
6-5p, 14,18-5p, + [38]
NP460hTERT + qPCR
6-3p,17-5p 19-3p
EBV
clinical tissue/
+/ +/ qPCR, Deep
HK1-EBV, − + [33]
15, 16 22 sequencing
C666-1
qPCR, Deep
clinical tissue − + + + [52]
sequencing
Northern blot,
clinical tissue − + + Deep [53]
sequencing
3, 4, 1-5p, 7, 10, 12,
SNU-719 I − qPCR [54]
15 20-5p
SNU-719 I − + + + qPCR [69]
3, 1-3p, 5,
AGS-EBV I 7, 9 qPCR [68]
17-5p
clinical tissue,
+ + + qPCR [70]
SNU-719
GC clinical tissue − + + + qPCR [69]
9-3p,
5-5p,
1-3p, Northern blot,
YCCEL1 I − 7-3p, [71]
15-3p qPCR
22-3p,
19-3p
SNU-719,
I/ −/ 1, 3, 5/ 7, 10, 12/ +/
AGS-EBV/
/ −/ 1, 5/ 7, 10, 12/ / Northern blot [44]
Animal model/
/ −/ 1 / +
clinical tissue
Lymphoma Deep
NKTL − + + + [65]
clinical tissue sequencing
3, 4, 1-5p,
721, B958IID6 III + − qPCR [54]
15
LCL IM-9 III 1-1, 1-2 1, 3, 5/ 7, 10, 12/ Northern blot [66]
IM-9 III + + + qPCR [70]
AT + qPCR [52]
Deep
DLBCL clinical tissue − + + + [64]
sequencing
3, 4, 1-5p, 7, 10, 12,
PTLD PTLD1 III + qPCR [54]
15 20-5pInt. J. Mol. Sci. 2018, 19, 2810 6 of 26
3. EBV miRNAs and EV
In addition to regulating host gene expression through viral-encoded miRNAs, EBV infection also
alters the protein cargo of EVs released from infected cells [74,75]. However, molecular cargo variations
in EVs induced by the virus are not limited to protein and also include nucleic acids such as viral
mRNAs [76] and miRNAs [77,78]. EBV-modified EVs containing BART miRNAs were first reported to
be released continuously from LCL [76]. Shortly thereafter, these BART miRNAs containing EVs were
confirmed to be released by infected NPC cells (C666-1) by our group [79] and the Busson lab [78].
Moreover, BART1-5p, 5, 7-3p, 12, and 13 have also been found in the circulating EVs from patients
with NPC [78]. Our group also detected miRNAs and the viral oncoprotein LMP1 in EVs present
in the serum of mice carrying NPC tumor xenografts and others have found these molecules in the
serum of NPC patients. The transfer of EVs containing LMP1 was found to activate signal transduction
pathways and produce phenotypic changes in recipient cells [79–82].
A study by Pegtel et al. provided the first evidence for functional miRNA deliver via EVs [76].
Specifically, EBV-infected B cells secrete BHRF1-3 in EVs that can reduce target gene expression in
uninfected recipient cells. Furthermore, they also detected EBV-encoded BART cluster 1 miRNAs in
circulating non-B cell lymphocytes derived from EBV-infected patients, where EBV DNA is not present.
The data suggested that the presence of miR-BARTs in these cells can be attributed to EV transfer.
It is thought that EBV miRNAs in EVs play important roles in controlling the innate and adaptive
antiviral immune responses. After being secreted by EBV-infected cells, EVs can be taken up by
different cell types, including monocytes and monocyte-derived dendritic cells [76], plasmacytoid
dendritic cells [83], T cells [84], epithelial cells, endothelial cells, and fibroblasts [81]. Transfer of
viral miRNAs to cells can lead to the repression of target genes [76]; for example, BART15 represses
the inflammasome protein NLRP3 in a monocytic cell line [85,86]. Rechavi et al. reported that EBV
miRNAs can be transferred from infected B cells to non-EBV-infected T cells and silence the target
gene expression in the recipient T cells [84]. BART miRNAs have a wide range of targets, including
PTEN (PI3K/AKT pathway), Wnt pathway, and the tumor suppressor genes WIF1, NKD, CXXC4,
and APC [38]. Therefore, it is likely that BART miRNAs in EVs may target similar pathways when
delivered to noninfected cells. Future investigation into the levels of these miRNAs in EVs purified
from patient samples may lead to better diagnostic or prognostic markers.
4. EV Isolation Methods
There are many methods to isolate EVs from biological fluids to study their functions,
for biomarker discovery and liquid biopsy development. From the most classic ultracentrifugation
method to well-developed commercial kits, the ultimate goal is to isolate EVs from complex biofluids
with high purity and recovery. With all available approaches, it is critical to remove non-EV cellular
debris and proteins which may contaminate the downstream miRNA detection. For plasma or serum
samples, it is important to defibrinate and avoid hemolysis. Fibrin-clotting will reduce the EV purity
and clog membranes or columns used in some EV isolation methods. Additional caution must be
taken to prevent the release of miRNAs from red blood cells during hemolysis and ensure the accuracy
of exosomal miRNA detection [87]. Therefore, samples must be processed rapidly with an appropriate
anticoagulant. For example, heparin is not a suitable anticoagulant for EV isolation because it may
inhibit downstream enzymatic reactions. EDTA is an anticoagulant of choice when processing blood
for EV isolation and miRNA detection. However, more detailed studies on the effects of anticoagulants
on EVs and downstream analyses is needed [88]. Following blood processing, EVs can be extracted
using numerous methods with associated advantages and disadvantages.
4.1. Ultracentrifugation (UC)
Differential ultracentrifugation (DC) was the first EV purification method described in the
literature and has long been considered the gold standard for the isolation of relatively homogenousInt. J. Mol. Sci. 2018, 19, 2810 7 of 26
size populations of small EVs. DC is a series of centrifugation steps with increasing centrifugal force
to enrich EVs and remove unwanted cellular materials. This method is often used in combination
with sucrose or iodixanol density gradients to purify EVs from contaminating protein complexes and
separate EV populations based on size and density. One limitation of density-gradient UC is that this
approach cannot purify EVs from contaminants with overlapping densities. For example, the density
of HDL considerably overlaps with vesicles and frequently copurifies with EVs [89,90]. In addition
to these technical challenges, the method is very labor-intensive, time-consuming, and dependent
on highly-trained researchers and expensive instrumentation. Therefore, UC is not an ideal method
for rapid EV isolation in a clinical setting for diagnostic purposes. Despite the limitations of DC,
it continues to be an important method for the study of EV biology and the standard with which new
methods are measured against.
4.2. Ultrafiltration (UF)
EVs can be purified from smaller contaminating material by UF based on filter poor size. Typically,
filters with molecular weight cut-offs of 100 kDa are used to concentrate small EVs greater than or
equal to 30 nm in size and remove soluble proteins [91]. However, this method also retains a large
quantity of albumin and immunoglobulin on the membrane that significantly reduces the purity of EV
preparations. It is for this reason that UF is frequently combined with other methods to obtain more
pure isolates [92,93]. A major advantage of UF is the ability to concentrate large quantities EVs from
fluids that maintain biological activity. Heinemann et al. developed a three-step protocol to isolate
large volumes of biofluid based on sequential steps of dead-end prefiltration, tangential flow filtration
(TFF), and low-pressure track-etched membrane filtration [94]. This strategy is scalable and could
potentially be developed into a fully automated system.
Small UF devices (e.g., vivaspin, Amicon, Pellicon, and Minimate) can be operated using standard
centrifuges or mechanical pumps. Therefore, UF could be easily employed in most diagnostic
laboratories and commercial kits are now available to take advantage of this method of EV enrichment.
For example, the ExoMir kit from Bioo Scientific uses positive pressure to drive fluid sample though
tandem microfilters to remove cellular debris and capture all vesicles of diameter larger than 30 nm.
4.3. Size-Exclusion Chromatography (SEC)
SEC or gel-filtration chromatography is a chromatographic method in which molecules in solution
are separated by their size similar to UF. SEC works through the principle that smaller objects take
longer time to travel through the matrix. Therefore, SEC is an ideal method to separate EVs from
soluble proteins, and larger protein aggregates like albumin and Ig [93].
SEC has several advantages when compared with other methods:
First, SEC does not require the addition of other reagents and always maintains the samples
in physiological buffer conditions, which is important to maintain the biological properties of EVs.
Compared to differential centrifugation, there is little risk of vesicle aggregation and copurification of
soluble proteins and protein complexes. The plasma sample needs to be diluted in UC due to its high
viscosity, otherwise the recovery efficiency of vesicles is greatly reduced. Sucrose is frequently used for
density-gradient purification of vesicles and membrane proteins, but this method of isolation has been
shown to affect vesicle size and their biological properties [95].
Secondly, SEC does not require expensive instrumentation and is less labor intensive than UC.
Many groups have now shown the separation of serum EVs in as little as 10 min on columns packed
with sepharose matrix [96,97]. Other methods require longer incubation and centrifugation times to
isolate EVs from liquids. EV samples can be prepared for analysis on the same day of collection which
is particularly advantageous in a clinical setting. In addition, sepharose CL-2B SEC packed columns
are relatively inexpensive and are reusable [96]. For researches that do not want to prepare their own
columns, traditional commercially available SEC columns [93] specially designed for EV isolation exist,
like qEV [22,98] from Izon, for an added cost.Int. J. Mol. Sci. 2018, 19, 2810 8 of 26
Despite the advantage of SEC, several disadvantages exist. For example, unlike other methods,
SEC is the only method which does not concentrate samples, but instead dilutes them. So, SEC requires
additional steps to enrich EVs for downstream applications, which results in lower overall total
recovery. Isolation of vesicles with sepharose CL-2B SEC leads to 30–70% vesicle recovery before
concentration, compared to 80% with UC [96]. Another issue with SEC is that it cannot handle large
volumes of sample. Therefore, a concentration step like UF must be applied before SEC when working
with large quantities of biological fluids [92,93].
4.4. Anion Exchange Chromatography (AIEX)
EVs have been found to have a net negative charge similar to the plasma membrane of
cells. Recently, researchers have started to take advantage of this property to purify EVs by AIEX.
When compared to UC and TFF, AIEX was found to be comparable in yield to UC with decreased
protein and debris contamination compared to EVs isolated by TFF [99]. The high flow rates possible
with AIEX allow for the purification of 1011 EVs from 1 L of cell culture supernatant in less than 3 h.
The rapid and scalable purification of EVs by AIEX will aid in the development of clinical application
of EVs including drug delivery and biomarker discovery.
4.5. Precipitation Methods
Volume-excluding polymers such as polyethylene glycols (PEGs) are routinely used for
precipitation of viruses, bacteriophage, and other small particles including EVs [100–102].
The precipitate can be isolated using either low-speed centrifugation or filtration [103]. Again, like most
methods, commercial products are available. Total EV Isolation reagent (TEI, invitrogen) and ExoQuick
(SBI) are two commercial kits that take advantage of PEG-based precipitation of EVs. These kits
have optimized protocols for the isolation of EVs from cell-culture media, serum, plasma, urine,
and other body fluids (saliva, milk, cerebrospinal fluid, ascites fluid, and amniotic fluid). Many groups
have shown that the precipitate-based method induce large protein complexes and EV aggregation,
which reduce the purity compared with other methods [22,104–106]. However, we have demonstrated
that this method is very efficient with recovery rates greater than 90% [107].
4.6. Immunoaffinity Isolation
To isolate specific EV-subpopulations, vesicles can be affinity purified with antibodies to EV
surface markers like tetraspanins (CD63, CD81, and CD9), annexins, EpCAM, integrins, EGFR,
and MHC. Antibodies directed against these surface proteins can be used individually or in
combination. For this application, the antibodies are immobilized on a variety of media, including
magnetic beads, chromatography matrices, plates, and microfluidic devices [89,108–110]. Researchers
using this method should be cautious in interpreting data, as there are many EV subtypes with
different surface protein expression profiles [111,112]. It is also likely that the EV surface protein
profiles differ between cell types and cellular conditions [113]. Regardless of these limitations,
affinity-based purification is useful in distinguishing subpopulations and isolating EVs from different
organs and tissues, especially under physiological conditions. Additionally, it can be combined with
antibody-based methods to merge purification and downstream analyses [114].
Commercial kits exist, like EV isolation kit from MACS, for affinity-based EV isolation.
MACS provides magnetic beads with specificity to tetraspanins CD9, CD63, and CD81. They also offer
a MACSPlex EV kit for surface protein profiling. Qiagen has developed a well characterized kit named
exoEasy or exoRNeasy Serum/Plasma which utilize a spin column and affinity membrane-based
method to isolate EVs. When combined with the company’s miReasy kit, total EV RNAs can be quickly
purified for molecular characterization [115].
Other affinity-based EV purification techniques have been described that utilize the surface
properties of EVs. For example, EVs are known to have phosphatidylserine (PS) displayed on
the surface. Nakai et al. used the PS binding protein TIM4 to isolate highly purified EVs [116].Int. J. Mol. Sci. 2018, 19, 2810 9 of 26
The EVs isolated using this method could be eluted with the addition of chelators as the binding
of TIM4 to PS is Ca2+ -dependent. Another approach takes advantage of the affinity of EVs for
heparin [117]. Heparin coated beads or columns can be used to enrich EVs from biological fluids.
One limitation of this approach is that other contaminating biomolecules also have an affinity for
heparin including some antibodies, coagulation factors, DNA-binding proteins, lipoproteins, and other
plasma proteins [118–122].
4.7. Microfluidic Devices
Microfluidic technology allows one to control fluids on a small, typically submillimeter,
scale which is ideal for the development of EV diagnostic tests. Usually the device is a set of
microchannels etched or molded into a solid material (like glass or silicon) in a chemistry or engineering
lab. Currently, this technology is not widely used in traditional biomedical research labs, but the
potential still remains. Microfluidic chips which capture EVs by affinity have been discussed above,
here we introduce two types of microfluidic-based EVs isolation methods: acoustic nanofiltration and
viscoelastic flow sorting.
The separation of EVs by acoustics is based on ultrasound standing waves that exert differential
acoustic force on EVs according to their size and density. Lee et al. optimized the ultrasound transducer
to achieve a 200 nm size cut-off and ~70% recovery on cell medium sample [123]. Another recently
implemented microfluidic approach for sorting of EVs is viscoelastic microfluidics, which use elastic
force to separate particles based on size. To control the viscoelastic force of media, Liu et al. diluted EV
samples in poly(oxyethylene) (PEO) solution and were able to achieve similar purity and recovery as
previous methods routinely used in the field [124].
The extremely low processing capacity and long operation times greatly restricts the use of
microfluidics in general lab applications. Furthermore, these methods need more validation and
standardization. However, once a biomarker is established for diagnostic purposes, microfluidics may
prove to be an ideal method for detection small volumes of clinical samples.
4.8. Combination Approaches
Considering there are pros and cons for each single method (see Table 2), researches have started
to combine and further optimize the methods discussed above to improve recovery and purity.
Unfortunately, the additional steps usually required to increase purity often result in a reduction in
yield. Therefore, the downstream application must be taken into consideration when choosing the
method of EV isolation.
UC and UF are often used to concentrate large volumes of biological fluids prior to SEC
separation [92]. Koh et al. described an approach of preprocessing of plasma by UC followed by SEC
to isolate and enrich EVs. This method provided the best yield as determined by nanoparticle tracking
analyses and the presence of the exosomal markers CD63, Flotillin-1, and TSG-101. EV morphology
was verified by transmission electron microscopy and found to remain intact [98]. Concentration of EVs
using precipitation can also be combined with SEC. However, depending on the source material these
approaches will affect recovery and potentially increase protein contaminants, negatively impacting
vesicle purity [97].
PEG isolated EVs were found to have similar purity to UC if a small volume PBS wash step is
included in the EV isolation work-flow. Our group has optimized a PEG-based precipitation method
termed ExtraPEG which first enriches EVs from large quantities of media with PEG, followed a PBS
wash ultracentrifuge step to improve purity. The quality of proteins and RNAs from ExtraPEG
method is sufficient for proteomics and deep-sequencing [107]. Furthermore, highly pure EVs
were obtained when PEG was combined with density gradient UC methods [104]. More recently,
we have found that this method of EV enrichment can be combined with other methods like SEC and
affinity-based purification.Int. J. Mol. Sci. 2018, 19, 2810 10 of 26
Exo-spin is a commercially available kit that combines precipitation with column-based
purification. After EVs are concentrated by precipitation, the EVs are further purified on a small
spin column.
Table 2. Comparison of EV Isolation Methods.
Sample
Method Yield Purity Cost Advantage Disadvantage
Volume
Time and labor intensive; Low
UC 1–100 mL ++ ++ + No chemical additives throughput; EVs/protein
aggregates
Low purity; Low throughput;
Flexible volume;
UF Variety ++ + ++ Efficiency dependent on the type of
No chemical additives
ultra-membrane
Low purity; Sample contamination
Flexible volume; Time and
by polymer particles; Co-isolation
Precipitation Variety +++ + + labor saving; No expensive
of nonspecific proteins;
equipment needed
EV/protein aggregates
High purity; Time saving;
Sample volume limited;
SECInt. J. Mol. Sci. 2018, 19, 2810 11 of 26
plasma in an efficient time frame. Tang et al. not only compared different isolation methods but also
various RNA extraction kits [105]. Their results similarly demonstrated that precipitation methods
(ExoQuick and TEI) result in higher isolation efficiency than traditional UC, but also have higher
protein contamination. More total RNAs were isolated from precipitation methods, but RNA chip
analysis shows that some of this may be from the protein contamination. Further RNA sequencing
analyses proved that the isolation method can influence the small RNA profile. Recently, Buschmann
and colleagues used NGS to compare different EV isolation and RNA extraction methods. Their results
show that each method generates biases on EV subpopulations as well as contaminations [127].
While precipitation and membrane affinity methods give the highest miRNA reads, SEC based methods
provides the greatest purity EVs isolates.
Methods of RNA extraction from EVs has also been compared by Eldh et al. [126]. For all methods
evaluated, RNA of sufficient quality and purity was obtained as determined by RNA integrity number
(RIN) and OD values. In their hands, a column-binding approach resulted in the highest RNA yield
and the broadest RNA size distribution. Other phenol-based methods resulted in lower total RNA
recover that was enriched in small RNAs including miRNAs.
In addition to cell culture media and plasma, the EVs isolation efficiency from urine samples
has been evaluated by different groups. Wachalska et al. [131] demonstrated that SEC could separate
EVs from the protein-complex fraction (THP-protein-network), whereas the other two commercial
kits could not. These precipitation-based kits resulted in lower miRNA recovery from the reverse
transcription qPCR (RT-qPCR) test of three miRNAs (miR-375, miR-204, and miR-21). They also found
that these three miRNAs have a different ratio in EV fraction and protein fraction, which proved the
importance of EV purity. Royo et al. compared five different methods based on UC, precipitation
and lectin binding [132]. RNA profiling results with miRNA arrays showed high correlation between
all tested methods and kits. Channavajjhala et al. [133] found that UF in combination with SeraMir
exoRNA columns represents the optimal miRNA purification procedure from urinary EVs. Moreover,
storage conditions of urine do not influence the relative abundance of urinary exosomal miRNAs.
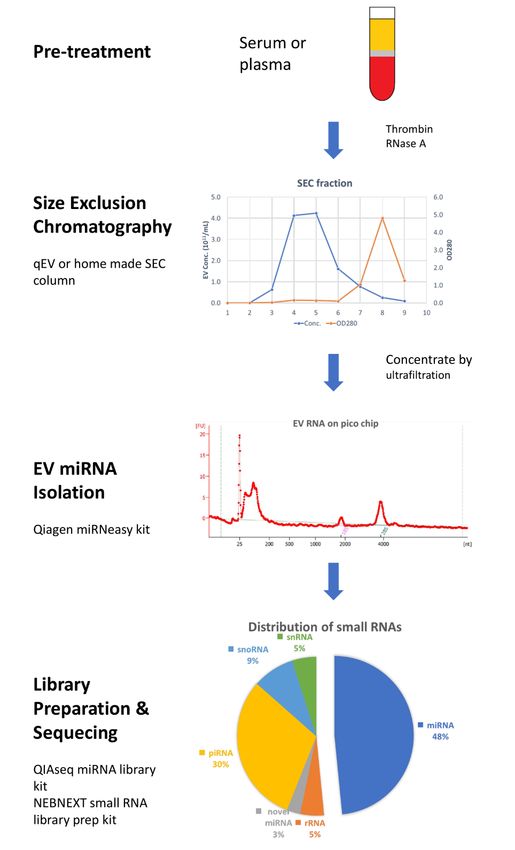
Taking all these results together, most researchers agree that the SEC method produces purer
EVs than precipitation and UC. Based on the recent findings and developments in EV isolation and
RNA characterization, we provide a complete work-flow for the analysis of EV miRNA cargo from
plasma samples (Figure 1) that can easily be adapted to other types of biological fluids or RNA and
DNA species.tested methods and kits. Channavajjhala et al. [133] found that UF in combination with SeraMir
exoRNA columns represents the optimal miRNA purification procedure from urinary EVs. Moreover,
storage conditions of urine do not influence the relative abundance of urinary exosomal miRNAs.
Taking all these results together, most researchers agree that the SEC method produces purer EVs
than precipitation and UC. Based on the recent findings and developments in EV isolation and RNA
Int. J. Mol.characterization,
Sci. 2018, 19, 2810we provide a complete work-flow for the analysis of EV miRNA cargo from plasma 12 of 26
samples (Figure 1) that can easily be adapted to other types of biological fluids or RNA and DNA species.
Workflow
Figure 1.Figure of miRNAs
1. Workflow profiling
of miRNAs from
profiling fromblood
blood extracellular vesicles
extracellular vesicles (EVs).
(EVs). Plasma
Plasma or serum
or serum
samples samples
were pretreated with with
were pretreated thrombin and
thrombin andRNase
RNaseA A to remove
removefibrin
fibrin
andand non-EV
non-EV RNARNA contaminate.
contaminate.
1 mL of1cleared
mL of cleared
plasma plasma
was was loaded
loaded on on size-exclusion chromatography
size-exclusion chromatography (SEC) column
(SEC) and 1 and
column mL 1 mL
fraction from 3 to 6 were collected and pooled. Concentrated EVs samples
fraction from 3 to 6 were collected and pooled. Concentrated EVs samples were quantified were quantified by by
nanoparticle tracking analysis (NTA), and 50% to 80% recovery could be achieved. Total EV RNAs
nanoparticle tracking analysis (NTA), and 50% to 80% recovery could be achieved. Total EV RNAs
were isolated by Qiagen miRNeasy micro kit. After checking total RNA with pico chip on a
were isolated by Qiagen miRNeasy micro kit. After checking total RNA with pico chip on a bioanalyzer,
small RNA libraries were prepared by using NEBNext Small RNA Library Prep Set and run on an
Illumina sequencer.
5. Methods for miRNA Detection
EV samples of sufficient quantity and purity are important for downstream applications.
Total RNA should be prepared using methods that preserve small RNA species. Once the EV RNA is
extracted, there is no technical difference between handling miRNA from cells and EVs. Generally,
the levels of EV RNA will be low and in the nanogram range. However, RNA yield is dependent
on the number of EVs isolated and can be scaled-up accordingly. After RNA purification, there are
several established techniques for miRNA detection, such as northern blotting, RT-qPCR, microarray,
NGS, highly sensitive biosensors (including molecular beacons), and electrochemical-based methods
(like surface plasmon resonance) [134].
The first method developed for miRNA detection was Northern blotting, which was used in
the initially discovery of lin-4 miRNA [135]. Similar to Western blotting, this technique separatesInt. J. Mol. Sci. 2018, 19, 2810 13 of 26
biomolecules by electrophoresis and then transfers miRNAs to a positively charged nylon membrane.
Finally, labeled probes are hybridized with the miRNAs immobilized on the membrane and imaged.
Our group has successfully used this approach to detect EBV miRNAs in EVs isolated from latently
infected cancer cells [79]. Northern blotting is specific and semiquantitative; however, it is time
consuming approach. Other techniques now exist for the rapid detection and analysis of miRNAs.
5.1. RT-qPCR
RT-qPCR has been wildly considered as the go to standard for miRNA detection. It provides
excellent reproductivity, sensitivity, and dynamic range at a reasonable cost. Under optimal conditions,
qPCR can provide great linearity with total RNA input from 1 pg to 1 µg and successful detection
as low as 10 copies of cDNA in a sample. However, this method can become labor intensive and
expensive when used in high throughput screening or for whole transcriptional profiling. For these
reasons, it is frequently used to validate results from other miRNA profiling methods, like NGS and
microarray. One advantage of PCR-based methods is the ease at which they can be adapted for clinical
use. Indeed, many diagnostic tests take advantage of this technology and are already used in the clinic.
The first step in miRNA detection is to transform the miRNAs into cDNA by reverse transcription.
As there is no poly-A tail at the 3-end, reverse transcription needs to be carried out by either using
miR-specific primer or using universal primer after adding poly-A by polymerase.
The miR-specific primers have a stem-loop structure at their 5-end and a miRNA antisense
portion of approximately 6–8 nucleotides on their 3-end [136]. The 5-end in the stem-loop also contains
a designed nucleotide sequence for both reverse transcription and qPCR. Pre-miRNA exists as a stable
hairpin of approximately 70 nts in length which make it impossible for stem-loop primer to hybrid at
3-end of unmatured miRNAs [136]. This feature greatly enhanced specify and reduced background,
but somehow limit its use in profiling approach [137].
The most widely used approach is to convert miRNAs into poly-A tailed RNA species is with
poly-A polymerase (PAP) [138], which is the fundamental principal of many commercial products.
On the second step, an RT primer which contains both poly-T and universal qPCR segment binds to
the extended miRNAs for cDNA synthesis. The disadvantage of this method is that PAP extends all
RNAs including pri-/pre-miRNAs as well as other small RNAs which may reduce specify of qPCR
detection. Moreover, the predesigned RT primer highly restricts Tm optimization in qPCR. miQPCR is
another similar approach where a universal RT primer is linked to 3-end of miRNA by T4 RNA ligase
prior to utilizing the same cDNA synthesis step [139].
Another approach is dependent on designed stem-loop primers which hybridized on the 3-end
and/or 5-end of target miRNA [140–142]. Li and Zhang published similar two-primers approaches in
2009 and 2011, respectively [140,141]. After hybridized with the half sequence of the target miRNA,
the two primers are immediately adjacent to each other which can be ligated by the catalysis of T4
RNA ligase and used as template in the next qPCR step. Later in 2017, Androivic et al. improved
this approach by using a hair-pin primer composed of two hemi-probes complementary to each end
of target miRNA [142]. This dual binding approach greatly increase the sensitivity and specificity of
qPCR detection on miRNAs.
Following cDNA synthesis by any of the methods mentioned above, qPCR can be performed as in
mRNA detection by using miR-specific primers or a universal primer set. The two fluorescent systems
available to monitor qPCR reaction are SYBR Green and TaqMan probe-based methods. For either
approach, internal tests should be performed to determine amplification efficiency and specificity.
Usually, a 10-fold dilution assay could test for the existence of any PCR inhibitor, and amplification
following a melting curve shows any side products in the reaction. The latter assay is especially
important for the SYBR Green method because of its nonspecific binding to any dsDNA product.
Also, the uncontrolled poly-A reaction may slightly affect Tm of PCR product. It is therefore important
to use a suitable gene, or a geometric mean of multiple reference genes, to normalized qPCR
data [143,144]. The most widely used reference gene is snRNA species such as U6. With properInt. J. Mol. Sci. 2018, 19, 2810 14 of 26
experimental design, qPCR can be a reliable and sensitive method for detection of EBV miRNAs in
cells or EVs.
5.2. DNA Probes
Molecular beacon (MB) is the first approach to utilize a kind of specially designed DNA probe.
MB is a short hairpin oligonucleotide with a fluorophore and a quencher at each end. Under the
stem-loop structure, fluorophore is quenched by proximal effects, which could be abolished by
hybridizing with its target miRNA [145]. Surface plasmon resonance based method also utilizes DNA
probe hybridization and will be discussed in the next section.
As a chemical synthesized oligo, MB could be modified or engineered which greatly expands its
applications, even for use in living cells [146]. For miRNAs inside EVs, MBs have been reported
to be capable of penetrating EV membranes and hybridizing with its target miR. For example,
miR-21 in EVs isolated from breast cancer cell lines were successfully detected by Lee in 2015 [147].
Disruption of EV membranes with streptolysion O resulted in enhanced fluorescent signal likely by
delivering more MBs into EVs. In addition, miR-21 inside of cancer cell-derived EVs was selectively
detected among heterogeneous EV mixtures and in human serum. Multiple miRNAs can also be
detected simultaneously from the same EV preparation using this method [148]. Another group
developed a method of encapsulating MBs into positively charged lipoplex nanoparticles [149].
In their study, negatively charged EVs derived from cell membrane were able to fuse with MB
containing nanoparticles. This lipoplex-EV fusion leads to the mixing of EV RNAs with MBs
and fluorescence signals of MBs were observed by the total internal reflection fluorescence (TIRF)
microscopy. This method provides results similar to RT-qPCR for miR-21 detection and is capable
of detecting a single biomolecule within the nanocomplexes. Serum can be applied directly on the
biochip which is immobilized with MB encapsulated lipoplex nanoparticles. Similar MB tools have
also been successfully used in a fluorescent-NTA assay [150].
Another approach relies on the sensitive and specific hybridization of the target miRNA
cDNA product to a microarray immobilized with a complementary DNA probe [151,152]. Then the
hybridization can be detected by fluorescence or enzyme related detection methods. The principle
of the design allows the assay to be performed on hundreds of miRNAs simultaneously from one
sample for relatively low cost. However, this approach does have its limitations. First, a probe-based
microarray method is semiquantitative and relatively suitable for miRNAs expression level comparison
between different conditions. Therefore, quantitative or more reliable assays, like RT-qPCR, are needed
for verification purposes. Second, a microarray usually has a smaller dynamic range compared to
other profiling methods such as NGS. This compression could underestimate the abundance of some
miRNAs and give misleading results [153]. Finally, hybridization-based methods are often unable to
distinguishable between some closely related miRNAs [154].
One of the most frequently used methods of miRNA labeling is through an enzymatic attachment
reaction (as described in Section 4.1). T4 RNA ligase can be exploited to attach a fluorescently labeled
nucleotide or short oligonucleotide to the 3-end of target miRNA. An alternative approach is to use
a bridge oligonucleotide with poly-T segment which hybridizes the poly-A tail added by PAP to
3-end of miRNAs. The polymerization reaction by PAP is not well controlled and a variable number
of adenosines may be added to the miRNA tail, possibly affecting hybridization as discussed in
Section 4.1. Another limitation of this method is the substrate structural preference of T4 RNA ligase
could introduce artifact and bias into miRNA detection [155,156]. Lee et al. tried to developed another
approach to replace the labeling step in miRNA detection [157]. Biotin-labeled structure-specific RNA
binding protein (PAZ-dsRBD derived from Argonaute proteins) is used in this new assay, which can
only recognize miRNAs binding with the DNA probe on the array. These probes are designed to
require base-stacking stabilization provided by the target miRNA bound.
The RNA-primed array-based Klenow enzyme assay is another method frequently used to remove
the miRNA labeling [158]. The probes used for capturing miRNAs consist of an antisense sequenceInt. J. Mol. Sci. 2018, 19, 2810 15 of 26
from target miRNA and a universal spacer, three thymidines. After hybridization, single stranded
probes are digested by exonuclease I, following the addition of biotinylated adenosine by the Klenow
fragment of DNA polymerase I that utilizes the bound miRNA as a primer. The incorporated biotin
can then be detected with fluorescent- or enzyme-conjugated streptavidin. A recent publication used
a similar approach named ligase-assisted sandwich hybridization, pushing the detection limit to the
30 fM level [159,160]. These data are close to the sensitivity of detection using 1 µg total RNA input
in blood samples by RT-qPCR. Currently, most available commercial microarrays are label-based
methods and require on the order of tens to hundreds of ng of total RNA input, exhibiting nM to pM
detection limits.
5.3. NGS
NGS technology is becoming the leading methodology in miRNA research. It has extraordinary
profiling ability unlike any other available technology. However, obtaining useful data requires
specialized expertise to perform the experiment and to analyze the large data sets produced. NGS also
requires expensive reagents and equipment, which can restrict its use. NGS of RNA (also called
deep sequencing or RNA-seq) is perhaps the only technique that can exposes the immense variation
inherent in miRNA processing and result in the discovery of novel miRNAs or other RNA species.
The heterogeneity of miRNA (e.g., iso-miRNA or single-nucleotide changes) can be problematic for
other techniques, because the exact miRNA sequence must be known before using RT-qPCR or DNA
probe. Moreover, NGS data may include other small RNAs, as piRNA, snoRNA, lnc RNA, yRNA,
or even rRNAs [161]. However, because of its ultra-sensitivity in RNA profiling, researchers must be
careful when handling EV samples that may introduce contamination and bias at every step.
The two leading NGS platforms are supplied by Illumina and SOLiD [162]. Presently, Illumina is
the most widely used sequencing platform for deep sequencing and RNA profiling. This system takes
advantage of a fluorescence-based paradigm to read the nucleotides. Ion Torrent from ThermoFisher
is another option, which measures pH during polymerization on a semiconductor chip to determine
nucleotide sequences.
In addition, there are complications that must be considered when conducting NGS experiments.
As with many miRNA profiling tools [163], some of the current miR-seq technology and protocols are
not able to accurately determine miRNA expression profiles because the number of reads determined
for any given miRNA molecule do not necessarily reflect its actual abundance. This problem may be
resolved by using UMI (Unique Molecular Identifier) in which each individual miRNA molecule is
tagged with an UMI during library construction [164]. Additionally, the ability and efficiency of current
technologies to capture miRNA and other small RNA species has been shown to heavily depend not
only on miRNA sequence, but also on library preparation methods [165]. Huang et al. evaluated
different commercial small RNA library preparation protocols from three human plasma-derived
exosomal RNA samples [166]. Their results show that all the commercial kits generate sufficient DNA
fragments and have significant bias of specific small RNAs.
5.4. Surface Plasmon Resonance (SPR)
SPR is the oscillation of conduction electrons at the interface of material stimulated by
plane-polarized incident light. The electromagnetic surface waves produced results in a direction
parallel to the interface, making it very sensitive to any change of this boundary. Based on these
principles, SPR is useful for the detection of molecules in solution or surface proteins of whole
EVs [167].
Considering the size of miRNA molecules (6–8 nm) and the typical sensing depth of SPR
(100–200 nm), unlabeled miRNA can only be detected down to a concentration of 1 nM. Therefore,
a signal amplification step is usually required [16,168,169]. Many groups have pushed the detection
limit to the sub-fM level by using multiple signal amplification methods.Int. J. Mol. Sci. 2018, 19, 2810 16 of 26
One of the first applications of SPR-based microarray detection of miRNAs was described for
miR-16, miR-23b, and miR-122b [170]. After binding to immobilized probes on the surface, PAP was
used to add poly-A tails to the 3-end of the miRNAs. Next, gold nanoparticles were conjugated with
poly-T and used to amplify the SPR signal. Using this approach, a 10 fM detection limit was achieved,
which is an approximately 105 -fold enhancement compared with unlabeled method. In another work,
biotin–streptavidin binding was used instead of nanoparticles for signal amplification produced similar
results [171]. Another improvement of this approach has been investigated by other groups [172,173].
Biotinylated DNA probes were designed as molecular beacons that only expose its biotin groups after
hybridization of target miRNAs. Under optimal conditions, they obtained a limit of detection of 45 fM.
Taken together, SPR offers another sensitive method for miRNA detection on a microarray platform.
5.5. Localized Surface Plasmon Resonance (LSPR)
When the SPR is confined in a nanoparticle of size comparable to or smaller than the wavelength
of light used to excite the plasmon, it generates a localized surface plasmon resonance (LSPR) effect.
Under LSPR, electric fields near the nanoparticle’s surface are greatly enhanced and maximize the
plasmon resonant frequency. The resonance even falls into visible wavelengths for noble metal
nanoparticles [174]. Since the sensing depth of LSPR (5–20 nm) is close to the length of miRNA
molecules, direct detection is possible even without any labeling or signal amplification probe. The first
report of this method was using the surface of gold nanoprisms in the detection of miR-21 and miR-10b
from the plasma of patients with pancreatic cancer [175]. They achieved a sub-fM level detection
limit, which is about 2-fold higher than RT-qPCR method. Significantly, miR-21 in plasma samples
from Pancreatic ductal adenocarcinoma (PDAC) patients could be detected directly with this method
without any purification step which minimize the loss during RNA isolation. The plasmonic biosensor
is stable and reusable for several days without compromising sensitivity and selectivity, suggesting it
may enable the development of simple, cost-effective tools for diagnostic detection of miRs.
Nanostructures on solid supports are being constructed using current microfabrication approaches.
Fabrication of transferring side edge prefunctionalized (SEPF) nanostructure arrays onto flexible
substrates (i.e., PET) using contact transfer printing increases sensitivity and reduces background
noise [176]. The nanostructure sidewalls have been biochemically synthesized with functional
terminals for miRNA hybridization and the immobilization of resonant nanoparticles. This unique
configuration has shown a 10 fM level detection capacity of the miR-21 oligonucleotide.
Guo et al. developed a new approach for visual detection of miRNAs in human serum with
the naked eye [177]. The target miRNAs were firstly hybridized with the cDNAs in solution,
then duplex-specific nuclease (DSN) would specifically cleave the DNA strand and keep miRNA intact.
On the next step, the remaining cDNAs are hybridized with two designed probes to form a Y-shaped
DNA duplex that assemble the gold nanoparticles on the other side of probes into aggregates. The
nanoparticle dimers generated produce a significant plasmon coupling effect correlating with miRNA
input amount causing the solution to change color. The corresponding limit of detection is 0.5 fM
when inspected with the naked eye, and down to 23 aM with a spectrometer. Therefore, LSPR is likely
to be very useful in the detection of miRNA in the clinical samples.
5.6. Surface-Enhanced Raman Scattering (SERS)
Surface-enhanced Raman scattering (SERS) is a kind of SPR technique that enhances Raman
scattering of molecules adsorbed on solid surfaces or nanostructures. The enhancement factor can be
as much as 1010 to 1011 , which constitutes a quantitative fundamental test of single molecules [178].
With application of signal by SERS, miRNAs can be directly detected on a SERS active substrate or
indirectly with the aid of nanoprobes. Demonstrated by Driskell et al. [179], near-real time (10 s)
detection of miRNAs was archived on OAD-fabricated silver nanorod arrays. As shown in another
paper [180], both direct and indirect methods based on SERS can be used to detect miR-21 with the
limit of detection of 0.36 and 0.85 nM, respectively.You can also read