SRSF3 and SRSF7 modulate 3 UTR length through suppression or activation of proximal polyadenylation sites and regulation of CFIm levels
←
→
Page content transcription
If your browser does not render page correctly, please read the page content below
Schwich et al. Genome Biology      (2021) 22:82
https://doi.org/10.1186/s13059-021-02298-y

 RESEARCH                                                                                                                                          Open Access

SRSF3 and SRSF7 modulate 3′UTR length
through suppression or activation of
proximal polyadenylation sites and
regulation of CFIm levels
Oliver Daniel Schwich1,2†, Nicole Blümel1†, Mario Keller2,3†, Marius Wegener1,2, Samarth Thonta Setty2,
Melinda Elaine Brunstein4, Ina Poser5, Igor Ruiz De Los Mozos6, Beatrix Suess7, Christian Münch4,
François McNicoll1, Kathi Zarnack2,3* and Michaela Müller-McNicoll1*

* Correspondence: kathi.zarnack@
bmls.de; mueller-mcnicoll@bio.uni-        Abstract
frankfurt.de
†
 Oliver Daniel Schwich, Nicole            Background: Alternative polyadenylation (APA) refers to the regulated selection of
Blümel and Mario Keller contributed       polyadenylation sites (PASs) in transcripts, which determines the length of their 3′
equally to this work.                     untranslated regions (3′UTRs). We have recently shown that SRSF3 and SRSF7, two
2
 Buchmann Institute for Molecular
Life Sciences, Goethe University          closely related SR proteins, connect APA with mRNA export. The mechanism
Frankfurt, Max-von-Laue-Str. 15,          underlying APA regulation by SRSF3 and SRSF7 remained unknown.
60438 Frankfurt, Germany
1
 Institute for Molecular Bio Science,     Results: Here we combine iCLIP and 3′-end sequencing and find that SRSF3 and
Goethe University Frankfurt,              SRSF7 bind upstream of proximal PASs (pPASs), but they exert opposite effects on 3′
Max-von-Laue-Str. 13, 60438               UTR length. SRSF7 enhances pPAS usage in a concentration-dependent but splicing-
Frankfurt, Germany
Full list of author information is        independent manner by recruiting the cleavage factor FIP1, generating short 3′UTRs.
available at the end of the article       Protein domains unique to SRSF7, which are absent from SRSF3, contribute to FIP1
                                          recruitment. In contrast, SRSF3 promotes distal PAS (dPAS) usage and hence long 3′
                                          UTRs directly by counteracting SRSF7, but also indirectly by maintaining high levels
                                          of cleavage factor Im (CFIm) via alternative splicing. Upon SRSF3 depletion, CFIm
                                          levels decrease and 3′UTRs are shortened. The indirect SRSF3 targets are particularly
                                          sensitive to low CFIm levels, because here CFIm serves a dual function; it enhances
                                          dPAS and inhibits pPAS usage by binding immediately downstream and assembling
                                          unproductive cleavage complexes, which together promotes long 3′UTRs.
                                          Conclusions: We demonstrate that SRSF3 and SRSF7 are direct modulators of pPAS
                                          usage and show how small differences in the domain architecture of SR proteins can
                                          confer opposite effects on pPAS regulation.
                                          Keywords: SRSF3, SRSF7, APA, FIP1, CFIm, pPAS, dPAS, iCLIP, MACE-seq, 3′UTR length

                                        © The Author(s). 2021 Open Access This article is licensed under a Creative Commons Attribution 4.0 International License, which
                                        permits use, sharing, adaptation, distribution and reproduction in any medium or format, as long as you give appropriate credit to
                                        the original author(s) and the source, provide a link to the Creative Commons licence, and indicate if changes were made. The
                                        images or other third party material in this article are included in the article's Creative Commons licence, unless indicated otherwise
                                        in a credit line to the material. If material is not included in the article's Creative Commons licence and your intended use is not
                                        permitted by statutory regulation or exceeds the permitted use, you will need to obtain permission directly from the copyright
                                        holder. To view a copy of this licence, visit http://creativecommons.org/licenses/by/4.0/. The Creative Commons Public Domain
                                        Dedication waiver (http://creativecommons.org/publicdomain/zero/1.0/) applies to the data made available in this article, unless
                                        otherwise stated in a credit line to the data.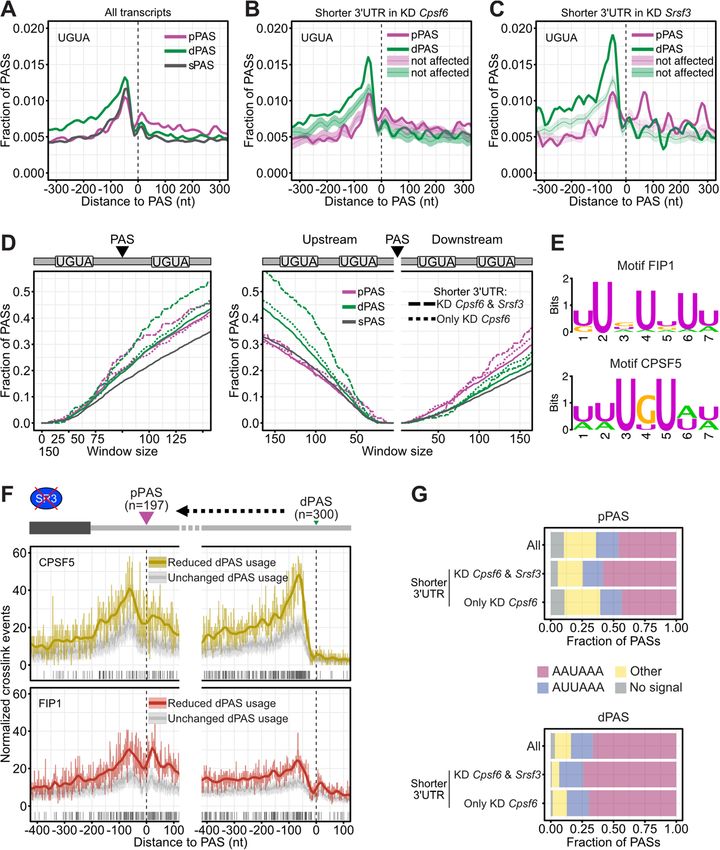
Schwich et al. Genome Biology   (2021) 22:82                                                                   Page 2 of 34

                 Background
                 Cleavage and polyadenylation (CPA) is an important step of gene expression that
                 results in the endonucleolytic cleavage of pre-mRNAs and the subsequent addition of a
                 non-templated poly(A) tail of ~ 150 nt by the poly(A) polymerase (PAP) [1]. CPA is
                 mediated by the recruitment of trans-acting factors to cis-acting sequence elements
                 within pre-mRNAs that are highly conserved and well defined [2]. At each polyadenyla-
                 tion site (PAS), the CPA machinery assembles from four subcomplexes—cleavage and
                 polyadenylation specificity factor (CPSF), cleavage stimulatory factor (CstF), cleavage
                 factor Im (CFIm), and IIm (CFIIm) [3]. The CPSF complex is composed of six subunits
                 (CPSF160 [CPSF1], CPSF100 [CPSF2], CPSF73 [CPSF3], CPSF30 [CPSF4], WDR33,
                 and FIP1 [FIP1L1]) and CstF of three subunits (CstF50 [CSTF1], CstF64 [CSTF2], and
                 CstF77 [CSTF3]). CPSF and CstF are sufficient to catalyze CPA in vitro [4, 5]. CPSF30
                 and WDR33 recognize the hexameric central sequence element (CSE), usually
                 AAUAAA [6, 7], CstF64 binds to GU-rich downstream sequence elements (DSEs) [8],
                 and CPSF73 acts as the endonuclease [9]. FIP1 binds to U-rich sequence elements
                 (USEs) upstream of PASs and recruits PAP. FIP1 binding switches PAP from a slow
                 into a fast, processive state [10]. CFIm is a tetramer consisting of two small 25 kDa sub-
                 units (CPSF5 [NUDT21]) and two large subunits of 68 kDa or 59 kDa (CPSF6 or
                 CPSF7) that bind CPSF5 separately or together [11–13]. The large subunits play a
                 structural role, bringing together the two CPSF5 subunits that each bind to a UGUA
                 sequence upstream of most PASs, thereby providing sequence specificity to the
                 complex [14, 15]. However, while CPSF6 enhances PAS usage through FIP1 recruit-
                 ment, CPSF7 does not stimulate CPA [16, 17]. CFIIm contains two subunits, PCF11
                 and CLP1, and has recently been shown to play a role in transcription termination [18].
                    Around 70% of all mammalian genes contain more than one PAS and express tran-
                 script isoforms that differ in the PASs that are used through a process termed alterna-
                 tive polyadenylation (APA) [19]. APA affects either the coding potential of transcripts
                 (CR-APA), when the PAS is located upstream of the stop codon, or the length of the 3′
                 untranslated region (3′UTR-APA) and hence the potential of mRNAs to be regulated
                 [20]. 3′UTR sequence elements regulate the stability, nuclear export, localization, and
                 translation efficiency of transcripts as well as the localization of their protein products
                 [21]. Dysfunctional APA has been implicated in various human diseases including
                 cancer [22, 23].
                    3′UTR-APA is regulated in cis through the intrinsic strength of alternative PASs,
                 which is determined by the sequence composition of their CSEs, DSEs, and USEs, the
                 number of UGUA motifs and their distance to the cleavage site, as well as the presence
                 of binding sites for additional APA regulators [24–26]. APA is also regulated in trans
                 through the levels of CPA complex subunits. For example, FIP1 promotes the usage of
                 proximal PASs (pPASs) and the generation of transcripts with short 3′UTRs, which is
                 important during stem-cell self-renewal [27]. In contrast, CFIm binds preferentially to
                 distal PASs (dPASs) and enhances their usage, promoting the expression of isoforms
                 with long 3′UTRs [28]. Accordingly, depletion of the CFIm subunits CPSF5 and CPSF6
                 causes global 3′UTR shortening [29, 30].
                    Beside core CPA factors, other RNA-binding proteins (RBPs) have been identified as
                 global 3′UTR-APA regulators. Interestingly, many of them are splicing factors, such as
                 CELF2, TARDBP, FUS, HNRNPC, and NOVA2 [19, 24, 31]. We have previously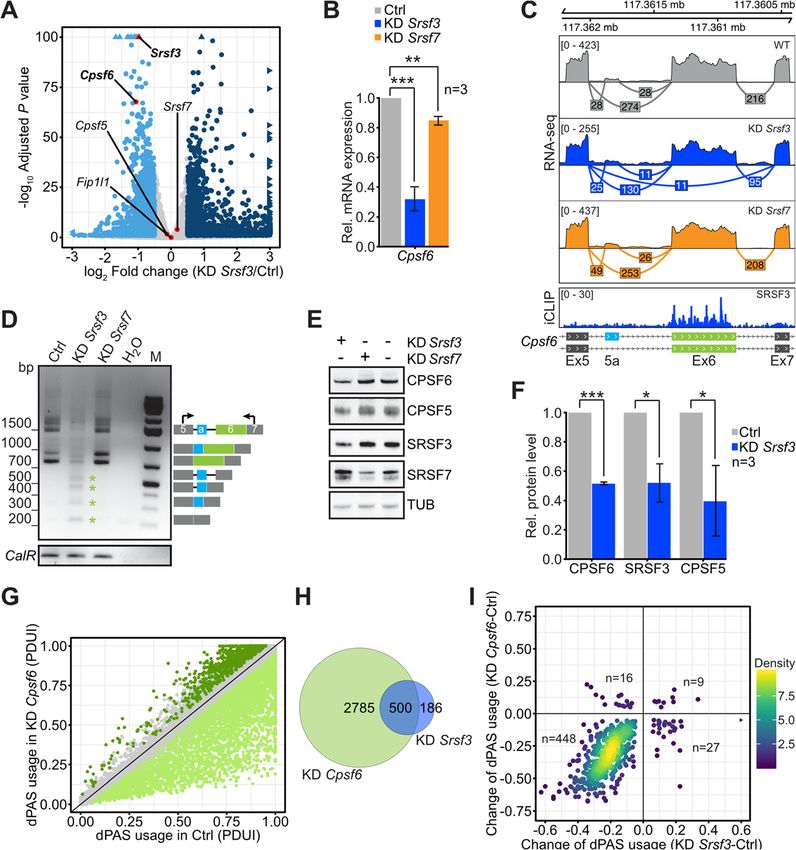
Schwich et al. Genome Biology   (2021) 22:82                                                                   Page 3 of 34

                 reported that two splicing factors, SRSF3 and SRSF7, connect APA to selective mRNA
                 export via recruitment of the mRNA export factor NXF1 [32]. The APA function of
                 SRSF3 was subsequently shown to regulate cellular senescence [33]. While SRSF3 is
                 already known to regulate the splicing of terminal exons and thereby CR-APA [34],
                 how SRSF3 and SRSF7 regulate 3′UTR-APA and whether this function depends on
                 splicing remain to be determined.
                    SRSF3 and SRSF7 are members of the SR protein family, which comprises 12 canon-
                 ical members [35]. Both proteins are very closely related and share a similar domain
                 architecture with one RNA recognition motif (RRM, 80% identical), a short linker
                 region for NXF1 interaction, and a region enriched in arginine-serine di-peptides called
                 RS domain [36–38]. Unlike SRSF3, SRSF7 contains an additional CCHC-type zinc (Zn)
                 knuckle domain that together with the RRM determines its distinct RNA-binding speci-
                 ficity [39–41]. In addition, the RS domain of SRSF7 is 66 amino acids longer and har-
                 bors a distinct hydrophobic stretch [41]. RS domains mediate protein-protein
                 interactions and, through phosphorylation and dephosphorylation of their serine resi-
                 dues, the splicing activity, nuclear import, subnuclear localization, and mRNA export
                 activity of SR proteins are regulated [42].
                    Here, we investigated the mechanisms underlying 3′UTR-APA regulation by SRSF3
                 and SRSF7. We found that both proteins bind upstream of pPASs but exert opposite
                 effects on the length of 3′UTRs. SRSF7 activates pPAS usage directly in a splicing-
                 independent manner via recruitment of FIP1, thus promoting short 3′UTRs. In con-
                 trast, SRSF3 promotes long 3′UTRs by inhibiting pPAS usage either directly or indir-
                 ectly by controlling the levels of active CFIm through alternative splicing. We found
                 that SRSF3-regulated 3′UTRs are particularly sensitive to low CFIm levels, because
                 CFIm inhibits pPAS usage and enhances dPAS usage in these transcripts. Given that
                 SRSF3 and SRSF7 both recruit NXF1 for mRNA export [32], their binding and action
                 at pPASs provide the means to sort mRNAs with different 3′UTR lengths for later
                 steps in cytoplasmic gene expression, such as RNA localization and translation.

                 Results
                 SRSF3 and SRSF7 exert opposite effects on 3′UTR length
                 To study the mechanisms of 3′UTR-APA regulation by SRSF3 and SRSF7, we first acquired
                 a comprehensive list of their APA targets in murine pluripotent P19 cells. We depleted each
                 protein individually using esiRNAs (endoribonuclease-prepared siRNAs; Additional file 1:
                 Fig. S1A) and sequenced poly(A) + RNA (50–60 million reads per sample). We used DaPars
                 to identify pPASs and to quantify their usage based on changes in read coverage [43].
                   Knockdown (KD) of Srsf3 significantly affected 3′UTR-APA of 686 genes (dif-
                 ference in percentage of distal poly(A) site usage index [|ΔPDUI|] ≥ 0.05, false
                 discovery rate [FDR] ≤ 0.1). Almost all targets showed an increased usage of the
                 pPAS, resulting in 3′UTR shortening (579 genes, 84%; Fig. 1a, b, Additional file 2:
                 Table S1). In contrast, Srsf7 KD enhanced dPAS usage and 3′UTR lengthening
                 (90 out of 134 genes, 67%). Despite the smaller number of genes affected by Srsf7
                 KD, there was a considerable overlap (55 genes; Fig. 1c, P value = 2.5e−41, Fish-
                 er’s exact test), with 17 genes being regulated antagonistically by SRSF3 and
                 SRSF7 (Fig. 1d). Analysis of the data with MISO TandemUTR annotations [44]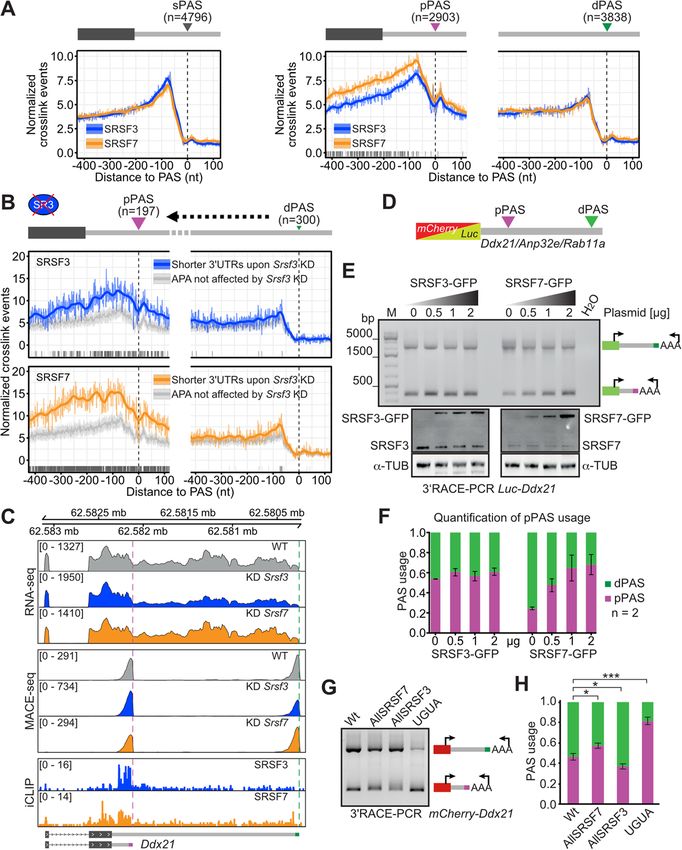
Schwich et al. Genome Biology       (2021) 22:82                                                                                     Page 4 of 34

                   Fig. 1 SRSF3 and SRSF7 exert opposite effects on 3′UTR length. a Scatter plots of percentage of distal
                   poly(A) site usage index (PDUI) in Srsf3 (left) and Srsf7 (right) KD and control (Ctrl) P19 cells. Significant
                   changes highlighted in blue and orange, respectively (adjusted P value ≤ 0.1, |ΔPDUI| ≥ 0.05). b Density plot
                   of differences in ΔPDUI for significant changes shown in a. Dashed lines indicate median. c, d Venn
                   diagram (c) and UpSet plot (d) of genes with significant changes in 3′UTR-APA after Srsf3 or Srsf7 KD.
                   Numbers of target genes and direction regulated by either SR protein are given below. e Semiquantitative
                   3′RACE-PCR of selected transcripts affected by Srsf3 or Srsf7 KD. Proximal (pPAS; pink) or distal (dPAS; green)
                   PAS usage as well as the positions of primers are indicated next to the gels. f Scheme of the MACE-seq
                   library preparation. RT, reverse transcription. g Pie chart of protein-coding genes harboring one, two, three,
                   or more PASs identified by MACE-seq. h Stacked bar charts show the proportion of PASs associated with a
                   given CSE in gene categories as in c. Analyzed PASs included single (sPASs), pPASs, dPASs, and other
                   PASs (oPASs)

                 confirmed the trend of 3′UTR shortening and lengthening upon Srsf3 and Srsf7
                 KD, respectively (Additional file 1: Fig. S1B, Additional file 3: Table S2). SRSF3
                 target genes with shortened 3′UTRs were enriched for functions related to cell
                 cycle progression and chromosome segregation (Additional file 1: Fig. S1C), indi-
                 cating that SRSF3 regulates cell proliferation and growth via 3′UTR length con-
                 trol, as suggested in a previous study [33]. Changes in 3′UTR length were
                 validated for six genes that were antagonistically regulated by SRSF3 and SRSF7
                 using semi-quantitative 3′RACE-PCR (rapid amplification of cDNA ends; Fig. 1e).
                 As observed in the DaPars/MISO analyses, Srsf3 KD promoted the use of their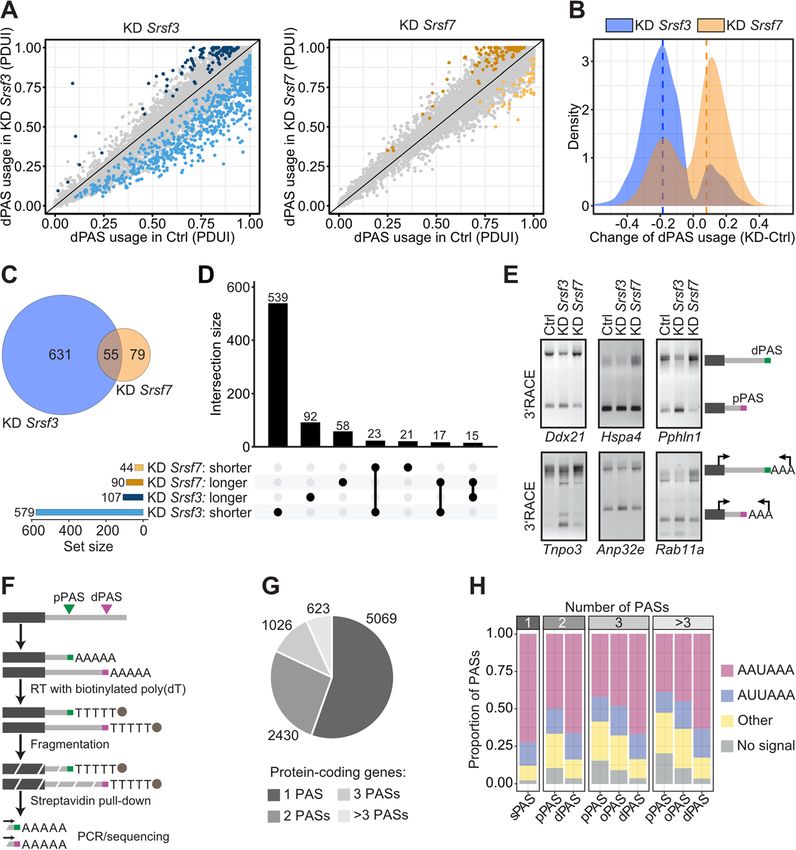
Schwich et al. Genome Biology    (2021) 22:82                                                                        Page 5 of 34

                 pPASs and Srsf7 KD the use of their dPASs. We concluded that SRSF3 and
                 SRSF7 have opposite effects on 3′UTR-APA in hundreds of cellular transcripts
                 and act antagonistically on a subset of targets.
                    In order to precisely map the PASs used in murine pluripotent P19 cells, we per-
                 formed MACE-seq (massive amplification of cDNA ends), a high-throughput 3′end
                 sequencing method that enables the identification of PASs at single-nucleotide reso-
                 lution [45, 46] (Fig. 1f). MACE-seq was performed with RNA from control, Srsf3 and
                 Srsf7 KD cells to capture all PASs that are used in these conditions (Additional file 1:
                 Fig. S1D). For PAS mapping, we pooled all MACE-seq samples and used a customized
                 analysis pipeline to remove priming artifacts (Additional file 1: Fig. S1E, see the
                 “Methods” section). We identified a total of 15,866 high-confidence PASs mapping to
                 9148 genes. Most PASs were found in protein-coding genes (15,805), within their 3′
                 UTRs (13,706) (Additional file 1: Fig. S1F, S1G).
                    The majority of protein-coding genes (5069 genes, 55%) used only a single PAS (sPAS) in
                 murine P19 cells. However, 4079 protein-coding genes (45%) showed clear evidence for APA,
                 with 2430, 1026, and 623 genes harboring two, three, or more PASs, respectively (Fig. 1g).
                 Depending on their relative position, we assigned the first, last, and intermediate PASs within
                 each 3′UTR as proximal (pPAS), distal (dPAS), and other (oPAS), respectively. The PAS posi-
                 tions agreed well with GENCODE annotations (version M18), as most PASs (61%) mapped
                 within 25 nt of an annotated transcript 3′end (Additional file 1: Fig. S1H, S1I). In addition, we
                 detected 6207 PASs that were further downstream and likely belonged to non-annotated
                 alternative isoforms (Additional file 1: Fig. S1H, S1I).
                    Screening for the 18 known CSE motifs [24] upstream of all PASs used in P19 cells,
                 we found that 93% of all PASs contained a CSE variant (Additional file 1: Fig. S1J). The
                 canonical AAUAAA hexamer was most common (59.5%), followed by the variants
                 AUUAAA (19.9%), UAUAAA (7.4%), AAGAAA (6.3%), and AAUAUA (5.4%). In genes
                 with multiple PASs, AAUAAA was predominantly found at dPASs, whereas alternative
                 CSEs were predominant at pPASs and oPASs (Fig. 1h). This is in line with previous
                 studies suggesting that pPASs are generally weaker and subject to regulation, while
                 dPASs are stronger and used by default [47]. Similarly, almost 90% of sPASs harbored
                 one of the two most frequent CSEs, indicating that sPASs are strong and well-defined
                 in motif composition. Our data represent the first atlas of PAS positions and CSE com-
                 position in mouse pluripotent P19 cells and suggest that almost half of all expressed
                 genes generate more than one 3′UTR isoform, indicating extensive gene expression
                 regulation at the level of 3′UTR-APA.

                 SRSF7 binds preferentially at pPASs and modulates their usage in a splicing-independent
                 manner
                 To investigate whether SRSF3 and SRSF7 directly affect 3′UTR-APA, we compared
                 their binding at our mapped sPASs, pPASs, and dPASs using our previously published
                 iCLIP (individual-nucleotide resolution UV crosslinking and immunoprecipitation) data
                 sets obtained from P19 cells [32]. In line with a direct involvement in CPA, both pro-
                 teins showed a pronounced binding peak ~ 75 nt upstream of sPASs, pPASs, and dPASs
                 in a metaprofile analysis (Fig. 2a). An additional, minor binding peak was present ~ 20
                 nt downstream of all PASs and especially conspicuous at pPASs. In genes that undergo
Schwich et al. Genome Biology       (2021) 22:82                                                                                     Page 6 of 34

                   Fig. 2 SRSF7 binds preferentially at pPASs and modulates their usage in a splicing-independent manner. a
                   Metaprofiles of normalized iCLIP crosslink events of SRSF3 and SRSF7 around sPASs (left), pPASs and dPASs
                   (right). Raw signal and loess smoothing are shown. Positions with a significant signal difference between SRSF3
                   and SRSF7 are marked below (false discovery rate [FDR] ≤ 0.01, two-proportions z-test). b Metaprofiles of
                   normalized iCLIP crosslink events of SRSF3 and SRSF7 around pPASs and dPASs of transcripts with shorter 3′
                   UTRs upon Srsf3 KD (SRSF3 targets) compared to randomly sampled PASs that are not affected by Srsf3 KD. Raw
                   signal and loess smoothing are shown. Significant differences in SRSF3 and SRSF7 binding are computed by a
                   z-score approach. Positions with FDR ≤ 0.01 are indicated below. c Genome browser view of the Ddx21 3′UTR:
                   Top: RNA-seq coverage in control conditions and after Srsf3 and Srsf7 KD. Middle: MACE-seq coverage at the
                   pPAS and dPAS. Bottom: iCLIP crosslink events of SRSF3 and SRSF7. Merged replicates are shown for all
                   datasets. d Scheme of reporter genes. mCherry and Luciferase (Luc) were fused with endogenous 3′UTRs of
                   Ddx21, Anp32e, and Rab11a. e Semiquantitative 3′RACE-PCR (top) of Luc-Ddx21 reporter upon SRSF3-GFP or
                   SRSF7-GFP overexpression, validated by Western blot (bottom). Antibody against α-tubulin (α-TUB) was used as
                   loading control. f Quantification of 3′RACE-PCRs (n = 2) of Luc-Ddx21 reporter transcripts upon SRSF3-GFP and
                   SRSF7-GFP overexpression. Data are represented as mean ± standard deviation of mean. g Semiquantitative 3′
                   RACE-PCR of transiently expressed mutated mCherry-Ddx21 reporters. h Quantification of 3′RACE-PCRs (n = 3) of
                   mutated mCherry-Ddx21 reporter transcripts. Data are represented as mean ± standard deviation of mean.
                   Student’s t test, *P value < 0.05, ***P value < 0.0005

                 3′UTR-APA, both proteins showed a strong preference for pPASs, where binding of
                 SRSF7 exceeded that of SRSF3. In contrast, binding of both proteins was similar at
                 sPASs and dPASs. To confirm that this is also true for genes whose APA is regulated
                 by SRSF3 and SRSF7, we integrated the PAS coordinates from MACE-seq with 3′UTR
Schwich et al. Genome Biology   (2021) 22:82                                                                   Page 7 of 34

                 changes from the DaPars analysis and precisely mapped PASs for 361 out of 686 SRSF3
                 targets (Additional file 1: Fig. S2A, S2B). Indeed, binding of both SRSF3 and SRSF7 was
                 much more frequent at SRSF3-regulated pPASs, compared to pPASs that are not
                 affected by Srsf3 KD, but there was no binding difference at dPASs (Fig. 2b). This sug-
                 gests that the pPAS is the primary point of APA regulation by SRSF3 and SRSF7 and
                 that both proteins might compete here for binding. To further strengthen this idea, we
                 tested whether the binding motifs of SRSF3 (CNYC, C, cytosine; N, any nucleotide; Y,
                 pyrimidine) and SRSF7 (GAY, G, guanine; A, adenine) are enriched around sPASs,
                 pPASs, and dPASs [32, 48]. We generally observed an enrichment of both motifs up-
                 stream of sPASs and pPASs (Additional file 1: Fig. S2C, S2F), suggesting that both pro-
                 teins can actively bind to pPASs rather than being recruited by other proteins. Of note,
                 the SRSF7 binding motif GAY was particularly enriched at SRSF3-regulated pPASs
                 compared to unregulated pPASs (Additional file 1: Fig. S2G), reflecting its enhanced
                 binding at these sites in our iCLIP data (Fig. 2b). A similar pattern could not be
                 observed for the SRSF3 binding motif CNYC motif (Additional file 1: Fig. S2D). In
                 contrast, none of the motifs were enriched at dPASs (Additional file 1: Fig. S2E, S2H),
                 underlining that pPASs are the regulatory hotspots of APA regulation by SRSF3 and
                 SRSF7.
                   To test whether APA regulation by SRSF3 and SRSF7 is splicing-dependent, we
                 selected three validated target genes—Ddx21, Anp32e, and Rab11a (Fig. 1e)—for a
                 reporter gene study. All three genes showed increased pPAS usage upon Srsf3 KD,
                 increased dPAS usage upon Srsf7 KD, and binding of both proteins upstream of the
                 pPAS (Fig. 2c, Additional file 1: Fig. S2I, S2J). We fused the complete 3′UTRs (includ-
                 ing 150 nt downstream of the dPASs) to two distinct reporter genes, encoding Firefly
                 Luciferase (Luc) and mCherry (Fig. 2d). After transfection into P19 cells, pPAS usage
                 was determined by 3′RACE-PCR. All reporter constructs produced alternative 3′UTR
                 isoforms of similar length as the endogenous genes (Additional file 1: Fig. S3A, S3B).
                 Importantly, Srsf3 KD caused similar changes in pPAS usage in reporter transcripts and
                 their endogenous counterparts (Additional file 1: Fig. S3C, S3D). The effect of the Srsf7
                 KD could be recapitulated in some but not all cases. Since the reporter constructs did
                 not contain any introns, the observed 3′UTR changes indicated that 3′UTR-APA regu-
                 lation by SRSF3 and SRSF7 is independent of splicing of the respective transcripts.
                   To evaluate the dose-response relationship of this regulation, we co-transfected the
                 Luc-Ddx21 reporter with increasing amounts of SRSF3-GFP and SRSF7-GFP expression
                 plasmids (Fig. 2e, f). Overexpression (OE) of SRSF7-GFP had the opposite effect of
                 Srsf7 KD and resulted in a concentration-dependent increase of the shorter Luc-Ddx21
                 3′UTR isoform (Fig. 2e, f). OE of SRSF3-GFP did not further increase the levels of the
                 longer Luc-Ddx21 isoform, but here the levels of SRSF3 might not have been sufficient.
                   We next tested whether the extent of binding upstream of pPASs by either SRSF3 or
                 SRSF7 directly affects pPAS usage. To do this, we converted all SRSF3 binding motifs
                 into SRSF7 binding motifs (allSRSF7) and vice versa (allSRSF3) within a region of 110
                 nt immediately upstream of the pPAS in the mCherry- and LUC-Ddx21 reporter genes
                 (Additional file 1: Fig. S3E). Of note, this region does not contain UGUA motifs. Con-
                 sistent with the results presented above, shifting the binding potential towards SRSF7
                 (allSRSF7) increased pPAS usage and shifting it to SRSF3 (allSRSF3) decreased pPAS
                 usage (Fig. 2g, h, Additional file 1: Fig. S3F). Importantly, single point mutations in the
Schwich et al. Genome Biology (2021) 22:82 Page 8 of 34
alternative CSE of the pPAS that strengthened it (AGUAAA to AAUAAA) completely
abrogated dPAS usage, whereas its weakening (AGUAAA to AGUAAG) [49] abrogated
pPAS usage (Fig. 2h, Additional file 1: Fig. S3F). Moreover, inserting one UGUA motif
in the absence of any SRSF3 and SRSF7 binding sites also strongly increased pPAS
usage (Fig. 2g, h). This suggests that an intermediate CSE and the absence of UGUA
motifs at the pPAS allow SRSF7 and SRSF3 to modulate its usage in opposite direc-
tions. Whereas SRSF7 enhances pPAS usage, SRSF3 inhibits pPAS usage in a binding-
and concentration-dependent manner.
SRSF7 interacts with FIP1 independently of RNA via its hypo-phosphorylated RS domain
The binding of SRSF3 and SRSF7 upstream of pPASs suggests that they might
interact with the CPA machinery. In line with this possibility, quantitative mass
spectrometry (MS) using TMT-labeling of immunopurified RNPs containing
SRSF3-GFP identified several CPA factors, including components of the CPSF com-
plex (FIP1, CPSF2, CPSF3, and WDR33) and CPSF5 from the CFIm complex
(Additional file 1: Fig. S4A, Additional file 4: Table S3). To confirm these interac-
tions, we performed semi-quantitative co-immunoprecipitations (Co-IPs) with and
without RNase treatment. We focused hereby on CPSF5 and CPSF6 from the CFIm
complex [28] and on FIP1 as representative of the CPSF complex, since CPSF6
and FIP1 both contain an RS-like domain (Additional file 1: Fig. S4B, S4C). We
generated P19 cell lines expressing GFP-tagged CPSF5, CPSF6, and FIP1 from gen-
omic loci (Additional file 1: Fig. S4D-G). Since CPSF5-GFP performed much better
than CPSF6-GFP in initial pulldown tests (data not shown), we used CPSF5-GFP
for the IP experiments.
CPSF5-GFP efficiently co-immunoprecipitated its CFIm complex partner CPFS6,
while the association of both proteins with the CPSF complex protein FIP1 was RNase-
sensitive (Fig. 3a, b). Both CPA factors co-immunoprecipitated SRSF3, but surprisingly,
the signal disappeared after RNase treatment, suggesting an indirect association via co-
bound (pre-)mRNAs. In contrast, SRSF7 was efficiently co-immunoprecipitated in the
presence of RNase, supporting a direct interaction of SRSF7 with both CPSF5 and
FIP1. The results were confirmed by reverse Co-IPs using GFP-tagged SRSF3 and
SRSF7 [32] as baits (Additional file 1: Fig. S4H, S4I). These data suggest that binding of
SRSF7 upstream of pPASs might enhance their usage through the recruitment of CPA
factors, whereas competitive binding to the same sites by SRSF3 might impair their
recruitment.
It was recently shown that the RS domain of CPSF6 is required for FIP1 recruitment
and dPAS activation [17]. RS domains are also the main protein-protein interaction
platforms of SR proteins [42], and their dimerization is regulated through phosphoryl-
ation/dephosphorylation of their serine residues [50]. To test whether SRSF7 recruits
CFIm and FIP1 via its RS domain, we generated C-terminal fusions of the tetracycline
repressor protein (TetR) with the RS domain of either SRSF3 (RS3) or SRSF7 (RS7).
We included variants of SRSF7’s RS domain in which all serine residues were ex-
changed for alanine (RA7) or aspartate (RD7) residues, thereby mimicking hypo- and
hyper-phosphorylated RS domains, respectively (Fig. 3c). TetR constructs were trans-
fected into GFP-FIP1 and CPSF5-GFP cell lines, and expression and phosphorylation ofSchwich et al. Genome Biology (2021) 22:82 Page 9 of 34
Fig. 3 SRSF7 interacts RNA-independently with FIP1 via its hypo-phosphorylated RS domain. a, b Co-
immunoprecipitations (Co-IPs) using GFP-tagged cleavage factors FIP1 (a) and CPSF5 (b): proteins were
pulled-down by α-GFP antibodies and probed for interaction partners using specific antibodies. Lysates
were treated with (+RNase) or without (−RNase) RNase A prior to IPs. PABPN1 served as a control for RNA
degradation. Inp, input; IP, immunoprecipitation; IgG, unspecific antibody control. c Scheme of tetracyclin
repressor (TetR) protein fused to RS domains of SRSF3 (RS3), SRSF7 (RS7), or phosphomimetic (RD7) and
non-phosphorylatable (RA7) versions of SRSF7. d, e Co-IPs for TetR using GFP-FIP1 (d) and CPSF5-GFP (e)
cell lines: Proteins were pulled-down by α-GFP antibodies and probed for interaction with TetR-fusion
proteins using α-TetR antibodies. RNase A treatment and loading control as in a. f Scheme of mCherry
fused to the complete coding sequence of WT SRSF7[RS] or its variants SRSF7[RD]/[RA]. g, h Co-IPs using
GFP-FIP1 (g) and CPSF5-GFP (h) cell lines: Proteins were pulled-down by α-GFP antibodies and probed for
interaction with mCherry fusion proteins using an α-mCherry antibody. RNase A treatment and loading
control as in (a)
all protein chimeras were verified by Western blot following phosphatase treatment
(Additional file 1: Fig. S5A, S5B).
Co-IPs confirmed that the RS domain of SRSF7 (RS7) was sufficient to mediate
interaction of TetR with GFP-FIP1 (Fig. 3d). Strikingly, this interaction was main-
tained with the RA7 variant but lost with the RD7 variant, suggesting that FIP1
interacts preferentially with the hypo-phosphorylated RS domain of SRSF7. In lineSchwich et al. Genome Biology (2021) 22:82 Page 10 of 34
with this, SRSF7 that co-immunoprecipitated with GFP-FIP1 appeared hypo-
phosphorylated as it did not react with mAb104, an antibody that recognizes exclu-
sively hyper-phosphorylated domains of SR proteins (see p-SRSF7 in Fig. 3a) [51].
In contrast, the isolated RS domain of SRSF7 was not sufficient to promote inter-
action of TetR with CPSF5, regardless of its phosphorylation state (Fig. 3e). This
suggested that interaction of SRSF7 with CPSF5 requires its RNA-binding domain.
In line with the results described above, the isolated RS domain of SRSF3 (RS3)
did not promote interaction of TetR with GFP-FIP1 or CPSF5-GFP in P19 cells
(Fig. 3d, e).
To assess whether binding of SRSF7 to CPSF5 is also phosphorylation-dependent, we
made full-length SRSF7 constructs (mCherry-SRSF7[RS]) and replaced all serine resi-
dues within the RS domain with either alanine (mCherry-SRSF7[RA]) or glutamate
(mCherry-SRSF7[RD]) residues (Fig. 3f). Expression of the fusion proteins was verified
by confocal fluorescence microscopy and Western blot (Additional file 1: Fig. S5C,
S5D). As expected, mCherry-SRSF7[RS] and mCherry-SRSF7[RD] localized to the nu-
cleus, where they were enriched in nuclear speckles. However, mCherry-SRSF7[RA] pre-
dominantly mislocalized to nucleoli likely due to the high positive charge of the RA
domain and was therefore excluded from the Co-IP analyses (Additional file 1: Fig.
S5D). Confirming that FIP1 preferentially associates with hypo-phosphorylated SRSF7,
GFP-FIP1 co-immunoprecipitated with mCherry-SRSF7[RD] less efficiently than
mCherry-SRSF7[RS] (Fig. 3g). Surprisingly, however, CPSF5-GFP co-
[RD] [RS]
immunoprecipitated more efficiently with mCherry-SRSF7 than mCherry-SRSF7 ,
suggesting that CPSF5 rather associates with hyper-phosphorylated SRSF7 (Fig. 3h, see
also p-SRSF7 in Fig. 3b).
The CFIm complex is a hetero-tetramer of two CPSF5 and two CPSF6/7 subunits
[11]. We hypothesized that SRSF7 might replace CPSF6 in a subpopulation of CFIm
complexes, because (i) CPSF6 and SRSF7 have similar domain structures, (ii) CPSF6
interaction with CPSF5 also requires its RRM domain, and (iii) CPSF6 also recruits
FIP1 via its hypo-phosphorylated RS domain [16, 17]. To test this, we depleted CPSF6
from GFP-FIP1-expressing cell lines and performed Co-IPs. The interaction between
FIP1 and SRSF7 was unchanged, while the interaction with CPSF5 was lost (Additional
file 1: Fig. S5E-G). This confirmed that CPSF5 interacts with FIP1 via CPSF6 and sug-
gested that SRSF7 and FIP1 interact directly and do not require CFIm.
Taken together, these results suggest that the RS domain of SRSF7 is sufficient for
recruiting FIP1. The interaction does not require CFIm or bound RNA but dephos-
phorylation of SRSF7’s RS domain. In contrast, interaction of SRSF7 with CPSF5
requires its RNA-binding domain and hyper-phosphorylation of its RS domain.
Two SRSF7-specific protein features promote its interaction with CPA factors
To understand why SRSF7 interacts directly with CPA factors while SRSF3 does not,
we asked whether some features specific to SRSF7 might confer this recruitment.
SRSF3 and SRSF7 are closely related and structurally similar, with nearly identical RRM
domains [36]. However, SRSF7 contains an additional Zn knuckle for RNA binding
[40] and has a longer RS domain, which is interrupted by a stretch of 27 amino acids
(27aa) enriched in hydrophobic residues [52] (Fig. 4a). We have recently shown thatSchwich et al. Genome Biology (2021) 22:82 Page 11 of 34
inclusion of this 27aa stretch is regulated by alternative splicing and promotes
oligomerization of SRSF7, leading to the formation of nuclear bodies involved in auto-
regulation of SRSF7 expression [41]. Moreover, inactivation of the Zn knuckle in SRSF7
changes its RNA-binding preference from GAY to CNYC, the binding motif of SRSF3
[39, 41]. To assess the impact of these SRSF7-specific protein features (27aa stretch, Zn
knuckle) on the interaction with CPA factors, we used stable P19 cell lines expressing
GFP-tagged SRSF7 variants either lacking the 27aa stretch (Δ27aa) or containing an
inactive Zn knuckle (mutZn) [41] (Fig. 4b). Expression, subnuclear localization and
phosphorylation of the SRSF7 variants were verified by Western blot and confocal
fluorescence microscopy (Additional file 1: Fig. S6A, B, D).
Strikingly, both mutants interacted much less with CPSF5 and FIP1 as determined by
Co-IPs with RNase treatment (Fig. 4c), suggesting that the 27aa stretch and the Zn
knuckle both contribute to SRSF7’s interaction with the CPA factors. To test whether
these features are sufficient to promote the interactions, we transferred the 27aa stretch
and the Zn knuckle (separately and in combination) to the corresponding positions in
SRSF3 in a domain-swap experiment (Fig. 4d). The chimeric constructs were transi-
ently transfected into P19 cells, and their expression, subcellular localization, and phos-
phorylation were verified (Additional file 1: Fig. S6C, E, F). Chimeric SRSF3 proteins
were often expressed at much lower levels than wild-type SRSF3-GFP in Co-IP trans-
fection experiments (Fig. 4e), but taking this into account, the Co-IPs suggest that
inserting the 27aa stretch alone into SRSF3 (SRSF3-27aa) increases its association with
CPSF5, CPSF6, and FIP1 (Fig. 4e, Additional file 1: Fig. S7A). Insertion of the Zn
knuckle alone (SRSF3-Zn) or in combination with the 27aa stretch (SRSF3-ZnF + 27aa)
did not enhance CPA factor interactions visibly (Fig. 4e, Additional file 1: Fig. S7A).
Despite this, transient OE of SRSF3-ZnF + 27aa chimeras increased pPAS usage in
SRSF7 APA targets, similar to OE of SRSF7 (Figs. 2e and 4f, Additional file 1: Fig. S7C).
When endogenous Srsf7 was concomitantly depleted, this pPAS enhancement was
abolished (Fig. 4f, Additional file 1: Fig. S7B, C). In contrast, OE of SRSF3 containing the
27aa hydrophobic stretch alone had no effect on pPAS usage, indicating that both
sequence-specific binding via the Zn knuckle and enhanced FIP1 interaction via the 27aa
stretch are required for pPAS activation. Based on these targeted deletions and domain-
swap experiments, we conclude that the hydrophobic 27aa stretch and the Zn knuckle,
which are absent in SRSF3, contribute to the recruitment of CPA factors and
pPAS enhancement and therefore to the functional diversification of SRSF3 and SRSF7
in APA.
SRSF7 levels decrease and 3′UTRs are globally extended during neuronal differentiation
The CPA factor FIP1 was recently implicated in the maintenance of pluripotency and
renewal of mouse embryonic stem cells. During differentiation, FIP1 is downregulated
with a concomitant global 3′UTR lengthening [27]. To test whether SRSF3 and SRSF7
might also regulate pluripotency via APA, we differentiated pluripotent P19 cells into
neuronal cells [53]. On day 8 of differentiation, the cells had adopted the characteristic
neuronal morphology reflected by the presence of multiple neurites (Fig. 5a), expres-
sion of the neuronal marker Synapsin 1, and complete loss of the pluripotency tran-
scription factor OCT4 (Fig. 5b). Importantly, the protein levels of FIP1 and SRSF7Schwich et al. Genome Biology (2021) 22:82 Page 12 of 34
Fig. 4 Two SRSF7-specific protein features promote its interaction with CPA factors. a Alignment (Clustal Omega)
of SRSF3 (amino acids [aa] 1–164) and SRSF7 proteins (aa 1–238). Protein domains are highlighted in dark gray
(RRM), light gray (linker domain), olive (CCHC-type Zn knuckle), and light brown (RS domain). The 27 aa stretch is
highlighted in bold with hydrophobic residues marked in red. Cysteine residues mutated to alanine in Zn knuckle
in SRSF7-mutZn are marked with asterisks. b Scheme of GFP-tagged SRSF7 mutants stably expressed in P19 cells. c
Co-IPs using GFP-tagged SRSF7/SRSF7-Δ27aa/SRSF7-mutZn cells with RNase A treatment: Proteins were pulled-
down by α-GFP antibodies and probed for CPA factors using specific antibodies. PABPN1 served as a control for
RNA degradation. IP, immunoprecipitation; IgG, unspecific antibody control. d Scheme of GFP-tagged SRSF3
chimeras harboring Zn knuckle, 27 aa stretch of SRSF7, or both. e Co-IPs using GFP-tagged SRSF3 chimeras:
Proteins were pulled-down by α-GFP antibodies and probed for CPA factors using specific antibodies. Lysates
were treated with (+RNase) or without (−RNase) RNase A prior to IPs. PABPN1 served as a control for RNA
degradation. Inp, input. Samples without RNase A treatment are shown in Fig. S7A. f Quantification of 3′RACE-PCRs
(n = 3) of Hspa4, Pphln1, and Tnpo3 transcripts in Ctrl and Srsf7 knockdown P19 cells transiently overexpressing
SRSF3-27aa and SRSF3-27aa + ZnF chimeric proteins. Data are represented as mean ± standard deviation of mean.
Student’s t test, *P value < 0.05Schwich et al. Genome Biology (2021) 22:82 Page 13 of 34
decreased by ~ 3-fold, while CPSF6 and SRSF3 levels appeared unchanged (Fig. 5b).
We performed RNA-seq from undifferentiated (Undiff) and differentiated (Diff) cells (3
replicates) and analyzed the data with DESeq2 [54] and DaPars [43]. Srsf7 and Fip1l1
(encoding the protein FIP1) mRNA levels were only slightly decreased in differentiated
cells (1.65- and 1.33-fold; Fig. 5c, Additional file 5: Table S4), suggesting that their low
protein levels are caused by reduced translation and/or protein stability. In agreement
with previous studies [55, 56], we observed a global shift to dPAS usage in differenti-
ated P19 cells (Fig. 5d, Additional file 6: Table S5). This suggested that in pluripotent
P19 cells, pPASs are preferentially used. Consistent with SRSF7 being a pPAS-
enhancing protein, the majority of transcripts with extended 3′UTRs in differentiated
cells showed a similar trend after Srsf7 KD, although most changes did not pass the sig-
nificance thresholds of our DaPars analysis (Fig. 5e, f). Importantly, transcripts with ex-
tended 3′UTRs in differentiated cells were highly enriched for binding of SRSF7 at
their pPASs in undifferentiated cells (Fig. 5g). In contrast, SRSF3 binding was not
enriched at these pPASs and the targets seemed anti-correlated after Srsf3 KD (Fig. 5g,
Additional file 1: Fig. S8A).
We conclude that high concentrations of factors that enhance pPAS usage, such as
FIP1 and SRSF7, promote their usage under certain conditions, such as pluripotency.
The downregulation of these factors in differentiated cells leads to the increased usage
of the stronger dPASs and the expression of transcripts with longer 3′UTRs.
SRSF3 promotes dPAS usage by maintaining high levels of CFIm
Our data so far suggest that SRSF3 might prevent SRSF7 from recruiting CPA factors
to some pPASs through competitive binding. But this is likely not the sole mechanism
by which SRSF3 regulates 3′UTR-APA, since the number of genes with changes in 3′
UTR length is 5-fold higher upon Srsf3 KD than Srsf7 KD (Fig. 1c). One possibility
would be that SRSF3 regulates 3′UTR-APA also indirectly through modulating the
levels of CPA factors.
To investigate this, we quantified changes in the expression of CPA factors in
our RNA-seq data using DESeq2 (Additional file 1: Fig. S8B). Strikingly, Srsf3 KD
reduced the levels of Cpsf6 transcripts by 2-fold, while no other CPA factor was
affected (Fig. 6a). Decreased Cpsf6 transcript levels were confirmed by RT-qPCR
(~ 3-fold; Fig. 6b). Srsf7 KD had only a minor effect on Cpsf6 levels and did not
affect the levels of any other CPA factor (Fig. 6b, Additional file 1: Fig. S8B).
To investigate how SRSF3 depletion decreases Cpsf6 mRNA levels, we analyzed
its splicing pattern using RNA-seq data (Fig. 6c). We observed multiple splicing
alterations within the Cpsf6 transcripts upon Srsf3 KD, such as increased inclusion
of a small alternative exon within intron 5 (termed ‘exon 5a’, 111 nt), the skipping
of exon 6, and the retention of intron 6 (Fig. 6c). Transcripts including exon 5a
likely encode an alternative CPSF6 protein isoform of 72 kDa (CFIm-72) whose
functional difference from the main isoform of 68 kDa (CFIm-68) is not known.
Skipping of exon 6 introduces a frameshift resulting in non-productive transcripts.
iCLIP data showed that SRSF3 bound massively to exon 6, suggesting that it
directly promotes its inclusion (Fig. 6c).Schwich et al. Genome Biology (2021) 22:82 Page 14 of 34
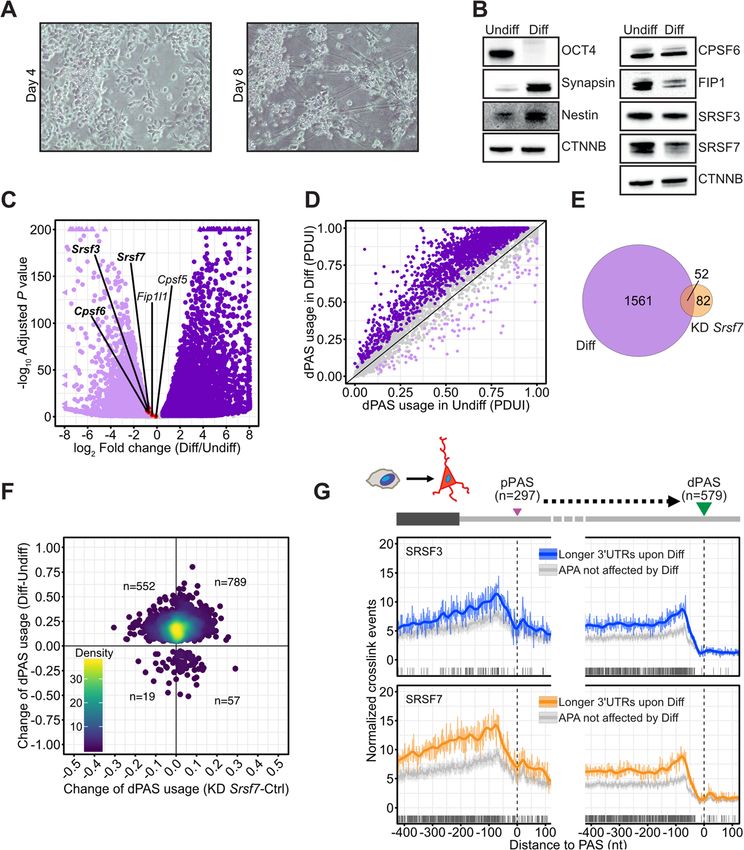
Fig. 5 SRSF7 levels decrease and 3′UTRs are globally extended during neuronal differentiation. a
Morphological changes of P19 cells during neuronal differentiation monitored by bright field microscopy at
days 4 and 8 after initiation. b Western blot to monitor P19 differentiation using antibodies specific for the
pluripotency factor OCT4 and the neuronal markers Synapsin 1 and Nestin. Protein levels of SRSF3, SRSF7,
FIP1, and CPSF6 were analyzed using specific antibodies. β-catenin (CTNNB) was used as loading control. c
Volcano plot of differential gene expression upon P19 differentiation analyzed by DESeq2. Significant genes
(adjusted P value ≤ 0.1, log2-transformed fold change ≥ 0.5) are highlighted in purple. Genes of CPA factors,
Srsf3 and Srsf7, are indicated with significant changes highlighted in bold. d Scatterplot of PDUIs in
undifferentiated and differentiated P19 cells. Genes with significant changes in 3′UTR-APA (adjusted P value
≤ 0.1, |ΔPDUI| ≥ 0.05) are highlighted in purple. e Venn diagram showing overlap of genes with changes in
3′UTR length upon differentiation or Srsf7 KD. f Scatter plot comparing dPAS usage upon differentiation and
Srsf7 KD for all genes with significant changes in 3′UTR-APA upon differentiation as in d, irrespective of their
regulation upon Srsf7 knockdown. Number of genes given in each quadrant, excluding data points on axes.
g Metaprofiles of normalized iCLIP crosslink events of SRSF3 and SRSF7 around pPASs and dPASs of
transcripts with extended 3′UTRs upon differentiation compared to randomly sampled PASs that are not
affected. Raw signal and loess smoothing are shown. Significant differences in SRSF3 and SRSF7 binding are
computed by a z-score approach. Positions with FDR ≤ 0.01 are indicated belowSchwich et al. Genome Biology (2021) 22:82 Page 15 of 34
Fig. 6 SRSF3 promotes dPAS usage by maintaining high levels of CFIm. a Volcano plot of differential gene
expression after Srsf3 KD analyzed by DESeq2. Significant genes (adjusted P value ≤ 0.1, log2-transformed
fold change ≥ 0.5) are highlighted in blue. Genes of CPA factors, Srsf3 and Srsf7, are indicated with
significant changes highlighted in bold. b Quantification of Cpsf6 mRNA levels after KD of Srsf3 and Srsf7 by
RT-qPCR. Data are represented as mean ± stDev. n = 3, Student’s t test. ***P value < 0.005, **P value < 0.01.
c Top: Sashimi plots and coverage of RNA-seq reads mapping to Cpsf6 exons 5 to 7 in control samples (WT,
gray) and after KD of Srsf3 (blue) and Srsf7 (orange). Bottom: Genome browser view of iCLIP crosslink events
of SRSF3 from P19 cells in the same region. Small alternative exon within intron 5 (termed ‘exon 5a’, 111 nt)
indicated in light blue. d RT-PCR after KD of Srsf3 and Srsf7 using primers in exons 5 and 7 of Cpsf6. Cpsf6
isoforms corresponding to the PCR amplicons are indicated beside gel. Shorter exon 6-skipped isoforms are
indicated with asterisks. CalR amplicons served as control for cDNA integrity. e Western blot using P19 cell
lysates after KD of Srsf3 and Srsf7. Protein levels of CPSF5, CPSF6, SRSF3, and SRSF7 were assayed using
specific antibodies. Alpha-tubulin was used as loading control. f Quantification of CPSF6, CPSF5, and SRSF3
protein levels from Western blots. n = 3. Student’s t test. ***P value < 0.001, *P value < 0.05. g Scatterplot of
PDUIs in P19 control cells (Ctrl) and after Cpsf6 KD. Genes with significant changes in 3′UTR-APA (adjusted
P value ≤ 0.1) are highlighted in green. h Overlap of genes with shortened 3′UTRs after KD of Srsf3 or Cpsf6.
i Scatter plot comparing dPAS usage of KD Srsf3 and Cpsf6
The appearance of various shorter Cpsf6 transcript isoforms with skipped exon 6
after Srsf3 KD was confirmed using semi-quantitative RT-PCR and sequencing (see
asterisks in Fig. 6d). This was accompanied by a drastic reduction in the levels of both
transcript isoforms encoding full-length CPSF6 proteins (68 and 72 kDa). Importantly,
Srsf3 KD—but not Srsf7 KD—also resulted in ~ 2-fold decreased CPSF6 protein levelsSchwich et al. Genome Biology (2021) 22:82 Page 16 of 34
(Fig. 6e, f). CPSF5 was downregulated to a similar extent, in line with previous studies
reporting that both proteins stabilize each other [11, 14].
In human cells, it was shown that CFIm binds preferentially upstream of dPASs
and enhances their usage through a direct recruitment of FIP1 [17]. As a result,
CPSF5 and CPSF6 depletion both lead to a global switch to pPAS usage [29, 30].
RNA-seq after KD of Cpsf6 from mouse P19 cells also revealed a globally enhanced
pPAS usage (Fig. 6g, Additional file 1: Fig. S8C, Additional file 8: Table S7) and
clearly mimicked Srsf3 KD by affecting the majority of SRSF3 APA targets in the
same way (457 out of 686, 67%; Fig. 6h, i). Yet, a far greater number of transcripts
got shorter 3′UTRs upon Cpsf6 KD than Srsf3 KD (2711 vs. 579; Additional file 1:
Fig. S8D), presumably due to a more efficient depletion of CPSF6 upon Cpsf6 KD
compared to Srsf3 KD (80% vs. 50% depletion). The similar regulation of 3′UTR-
APA by SRSF3 and CPSF6 was validated for three target genes by 3′RACE-PCR
(Additional file 1: Fig. S8E).
To confirm that SRSF3 affects 3′UTR length indirectly via CPSF6, we transiently
overexpressed CPSF6-myc in SRSF3-depleted cells to rescue CPSF6 levels (Additional
file 1: Fig. S8F). 3′RACE-PCR revealed that 3′UTR shortening of Ddx21 and Anp32e
could not be rescued by ectopic CPSF6 expression, suggesting that these transcripts are
direct SRSF3 targets. Rab11a, Phpln1, and Tnpo3 reacted to CPSF6 OE with increased
dPAS usage, which partially counteracted the 3′UTR shortening triggered by the Srsf3
KD (Additional file 1: Fig. S8G). However, the effects were small and the rescue was in-
complete, likely because the CPSF5 levels remained low in the transient CPSF6 OE
(Additional file 1: Fig. S8F).
These observations argue for two distinct modes of 3′UTR-APA regulation by SRSF3.
On the one hand, SRSF3 inhibits pPAS usage directly through competitive binding with
pPAS enhancer proteins. On the other hand, SRSF3 indirectly promotes dPAS usage by
ensuring the productive splicing of mRNAs encoding CPSF6, a key component of the
dPAS enhancer CFIm.
CFIm inhibits pPAS usage through unproductive FIP1 recruitment in SRSF3-regulated
transcripts
SRSF3 3′UTR-APA targets appear especially sensitive to reduced levels of CPSF6.
To better understand their regulation by CFIm, we analyzed some of their features.
We first compared CFIm binding motifs at pPASs and dPASs, since CFIm binding
to UGUA motifs upstream of dPASs (− 80 nt to − 40 nt) had been shown to en-
hance their usage [17]. In line with this, CPSF6 targets had a greater tendency than
all transcripts to harbor at least one UGUA motif upstream of their dPAS (Fig. 7a,
b, Additional file 1: Fig. S9A). But this tendency was even higher for SRSF3 targets,
suggesting that they rely on CFIm to enhance dPAS usage (Fig. 7c).
Strikingly, in SRSF3 targets, UGUA motifs appeared equally distributed on either side
of the pPASs, with a strong enrichment around 65 nt downstream. Given that each of
the two CPSF5 subunits in a CFIm complex can bind one UGUA motif while the inter-
vening RNA loops around the CFIm heterotetramer [15, 57], this raised the intriguing
possibility that CFIm blocks these pPASs by excluding some of the sequences necessary
for their activation such as USEs, CSEs, and DSEs. In line with this notion, we foundSchwich et al. Genome Biology (2021) 22:82 Page 17 of 34
Fig. 7 CFIm inhibits pPAS usage through unproductive FIP1 recruitment in SRSF3-regulated transcripts.
a Enrichment of UGUA motifs around sPASs, pPASs, and dPASs used in P19 cells. b UGUA motif enrichment
around the pPAS and dPAS in CPSF6 targets and non-affected transcripts. c UGUA motif enrichment
around the pPAS and dPAS in SRSF3 targets and non-affected transcripts. d Cumulative fraction of dual
UGUA motifs upstream, downstream, and enclosing sPAS, pPAS and dPAS. E Binding motifs of FIP1 and
CPSF5 derived from iCLIP in P19 cells. f Metaprofiles of normalized crosslink sites of CPSF5 and FIP1 around
the pPAS and dPAS of SRSF3 targets compared to random PAS. Significant differences in CPSF5 and FIP1
binding are computed by a z-score approach. Positions with FDR ≤ 0.01 are indicated below. g Stacked bar
charts showing the proportion of pPASs (upper panel) and dPASs (lower panel) that are associated with
known CSE motifs. SRSF3-regulated 3′UTRs are compared to CPSF6-only targets and all 3′UTRs
that SRSF3 targets indeed had a greater tendency to have UGUA pairs flanking their
pPASs compared to CPSF6 targets and all transcripts (Fig. 7d, Additional file 1: Fig. S9B).
SRSF3 targets also more frequently harbored UGUA pairs downstream of their pPASs,
which could inhibit their usage, for instance by excluding DSEs [15, 57]. Finally, the
SRSF3 targets also showed a much greater tendency to contain UGUA pairs upstream of
their dPASs, which should enhance dPAS usage [17]. Altogether, the UGUA motif distri-
bution suggests that SRSF3 targets are especially sensitive to reduced CFIm levels becauseSchwich et al. Genome Biology (2021) 22:82 Page 18 of 34
CFIm might play a dual role on these transcripts: it activates their dPAS and at the same
time blocks their pPAS.
To assess whether the UGUA motif distribution is reflected by CFIm binding and
FIP1 recruitment, we performed iCLIP of GFP-FIP1 and CPSF5-GFP from P19 cell
lines (6–7 replicates; Additional file 1: Fig. S10A, S10B). Merging replicates, we
obtained 1,851,266 unique crosslink events for CPSF5 and 3,759,237 for FIP1
(Additional file 1: Table S8). Pentamer enrichment analysis retrieved the expected bind-
ing motifs—UGUA for CPSF5, and UG-rich sequences for FIP1 (Fig. 7e). Indeed, cross-
linking of both CPSF5 and FIP1 mirrored the UGUA motif distribution, with peaks
directly upstream of pPASs and dPASs, in line with previous studies [14, 29]. But they
also displayed an additional peak downstream of pPASs, which has not been reported
previously (Additional file 1: Fig. S10C). Importantly, binding of both CPSF5 and FIP1
was strongly enriched on either side of pPASs and upstream of dPASs in SRSF3 targets,
whereas CPSF6 targets showed only a slight enrichment for both proteins upstream of
dPASs (Fig. 7f, Additional file 1: Fig. S10D). Given that many pPASs in SRSF3 targets
are suppressed under normal conditions (where iCLIP was performed), recruitment of
FIP1 to those pPASs might be unproductive, i.e., does not result in cleavage. To con-
firm this, we divided all transcripts with long 3′UTRs (unused pPAS) and short 3′UTRs
(used pPAS) in control cells and compared their binding patterns of FIP1 and CPSF5
(Additional file 1: Fig. S10E). Interestingly, both CPSF5 and FIP1 bound downstream of
suppressed pPASs, suggesting a mechanism of pPAS suppression through unproductive
CFIm and FIP1 binding. Our data suggested that for many CPSF6 APA targets the pro-
motion of dPAS usage is sufficient to generate transcripts with long 3′UTRs. However,
in a subset of these (i.e., SRSF3 APA targets), additional mechanisms appear to be used
to also suppress pPAS usage.
To test whether those suppressed pPASs are stronger than usual, we compared the
frequency of CSE variants. Indeed, SRSF3 APA targets more often harbored the two
main CSE variants (AAUAAA and AUUAAA) at their pPASs compared to CPSF6 APA
targets (75% vs. 60%; Fig. 7g). Although the same was true for their dPASs (95%),
pPASs are transcribed first; hence, they need to be suppressed to generate transcripts
with long 3′UTRs.
Altogether, our data provide evidence for two modes by which CFIm can regulate 3′
UTR-APA. CFIm binding can either inhibit or enhance PAS usage depending on the
positioning of UGUA motifs and CFIm binding. CFIm complexes bound to suppressed
pPASs still recruit FIP1 and likely other CPA factors, but cleavage does not occur, sug-
gesting that the assembled cleavage complexes are inactive. Indirect SRSF3-regulated
targets are more sensitive to low CFIm levels because they rely on pPAS inhibition and
dPAS enhancement by CFIm to ensure the generation of long 3′UTRs. Additional
pPAS inhibition might be necessary because SRSF3-sensitive pPASs are stronger
compared to CPSF6-only targets, which do not show this dual CFIm dependency.
Discussion
The usage of alternative PASs can be modulated, either positively or negatively, by
regulatory RBPs. RBPs either directly compete with core CPA factors for binding to
regulatory elements or they bind to sequences outside of the PAS region (reviewed in
[19, 22, 58]). We show here that SRSF3 and SRSF7 modulate PAS usage directly bySchwich et al. Genome Biology (2021) 22:82 Page 19 of 34
binding upstream of regulated pPASs. Despite being very closely related, SRSF3 and
SRSF7 affect 3′UTR length in opposite directions. This is due to slight differences in
the domain architecture of both SR proteins. We find that the direct modulation of
pPAS usage by SRSF3 and SRSF7 requires CSEs of intermediate strength, is independ-
ent of splicing and occurs in a concentration- and binding-dependent manner. In
addition, SRSF3 affects 3′UTR-APA also indirectly, by maintaining high levels of CFIm
through alternative splicing of the Cpsf6 mRNA. Based on the data presented here, we
propose the following model for 3′UTR-APA modulation by SRSF3 and SRSF7.
When SRSF7 is present at high levels, such as in pluripotent cells or certain cancer
cells [59], it binds upstream of pPASs and recruits FIP1, thereby acting as a sequence-
specific enhancer of pPAS usage and promoting transcripts with short 3′UTRs (Fig. 8a,
left panel). SRSF3 also binds upstream of pPASs but, unlike SRSF7, it cannot recruit
FIP1. Thus, SRSF3 binding prevents activation of these pPASs by impairing the
association of SRSF7. When SRSF7 levels are low, e.g., in differentiated cells, increased
SRSF3 binding to pPASs favors the usage of dPASs and the generation of long 3′UTRs
(Fig. 8a, middle panel). When SRSF3 levels are low, as it occurs for example in progres-
sive liver disease [60], SRSF7 can bind more to pPASs. In addition, the levels of CFIm
decrease due to unproductive splicing of Cpsf6, which prevents the activation of dPASs.
Together, this favors pPAS usage and the generation of transcripts with short 3′UTRs
(Fig. 8a, right panel).
Apart from only preventing the association of SRSF7 with pPASs, SRSF3 binding
might also actively inhibit their usage, similar to U1 snRNP [61, 62]. U1 snRNP inhibits
polyadenylation through the inactivation of PAP by U1-70K and U1A, which both con-
tain a PAP-inhibitory domain (PID) [63]. Interestingly, SRSF3 also contains a predicted
PID within its RS domain and might inhibit PAP in these inactive CPA complexes [64],
but further studies are required to test this hypothesis.
We show that FIP1 recruitment by SRSF7 occurs via direct protein-protein inter-
action. It is independent of CFIm, but dependent on the Zn knuckle and the hydropho-
bic 27aa stretch within the RS domain of SRSF7, which are absent in SRSF3. The
interaction requires the RS domain of SRSF7 to be hypo-phosphorylated, but is inde-
pendent of its RNA-binding domain, similar to what was shown for CPSF6 [17]. This
means that SRSF7 can simultaneously bind to pPASs in pre-mRNAs and to FIP1 and
thereby recruit FIP1 to bound pPASs, e.g., those without UGUA motifs like the Ddx21
3′UTR. Dephosphorylation of SRSF7 might occur during CPA, since our reporter
experiments suggest that 3′UTR-APA regulation by SRSF7 is independent of splicing.
In line with this, the SR protein phosphatase PP1 was also found in purified CPA
complexes [65, 66].
We also find that indirectly SRSF3-regulated pPASs are more sensitive to reduced
CFIm levels. This might be due to the fact that these pPASs are stronger than average
pPASs and contain mostly the canonical CSE variants (Figs. 1h and 7g) [24, 47]. Since
pPASs are transcribed first, strong pPASs should in principle be used by default when
the core CPA machinery is present in sufficient levels. However, most of these SRSF3
targets do harbor long 3′UTRs in P19 cells under normal conditions. This suggests that
in addition to the enhancement of their dPASs, their pPASs must also be inhibited.
Three models have been proposed for CFIm-mediated pPAS suppression. (i) CFIm
binds to UGUA motifs that overlap with the cleavage site, thereby preventing PASSchwich et al. Genome Biology (2021) 22:82 Page 20 of 34
Fig. 8 Model of pPAS usage regulated by SRSF7, SRSF3, and CFIm. a Model of regulation of pPAS usage
and 3′UTR-APA by SRSF7 and SRSF3. Left panel: High SRSF7 levels and binding upstream of pPASs enhance
pPAS usage through the recruitment of FIP1—transcripts with short 3′UTRs. Middle panel: High SRSF3 levels
and binding upstream of pPASs prevent SRSF7 binding and pPAS enhancement. High levels and binding of
CFIm upstream of dPASs enhances dPAS usage instead—transcripts with long 3′UTRs. Right panel: Srsf3 KD
results in reduced CFIm levels. The dPAS is no longer enhanced by CFIm binding, instead SRSF7 binding at
pPASs enhances their usage – transcripts with short 3′UTRs. b Model of pPAS inhibition by CFIm. Top: CFIm
binding immediately up- and downstream of the pPAS inhibits its usage by looping out the CSEs or DSEs,
leading to unproductive FIP1 recruitment – no cleavage – transcripts with long 3′UTRs. 5—CPSF5. Bottom:
Depletion of SRSF3 or CPSF6 leads to low CFIm levels, which unmasks pPASs and allows their
activation—transcripts with short 3′UTRs.
usage [17, 67]. (ii) CFIm binds one UGUA motif upstream of a pPAS and a second
UGUA upstream of a dPAS, thereby looping out a big part of the 3′UTR [15, 29]. (iii)
CFIm binds to suboptimal target sites, e.g., non-UGUA motifs, that are more prevalent
at pPASs, which would block productive CPSF recruitment [14]. Only the first model
was experimentally verified [17, 67].
Our data suggest a fourth mode by which CFIm can inhibit pPAS usage when the
pPAS is enclosed by or directly followed by a pair of UGUA motifs. This is in line with
the second model implying that large regions of the 3′UTR including the pPAS loop
around the CFIm tetramer [15, 29]. Our data suggest that CFIm binding at pPASs can
also hide short 3′UTR regions that are important for pPAS activation, e.g., CSEs, DSEs,
or the cleavage site (Fig. 8b). This is based on our findings that (i) SRSF3-sensitive
pPASs are often flanked or followed by UGUA pairs, (ii) SRSF3-sensitive pPASs have
enriched CPSF5 crosslinks flanking them, and (iii) these pPASs are used with low effi-
ciency under the conditions where iCLIP was performed, but become activated whenYou can also read