FRANCE ENERGIES - CHARACTERISATION OF THE POTENTIAL IMPACTS OF SUBSEA POWER CABLES ASSOCIATED WITH OFFSHORE RENEWABLE ENERGY PROJECTS - Tethys
←
→
Page content transcription
If your browser does not render page correctly, please read the page content below
CHARACTERISATION OF THE POTENTIAL IMPACTS
OF SUBSEA POWER CABLES ASSOCIATED
WITH OFFSHORE RENEWABLE ENERGY PROJECTS
SPECIES project (2017-2020): Review and perspectives

                                                   FRANCE
                                                   ENERGIES
                                                   MARINES
                                                   Editions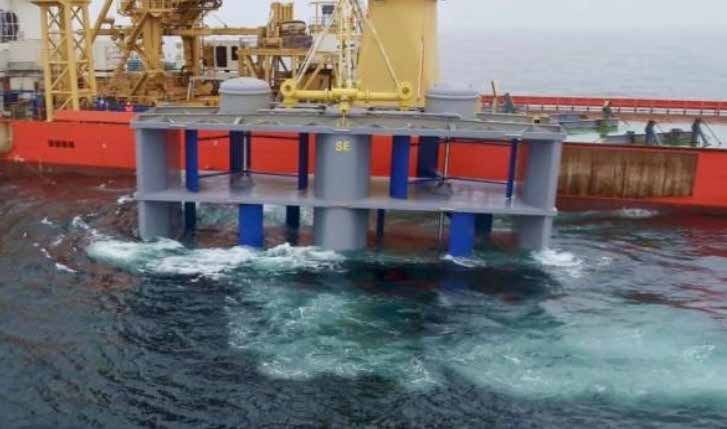
Characterisation of the potential impacts of subsea power cables associated FRANCE
ENERGIES
with offshore renewable energy projects
MARINES
Editions
CHARACTERISATION OF THE POTENTIAL IMPACTS
OF SUBSEA POWER CABLES ASSOCIATED
WITH OFFSHORE RENEWABLE ENERGY PROJECTS
AUTHORS:
Bastien Taormina, Nolwenn Quillien, Morgane Lejart, France Energies Marines
Antoine Carlier, Nicolas Desroy, Martial Laurans, Ifremer
Jean-François D’Eu, MAPPEM Geophysics
Marine Reynaud, Yves Perignon, Héléna Erussard, Centrale Nantes
Sandrine Derrien-Courtel, Aodren Le Gal, René Derrien, French National Museum of Natural History (MNHN)
Aurélie Jolivet, Sylvain Chavaud, TBM Environnement
Viviane Degret, Damien Saffroy, RTE
Jean-Philippe Pagot, Agnès Barillier, EDF Renewables
All rights reserved.
The texts in this synthesis report are the property of the SPECIES project partners (Centrale Nantes, EDF, EDF Renewables,
France Energies Marines, Ifremer, MAPPEM Geophysics, French National Museum of Natural History, RTE, TBM Environnement).
These texts may not be reproduced or used without prior authorisation and without citing the source. Unless otherwise stated,
all photos, diagrams and tables are protected by copyright. They remain the property of the SPECIES project partners and may not
be reproduced in any form or by any means whatsoever without the prior written authorisation of the SPECIES project partners.
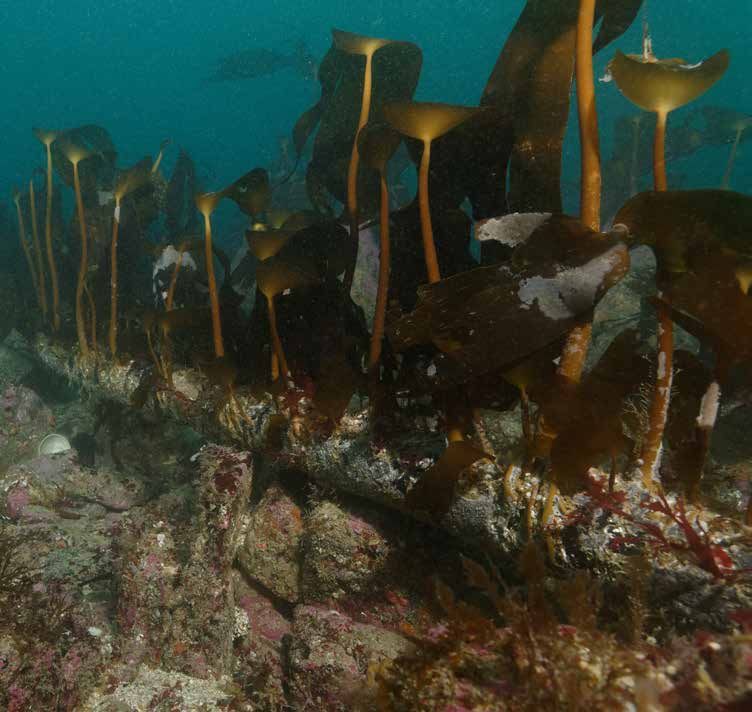
The document should be cited as follows:
Taormina B., Quillien N., Lejart M., Carlier A., Desroy N., Laurans M., D’Eu J.-F., Reynaud M., Perignon Y., Erussard H.,
Derrien-Courtel S., Le Gal A., Derrien R., Jolivet A., Chauvaud S., Degret V., Saffroy D., Pagot J.-P. and Barillier A.
Characterisation of the potential impacts of subsea power cables associated with offshore renewable energy projects.
Plouzané: France Energies Marines Editions, 2020,
74 pages.
Published: May 2021
Cover photo: Colonisation by kelp of the SABELLA D10 tidal turbine test site power cable in the Fromveur Passage
© Olivier Dugornay, Ifremer
Legal deposit at publication
Graphic design: halynea.com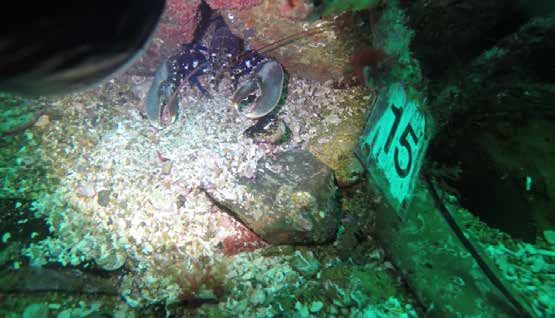

Characterisation of the potential impacts of subsea power cables associated                                                                  FRANCE
                                                                                                                                                       ENERGIES
                                               with offshore renewable energy projects
                                                                                                                                                       MARINES
                                                                                                                                                       Editions

Table of contents
                                                                                                                                             Page

List of figures                                                                                                                                    6

List of tables                                                                                                                                     9

Preface                                                                                                                                           11

1 - Effects generated by subsea power cables                                                                                                      12

2 - Overview of the study sites                                                                                                                   15

3 - Project results                                                                                                                               19
3.1 Measurement of physical effects ...............................................................................................              20
     • Fact Sheet 1 Tools for measuring electromagnetic fields ......................................................                             20
     • Fact Sheet 2 Dynamic measurements of electromagnetic fields ..........................................                                     22
     • Fact Sheet 3 Static measurements of electromagnetic fields ...............................................                                 24
     • Fact Sheet 4 Effects of subsea power cables on temperature ...............................................                                 26
3.2 In situ assessment of potential impacts on benthos ................................................................                          30
    • Fact Sheet 5 Methods for monitoring sub-tidal benthic communities
        in the vicinity of cables .............................................................................................................   30
    •F  act Sheet 6 Monitoring of epibenthic communities
       associated with cable protection structures ............................................................................                   32
    •F  act Sheet 7 Monitoring of benthic megafauna associated
       with cable protection structures...............................................................................................            34
    •F  act Sheet 8 Monitoring of benthic megafauna associated with floating wind
       turbine connection structures ..................................................................................................           36
    •F  act Sheet 9 Assessment of the reserve effect associated with the presence
       of a protection corridor..............................................................................................................     38
    •F  act Sheet 10 Assessment of the impact of power cables
       on adjacent benthic communities.............................................................................................               40
3.3 Laboratory assessment of potential impacts on benthos .......................................................                                42
     • Fact Sheet 11 Methods for the experimental study of the responses
        of benthic organisms to artificial magnetic fields ..................................................................                     42
    • Fact Sheet 12 Study of the impact of artificial magnetic fields on European lobsters .........                                              44
    • Fact Sheet 13 Study of the impact of artificial magnetic fields on great scallops ................                                          48

4 - Project feedback                                                                                                                              52

5 - Project review                                                                                                                                58

6 - Perspectives                                                                                                                                  64

7 - Acronyms, abbreviations and definitions                                                                                                       68

8 - Bibliography                                                                                                                                  69

                                                                         5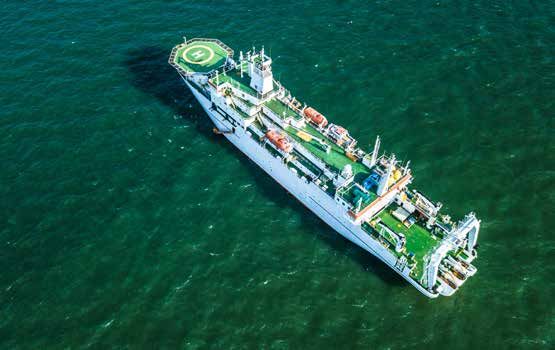
FRANCE Characterisation of the potential impacts of subsea power cables associated
ENERGIES
with offshore renewable energy projects
MARINES
Editions
List of figures Page
Fig. 1 • Main laying techniques for subsea power cables......................................................... 12
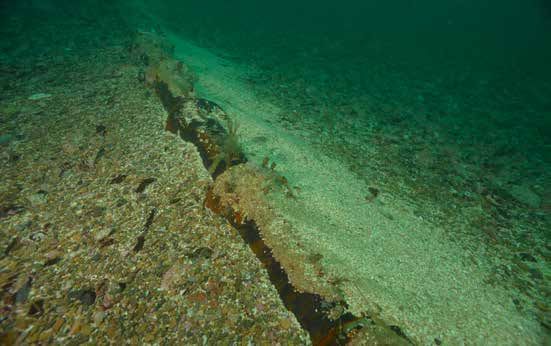
Fig. 2 • Accumulation of shell sand along the Paimpol-Bréhat test site power cable................... 13
Fig. 3 • General distribution of several invertebrate species on the seabed,
and theoretical magnetic field strengths emitted by 225 kV cables
(buried and unburied) with an electric current of 1,000 A.............................................14
Fig. 4 • Location of the five study sites ...................................................................................... 15
Fig. 5 • View of the PASSEM tool on deck prior to deployment ................................................ 20
Fig. 6 • Electrical measurement dipoles of the PASSEM tool .................................................. 20
Fig. 7 • View of the STATEM tool prior to deployment and placed on the seabed.................... 21
Fig. 8 • Positions of the transects performed using the PASSEM tool to measure
the electromagnetic fields emitted by the cables of the HVDC
Cross-Channel interconnector ...................................................................................... 22
Fig. 9 • Positions of the profiles and stations initially planned for measuring
the electromagnetic fields at the Jersey-Cotentin connection comprising
the N1, N2 and N3 cables, using the PASSEM tool ...................................................... 22
Fig. 10 • Magnetic fields observed at the HVDC Cross-Channel site showing
the magnetic signals of the two cables, and spectrograms of the electric
signals measured by the four dipoles of the PASSEM tool........................................... 23
Fig. 11 • Magnetic fields observed at the Jersey site showing the magnetic signals
of the two cables, and spectrograms of the electric signals measured
by the four dipoles of the PASSEM tool......................................................................... 23
Fig. 12 • Location of the S1 station at the Jersey-Cotentin connection comprising
the N1, N2 and N3 cables, and positioning of the STATEM tool in relation
to the N1 cable................................................................................................................ 24
Fig. 13 • Diagram showing the position of the STATEM tool in relation to the connection
hub of the SEM-REV test site ....................................................................................... 24
Fig. 14 • Magnetic field strength measured and electric power flowing
through the N1 cable between 25 and 29 June 2019 ................................................... 25
Fig. 15 • Electric field measured and power flowing through the N1 cable............................... 25
Fig. 16 • 50, 100, 150, 200, 250 Hz components of the total magnetic field recorded
over 17 hours and current intensity in the cable .......................................................... 25
Fig. 17 • 50, 100, 150, 200, 250 Hz components of the electric field recorded
by dipole 1 and current intensity in the cable ............................................................... 25
Fig. 18 • Examples of the temperature probes installed on cast iron protection shells
or directly on the surface of an unprotected cable ....................................................... 26
Fig. 19 • Temperature measured every hour from 25 to 29 June 2019 at the surface
of the N1 and N2 cables and at a control station near the two cables,
and power flowing through the N1 and N2 cables on the same dates........................ 27
Fig. 20 • Mean absolute deviation between the control temperatures and
the temperatures at the surface of the power cables measured every hour
from 12 September 2019 to 7 February 2020................................................................ 27
6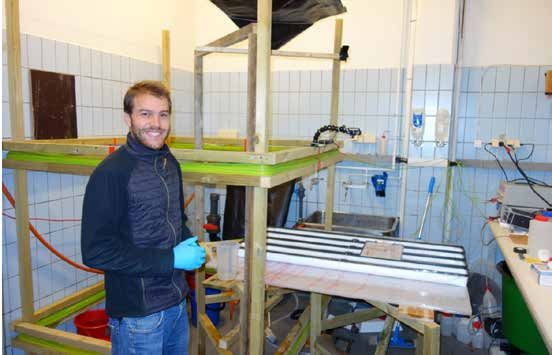
Characterisation of the potential impacts of subsea power cables associated                                                               FRANCE
                                                                                                                                                    ENERGIES
                                               with offshore renewable energy projects
                                                                                                                                                    MARINES
                                                                                                                                                    Editions

Fig. 21    • Temperature measured every hour from 28 October to 4 November 2019
              at the surface of the export cable, at the surface of the Floatgen umbilical,
              and at a control station near the two cables, power flowing
              through the two cables on the same dates, and water depth on the same dates ...... 28
Fig. 22    • Sampling of benthic macrofauna using an underwater suction sampler
              after scraping ................................................................................................................. 30
Fig. 23    • Open Van-Veen grab sampler on deck.......................................................................... 30
Fig. 24    • Diver taking photographs at the Paimpol-Bréhat site.................................................. 31
Fig. 25    • Photograph of one of the monitored sites showing the cable protected
              by a cast iron shell and a stabilising concrete mattress .............................................. 32
Fig. 26    • Conceptual diagram of the ecological succession observed
              on the artificial structures at the Paimpol-Bréhat site ................................................ 32
Fig. 27    • Non-metric multidimensional composition of the epibenthic communities
              based on the Bray-Curtis similarity index of the images ............................................ 33
Fig. 28    • Main mobile megafauna species finding refuge in the cavities
              of the concrete mattresses............................................................................................ 34
Fig. 29    • Colonisation dynamics of the species monitored between June 2015
              and September 2019 on the mattresses inspected during each measurement
              campaign, total abundance per mattress, and species diversity per mattress .......... 35
Fig. 30    • Ordering diagrams for the redundancy analysis .......................................................... 35
Fig. 31    • 3D view of the connection hub installed at the SEM-REV test site .............................. 36
Fig. 32    • ROV image of an attachment bracket used for the laid section
              of the Floatgen umbilical, around which a school of pouting is concentrated............ 37
Fig. 33    • Map of the study area between the island of Jersey and France
              showing the location of the 21 study sites on both the French and English sides...... 38
Fig. 34    • Taxonomic diversity indices obtained for the studied French and English sites
              outside and inside the exclusion area, and depending on the fishing effort ............... 39
Fig. 35    • Functional diversity indices obtained for the studied French and English sites
              outside and inside the exclusion area, and depending on the fishing effort ............... 39
Fig. 36    • Photograph of the monitored power cable in a kelp forest .......................................... 40
Fig. 37    • Densities of the different taxa recorded in the control density and cable areas
              during the 2018 and 2019 measurement campaigns ................................................... 41
Fig. 38    • Helmholtz coils used for the experiments on juvenile European lobsters.................. 42
Fig. 39    • Helmholtz coils used for the experiments on great scallops, and mapping
              of the 600 μT magnetic field produced in the experimental area ................................ 43
Fig. 40    • Experimental set-up used to study the juvenile lobsters ............................................. 44
Fig. 41    • Average speed, distance travelled, and time spent by the juvenile lobsters
              in the four zones of the corridor depending on the test condition applied ................. 45
Fig. 42    • Time to find shelter, distance travelled, and average speed
              of the juvenile lobsters for the four consecutive trials depending
              on the test condition applied ......................................................................................... 46

                                                                        7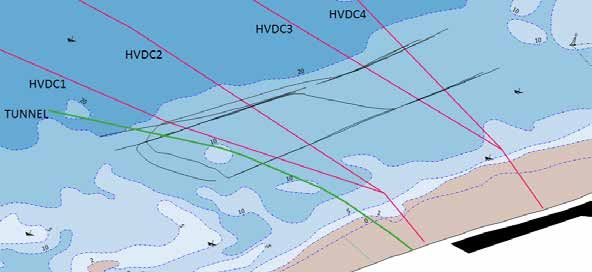
FRANCE               Characterisation of the potential impacts of subsea power cables associated
ENERGIES
                     with offshore renewable energy projects
MARINES
Editions

           Fig. 43    • Accelerometers attached to the great scallops ............................................................ 48
           Fig. 44    • Example of the response of a great scallop to the approach of a predator,
                         the spiny starfish Marthasterias glacialis ...................................................................... 49
           Fig. 45    • Average number of movements made during the day and at night
                         by the Group 1 and Group 2 great scallops for each monitoring period ..................... 50
           Fig. 46    • Average number of movements made by Group 1 and Group 2 in the presence
                         of impulse sequences and intermittent sequences for each test condition ............... 50
           Fig. 47    • Average number of movements made in response to an approaching starfish ......... 51
           Fig. 48    • Launching of the HydroQuest Ocean tidal turbine at the Paimpol-Bréhat site .......... 52
           Fig. 49    • Intervention at the SEM-REV test site .......................................................................... 53
           Fig. 50    • Diver taking macrophotography of an invertebrate attached
                         to the Paimpol-Bréhat test site power cable ................................................................ 54
           Fig. 51    • Marking of the concrete mattresses inspected and the lobster shelters identified ... 55
           Fig. 52    • Photographs of the STATEM and PASSEM systems prior to deployment at sea ........ 56
           Fig. 53    • In situ monitoring of the Paimpol-Bréhat cable ........................................................... 56
           Fig. 54    • Laboratory experimental set-up used to study the impact of electromagnetic
                         fields on juvenile European lobsters.............................................................................. 57
           Fig. 55    • Benthic colonisation on different types of cables and associated structures.............. 58
           Fig. 56    • Distribution of maerl cover in the Belle-Île sector (coordinates in WGS 84,
                         UTM zone 30 - 1,000 metres in two grids)..................................................................... 59
           Fig. 57    • Ship used to lay the subsea power cables..................................................................... 60
           Fig. 58    • General distribution of certain invertebrate species on the seabed,
                         and theoretical magnetic field strengths emitted by 225 kV cables (buried at 1 m
                         and unburied) with an electric current of 1,000 A (diameter: 27 cm) .......................... 61
           Fig. 59    • Female European lobster observed under a mattress
                         at the Paimpol-Bréhat test site ..................................................................................... 62
           Fig. 60    • Examples of ocean energy systems .............................................................................. 64
           Fig. 61    • Floating wind turbine and its umbilical ........................................................................ 67
           Fig. 62    • Example of a power connection grid for a wave energy farm ...................................... 67

                                                                              8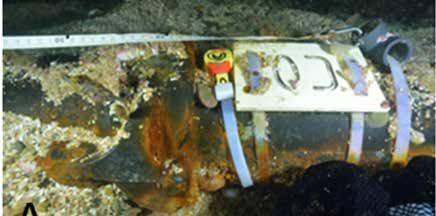
Characterisation of the potential impacts of subsea power cables associated                                    FRANCE
                                                                                                                       ENERGIES
                                             with offshore renewable energy projects
                                                                                                                       MARINES
                                                                                                                       Editions

List of tables                                                                                                  Page

Tab. 1: A
         bundance of different species of megafauna recorded around the connection hub
        at the SEM-REV test site and on two transects along the Floatgen umbilical ................. 36
Tab. 2: E
         xperimental protocol for the three groups of great scallops ........................................... 49
Tab. 3: C
         haracteristics of the devices for measuring electromagnetic fields ............................... 55
Tab. 4: S
         ummary of the interconnector and connection projects for ORE farms targeting
        metropolitan French waters (or nearby marine regions) and involving the laying
        of high-voltage or medium-voltage subsea power cables for the pilot projects............... 66

                                                         9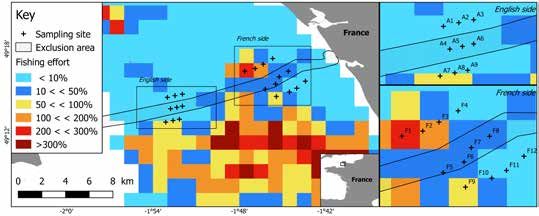
FRANCE             Characterisation of the potential impacts of subsea power cables associated
ENERGIES
                   with offshore renewable energy projects
MARINES
Editions

            Acknowledgements
           This work benefited from funding by France Energies Marines, its members and partners, as well
           as from a government grant managed by the French National Research Agency (ANR) under the
           “Investments for the Future” programme (ANR-10-IEED-0006-17). This work was also made possible
           thanks to the teams associated with the authors, namely, for the MNHN-Concarneau Marine Station,
           François-Xavier Decaris and René Derrien.

            Compilation and drafting
           Bastien Taormina
            Benthic Habitats Research Officer at France Energies Marines.

            Scientific leadership and coordination
           Antoine Carlier
            Benthic Ecology Researcher at Ifremer’s Laboratory of Coastal Benthic Ecology (LEBCO),
            PhD in marine biology.
           Nicolas Desroy
            Benthic Ecology Researcher at Ifremer’s Environment Resources Laboratory of Bretagne Nord
            (LERBN), PhD and Accreditation to Supervise Research (HDR) in marine biology.
           Nolwenn Quillien
            Benthic Ecology Researcher at France Energies Marines, PhD in marine biology.
           Morgane Lejart
            Environmental Integration R&D Manager for offshore renewable energy
            at France Energies Marines, PhD in marine biology.

                                                          10
Characterisation of the potential impacts of subsea power cables associated FRANCE
ENERGIES
with offshore renewable energy projects
MARINES
Editions
Preface
Subsea power cables are present throughout The research was conducted along three main
our oceans and serve a variety of purposes: lines:
connecting islands to the mainland for energy
• In situ measurements of the physical effects
distribution, connecting stand-alone power
generated by the cables (e.g., emission of
grids, powering offshore platforms, as well as
electromagnetic fields, thermal radiation) at
transporting the power produced by offshore
different ORE test sites or interconnections in
renewable energy (ORE) installations to shore.
France.
In 2015, the total length of high-voltage direct
current (HVDC) cables on the seabed worldwide • The study, via in situ approaches, of the potential
was estimated to be 8,000 km, with 70% of impact of these cables on coastal benthic
these cables being located in European waters communities, focusing on different biological
(Ardelean and Minnebo, 2015). compartments (e.g., endofauna, epibenthic
communities and crustaceans/fish among
Europe also accounted for 5,047 offshore wind
benthic megafauna) at different sites in France.
turbines at the end of 2019, representing 22.1 GW,
with 25 GW planned for 2025 (WindEurope, 2020). • The study of the potential impact of the cables,
Given this exponential development of ORE and in particular of electromagnetic fields,
projects, the number of subsea power cables on the behaviour of certain notable benthic
is increasing considerably. Like any human species, using experimental approaches in the
installation or activity at sea, these cables can laboratory.
cause disruptions to marine life and habitats.
The aim of this report is to provide a synthesis
However, and despite the fact that they have been
of the results of the SPECIES project and the
present in our oceans since the mid-twentieth
perspectives arising from it. It is divided into six
century, very few scientific publications address
parts:
the effects of these power cables on the marine
environment (Taormina et al., 2018; Carlier et al., • A summary of the different effects that can be
2019). With the current increase in the number generated by subsea power cables.
of cables, there is today an urgent need to • An overview of the selected study sites.
characterise their potential impacts on marine
ecosystems. • Fact sheets covering several scientific questions,
and presenting the methods developed and
It is within this framework that the collaborative implemented as well as the main results of the
project “SPECIES” (“Submarine PowEr Cables project.
Interactions with Environment & associated
Surveys”) was launched in 2016. The aim of this • Feedback on the difficulties encountered and the
project was to improve knowledge of the potential resulting methodological recommendations.
interactions between the electric power cables of •
A review of the project for managers and
ORE projects and benthic organisms, which would stakeholders in the ORE sector.
appear to be the most exposed communities.
Coordinated by France Energies Marines and • Perspectives for future research on the same
scientifically led by Ifremer, the project brought topic.
together a consortium of nine academic and
private partners with complementary skills and
contributions.
11FRANCE Characterisation of the potential impacts of subsea power cables associated
ENERGIES
with offshore renewable energy projects
MARINES
Editions
1 - Effects generated by subsea power cables
This section is mainly based on the content of for the ecosystem. The purpose of the SPECIES
four scientific articles and reports containing project was to gather scientific data and commu-
the majority of the bibliographic references used nicate on the risks of impacts on the ecosystem.
in the writing of this document (Taormina et To do this, it was first necessary to correctly char-
al., 2018; Albert et al., 2020; Carlier et al., 2019; acterise the effects.
Copping and Hemery, 2020).
This section presents only the effects associated
First of all, we must begin by defining the term with the operational phase of subsea power
“effect”. An effect is a change in an environmen- cables, as only this phase was studied within the
tal variable (such as noise, temperature, elec- framework of the project. These effects concern
tromagnetic field) outside of its range of natural the modification of the benthic habitat (considered
variability. Where this effect causes observable here as the physical nature and configuration of
changes in one or more identified receptors, the seabed), the reserve effect, the emission of
which can be biological compartments of the heat, and the emission of electromagnetic fields.
ecosystem or processes within this ecosystem, For more information, the four reference articles
1
it can be referred to as an impact. Although the cited above also address the effects associated
distinction is highly subjective, these impacts can with the cable-laying phase.
Effects generated by power cables
be described as either “positive” or “negative”
1.1 Habitat alteration
The physical presence of an unburied cable, i.e., a heights and volumes of these structures, this dis-
cable that is simply laid on the seabed, can result turbance is very localised (< 5 m) and tends to be
in both the creation of a new artificial habitat and indicated by the presence of a narrow accumula-
the alteration of the surrounding natural habitat. tion of sediment along these structures (Fig. 2).
With respect to the first process, unburied
cables and the various associated protection BURYING
or stabilising structures (such as concrete
mattresses, riprap and protection shells)
provide a new hard substrate that is subject to
biological colonisation (Fig. 1). This phenomenon,
which concerns all submerged anthropogenic
structures, is commonly referred to as the reef
effect. The structures are thus colonised by the RIPRAP
sessile species of hard substrates (animals and
plants) that form the epibenthic community. This
process is known as biofouling. Certain mobile
species of macrofauna and megafauna, such as
fish and crustaceans, may also be attracted to
the deployed structures. The extent of the reef CONCRETE MATTRESS
effect depends on the size and nature of the
structures associated with the cable, as well as
on the characteristics of the surrounding natural
habitat (types of seabed, currents, depth).
© RTE
The presence of cables and associated structures
can also alter marine habitats in the immediate
vicinity through changes in hydrodynamics and Fig. 1: Main laying techniques for subsea power
cables.
in sediment dynamics. Generally, due to the low
12Characterisation of the potential impacts of subsea power cables associated FRANCE
ENERGIES
with offshore renewable energy projects
MARINES
Editions
© Olivier Dugornay, Ifremer
1
Effects generated by power cables
Fig. 2: Accumulation of shell sand along the Paimpol-Bréhat test site power cable.
1.2 The reserve effect
While burying power cables or fitting them with cable protection zone. This is the reserve
protection systems does not safeguard them effect. This is therefore an indirect effect,
against potential damage caused by certain often considered as “positive” for the marine
anthropogenic activities (anchoring, dredging, ecosystem. The size of this controlled area and
bottom trawling, etc.), these activities can be the nature of the bans depend on the method of
regulated and even banned by the local authorities laying of the cable (buried or unburied) and the
in the vicinity of the cables. As these activities number of cables present in the area. Typically,
have a proven ecological impact on the seabed, these cable protection zones mainly concern
banning them can result in an improvement in unburied cables, and form corridors several
the environmental status of marine communities hundred metres long on each side of the cable
compared to those established outside of the and along the entire length of the cable route.
1.3 Heat emission
When an electric current passes through a cable, the type of current concerned (AC or DC), and
some of this energy is transformed into thermal the nature of the sediments. The most cohesive
energy: this is known as Joule heating. In the case sediments (such as compacted silt) generate
of unburied subsea cables, the constant flow of the highest levels of heat (up to several tens of
water effectively dissipates this heat and confines degrees Celsius over several tens of centimetres)
it to the surface of the cable. With buried cables, due to their lower thermal conductivity. However,
however, this thermal radiation can heat the very few studies have measured heating in situ
sediments in the immediate vicinity. The spatial near operating subsea power cables, the majority
extent and the magnitude of the heat produced of the available data coming from numerical
can be highly variable depending on the technical models.
characteristics and the power rating of the cable,
13FRANCE Characterisation of the potential impacts of subsea power cables associated
ENERGIES
with offshore renewable energy projects
MARINES
Editions
1.4 Modification of electromagnetic fields
The electric current flowing through the cables The magnetic field emitted by a DC cable is static
results in the production of electromagnetic over time but its strength varies with the intensity
fields, which include the electric field (measured of the electric current. The earth’s magnetic
in volts per metre) and the magnetic field field is itself a static field (except for variations
(measured in Tesla units). Due to its configuration, due to solar winds), in the range of 50 μT in
an underground or subsea cable does not directly France. In contrast, in the case of AC power, a
emit an electric field because it is surrounded sinusoidal current flows through the cables
by a grounded metal screen. The magnetic field at a given frequency (50 or 60 Hz), causing the
depends on the intensity of the electric current in magnetic fields to also vary over time at the same
the cable and the laying parameters (especially frequency. The magnetic fields, by induction
the geometry). It decreases rapidly with distance effect in electrically conductive elements (such
(Fig. 3). For monopolar cables and cables with a as sea water or living organisms), generate an
separate DC bipolar configuration, the magnetic “induced” electric field of a few μV/m outside the
field strength decreases according to the relation cable.
1/d, where d is the distance from the centre of the
1 cable. In the case of a three-phase AC cable, or R LEARN MORE
a cable with a bundled DC bipolar configuration Taormina B., Bald J., Want A., Thouzeau G.,
(two cables in opposite phase), the fields Lejart M., Desroy N., Carlier A. (2018)
Effects generated by power cables
generated by each of the cables compensate for A review of potential impacts of submarine
each other and the field decreases according to power cables on the marine environment:
the relation 1/d². knowledge gaps, recommendations
and future directions.
Renewable and Sustainable Energy Reviews,
Vol 96, 380–391.
https://doi.org/10.1016/j.rser.2018.07.026
10 to 15m
Earth Magnetic field : ~50µT
Water Column
Urchin Mussel
Squid
Scallop
1.5 to 2m
Star fish
Crab
Sediment
Lobster
Clam
© Albert et al., 2020
Razor clam
d = 13.5cm | B = 1480 µT
d = 1m | B = 176,2 µT
Sessile epifauna Vagile epifauna
d = 2m | B = 93,7 µT
Sedentary endofauna Pelagic (bentho-pelagic) fauna
d = 3m | B = 63,8 µT
Fig. 3: General distribution of certain invertebrate species on the seabed, and theoretical magnetic field strengths
emitted by 225 kV cables (buried at 1 m and unburied) with an electric current of 1,000 A (diameter: 27 cm).
14Characterisation of the potential impacts of subsea power cables associated FRANCE
ENERGIES
with offshore renewable energy projects
MARINES
Editions
2 - Overview of the study sites
Five different sites in France were selected for department, and SEM-REV off Le Croisic in the
this study. Three were offshore renewable energy Loire-Atlantique department. The other two sites
test sites: Paimpol-Bréhat in the Côtes d’Armor were power connection sites completely unrelat-
department, Fromveur off Ushant in the Finistère ed to ORE systems.
UNITED KINGDOM
Channel
2
Overview of the study sites
Ushant
© SPECIES Project
Fig. 4: Location of the five study sites.
15FRANCE Characterisation of the potential impacts of subsea power cables associated
ENERGIES
with offshore renewable energy projects
MARINES
Editions
2.1 Test sites dedicated to offshore renewable energy
Paimpol-Bréhat tidal energy Fromveur tidal energy
test site power cable test site cable
Power: Power:
8 MVA 500 kW (max)
Voltage: Voltage:
10 kV 7.5 kV
Type: Type:
Direct current Alternating current
Date laid: Date laid:
2012 2015, with the cable laid in May, installation of the
D10 tidal turbine in June, connection and start of
Description: production in September, and connection to the
2 The Paimpol-Bréhat tidal energy test site is grid in November.
located off the coast of Paimpol (Brittany,
France) in the La Horaine shellfish reserve. Description:
Overview of the study sites
The connection between the tidal energy The Fromveur test site, designed to test
demonstrators and the mainland is ensured SABELLA’s tidal turbines, is located in the
by a 15 km power cable. Due to the strong Fromveur Passage between the island of Ushant
currents in the area and a seabed dominated and the Molène archipelago (Brittany, France).
by hard substrates, a section measuring 11 km The D10 tidal turbine demonstrator is connected
is not buried but simply laid on the bottom. to the island of Ushant by an unburied cable
This section of the cable is protected by cast measuring 2 km. This cable is unprotected except
iron shells and stabilised by 120 concrete for a 200 m section covered by cast iron shells.
mattresses installed in 2013. Initial energising of the cable took place between
mid-October and the end of December 2018 on
Commissioning: a continuous basis, and then on an as-needed
•
OpenHydro: no power connections were basis until April 2019.
made during the various tests of the 2 MW
demonstrator farm. Commissioning:
•
HydroQuest: the 1 MW demonstrator has September 2015. Production over several months
been connected to the grid since June 2019. on a non-continuous basis until April 2016. Raising
of the turbine in July 2016 and re-installation in
Tasks conducted: October 2018. Continuous production until end of
• Monitoring of the benthic colonisation of the December 2018 and then on an as-needed basis
artificial structures. until March 2019. Raising of the turbine in April
• Monitoring of the great scallop population 2019 followed by re-installation for a week in
(growth reference state). October 2019 with little production, then raising
again.
Tasks conducted:
• Monitoring of the benthic colonisation of the un-
protected cable.
• Temperature measurement.
16Characterisation of the potential impacts of subsea power cables associated with offshore FRANCE
ENERGIES
renewable energy projects
MARINES
Editions
SEM-REV
test site cable
Power:
8 MVA
Voltage:
20 kV
Type:
Alternating current
Date laid:
2012
Description: 2
The SEM-REV offshore test site is located off the
coast of Le Croisic, to the west of the Guérande
Overview of the study sites
bank, and is connected to the shore at Le Croisic
(Pays de la Loire department, France). The SEM-
REV site is owned by Centrale Nantes. It is operated
by the Research Laboratory in Hydrodynamics,
Energetics and Atmospheric Environment (LHEEA,
UMR 6598) of the French National Centre for
Scientific Research (CNRS). Centrale Nantes is
the project manager for the setting up of the test
site, and holds all the necessary administrative
authorisations for the testing of multi-technology
prototypes (wave energy and floating offshore
wind). A 23 km export cable connects the prototypes
to the high voltage delivery station on land via a
subsea connection hub. The cable is buried along
its entire length at a depth of around 1.5 m below
the sediment, except in front of a rocky headland
to the north-west of the Four plateau. At this point,
it is protected by 60 concrete mattresses along a
350 m-long section. These protection mattresses
were installed in 2013.
Commissioning:
The Floatgen floating wind turbine (2 MW) has
been connected to the grid since September 2018.
Tasks conducted:
• Measurement of electromagnetic fields.
• Temperature monitoring.
• Monitoring of the colonisation of artificial
structures.
17FRANCE Characterisation of the potential impacts of subsea power cables associated
ENERGIES
with offshore renewable energy projects
MARINES
Editions
2.2 Power connection cables other than for ORE
Jersey-Cotentin connections HVDC Cross-Channel interconnector
Power: Power:
50 MW (Normandie 1) 2 GW
90 MW (Normandie 2)
100 MW (Normandie 3) Voltage:
270 kV
Voltage:
90 kV (Normandie 1-2-3)
Type:
Direct current
Type:
Alternating current
Date laid:
Dates laid: 1981
1982, replaced in 2016 (Normandie 1)
2000 (Normandie 2) Description:
2 2013 (Normandie 3) The HVDC Cross-Channel interconnector refers
to the very high voltage connection between the
Description: French and British electricity grids. This link
Overview of the study sites
Jersey’s electricity supply is ensured by three consists of four cables that cross the Strait of
power cables located in the Normand-Breton Dover over a distance of 46 km. These cables
Gulf between the island and the Cotentin were buried in the sediment, with a target depth
Peninsula (Normandy, France). The most recent of about 1.5 m during the cable laying work.
cable, Normandie 3, was laid to the south and is Maintenance operations were performed on a few
buried, unlike Normandie 1 and 2, located further hundred metres of this cable in 2017, this section
north, which are simply laid on the seabed at a now being laid on the bottom and protected by
distance of 500 m from each other and with no riprap.
associated protection.
Tasks conducted:
Tasks conducted: • Measurement of electromagnetic fields.
• Measurement of electromagnetic fields.
• Studying of the reserve effect.
• Temperature measurement.
18Characterisation of the potential impacts of subsea power cables associated FRANCE
ENERGIES
with offshore renewable energy projects
MARINES
Editions
3 - Project results
Thirteen fact sheets, each addressing a specific scientific focus, present the methods developed and
implemented as well as the main results of the project.
3.1 Measurement of physical effects
• Fact Sheet 1 •F
act Sheet 3
Tools for measuring electromagnetic fields Static measurements of electromagnetic fields
• Fact Sheet 2 •F
act Sheet 4
Dynamic measurements Effects of subsea power cables
of electromagnetic fields on temperature
3.2 In situ assessment of potential impacts on benthos
• Fact Sheet 5 •F
act Sheet 8
Methods for monitoring sub-tidal benthic Monitoring of benthic megafauna
communities in the vicinity of cables associated with floating wind turbine
connection structures
• Fact Sheet 6
Monitoring of epibenthic communities •F
act Sheet 9
associated with cable protection structures Assessment of the reserve effect associated
with the presence of a protection corridor
• Fact Sheet 7
Monitoring of benthic megafauna associated •F
act Sheet 10 3
with cable protection structures Assessment of the impact of power cables
on adjacent benthic communities
Project results
3.3 Laboratory assessment of potential impacts on benthos
• Fact Sheet 11 •F
act Sheet 13
Methods for the experimental study Study of the impact of artificial magnetic fields
of the responses of benthic organisms on great scallops
to artificial magnetic fields
• Fact Sheet 12
Study of the impact of artificial magnetic fields
on European lobsters
19Measurement of physical effects
1
Tools for measuring electromagnetic fields
Fact Sheet
Objective: To develop tools for the dynamic or static measurement
of electromagnetic fields at sea.
Dynamic measurement of electromagnetic fields: the PASSEM tool
Description Acquisition
The PASSEM tool is a system for measuring electro- The dipoles are distributed along a cable towed by
magnetic fields developed by MAPPEM Geophysics. the system. The electric fields are measured using
Towed by a surface vessel, it consists of a main “fish” AgCl electrodes and high-gain preamplifiers. The
where the acquisition electronics and certain sen- four measurement dipoles have different lengths
sors are located, followed by a cable with electrodes (19 m, 17 m, and two 4 m dipoles) and provide
forming several dipoles and measuring potential dif- data redundancy. Acquisition is carried out with a
ferences between two electrodes (Fig. 5). resolution of 24 bits and a frequency of 2 kHz for
all sensors. The noise level for the electric sensors
is 10-10 nV/m/√Hz, and less than 10 pT/√Hz for the
magnetic sensor. These noise levels are well below
the ambient signal levels.
Advantages
The PASSEM tool enables electromagnetic fields
to be assessed quickly and over a wide area. It also
allows the main sources of the fields to be identified.
This system is easy to deploy. With its dimensions
3
(length of 1.5 m and diameter of 20 cm), the “fish”
can be easily handled by two people on the deck of
© MAPPEM Geophysics
Project results
a vessel, and the detection cables can be deployed
manually. The lengths of the dipoles enable the
precise measurement of the electric fields present
in the area.
Disadvantages
Fig. 5: View of the PASSEM tool on deck prior The PASSEM tool is only capable of measuring
to deployment.
electromagnetic fields at a given moment. As the
The main “fish” comprises the acquisition system, system is towed, the magnetic data are disturbed by
the navigation sensors (altimeter, pressure sensor, the movements of the measuring device and require
inclinometers), and a highly sensitive, three-axis flux- correction.
gate-type magnetic sensor for magnetic field meas-
urements. The electronic fields are measured by four
independent dipoles of different lengths (Fig. 6).
© MAPPEM Geophysics
Fig. 6: Electrical measurement dipoles of the PASSEM tool.
20Static measurement of electromagnetic fields: the STATEM tool
Description Deployment
This stationary device is used to measure electro- Deployment is performed by a ship on the surface,
magnetic fields with a very high degree of accuracy, with or without the assistance of divers depending
and consequently to precisely assess variations near on the launching conditions. The ship holds
the signal sources (Fig. 7). The data are not disturbed position directly above the selected measurement
by the movements of the measuring device, and the point. The STATEM tool is then activated on board
measurements can be made in close proximity to the (synchronisation of the GPS, initialisation and self-
source of the electromagnetic signal (such as cables tests). It can be deployed either using only a crane
or wind turbines). This station has a three-compo- (with a mooring block if the need for localisation
nent, fluxgate-type magnetic sensor and two perpen- accuracy is not very high), or with the help of divers
dicular electric dipoles. It is capable of performing for exact positioning on the seabed (notably near the
data acquisition for a period of two weeks (or more if infrastructures by precisely measuring the distance
required), thereby allowing observation of the evolu- to the source).
tion of the electric and magnetic fields over time. The
Advantages
high-frequency acquisition (512 Hz) also allows the
The STATEM tool enables field measurements to be
recording of alternating field signals.
made more accurately than with a towed system as
the data are not affected by the movements of the
3
measuring device. Recording is done much closer
© MAPPEM Geophysics
to the source of the electromagnetic disturbance. In
Project results
addition, the tool is capable of measuring electric and
magnetic field variations over time.
Disadvantages
This system can require divers to install and re-
trieve the equipment. It can also be difficult to im-
plement at sites where objects (fishing gear) are
© CERESM, 2019
present on the seabed and/or in the water column.
R LEARN MORE
The μV/√Hz for the electrical measurements
Fig. 7: View of the STATEM tool prior to deployment
(top) and placed on the seabed (bottom).
or pT/√Hz for the magnetic sensors are
conventional units of measurement calculated
Specifications from the frequency spectra of noise (power
• Fibreglass frame: 1 m x 1 m. spectral density). For the electric sensors, the
Total span: 5 m maximum electric fields are often also specified in μV/m as
with the arms of the electric dipoles. the levels depend on the length of the dipole used
• Immersion depth: up to 50 m. to perform the measurement.
• Weight on land: approximately 35 kg
(without ballast weights).
Concrete ballast weights are added
to increase stability on the seabed,
depending on the implementation conditions.
They are retrieved at the same time as the station.
• Autonomy: 2 weeks.
• Magnetic sensor: three-axis fluxgate
(noise less than 20 pT/√Hz).
• Electric sensors: AgCl type, dipole length up
to 5 m (noise < 0.2 μV/√Hz).
• Acquisition: 512 Hz, 32 bits.
21Measurement of physical effects
2
Dynamic measurements of electromagnetic fields
Fact Sheet
Objective: To characterise the electric and magnetic fields in the vicinity of several types
of subsea power cables.
Context:
To date, and considering the vast number of subsea contrasting characteristics (power rating, burying
power cables already deployed throughout the world’s depth, etc.). The two study sites selected feature
oceans, surprisingly few in situ measurements very different power transmission technologies:
have been made of the resulting electromagnetic DC power transmission for the cables of the HVDC
fields. Indeed, the field strength values generated Cross-Channel interconnector between France and
are often provided on the basis of models and are the United Kingdom, and AC power for the cables
rarely validated by in situ measurements. Within this linking the island of Jersey to the Cotentin Peninsula
context, the objective of this study was to measure in France. The signals measured were therefore
the electromagnetic fields emitted by subsea expected to be different.
power cables already in operation and presenting
Method:
The electromagnetic fields were measured using
the PASSEM tool (Fact Sheet 1 ) during two different
missions.
• For the HVDC Cross-Channel interconnector, 13
3 transects were performed on 27 September 2018
at a distance of between 4 and 20 m above the four
HVDC cables and at a speed of approximately 3
Project results
knots (Fig. 8).
© Antoine Carlier, Ifremer
• For the Jersey interconnector, 11 transects were
performed above the three cables from 25 to
26 June 2019: five transects on Day 1 above the
Normandie 1 (N1) and Normandie 2 (N2) cables in
the vicinity of the P1 zone, and six transects on Day
2 above the Normandie 3 (N3) cable in the vicinity
of the P4 zone (Fig. 9). Due to unfavourable weather Fig. 9: Positions of the profiles (P1 to P6) and stations
(S1 to S3) initially planned for measuring the electromagnetic fields
conditions, only the zones of the profiles P1 and P4 along the Jersey-Cotentin connection comprising the N1, N2
could be inspected. and N3 cables, using the PASSEM tool.
© MAPPEM Geophysics
Fig. 8: Positions of the transects defined using the PASSEM tool (black lines) to measure the electromagnetic fields emitted
by the cables of the HVDC Cross-Channel interconnector (red lines).
22Results:
The electromagnetic signals of the cables were Measurements taken above the HVDC Cross-Channel
clearly identifiable in the measured data, notably cables unexpectedly identified a significant electric
in the spectrograms used to measure the various signal above the Channel Tunnel, and therefore
detectable harmonics. likely to come from this underground structure. In
The HVDC Cross-Channel cables showed a magnetic this area, the measuring device showed a saturated
field of a few hundred nanoteslas at a distance of signal over a few tens of metres on the “west” side
10 m, and an electric field that was solely due to the of the transects. As the recording range of the
disturbance frequencies present, themselves related electric signal had been previously configured for the
to the devices used to rectify the electric current (Fig. characterisation of the cable signals, this indicates
10). The signals were different at the Jersey site. The that the Channel Tunnel potentially generates an
magnetic fields were of the same order of magnitude, electric field higher than those associated with
but presented mainly frequency components due to the HVDC Cross-Channel power cables. A new
the nature of the current flowing through the cables. measurement campaign, with a recording range
The frequency content was therefore much stronger tailored to the signal that can be expected for this
with decreasing harmonic components. The 50 Hz type of structure, would help to more precisely
signals were obviously the highest (Fig. 11). The characterise the electromagnetic effect experienced
electric signals were more easily exploited due to the by the benthic ecosystem at this location.
length of the dipoles of the PASSEM tool. The main
magnetic signals could, however, also be identified.
3
Project results
© MAPPEM Geophysics
© MAPPEM Geophysics
Fig. 10: Magnetic fields observed at the HVDC Fig. 11: Magnetic fields observed at the Jersey site
Cross-Channel site (top graph) showing the magnetic signals (top graph) showing the magnetic signals of the two cables,
of the two cables, and spectrograms of the electric signals and spectrograms of the electric signals measured
measured by the four dipoles of the PASSEM tool (bottom graphs). by the four dipoles of the PASSEM tool (bottom graphs).
The presence of both cables is visible, particularly thanks to a 600 Hz
signal resulting from the power conversion to direct current.
Limitations:
Conclusion:
At the scale of an area where several cables are The movements of the PASSEM tool increased the
present, the PASSEM system made it possible to level of noise in the data. The quantification of the
characterise the electromagnetic signals and to electromagnetic fields was approximate as the
obtain an assessment of the amplitude of the electric electric currents flowing through the cables were
and magnetic fields depending on the power of the often not precisely known at the exact moment when
electric current in the cables. The electric fields were the system passed over the cables. This is because the
measured with high accuracy. The magnetic fields power data were averaged. Furthermore, it is difficult
were often noisier because of the distance to the at this stage to normalise the electromagnetic field
cables (generally several metres) and movements values with respect to the distance to the cable due
due to the system being towed by the ship. to the non-linear and complex nature of the emitted
fields.
23Measurement of physical effects
3
Static measurements of electromagnetic fields
Fact Sheet
Objective: To measure the variations over time in the electric and magnetic fields
in the vicinity of several types of subsea power cables.
Context:
To date, considering the vast number of subsea these measurements, a limited body of research
power cables already deployed throughout the is concerned with the evolution of the fields over
world’s oceans, relatively few in situ measurements time. Within this context, the objective of this study
have been made of the resulting electromagnetic was to measure the fluctuations over time of the
fields. Indeed, the field strength values generated electromagnetic fields emitted by two subsea power
are often provided on the basis of models and are cables in operation.
rarely validated by in situ measurements. Among
Method:
The electromagnetic fields were measured using the cable (Fig. 12). For the SEM-REV site cable, the
the STATEM tool (Fact Sheet 1 ) in the immediate system was positioned 2 m from the connection hub
vicinity of the Normandie 1 cable connecting Jersey (Fig. 13) on 22 October 2019. The exact geographical
to the French grid and of the connection hub for the position of the device was less important than the
SEM-REV test site. For the “Normandie 1” cable, the distance and orientation of the station with respect
system was deployed from 25 to 29 June 2019 on the to the cable.
seabed at the S1 station, at a distance of 4 m from
3
Project results
© Antoine Carlier, Ifremer
© MAPPEM Geophysics
© MAPPEM Geophysics
Fig. 12: Location of the S1 station on the Jersey- Fig. 13: Diagram showing the position of the STATEM tool
Cotentin connection comprising the N1, N2 and N3 cables (top), in relation to the connection hub of the SEM-REV test site. Dipole 1
and positioning of the STATEM tool in relation to the N1 cable corresponds to dipole X+X-, and dipole 2 to dipole Y+Y-.
(bottom).
24Results:
For the “Normandie 1” cable, the variations in the floating wind turbine, including maximum generation
magnetic field, measured and filtered on the main at the end of the recording period. The strength of the
harmonics, followed the variations in the power of magnetic field emitted by the hub followed the same
the current in the cable throughout the measurement oscillations as the intensity of the electric current.
period (Fig. 14). These variations were in the range of This magnetic signal varied from 0.5 to 6 nT at a
a few nanoteslas 4 m from the cable. The same was distance of 2 m from the hub, with saturation at 6
true for the electric fields (Fig. 15), with variations of nT during the maximum power generation phase
a few hundred nanovolts per metre for approximately (Fig. 16).
30 MW of power present in the cable (approximately The electric field increased progressively over the
200 A). same period, reaching a maximum value of 16 μV/m.
At the connection hub of the SEM-REV test site, the This signal was less well correlated with the intensity
electromagnetic field data were obtained over a short of the electric current produced at the beginning of
period of time (a few hours), which corresponded to a the recording period (Fig. 17).
phase of increasing power generation by the Floatgen
© MAPPEM Geophysics
© SPECIES Project
3
Project results
Fig. 14: Magnetic field strength measured (in blue)
and electric power flowing through the N1 cable between 25 and 29 Fig. 15: Electric field measured (in blue) and power
June 2019 (in red; data provided by the Jersey Electricity Company). flowing through the N1 cable (in red).
© MAPPEM Geophysics
© MAPPEM Geophysics
Fig. 16: 50, 100, 150, 200, 250 Hz components Fig. 17: 50, 100, 150, 200, 250 Hz components
of the total magnetic field recorded over 17 hours (in blue) of the electric field recorded by dipole 1 (in blue)
and current intensity in the cable (in red). and current intensity in the cable (in red).
Limitations:
Conclusion:
The STATEM station made it possible to very It was necessary to know the characteristics of the
accurately measure the electric and magnetic injected electric current and the relative positions
fields in the vicinity of a laid cable and a subsea of the cable and the station in order to extrapolate
electric connection infrastructure. The correlation the amplitudes of the signals emitted by the cables.
between the electromagnetic fields recorded and Given the non-linear nature of the electromagnetic
the intensity of the electric current flowing through fields and the complexity of the cable structures, it
the cable and the hub was very good. The recorded is difficult at this stage to accurately standardise the
electromagnetic fields even reflected the phase of magnetic fields emitted in relation to the distance
maximum power generation at the SEM-REV test from the cable and the current on the basis of the
site. The STATEM tool is thus able to correctly assess measurements made.
the electromagnetic signal emitted during the
different phases of operation of ORE systems.
25Measurement of physical effects
4
Effects of subsea power cables on temperature
Fact Sheet
Objective: To characterise the potential heat produced by the passage of electric current
through cables.
Context:
In general, the passage of an electric current through can lead to an increase in temperature both at their
a conductor produces heat. This is known in physics surface, which is colonised by benthic organisms,
as Joule heating. Although the conductive part of the and in their immediate environment. Although the
cables, also known as the core, is protected by various electric power cables of offshore wind farms and
metallic and plastic materials, thermal radiation marine interconnectors can transmit high levels of
exists, and is usually dissipated by the movements of electric power, there is very little data in the literature
the water mass. In the case of subsea power cables, on the potential temperature increase on and around
the aim was to determine whether their operation the cables, whether or not they are buried.
Method:
Surface temperature recordings of various power to record the temperature every 1 to 3 hours depend-
cables were made at several study sites with cables ing on the sites, with a sensitivity of 0.06°C and an
in operation: the Jersey-Cotentin connection and the accuracy of 0.5°C. A sealant was used to seal the
Ushant, Paimpol-Bréhat and SEM-REV test sites. At probes. The cable probes were attached to the sur-
each of these sites, the strategy consisted in taking in face of the cables using ColsonTM clamps.
situ temperature measurements using autonomous The intermittent power generation and the fluctu-
3 probes attached to the surface of the cables as well ation in consumption resulted in a variation in the
as on an inert support nearby to obtain the natural power and intensity of the electric current flowing
seawater temperature (control temperature). The through the cables.
Project results
potential disturbance was characterised by measur-
The recordings were therefore made over a sufficient
ing the difference in temperature between the cable
period of time to capture these variations in electric
probes and the control probes. The probes used were
power and therefore potential heating.
iButton-type probes (Fig. 18). They were configured
© SEM-REV test site, Centrale
© Olivier Dugornay, Ifremer
Nantes-CNRS
a b
© CERESM, 2019
© CERESM, 2019
c d
Fig. 18: Examples of the temperature probes installed on cast iron protection shells (a: Paimpol-Bréhat site) or directly on the surface
of an unprotected cable (b: SEM-REV site; c and d: Jersey-Cotentin connection).
26You can also read