A network business risk and resilience study for Highlands & Islands Airports Ltd - Hial
←
→
Page content transcription
If your browser does not render page correctly, please read the page content below
JLS Consulting Ltd
                         Energy Aviation Services Ltd

A network business risk and
resilience study for Highlands &
Islands Airports Ltd

                   Dr Romano Pagliari (Cranfield University)
                            Andy Foster (Cranfield University)
                 Dr Pere Suau-Sanchez (Cranfield University)
                 Chris Holliday (Energy Aviation Services Ltd)
                          John Strickland (JLS Consulting Ltd)
August 2017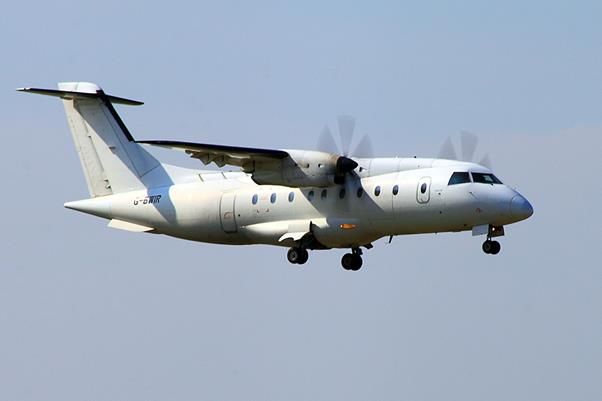
Network business risk and resilience study for Highlands & Islands Airports
Contents
1 Executive Summary .................................................................................... 4
2 Rationale and scope of the study................................................................ 9
2.1 Rationale ............................................................................................................ 9
2.2 Scope .................................................................................................................. 9
3 Existing model of air services .................................................................... 11
3.1 Introduction ..................................................................................................... 11
3.2 Historical evolution of Capacity, Traffic and Load Factor ................................ 12
3.3 Frequency and Maximum Lapsed Destination Time ....................................... 14
3.4 Market structure and barriers to entry............................................................ 16
3.5 Air fares survey................................................................................................. 20
3.6 Historical evolution of flight punctuality ......................................................... 30
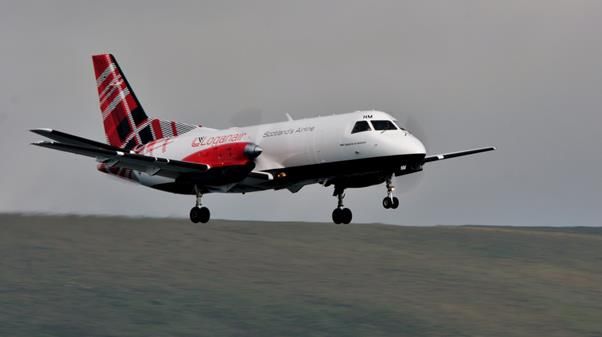
3.7 Loganair Fleet ................................................................................................... 33
3.8 SWOT Analysis .................................................................................................. 39
4 Use of Public Service Obligations (PSO) ..................................................... 43
4.1 Definition and overview ................................................................................... 43
4.2 The strengths and weaknesses of the PSO mechanism ................................... 44
4.3 UK policy on and use of PSO ............................................................................ 49
4.4 Brexit and PSO .................................................................................................. 52
4.5 EU DG MOVE view on novel and contentious propositions ............................ 53
5 Airline Options .......................................................................................... 56
5.1 Introduction ..................................................................................................... 56
5.2 Virtual Airline ................................................................................................... 56
5.3 UK CAA views on virtual airlines ...................................................................... 60
5.4 Owned Airline................................................................................................... 63
5.5 General comment on airline based solutions .................................................. 64
6 Comparison of Virtual airline and PSO ....................................................... 65
6.1 Introduction ..................................................................................................... 65
6.2 PSO models ...................................................................................................... 66
6.3 Comparison ...................................................................................................... 69
ii
Network business risk and resilience study for Highlands & Islands Airports

7      Aircraft economics .................................................................................... 77
7.1    Saab 340 and ATR 42 ........................................................................................ 77
7.2    Small turboprop versus Saab 340 and ATR42 .................................................. 82
8      Route Hierarchy ........................................................................................ 85

                                                        iii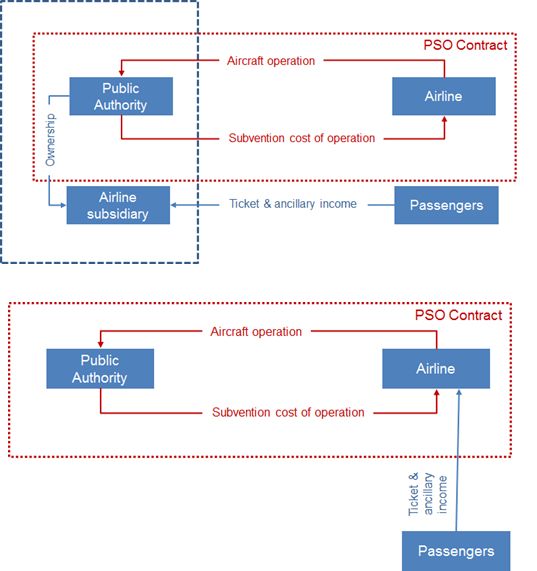
Network business risk and resilience study for Highlands & Islands Airports

1          Executive Summary

1.1        Existing model
1.1.1      There has been an improvement historically in the supply of air services across
           the Highlands and Islands commercial air services network in terms of seating
           capacity, service frequency and timetabling.

1.1.2      Between 2012 and 2016, traffic grew by 9% and seat capacity by 6%. The
           network achieved an average load factor of between 60% to 65% during this
           period. Load factors were particularly strong on some routes (e.g Edinburgh-
           Kirkwall, Glasgow-Stornoway) and lower on others, especially on the Inverness
           routes. The load factors on the two existing Eastern Airways connections are
           very low calling into the question the future sustainability of these routes.

1.1.3      Our ADS air fares survey found the cost of return travel from the islands to
           mainland airports to be particularly high with regard to the Orkney and
           Shetland markets. Some travel itineraries were sold-out before the day of
           departure which suggests that there may be issues of capacity availability on
           these routes. We observe a marked escalation of fare levels within four weeks
           of departure and on some itineraries average gross non-ADS return fares over
           the two month period prior to departure in excess of £350. It is not possible to
           confirm the common perception that the problem of excessive air fares is
           endemic across the network as our sample of observations was quite small but
           we do appear to have found some evidence of problems in some markets.

1.1.4      We observe a marked deterioration in flight punctuality across the network
           between 2014 and 2015. There is a modest improvement to 2016 but overall
           punctuality still remains well below levels attained in 2012.

1.1.5      We note Flybe’s planned expansion of air services commencing in September
           2017 which was announced, to our surprise, during the course of this study. We
           expect there to be a period of intense competition which may stimulate some
           traffic growth but this is not expected to continue and we would anticipate that
           head-to-head competition will dissipate over time with the market reaching a
           state of general equilibrium where both carriers co-exist in the market but
           operate independently of each other.

1.1.6      We produce a SWOT analysis of the network and note in particular that there
           are risks to the future sustainability of the network which are likely to stem
           from challenges around replacement options for the ageing fleet of Loganair
           Saab 340s. We also note particular risks relating to Brexit and the longer-term
           challenges around island de-population. The entry of Flybe into the market, to

                                             4
Network business risk and resilience study for Highlands & Islands Airports
some extent ensures that the busier markets will remain commercially
sustainable.
1.2 Use of Public Service Obligations (PSO)
1.2.1 If the UK retains access post—Brexit to the European Common Aviation Area,
through membership of the EEA, they will be continue to be bound by EC
Regulation 1008/2008 and its provisions relating to state aid and PSO. Any
other arrangement with regard to UK-EU air services post-Brexit, most probably
means that the UK will no longer be bound by the need to use the PSO
instrument. Our working assumption at this stage is to assume that the UK will
retain use of PSO into the foreseeable future.
1.2.2 Implementation of PSOs remains the most obvious and readily available
instrument that can be deployed to ensure isolated communities retain air
service connectivity. But there will always be risks and uncertainties as to
whether tendering exercises will be successful in all cases. We highlight several
barriers to entry which have had the effect of limiting the competitiveness of
tendering exercises historically in practice.
1.2.3 We found that the PSO instrument has deficiencies and these largely revolve
around short lead-times between tendering and the commencement of
operations and limited incentives to improve patronage. The former acts as a
barrier to entry and the latter inhibits the potential progression from PSO to
commercial subsidy-free operations.
1.2.4 The success or otherwise of how a PSO is used also depends on how public
authorities and member states interpret the regulations. Some jurisdictions
will be rigid in their interpretation of the regulation and others more generous.
Generally, public authorities have been quite rigid which has meant that it is not
possible to find examples of novel and innovative departures from common
practice.
1.2.5 Deviations from the norm in Scotland would require legal advice and prior
consultation, discussion and approval from Transport Scotland, The Department
for Transport (DfT) and the European Commission Directorate for Mobility and
Energy (DG MOVE).
1.2.6 A PSO would be impractical in circumstances where a short-term solution is
needed to address the loss of air service connectivity because public authorities
have to provide at least 6 months’ notice.
1.3 Airline Options
1.3.1 In response to the limitations and imperfections of the PSO instrument, we
5Network business risk and resilience study for Highlands & Islands Airports
evaluate the prospects for an airline owned by HIAL that could be set-up to
supply air services in circumstances where commercial flights had been
withdrawn. We consider two airline solutions; a virtual airline and an owned
airline.
1.3.2 The virtual airline is where HIAL establishes a subsidiary company which
essentially functions as a management entity that manages revenue, sells
tickets and markets and promotes air services. This entity has an ATOL license
and procures air services from an aircraft operator which holds an AOC. The
airline owned model is where the subsidiary also holds an AOC and operates the
aircraft.
1.3.3 Safety is important so we invited the UK CAA to comment on our proposals.
They expressed a view that due to concerns around safety management, they
are uncomfortable with the deployment of a virtual airline and preferred
instead an airline owned model.
1.3.4 The practicalities of establishing and managing a virtual airline would are
unlikely to be too complicated. This is because we believe that is would be
possible to obtain an ATOL license and that various booking and yield
management systems could be put in place at relatively short notice.
Furthermore, many of the functions and processes can already be provided
from within the HIAL management structure (finance, legal, procurement etc).
The airline owned option, in contrast, carries much greater cost and complexity
and would be difficult to sustain commercially.
1.3.5 There are a number of issues and complications around the airline options.
Aside from the additional start-up costs, there would be significant economic
and regulatory challenges. In the former case, the economics would be very
challenging if the airline (owned or virtual) was only limited to operating on one
route. Regulators and competition authorities will most certainly have
concerns over the use of state aid that would be needed to support both types
of operation.
1.4 Comparison of the options
1.4.1 We compare the merits of deploying two airline options with two variants of
the PSO model. The two variants of the PSO model represent standard practice
(PSO normal) and a modified instrument where the public authority takes
responsibility for sales, ticketing, revenue management and marketing and an
airline is contracted to supply aircraft seat capacity; we refer to this as PSO plus.
1.4.2 If we are looking to maintain the highest levels of safety and punctuality, then
our suggestion would be that a HIAL virtual or owned airline would deliver
6Network business risk and resilience study for Highlands & Islands Airports
better performance. This does not mean that PSO operations are unsafe. What
we are saying is that HIAL will be better able to leverage from within its
organisation skills, experience and capability in these areas.
1.4.3 Commercially – in terms of maintaining cost efficiency, maximising revenues
and lowering subsidy, we think that in the long-run the PSO models offer the
best value for money. The PSO models also offer significant advantages in
terms of enabling better inter-operability with world-wide schedules through
code-share agreements, interline agreements and access to GDS. An owned
rather than virtual airline will only be able to achieve lower levels of inter-
operability. We also believe that the start-up costs for an owned airline will be
very high.
1.4.4 We think there will be concerns regarding the use of state aid outside of the
PSO framework. So our recommendation is that legal advice is obtained and
discussions are undertaken with appropriate officials in the different levels of
government.
1.4.5 In the event of a sudden loss of air services, the owned airline and PSO options
are not practical solutions – due mainly to being associated with long-lead times
to deployment. One of our key recommendations is that a virtual airline is
established and ready for immediate deployment as a temporary solution to
maintain connectivity until permanent air services are established whether that
is through a commercial subsidy-free operation or a PSO.
1.5 Aircraft economics
1.5.1 The Saab 340 delivers the lowest variable operating costs and fixed costs
compared to the other aircraft considered in our evaluation. They are old and
because of that ownership costs are low.
1.5.2 The ATR42 has higher operating costs than the Saab 340. However, it is slightly
more competitive in cost terms relative to the Saab 2000.
1.5.3 The larger ATR72 offers very competitive cost per seat relative to the other
models but its total trip cost is quite high relative to the Saab 340. Newer
versions of the ATR42 (e.g. 600 series) are very uncompetitive relative to the
Saab 340 in both per seat and total trip cost terms.
1.5.4 Our modelling of Contribution (Profit) by level of demand shows that over some
ranges, the ATR42 offers better economic performance than the Saab 340.
1.5.5 While the deployment of larger aircraft (e.g. ATR72) in these markets will
invariably mean lower frequency compared to the smaller Saab 340. However,
at the same time, the financial performance offered by larger aircraft is more
superior. Whilst larger aircraft mean lower frequency, larger aircraft are able to
7Network business risk and resilience study for Highlands & Islands Airports
deliver cheaper fares. The ATR72, for example, could offer average fares of
between 15 to 30% lower than the Saab 340.
1.5.6 Both the Twin-Otter (18 seat) and the Cessna Caravan (9 seat) achieve lower
variable and fixed operating costs for a typical sector length of 100nm
compared to the Saab 340 and ATR42.
1.5.7 However, because the two smaller aircraft have much lower seating capacities,
their respective per seat costs are much higher than the Saab 340 and the
ATR42. This means that higher average fare levels would be needed to sustain
economically viable commercial operations.
1.6 Route Hierarchy
1.6.1 We estimate how non-PSO Scottish internal routes have performed financially
in 2016 using our own model in order to identify the extent to which there is a
risk to the continuity of air services on a given route.
1.6.2 We can cluster the routes into three groups:
Very Low risk (Glasgow-Stornoway, Edinburgh-Kirkwall, Edinburgh-
Sumburgh, Aberdeen-Sumburgh and Aberdeen-Kirkwall)
Low risk (Glasgow-Sumburgh, Glasgow-Islay, Benbecula-Glasgow, Inverness-
Kirkwall, Inverness-Stornoway, Glasgow-Kirkwall)
Moderate risk (Edinburgh-Stornoway, Kirkwall-Sumburgh, Edinburgh-Wick
and Inverness-Sumburgh)
High risk (Aberdeen-Stornoway, Aberdeen-Wick)
1.6.3 Only two of the routes are loss-making (Aberdeen-Stornoway and Aberdeen-
Wick). Profitability is marginal on the Moderate risk routes. Worryingly, there
seem to be significant risks around the future sustainability of both routes that
serve Wick airport.
8Network business risk and resilience study for Highlands & Islands Airports
2 Rationale and scope of the study
2.1 Rationale
2.1.1 Highlands & Islands Airports Ltd (HIAL) has raised concerns regarding possible
risks to the future supply of air services in the region. These risks centre on
uncertainty relating to the long-term commitment of Loganair to maintaining
the shape of its existing network.
2.1.2 There are risks that commercial / non-PSO services on low density markets
serving isolated communities could be vulnerable to withdrawal in the future.
Withdrawal could materialise as a result of one or a combination of the
following factors:
A shift in airline corporate strategy as a result of a change in ownership.
Pressures on the continued viability of the existing network as the Saab
340’s retire and new larger and probably more expensive aircraft are
deployed across the network.
2.1.3 While the imposition of a PSO may mitigate some of these risks, tendering
exercises can be lengthy and may not always be successful. HIAL needs to
consider a solution that can be deployed at very short notice to maintain air
connections to those markets that are vulnerable to service withdrawal until a
PSO can be deployed. Furthermore there needs to be a consideration of longer-
term solutions should a PSO tender be unsuccessful in attracting airline interest.
2.2 Scope
2.2.1 HIAL has requested that the consultants consider the following dimensions in
the scope of the study.
An evaluation of the existing model of commercial (non-PSO) services in
the Highlands and Islands network focussing on traffic, capacity, load
factor, frequency, aircraft fleet, timetabling and air fares.
An open and objective critique of the current PSO mechanism as a
method for ensuring connectivity within and to remote regions.
An investigation into the potential for a virtual airline to operate in
circumstances where commercial life-line links have been withdrawn
with little prospect that these services would be operated by other
airlines.
A comparison of whether a PSO or Virtual Airline solution will work. This
section will consolidate the themes from the previous two sections whilst
considering alternatives.
9Network business risk and resilience study for Highlands & Islands Airports
A comparison of the economics of operating the current Saab 340 with
both equivalently sized (e.g. ATR42) and smaller aircraft (e.g Twin otter).
A route hierarchy analysis showing which routes are strong, which are
marginal and which are at significant risk of market failure.
10Network business risk and resilience study for Highlands & Islands Airports
3 Existing model of air services
3.1 Introduction
3.1.1 In our evaluation of the existing model of air services in the Highlands and
Islands, we track how capacity, traffic, load factor, frequency and flight schedule
convenience (measured by maximum lapsed destination time) have evolved
between 2012 and 2016.
3.1.2 The scope of our analysis incorporates the following routes:
Aberdeen (ABZ) – Kirkwall (KOI) Glasgow (GLA) – Islay (ILY)
Aberdeen (ABZ) – Stornoway (SYY) Glasgow (GLA) – Kirkwall (KOI)
Aberdeen (ABZ) – Sumburgh (LSI) Glasgow (GLA) – Stornoway (SYY)
Aberdeen (ABZ) – Wick (WIC) Glasgow (GLA) – Sumburgh (LSI)
Benbecula (BEB) – Glasgow (GLA) Inverness (INV) – Kirkwall (KOI)
Edinburgh (EDI) – Kirkwall (KOI) Inverness (INV) – Stornoway (SYY)
Edinburgh (EDI) – Stornoway (SYY) 1 Inverness (INV) – Sumburgh (LSI) 2
Edinburgh (EDI) – Sumburgh (LSI) Kirkwall (KOI) – Sumburgh (LSI)
Edinburgh (EDI) – Wick (WIC)
3.1.3 During this period, each route was served by one carrier. Eastern Airways
operated Wick-Aberdeen and Stornoway-Aberdeen while all the others were
served by Loganair. In June 2017, Flybe announced an expansion of air services
in the region with a plan to compete head-to-head with Loganair on selected
markets. We discuss this in greater detail in Section 3.4.
3.1.4 Most of routes, over the reporting period were operated on a non-stop basis;
although some connections between Inverness and Sumburgh and Stornoway
and Edinburgh were scheduled to include an intermediate stop in Kirkwall and
Inverness respectively.
3.1.5 The Loganair non-PSO network over the period was served by three aircraft
(turboprop) types; Saab 340 (34 seats), Dornier 328 (33 seats) and Saab 2000
(50 seats). Eastern operates 29-seat BAe Jetstream 41 turboprops on its two
routes linking Aberdeen with Stornoway and Wick.
1
Operated at times throughout the reporting period with a stop in Inverness.
2
Some services operated with a stop in Kirkwall.
11Network business risk and resilience study for Highlands & Islands Airports
3.2 Historical evolution of Capacity, Traffic and Load Factor
3.2.1 Table 1 below provides total seating capacity supplied, passenger traffic and
average load factor data aggregated across the network on an annualised basis
from 2012 to 2016. We also report separate data for Loganair and Eastern
Networks.
Table 1: H&I network and airline capacity, traffic and load factor data
2012-2016 (Source: OAG Analyzer & CAA)
% %
2012 2013 2014 2015 2016 change change
12-16 15-16
Total H&I network
Seats 747,872 742,411 794,689 792,973 793,985 6% 0%
Traffic 446,707 470,307 507,784 491,993 485,624 9% -1%
Load Factor 60% 63% 64% 62% 61%
Loganair
Seats 690,278 684,875 737,153 735,437 744,557 8% 1%
Traffic 427,618 451,883 488,959 475,791 472,211 10% -1%
Load Factor 62% 66% 66% 65% 63%
Eastern
Seats 57,594 57,536 57,536 57,536 49,428 -14% -14%
Traffic 19,089 18,424 18,825 16,202 13,413 -30% -17%
Load Factor 33% 32% 33% 28% 27%
3.2.2 On a system-wide level, average load factor is around 60% to 65%. However,
there is a marked difference in the levels achieved by Loganair and Eastern.
Loganair achieved average load factors in the range 60%-64% during the period
in contrast to Eastern, where there had been a steady decline from 33% in 2012
to 27% in 2016. This suggests that there is heightened risk that Eastern may
exit those routes.
3.2.3 Reference to the more detailed route data in Table 2 shows that both Eastern
routes have experienced a marked decline in load factors since 2012. There are
possibly two explanations for why we think Eastern continues to operate on
these routes:
The yields achieved on both routes are sufficient to cover costs and
earn a reasonable margin for the airline.
Both routes provide important feeder traffic which support services to
destinations beyond their Aberdeen hub.
3.2.4 Eastern's very low load factors and high fares compared to the routes operated
12Network business risk and resilience study for Highlands & Islands Airports
by Loganair do suggest that there is some growth potential in these markets, if
more competitive pricing was available. On the other hand, it is fair to say that
the Eastern routes are very much tied to the oil exploration and extraction
sector which has seen a significant drop in demand over the last two years. We
think this, in part, has contributed to the poor performance
3.2.5 We can observe some variation across Loganair routes in terms of load factor
performance. Both Aberdeen and Edinburgh links to Kirkwall are both very
strong, less so for services to Sumburgh. The strongest Glasgow route is to
Stornoway where Load factors have been in excess of 70% during the period.
The weakest route is Glasgow-Kirkwall, where load factor is much lower in 2016
than in 2014 Extra capacity supplied by Loganair on its Sumburgh routes to
both Aberdeen and Glasgow, largely explain recent declines in load factor. All
the Inverness routes perform quite poorly achieving load factors below 60%.
Load factors are also very low on the two routes serving Wick.
Table 2: Annual average load factor per route 2012-16 (Source: OAG Analyzer &
CAA)
% change % change
2012 2013 2014 2015 2016
12-16 15-16
Aberdeen-Kirkwall 72% 71% 72% 71% 70% -3% -1%
Aberdeen-Sumburgh 68% 70% 66% 64% 59% -12% -8%
Aberdeen-Stornoway 37% 36% 41% 36% 34% -8% -6%
Aberdeen-Wick 32% 31% 30% 25% 24% -24% -5%
Benbecula-Glasgow 51% 58% 64% 64% 64% 24% 0%
Edinburgh-Kirkwall 67% 76% 73% 73% 74% 9% 0%
Edinburgh-Sumburgh 66% 73% 69% 73% 68% 4% -6%
Edinburgh-Inverness-Stornoway 53% 54% 57% 52% 52% -2% -1%
Edinburgh-Wick 46% 55% 55% 56% 55% 22% 0%
Glasgow-Islay 57% 61% 65% 64% 64% 13% 1%
Glasgow-Kirkwall 61% 72% 70% 69% 62% 2% -10%
Glasgow-Sumburgh 72% 78% 73% 69% 68% -6% -1%
Glasgow-Stornoway 70% 72% 76% 69% 72% 2% 4%
Inverness-Kirkwall-Sumburgh 52% 55% 56% 56% 56% 8% 0%
3.2.6 The general direction of load factors from 2012 appears to be downward for
Loganair H&I routes with the current average of 63% being lower than that
achieved in 2014 (66%).
3.2.7 Load factor is a superficial physical measure of route financial performance. It is
possible that on those routes where ratios are below 60% or even 50%, yields
could be sufficient to recover costs and earn a positive return for the airline.
13Network business risk and resilience study for Highlands & Islands Airports
3.3 Frequency and Maximum Lapsed Destination Time
3.3.1 Average return frequency on Loganair routes is much higher than Eastern.
Indeed, for Eastern there was a marked reduction between 2015 and 2016.
3.3.2 Loganair serves most of its routes with multiple rotations on weekdays, with the
sole exception of Edinburgh-Wick and Glasgow-Kirkwall. There has been a
substantial improvement in weekday frequency on routes linking Sumburgh
with both Glasgow and Edinburgh.
3.3.3 The deployment of Saab 340s has provided Loganair with the ability to absorb
increased demand through the deployment of additional frequencies. In some
markets, there has been an upscaling of aircraft size through the use of the Saab
2000.
3.3.4 For many island and mainland residents, the ability to complete a day return
journey is very important. This is especially relevant for health and business-
related travel.
Figure 1: Average daily return frequency by airline 2012-2016
3.3.5 We can measure day-return travel by calculating how much time has lapsed
between the first possible arrival at a destination and the last return flight back
to the point of origin. We can refer to this as Maximum Lapsed Destination
Time (MLDT) and this can be calculated for both directions on each route.
3.3.6 In our MLDT analysis, we exclude Edinburgh-Wick, Glasgow-Kirkwall and
Aberdeen-Stornoway because these markets are served by single daily
rotations.
3.3.7 Directional variation within routes largely reflects the over-night positioning of
aircraft. Loganair positions its aircraft at various over-night locations (Glasgow,
Edinburgh, Inverness, Aberdeen, Kirkwall and Sumburgh). This means that
14Network business risk and resilience study for Highlands & Islands Airports
travellers originating in these locations generally enjoy higher MLDT compared
to those markets served by airports that are not served by a based aircraft
(Islay, Benbecula, Stornoway, Wick).
3.3.8 It should be noted that whilst better for customers, the dispersed nature of
Loganair's fleet adds to operational costs in terms of requirements for flight
crews and maintenance support. It also creates additional risk and complexity in
terms of reliability and punctuality.
3.3.9 Figure 2 below shows one-directional MLDT between various points in the
network. With the exception of Benbecula-Glasgow and Kirkwall-Sumburgh, all
MLDT values are quite significant demonstrating that in most markets that
schedules that are offered allow sufficient time for travellers to organise day
return trip itineraries. Figure 2 does show that in most markets, a modest
decline was recorded during the period of observation; but this is quite
insignificant.
Figure 2: Maximum lapsed destination time (hours) by route 2012 and 2016
3.3.10 Figure 3 compares MLDT on different legs within each route. For island
residents, we see that MLDT levels are generally higher in the Northern Isles
where Loganair over-night some aircraft so that an early morning departure to
the mainland is possible followed by a late afternoon / early evening return. For
the Western isles route there is no over-night positioning of aircraft meaning
MLDT will be lower on the island to mainland leg. Generally, however,
schedules are very convenient with the exception of Benbecula where it is not
possible for resident of South Uist to achieve a reasonable day return trip to
Glasgow.
3.3.11 In some markets, due to the volume of frequency supplied (e.g. Glasgow-
Stornoway, Aberdeen-Sumburgh) travellers will be able to achieve day return
15Network business risk and resilience study for Highlands & Islands Airports
itineraries below MLDT. This is particularly important to business passengers
who are able to avoid the inconvenience of waiting for long periods before
being able to catch a return flight home.
3.3.12 For business travellers based on the mainland the ability complete a day return
is constrained in some markets. In addition to Glasgow-Benbecula, MLDT is
constrained on day return travel from Inverness to Sumburgh. Sumburgh is
particularly problematic because the airport is located at a significant distance
from the main population centre at Lerwick.
Figure 3: Maximum Lapsed Destination by route sector 2016
3.4 Market structure and barriers to entry
3.4.1 Air services on each route are operated by one carrier. Our original assumption
was that traffic volumes are generally insufficient to attract competitive new
entry (we discuss Flybe’s recent announcement below). Up to now incumbent
airlines Loganair and Eastern have enjoyed a considerable degree of market
power on the routes that they serve – especially with regard to the longer
distance services where air travel is considerably faster and more reliable than
other modes of transport.
3.4.2 There are few examples to cite historically of competition within the network.
In all cases it has been occasional and without exception short-lived. Aberdeen-
based Business Air with Shorts 360s and Saab 340s struggled briefly with British
Airways on Aberdeen-Sumburgh in the mid-190s Bmi regional entered the
Stornoway-Glasgow market in 2002 with a single daily service operated by a 49-
seat Embraer 145 regional jet competing against multiple daily rotations offered
by Loganair. The service was withdrawn four years later due to insufficient
traffic volumes. The most recent example of competition was in late 2005
when a small regional airline Air Caledonian operated a service between
16Network business risk and resilience study for Highlands & Islands Airports
Prestwick and Stornoway in competition with Loganair’s Glasgow operation;
this venture only lasted 1 month.
3.4.3 All routes would struggle to support two carriers for a sustained period of time.
Market entry, therefore, is likely to have the following features. If entry on a
route is significant in scale (high volume frequency and capacity offered), then it
is possible that the incumbent airline may eventually be displaced.
3.4.4 Previous experience has shown that if entry is more limited in scale, then it is
more likely that the incumbent will successfully defend its market share and
that the new entrant will eventually exit the market.
3.4.5 Survival will depend on pricing strategy, frequency, product offer, perception of
service and to some extent brand loyalty.
3.4.6 The only barrier to entry that may exist in some markets is in relation to the
provision of airport ground handling services (check-in, baggage loading /
unloading etc.). Different arrangements exist across the HIAL airport network.
At the smaller airports (e.g. Islay), HIAL provides these services for airlines.
Loganair handles its own operations at Benbecula, Kirkwall, Stornoway and
Sumburgh. It also offers these services to other airlines at these airports.
Eastern has a ground handling operation at Sumburgh to support its oil-related
charter services. At Inverness ground handling services are offered by Dalcross
Handling and Signature, both independent handling companies.
3.4.7 At Kirkwall and Stornoway, Loganair is the sole provider of handling services
and they are not legally obliged under their license to offer third-party services
to other airlines. So commercially they may refuse to handle a competitor’s
flights which then means that a new entrant would then have to set up their
own handling operation which is a much more costly solution compared to
procuring from an existing third-party provider.
3.4.8 Aircraft hangarage is not an issue as it is most likely that a new entrant would
base aircraft on the mainland where there are fewer restrictions on the
availability of space.
Flybe - Eastern Airways capacity expansion into the Highlands and Islands in
2017
3.4.9 Flybe, to the surprise of many, announced in June 2017, two months into this
project, plans for a significant expansion of services in the Highlands and
Islands. It’s plan is to compete head-to-head with Loganair on several key routes
in the region. Their business model is based on a joint venture agreement with
Eastern Airways. Under this agreement, Flybe purchases aircraft capacity from
Eastern to operate these routes and then sells seats under own brand and flight
17Network business risk and resilience study for Highlands & Islands Airports
codes; in effect this is a Flybe operation. The two existing Eastern Airways
routes from Aberdeen to Wick and Stornoway are outside the scope of this
agreement.
3.4.10 The scale of competitive entry on each route is set out below.
Table 3: Planned Loganair and Flybe supply on selected routes winter 2017/18
Route Flybe Loganair
Weekday Aircraft-type Weekday Aircraft-type
Daily Daily
Frequency Frequency
ABZ-LSI 3 E170 (80 seat) 5 S340 (34-seat)
ABZ-KOI 3 J41 (29-seat) 3 S340 (34-seat)
LSI-GLA 1 E170 jet (80 seat) 2a S340 (34-seat) & S2000 (50 seat)
LSI-EDI 1 E170 jet (80 seat) 3 S340 (34-seat)
SYY-GLA 3 J41 (29-seat) 4 S340 (34-seat) & S2000 (50 seat)
a
second frequency operates on a only a few days of the week
3.4.11 Flybe’s decision to enter the market has challenged conventional wisdom and
our assumptions on the stability and contestability air services markets in the
Highlands and Islands. This is because we assumed prior to June 2017 that
Loganair’s monopoly would continue unimpeded into the medium to long–
term. History has demonstrated that competition tends to be short-lived. New
entrant airlines either exit markets in the short-term or end up coexisting with
incumbents within the network, but operating independently on separate
routes.
3.4.12 The scale of competitive entry is significant in terms of capacity, frequency and
also aircraft–type with Flybe planning to deploy one Aberdeen-based 80-seat
Embraer 170 regional jet on the Sumburgh routes. Two Jetstream 41 (29-seat)
turboprops will operate the other routes involving Kirkwall (Aberdeen-based)
and Stornoway (Glasgow-based).
3.4.13 We expect the Flybe product on the Sumburgh-Aberdeen route to be very
competitive with Loganair offering a range of advantages in terms of speed,
passenger comfort, and probably better poor-weather reliability. The jets will
have lower per seat costs which does provide scope for competitive pricing.
3.4.14 Flybe has no real advantage over Loganair on Aberdeen-Kirkwall as they plan to
offer the same number of weekday rotations. The aircraft used by both
operators is very similar with Loganair’s Saab 340 offering slightly greater
seating capacity than the Jetstream 41s. Furthermore, we have no evidence
which informs us that the Jetstream 41s will be any more reliable than
Loganair’s Saab 340s. It also unlikely that Loganair will offer handling services
for Eastern at Kirkwall which means Eastern will face the additional costs of
setting up their own ground handling operation.
18Network business risk and resilience study for Highlands & Islands Airports
3.4.15 Flybe also plan to operate a daily rotation between Sumburgh and Edinburgh
using the E170’s against Loganair’s 340s. In this case the incumbent may have
an advantage in that they are able to offer three daily rotations and critically
viable day-return itineraries in both directions which is not possible with the
single frequency offered by Flybe.
3.4.16 On Sumburgh-Glasgow, Loganair is less competitive although on some
weekdays they offer two rotations. However, the timings of these flights offer
sufficient limited day-trip itinerary potential unless travellers are inbound from
Glasgow.
3.4.17 Flybe will use an Eastern operated Jetstream 41 based at Glasgow to complete
three daily weekday rotations on the Stornoway route. Loganair offers four
rotations using a combination of 340s and the larger Saab2000 turboprop.
Loganair’s defence maybe more robust here as there is no significant advantage
in the service proposition offered by Flybe in terms of aircraft, frequency or
timetabling. We expect a similar outcome with regard to Flybe’s proposed
Aberdeen-Kirkwall service, which will also utilise a Jetstream 41.
3.4.18 It is unlikely that competition can be sustained in the long –term as load factors
on most of these routes are comparatively modest. The island populations are
relatively small in scale, so we would not expect traffic stimulation effects that
would typically occur in busier markets as a result of competitive new entry.
There will be most likely be a short period of intense price competition and
possibly a new iteration of schedules offered by both airlines. We would expect
the rivalry to subside with the result that both airlines exit some markets.
3.4.19 There have been examples from other UK regional markets of competitive
displacement of incumbent services. A relatively recent example saw Flybe
displace Eastern Airways on services between Inverness and Manchester.
Eastern withdrew its flights as it was unable to match the scale of capacity
offered by Flybe.
3.4.20 An early indication of the impact of Flybe's entry is that Loganair has looked to
re-establish its Scottish emotional credentials. Commercially, it has announced
a new interline agreement and codeshare with British Airways which will be a
positive move for the market as a whole as this will foster easier business travel
and encourage additional visitors to the Highlands from numerous overseas
markets. This is something which Flybe and its partnership with Eastern cannot
hope to match. In addition, Loganair has announced plans to lease Embraer
145 capacity from partner company bmi Regional. Whilst initially planned to
operate on routes from Inverness to Manchester and Dublin, this could be
deployed to resist Flybe in those markets where it has deployed regional jets
19Network business risk and resilience study for Highlands & Islands Airports
(E170).
3.5 Air fares survey
3.5.1 There has been considerable public concern over recent years amongst island
residents at the perceived level of air fares on commercial air services operated
by Loganair between remote airports and the mainland.
3.5.2 Even though Low Cost Carriers (LCC's) are not present in the markets being
studied (Easyjet is a significant operator in Inverness), their high profile means
that they do have a significant role in shaping customer expectations on pricing.
Average air fares on the three major LCC's, including non-seat (ancillary)
revenues are shown below.
Table 4: Average one-way fare (£) and non-ticket revenue (excluding taxes)
Ryanair, EasyJet and Wizz (Source: company accounts)
Airline Average Fare
Easyjet £63.87
Ryanair £50.80
Wizz £60.56
3.5.3 As these are average fares, there are occasions when actual fares are higher or
lower but these figures provide a clear indication of the reality of low fares
provided by the LCC's and which allow them to drive high load factors and
traffic volumes. Most of the Highlands and Islands routes are not high volume
markets but the challenge of delivering low fares and consumer perceptions is
clear.
3.5.4 Data on the actual prices paid by passengers is proprietary to the airlines, so we
have limited information or evidence as to whether there is a particular
problem relating to the magnitude of air fares on commercial routes across the
Highlands and Islands other than evidence that is purely anecdotal. For the
sake of producing a report to within the timeframes demanded, we were also
unable to survey fares during the winter periods. This would have made our
analysis more complete.
3.5.5 In order to establish some indication as to the affordability of air fares in the
region, we designed a sample of mainland return trip itineraries for island
residents on selected routes over the 2017 summer period. The itineraries
cover return travel to and from the mainland including weekday day return,
mid-week over-night stay and weekend travel patterns. We consider itineraries
in two periods during the summer; the first week of June and the first week of
August. The routes and itineraries are set out in Table 5 below.
20Network business risk and resilience study for Highlands & Islands Airports
3.5.6 Fares were recorded on these itineraries up to two months in advance of the
departing outward bound flight to the mainland. The lowest gross return fare
is recorded from three observations taken from the Flybe website each week.
These recordings where obtained on Mondays, Wednesdays and Fridays at
5pm. The last fare recording is taken on the eve of the departing outbound
flight.
Table 5: Selected flight itineraries
From To June/August Itinerary Out Back Out Flight Return Flight
ILY GLA June Day-return Tuesday June 6th Tuesday June 6th 0945 1710
ILY GLA June Over-night stay Wednesday June 7th Thursday June 8th 0945 Cheapest
ILY GLA June Weekend Friday 9th June Sunday June 11th 1825 1555
ILY GLA August Day-return Tuesday August 1st Tuesday August 1st 0945 1710
ILY GLA August Over-night stay Wednesday August 2nd Thursday August 3rd 0945 Cheapest
ILY GLA August Weekend Friday August 4th Sunday August 6th 1825 1555
BEB GLA August Weekend Friday August 4th Sunday August 6th Cheapest after 1140 1230
BEB GLA August Over-night stay Wednesday August 2nd Thursday August 3rd 0840 Cheapest
BEB GLA June Weekend Friday 9th June Sunday June 11th Cheapest after 1140 1230
BEB GLA June Over-night stay Wednesday June 7th Thursday June 8th 0840 Cheapest
SYY INV June Over-night stay Wednesday June 7th Thursday June 8th 0845 Cheapest
SYY INV June Weekend Friday 9th June Sunday June 11th Cheapest after 0845 1400
SYY INV June Day-return Tuesday June 6th Tuesday June 6th 0845 1820
SYY INV August Day-return Tuesday August 1st Tuesday August 1st 0835 1810
SYY INV August Over-night stay Wednesday August 2nd Thursday August 3rd 0835 Cheapest
SYY INV August Weekend Friday August 4th Sunday August 6th Cheapest after 0835 1400
SYY EDI August Weekend Friday August 4th Sunday August 6th 1610 1800
SYY EDI August Over-night stay Wednesday August 2nd Thursday August 3rd 0740 Cheapest
KOI EDI August Weekend Friday August 4th Sunday August 6th 1610 1800
KOI EDI August Over-night stay Wednesday August 2nd Thursday August 3rd 0740 Cheapest
KOI EDI August Day-return Tuesday August 1st Tuesday August 1st 0740 1800
KOI EDI June Day-return Tuesday June 6th Tuesday June 6th 0740 1800
KOI EDI June Over-night stay Wednesday June 7th Thursday June 8th 0740 Cheapest
KOI EDI June Weekend Friday 9th June Sunday June 11th 1610 1800
LSI ABZ June Weekend Friday 9th June Sunday June 11th 1930 1810
LSI ABZ June Over-night stay Wednesday June 7th Thursday June 8th 0740 Cheapest
LSI ABZ June Day-return Tuesday June 6th Tuesday June 6th 0740 1830
LSI ABZ August Day-return Tuesday August 1st Tuesday August 1st 0740 1830
LSI ABZ August Over-night stay Wednesday August 2nd Thursday August 3rd 0740 Cheapest
LSI ABZ August Weekend Friday August 4th Sunday August 6th 1930 1810
3.5.7 For each observation, we record the lowest priced gross return fare. Flybe
offers three fare categories: “All-in”, “Get More” and “Just Fly”. “All-in” is a
business class fare which is fully flexible and includes extra baggage allowance,
executive lounge access and fast track security. “Get more” is a premium
economy product with a built-in flexibility regarding changes to booking, the
opportunity to reserve seating, and the availability of an extra baggage
allowance over and above that offered by the economy product. “Just Fly”
consists mainly of a cheaper but non-refundable ticket price. Different price
levels are set within each fare category.
3.5.8 The “gross fares” include taxes and charges and no ADS discount has been
applied.
3.5.9 As island residents are eligible for the Air Discount Scheme, we calculated an
21Network business risk and resilience study for Highlands & Islands Airports
“ADS fare”, which is the gross fare (excluding taxes and charges) discounted by
a factor of 50%.
3.5.10 We consider the dimension of affordability. So we use an affordability ratio
which is the ADS return fare expressed as a % of the local gross monthly
disposable income (GDI). For each island community, the GDI is as follows:
Orkney (£1,560), Shetland (£1,550), Western Isles (£1,268) and Argyll (£1,344).
3.5.11 We show for each itinerary in June, the lowest, average and highest ADS fare
that was recorded over the period. We are also able to show the average ADS
fare on a per Km basis and as a proportion of gross monthly disposable income3.
The average gross fare is also listed for reference purposes. Indeed, it is worth
noting that business travel is not covered by the ADS scheme.
June 2017 itineraries
3.5.12 Table 6 below provides data on ADS air fares collected for the June 2017
itineraries for each route.
Table 6: Air fares for June 2017 itineraries (Source Flybe website)
3.5.13 Day return itineraries are generally more expensive than the others. The fares
become more expensive the closer to the day of departure.
3.5.14 Fares on Kirkwall-Edinburgh stand out as being particularly expensive relative to
the other routes. We found that the first outbound departure from Kirkwall at
0740 on June 6th was no longer accepting bookings from May 8th. So we
3
We obtain data from Gross monthly disposable income from Financial Scrutiny Unit Briefing
Earnings in Scotland 2015 accessed online
http://www.parliament.scot/ResearchBriefingsAndFactsheets/S4/SB_15-82_Earnings_in_Scotland_2015.pd f
22Network business risk and resilience study for Highlands & Islands Airports
assumed passengers would book the next available departure at 1105 for the
remaining weeks. This flight was full by May 29th. The highest fares were for the
over-night stay itinerary in Edinburgh (June 7th to 8th). The highest Gross Fare
(before ADS) was £471 which was recorded on June 5th for this particular
itinerary.
3.5.15 We also compare average ADS fare per km in Table 6. The highest per km fares
are to be found in the shorter sector (Islay-Glasgow). However some
(Stornoway-Inverness) per km fares were also especially high.
3.5.16 We can also measure affordability of the air fares by representing the fares as a
% of average gross monthly disposable income for each island community. Two
Kirkwall-Edinburgh fares have high ratios. Followed by the day return
Sumburgh-Aberdeen.
3.5.17 Figure 4 shows fare recordings taken through the period of analysis for June 6
day return itineraries on reach route. We notice a significant disparity between
the western and northern routes in both the magnitude of air fares and in the
degree of pricing escalation and volatility. This may be a reflection of different
booking patterns and more active yield management on the northern routes.
Figure 4: June 6 itinerary day return cheapest ADS return fare trends up to 2
months from departure
FULL
FULL
3.5.18 We also express these fares as indices relative to the first fare observation two
months from day of departure. This is shown in Figure 5 below.
23Network business risk and resilience study for Highlands & Islands Airports
Figure 5: June 6 itinerary day return cheapest ADS return fare trends up to 2
months from departure (indices)
FULL
FULL
3.5.19 Figure 6 illustrates fare trajectories for weekend itineraries for across each
route up to two months from the date of departure.
Figure 6: June 9 to June 11 itinerary weekend return cheapest ADS return fare
trends up to 2 months from departure
FULL
3.5.20 The Kirkwall route is again priced at a significant premium above the others.
Yield management is only really exercised one month from departure. Indeed
the final ADS fare on the eve of departure was actually cheaper than that
quoted in April. Pricing trajectories are very similar on the other routes
although the Islay and Stornoway routes appear much cheaper than Sumburgh
and Benbecula routes.
3.5.21 We also express these June weekend fares as indices relative to the first fare
observation two months from day of departure. This is shown in Figure 7.
24Network business risk and resilience study for Highlands & Islands Airports
Figure 7: June 9 to June 11 itinerary weekend return cheapest ADS return fare
trends up to 2 months from departure (indices)
FULL
3.5.22 Figure 8 illustrates fare trajectories for week-day over-night return itineraries
across each route up to two months from the date of departure. The
Sumburgh-Aberdeen week-day over-night return is fully booked by May 21st
and there is a considerable escalation on Benbecula-Glasgow. We also observe
last minute discounting which does happen in revenue management designed
mainly to stimulate passenger loads.
Figure 8: June 7 to June 8 itinerary over-night return cheapest ADS return fare
trends up to 2 months from departure
FULL
We also express these June week-day over-night-fares as indices relative to the
first fare observation two months from day of departure. This is
shown in
3.5.1 Figure 9. Note the final fare is nearly twice as expensive as the base fare on
Benbecula-Glasgow.
25Network business risk and resilience study for Highlands & Islands Airports
Figure 9:
June 7 to June 8 itinerary over-night return cheapest ADS return fare trends up
to 2 months from departure (indices)
FULL
August itineraries
3.5.2 Table 7 below provides data on ADS air fares collected for August 2017
itineraries for each route.
3.5.3 In contrast to June, we do not find the day return to be generally more
expensive than weekend and over-night stay itineraries. However, as one would
naturally expect, fares do become more expensive the closer to the day of
departure.
3.5.4 We do not find that August itineraries are necessarily are more expensive than
June. Like June, the Northern Isles routes are longer distance and more
expensive. For example both weekend travel is more expensive for residents
compared to the other itineraries.
Table 7: Air fares for August 2017 itineraries (Source Flybe website)
26Network business risk and resilience study for Highlands & Islands Airports
3.5.5 We would expect fare per km to decline the longer the sector distance. So the
Islay and Stornoway routes are shorter so generally associated with higher per
Km fares. However, we note that some of the Shetland fares are particularly
expensive in km terms.
3.5.6 Residents are also paying high fares relative to disposable income in the
Northern Isles routes. The affordability ratios for virtually all Northern Isles
itineraries are in excess of 10%.
3.5.7 According to Figure 10, there appear to be different revenue management
approaches between the routes when we observe the August 1st day trip
itineraries (first flight out and last flight back). More active yield management is
apparent in the Northern Isles with sharper escalation of fare levels at a
considerable distance from the day of departure. This possibly reflects more
active booking activity compared to the Western routes where fare escalation is
much more gradual.
3.5.8 We also express these August day-trip fares as indices relative to the first fare
observation two months from day of departure. This is shown in Weekend
itineraries involve a departure to the mainland on the last flight on Friday
August 4th with the return on the last flight back from the mainland on Sunday
August 6th. On the Inverness route there is only one flight on Sunday to
Stornoway.
3.5.9 Fare trajectories in Figure 12 are fairly uniform with a general escalation
approximately three weeks before departure. The escalation is more
pronounced on both northern routes and Benbecula-Glasgow with particular
implications with regard to last minute bookings.
3.5.10 Figure 11
Figure 10: August 1 itinerary day return cheapest ADS return fare trends up to 2
months from departure
FULL
FULL
27Network business risk and resilience study for Highlands & Islands Airports
3.5.11 Weekend itineraries involve a departure to the mainland on the last flight on
Friday August 4th with the return on the last flight back from the mainland on
Sunday August 6th. On the Inverness route there is only one flight on Sunday to
Stornoway.
3.5.12 Fare trajectories in Figure 12 are fairly uniform with a general escalation
approximately three weeks before departure. The escalation is more
pronounced on both northern routes and Benbecula-Glasgow with particular
implications with regard to last minute bookings.
Figure 11: August 2 itinerary day-trip return cheapest ADS return fare trends up
to 2 months from departure (indices)
3.5.13 We also express these August weekend fares as indices relative to the first fare
observation two months from day of departure. This is shown in Figure 13.
Again we observe a more pronounced escalation with regard to Benbecula-
Glasgow. Across the routes we also observe less fare escalation than on
previous itineraries.
Figure 12: August 4 to August 6 itinerary weekend return cheapest ADS return
fare trends up to 2 months from departure
28Network business risk and resilience study for Highlands & Islands Airports
3.5.14 We record over-night trip itineraries with an early departure (first flight) on
August 2nd and the return on August 3rd on the cheapest flight. In Figure 14
below we note particularly active yield management on Kirkwall-Edinburgh and
Benbecula-Glasgow.
3.5.15 We note with interest the fact that both Islay and Stornoway itineraries are full
before the day of departure and that there has been a limited degree of
escalation compared to the other routes. This does suggest a different yield
management approach where the strategy appears to demonstrate that the
airline is prioritising the need to maximise load factor and that these markets
appear not to be able to sustain premium fares in contrast to the others.
3.5.16 We also express these August week-day over-night fares as indices relative to
the first fare observation two months from day of departure.
Figure 13: Figure 12: August 4 to August 6 itinerary weekend return cheapest
ADS return fare trends up to 2 months from departure (indices)
Figure 14: August 2 to August 3 itinerary weekday return cheapest ADS return
fare trends up to 2 months from departure
FULL
FULL
29Network business risk and resilience study for Highlands & Islands Airports
Figure 15: August 2 to August 3 itinerary weekday return cheapest ADS return
fare trends up to 2 months from departure (indices)
200
180
Indexed ADS Offered Fares
160
ILY-GLA
140 SYY-INV
KOI-EDI
120
LSI-ABZ
100 BEB-GLA
80
60
3.6 Historical evolution of flight punctuality
3.6.1 We obtain published data from HIAL on both departures and arrivals
punctuality for each route averaged over each year. We report annual averages
for the period 2012-2016. Punctuality is measured by “on-time performance
which is defined as the percentage of arrivals or departures that were declared
“on-time”. With the term “on-time” defined as a flight arriving or departing
within a range which is between earlier than the scheduled arrival or departure
time and no longer than 15 minutes later than the scheduled arrival or
departure time.
3.6.2 There is no further more detailed information on the causes of delay that are
available to us. The causes can range from adverse weather (beyond the control
of the airline) to technical disruptions (within the control of the airline). It is for
these reasons that one must exercise a degree of caution in interpreting trends
across each route.
3.6.3 According to Table 8, we find that on average, across the network, departures
punctuality is generally lower than arrivals punctuality.
3.6.4 Arrivals punctuality experiences a modest decline from a network-wide average
of 87% in 2012 to 76% in 2015 before recovering to 80% in 2016. For
departures, the contraction between 2012 and 2015 is much more significant,
80% to 65%, before a modest recovery to 69% in 2016.
3.6.5 These trends appear consistent with the widely reported reliability problems
being experienced by Loganair up to 2015. Interestingly, Eastern Airways
improves on-time performance on its two routes over the period 2012 to 2015,
before reporting sharp falls to 68% and 74% for departures and arrivals
respectively.
30You can also read